DOI:10.32604/cmc.2022.026408
| Computers, Materials & Continua DOI:10.32604/cmc.2022.026408 | |
| Article |
A Deep Learning Approach for Prediction of Protein Secondary Structure
1Department of Computer Science, Government College University, Faisalabad, Pakistan
2Department of Computer Science, College of Computer and Information Sciences, Princess Nourah Bint Abdulrahman University, Riyadh 11671, Saudi Arabia
3Department of Software Engineering/Computer Science, Al Ain University, Abu Dhabi, United Arab Emirates
*Corresponding Author: Muhammad Kashif Hanif. Email: mkashifhanif@gcuf.edu.pk
Received: 24 December 2021; Accepted: 20 February 2022
Abstract: The secondary structure of a protein is critical for establishing a link between the protein primary and tertiary structures. For this reason, it is important to design methods for accurate protein secondary structure prediction. Most of the existing computational techniques for protein structural and functional prediction are based on machine learning with shallow frameworks. Different deep learning architectures have already been applied to tackle protein secondary structure prediction problem. In this study, deep learning based models, i.e., convolutional neural network and long short-term memory for protein secondary structure prediction were proposed. The input to proposed models is amino acid sequences which were derived from CulledPDB dataset. Hyperparameter tuning with cross validation was employed to attain best parameters for the proposed models. The proposed models enables effective processing of amino acids and attain approximately 87.05% and 87.47% Q3 accuracy of protein secondary structure prediction for convolutional neural network and long short-term memory models, respectively.
Keywords: Convolutional neural network; machine learning; protein secondary structure; deep learning; long short-term memory; protein secondary structure prediction
Proteins are very complex molecules found in all living organisms. Proteins act as metabolites in chemical reactions, chemical messengers, or hormones in inner contact and transportation pathways such as oxygen delivery in the blood. Proteins are also engaged in the storage absorption of material, creating complicated structures, deoxyribonucleic acid (DNA) replication, reacting to stimuli, providing shape to cells and animals, catalyzing metabolic events, and conveying chemicals and the conservation of systems. Proteins are composed of amino acids, chemical molecules with amine (NH2) and carboxyl (COOH) functional groups. Proteins are polymeric linear chains constituted of amino acids.
To assess protein activity at the molecular and cellular levels, it is necessary to find the arrangement of a specific sequence. Therefore, it has become more critical to predict the proteins structures from their primary sequence in bioinformatics. The three-dimensional structure determines its nature and role in its environment. The three-dimensional structure of a protein can help find the vast range of functions of individual proteins. This is why understanding the protein structure is the first step toward recognizing the function of a newly identified protein [1]. The interactions between protein folding into a complicated three-dimensional form are due to amino acids that, under certain conditions, remain constant [2]. This is one of the most difficult problems in bioinformatics.
The secondary structure may be thought of as an information bridge that connects the primary sequence and the tertiary structure. The primary structure of millions of proteins is well understood. However, the secondary and tertiary structures for the vast majority of proteins remain unclear. Moreover, only a limited fraction of proteins has secondary and tertiary structures. Therefore, protein structure and function study can further enhance nutrition supplements, medications and antibiotics [3].
Furthermore, the analysis of existing proteins will aid in treating diseases and treating various biological problems. The most crucial problems are money, time, and competence to predict Protein Secondary Structure (PSS) from an experimental perspective. Protein structures can be predicted using crystallography and NMR [4], which takes highly specialized knowledge, a high level of talent, and a lot of fortune. One prediction approach is ab-initio prediction [5] which attempts to forecast protein structure solely based on the primary structure and ignores any trends. Chothla and Levitt published the first Protein Secondary Structure Prediction (PSSP) technique in 1976.
ML algorithms, Bayesian statistics, nearest neighbor and established sequence-to-structure experimentation are all examples of approaches that can be used to explore and forecast biological patterns. Accelerated evolution of proteomics and genomics technologies for sequencing of protein and DNA have culminated in an immense increase of proteins sequence data. Determining protein structure entails a series of computational activities, with secondary structure prediction being a crucial first step [6]. Various sorts of factors, including geometrical, physicochemical, and topological factors, can be used to determine PSS. Finding protein secondary and tertiary structures from their chain sequence is challenging.
Protein structure prediction technologies have been divided into three generations [7]. The first generation emerged before the 1980s. The accuracy of these methods was below 60%. Chou-Fasman's method is one of these methods. The second generation appeared between 1980 and 1992. These approaches might increase prediction accuracy to some amount. However, the total accuracy was under 65%. After 1992, the third generation of techniques developed, which usually employed multiple sequence alignment files to input an advanced Machine Learning (ML) model to predict PSS. PHD and PSIPRED were the typical techniques and the total accuracy of this generation was approximately between 76% to 80% [8].
Many ML approaches have been developed to forecast secondary structure and demonstrated good progress through evolutionary awareness and statistical information on amino acid subsequences. This study employed deep learning-based Convolutional Neural Network (CNN) and Long Short-Term Memory (LSTM) models to predict PSS. Stratified k fold cross-validation and hyperparameter tuning were used to obtain the best parameters for these models. Then, these models were retrained using optimized parameters to attain better performance.
The rest of the paper is divided into various sections. Section 2 discusses the background of proteins and Deep Learning (DL). Related works are presented in Section 3. The datasets and the methodology are described in Section 4. Section 5 evaluates the performance of the proposed techniques. Finally, Section 6 concludes this study.
Protein functionality is determined by the amino acids that make up the protein. This depends on how these molecules fold across space, assemble and work. Protein functionality can help researchers better understand why people age, why they get sick from harmful viral diseases (like cancer), how to find a cure for a disease (like the cure for covid-19) and other ‘tough’ questions. The roles of proteins are linked to their composition, which is influenced by physicochemical parameters. Determining a protein's native structure in solution is the same as figuring out how the protein can fold. The protein folding issue has produced a great deal of knowledge about the processes that govern how this process occurs, which physical and chemical interactions have the most significant impact, and how the amino acid sequence of a protein stores details about its structure [9]. In general, proteins fold rapidly to their native state, while environmental factors such as extreme temperatures or pH can prevent or reverse this process (protein denaturing). Furthermore, specific proteins use chaperones to prevent premature misfolding or unwanted aggregation during synthesis [10]. Secondary structures fold to form temporary local conformations maintained by the evolving tertiary structure [11].
The PSSP problem needs to be addressed since the PSS can help predict the tertiary structure that contains details about a protein's functions. There exist millions of proteins. However, only a limited percentage of recognized proteins have been studied because the experimental techniques for determining the tertiary structure of proteins are expensive. For this reason, PSSP can be used to identify a protein's tertiary structure with greater precision and less effort.
Proteins are composed of amino acids, which are the crucial building components. An amino acid is a molecule that consists of a carbon atom with the primary amino group (NH2), a carboxylic acid group (COOH), a side chain (R group), and an H atom linked to it. The essential components of an amino acid are carbon (C), hydrogen (H), oxygen (O), and nitrogen (N). On the other hand, other components can be found in the side chains of specific amino acids (Fig. 1). Each amino acid can be expressed by one of three characters from the English alphabet. A sequence of characters can be used to describe a specific amino acid. No matter how minor, any modification in this series will result in a different protein with distinct properties and functions [12].
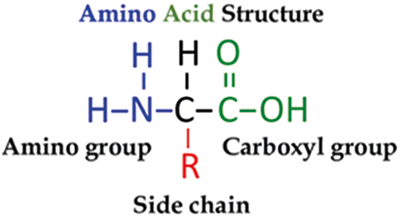
Figure 1: Amino acid structure [12]
Amino acids can be categorized based on the location of the significant structural groups (i.e., alpha (α), beta (β), gamma (γ), and delta (δ)), pH level and side-chain group type [13]. In addition to neurotransmitter transport and biosynthesis, amino acids are involved in several other processes. Peptides are short chains of amino acids (30 or fewer) joined by peptide bonds, whereas polypeptides are long, continuous, and unbranched peptide chains. Proteins are made up of one or more polypeptides [14].
A hierarchical methodology can be used to analyze the composition of proteins and study their various shapes more accurately [15]. The protein structures are classified into four categories, i.e., primary, secondary, tertiary, and quaternary. The primary structure is commonly a generalized form of amino acids arranged within the unfolded protein. A protein's sequence determines its structure and function, which is unique to that protein. For example, Insulin is made up of 51 amino acids in two peptide chains, i.e., A chain has 21 amino acids and B chain has 30 amino acids [16].
The local conformation of a polypeptide backbone is known as the secondary structure of proteins. The secondary structure is characterized by patterns of hydrogen bonds between the main chain peptide groups and refers to the local folding of the polypeptide in certain areas. The secondary structure is divided into the α-helix and the β-strand or β-sheets categories [17]. The three-dimensional structure of monomeric and multimeric protein molecules is called the tertiary structure of proteins. Ionic bonding, hydrophobic interactions, hydrogen bonding, and disulfide linkages are among the chemical interactions that define the structure of a polypeptide chain. Interactions between R groups give the protein its complex three-dimensional tertiary structures. The quaternary structure of a protein is a three-dimensional structure made up of two or more individual polypeptide chains that work together as a single functional unit. Insulin, for example, is a globular protein with a mixture of hydrogen and disulfide bonds that allow it to clump into a ball shape.
DL is a subfield of ML that employs a layered framework to learn representations. Each layer of the layered architecture operates with more meaningful and sophisticated representations. The term ‘deep’ in DL refers to a number of successive levels of expression present in a model. Each layer can operate on the output generated by the previous layer. Thus, each layer operates by detecting the pattern over the last layer's output. This makes the corresponding layer work with more complex, advanced, and significant pattern recognition than the previous layers. This makes DL models perfect for dealing with complicated data. There are several various types of DL models. Each of these models is optimal for different types of data and computational problems. For example, CNN's are good for image processing, whereas Recurrent Neural Networks (RNNs) are good for natural processing language. DL approaches have been widely used in various areas, including bioinformatics [18–22]. DL techniques have been applied to perform sequence analysis [20], structure prediction and reconstruction [21], as well as biomolecular property and functionality prediction [22].
The development of DL techniques revealed the elegant applications of ML for many application domains. DL techniques are being used to study protein sequence, structures, and functions. This section presents the work related to existing applications of DL techniques in protein analysis and existing computational approaches for predicting protein structure and functional characteristics. Yang et al. (2013) introduced a new approach employing a large margin nearest neighbor method (Tab. 1) for the PSSP problem. Experimental results revealed that the proposed approach achieved greater prediction accuracy than previous nearest neighbor models. For RS126 and CB513 datasets, Q3 accuracy is 75.09% and 75.44%, respectively [23]. Feng et al. (2014) used increasing diversity blended with a quadratic discriminant approach to predict the composition of core residues. For 20 amino acid residues, the precision of predicted secondary structures varies from 81% to 88% [24].
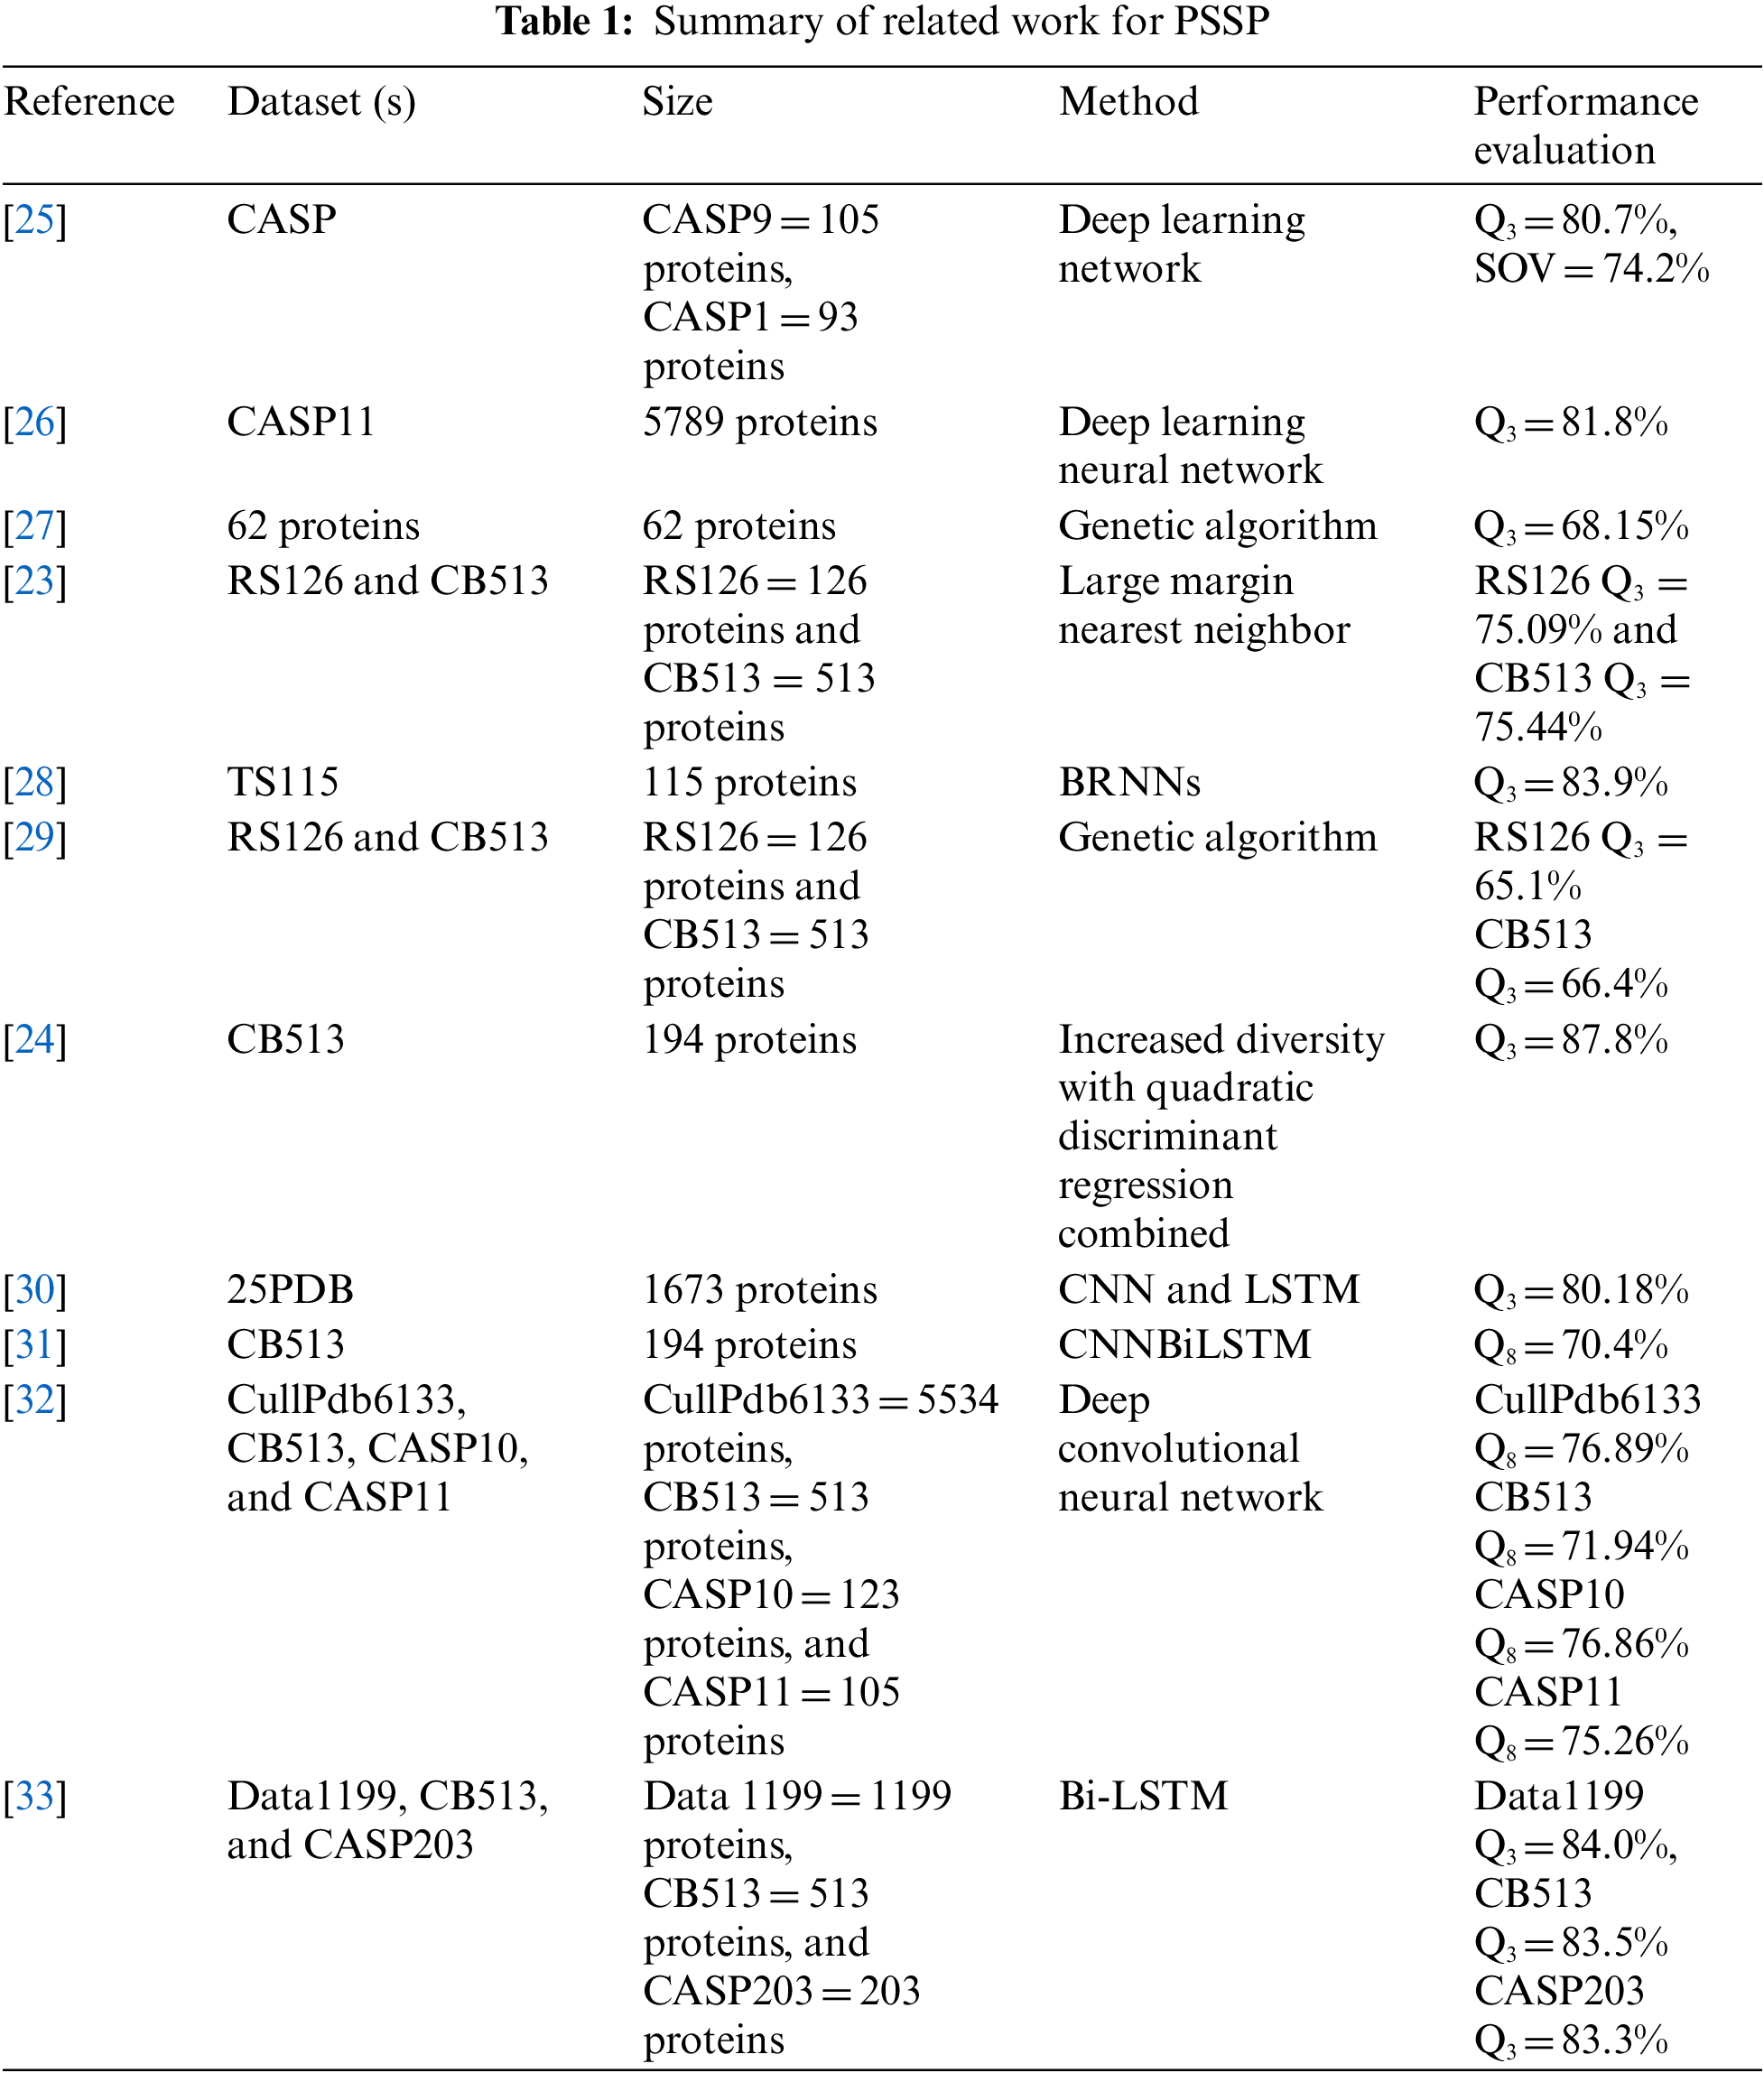
Spencer et al. (2015) have created a PSS predictor called DNSS that uses the position-specific score matrix produced by DL network architectures and PSI-BLAST. This methodology was based on a DL network and used to forecast secondary structure for a completely autonomous research dataset for 198 proteins with a Q3 accuracy of 80.7% [25]. Heffernan et al. (2015) used DL architecture in three loops. As a result, they attained 82% accuracy for a dataset consisting of 1199 proteins [26].
Nguyen et al. (2015) introduced a system called MOIT2FLS for PSSP using the quantization method of adaptive vectors for each type of secondary structure to create an equivalent number of simple rules. The genetic algorithm was used to change the MOIT2FLS parameters optimally [27]. Experimental findings indicate that the proposed solution dominates the conventional approaches of artificial neural network models, Chou-Fasman method and Garnier-Osguthorpe-Robson method. Zamani et al. (2015) presented a PSS classification algorithm using genetic programming using IF regulations for a multi-target classification task. The experiments were done on two datasets, RS126 and CB513, to attain Q3 accuracy of 65.1% and 66.4%, respectively [29].
Heffernan et al. (2017) proposed Bidirectional Recurrent Neural Networks (BRNNs). The proposed model was capable of recording long-range experiences without using a window. The Q3 accuracy of 83.9% was achieved for TS115 [28]. Asgari et al. (2019) developed a software “DeepPrime2Sec” using DL method CNN-BiLSTM network to predict PSS from primary structure. The expected structure was identical to the target structure even though the PSS's exact nature could not be predicted. For eight classes of PSS, approximately 70.4% accuracy was obtained for the CB513 dataset using ensemble top-k models [31]. Li et al. (2019) built an ensemble model based on Bi-LSTM for PSSP. The proposed model was tested using three separate datasets, i.e., CB513, data1199, and CASP203 proteins. Ensemble model achieved 84.3% Q3 accuracy and 81.9% SOV score using 10-fold cross-validation [33].
Cheng et al. (2020) proposed a method based on LSTM and CNN. Cross-validation tests were conducted on a dataset of 25pdb and achieved 80.18% accuracy, which was better than using a single model [30]. Ratul et al. (2020) implemented a deep neural network model called PS8-Net to increase the accuracy of eight-class PSSP. For the CullPdb6133, CASP11, CASP10 and CB513 datasets, the proposed PS8-Net achieved 76.89%, 71.94%, 76.86% and 75.26% Q8 accuracy, respectively [32].
PSSP depends on protein data, access to protein databanks, and secondary structure information for known sequences. Proteins and their structures are being found slowly but steadily through exclusion chromatography, mass spectroscopy and nuclear resonance spectroscopy [34]. Fig. 2 shows the proposed methodology. This section describes the datasets used, data preprocessing techniques, and the proposed deep learning models.
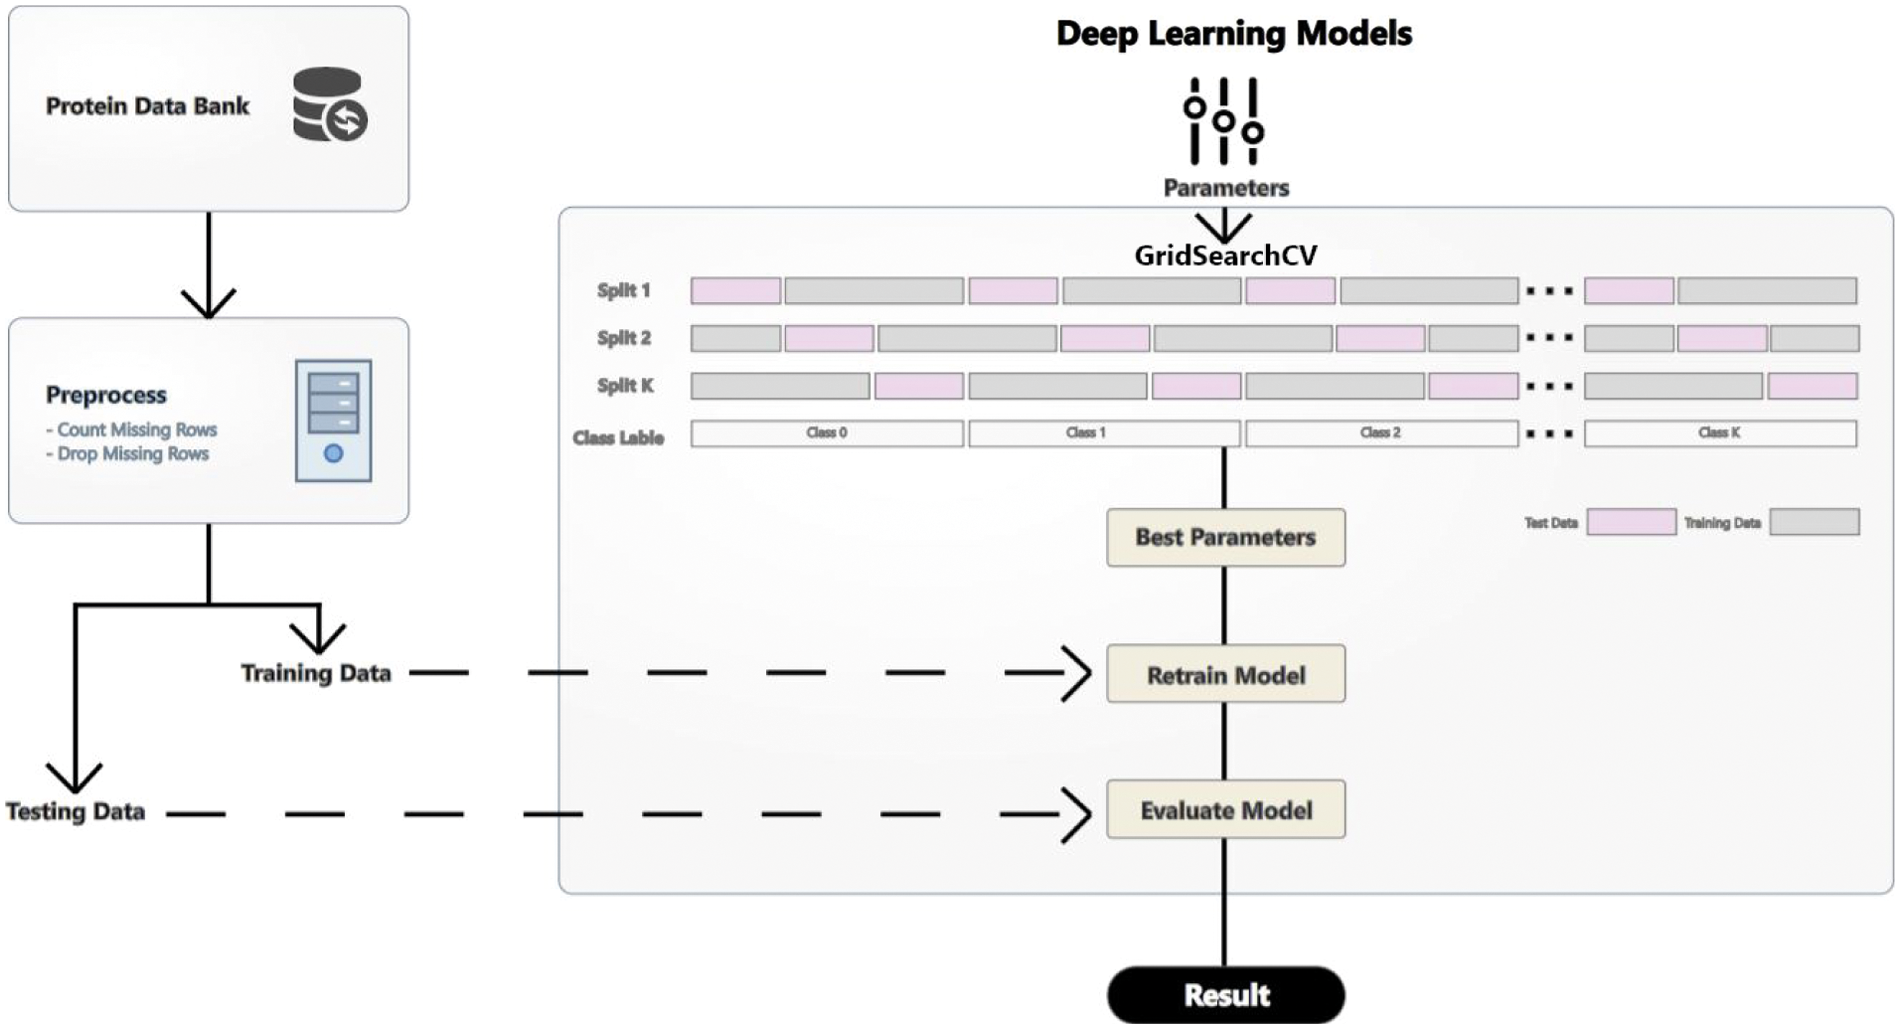
Figure 2: Proposed methodology
Proteins are discovered and inserted into protein databanks such as the RCSB Protein Data Bank (PDB). This data contains protein names, lengths, structures (primary, secondary, tertiary and quaternary), and other biological facts. In this study, the CulledPDB dataset from the PISCES server is used. PISCES [35] is a public server that selects protein sequences from the PDB based on sequence identity and structural quality criteria. PISCES can give lists chosen from the complete PDB or user-supplied lists of PDB entries or chains. PISCES produces much better lists than BLAST servers, which cannot recognize many associations with less than 40% sequence identity and frequently overstate sequence identity by matching only well-conserved fragments [35]. CulledPDB datasets on the PISCES service offer the most comprehensive list of high-resolution structures that meet the sequence identity and structural quality cut-offs. After downloading PISCES, we removed peptides with high similarity. The dataset has
• pdb_id: the id that was used to find its entry
• chain code: The chain code is required to find a specific peptide (chain) in a protein that contains numerous peptides (chains).
• seq: the peptide's sequence of amino acids
• sst8: Eight state (Q8) secondary structure
• sst3: Three state (Q3) secondary structure
• len: the number of amino acids in the peptide
• hasnonstdaa: whether there are any non-standard amino acids in the peptide (i.e., B, O, U, X, or Z).
The dataset is in text/categorical form. Many ML methods cannot perform well if data is in text/categorical form. The proposed models need data in numerical form. Therefore, data preprocessing techniques were applied to deal with missing values, noise in data, standardization of data, textual data, and categorical variables. There are several methods to convert categorical variables to numerical numbers. Many ML algorithms cannot work with categorical variables effectively. The categories must be numerically transformed. Neural network are used in DL to predict numerical input values. Each method has its own set of trade-offs and effects on the feature set. In this study, the one-hot encoding technique is used. This encoder is part of the SciKit-learn toolkit (a popular Python library) and transforms text or categorical data into numerical data. Single hot encoding for the outcome variable might result in a more complex set of estimations when a single label is used. This work deals with the data in text form and needs to be changed in numerical form. Protein sequences are converted from text to numerical data using one-hot encoding. For example, ELVDNAVGGDL, LVDNAVG-GDLS, VDNAVGGDLSK, VETRTIVRFNR, and RIFIIIVGSLI are samples of some structures from the dataset used in this research (Fig. 3). These structures are taken from the PDB website and have all the information. These are the samples of some protein structures used in the dataset. The raw dataset has 393733 structures of proteins. Each protein has its unique id. For example, Figs. 3a and 3b have id 1GMC and 2F9N, respectively.
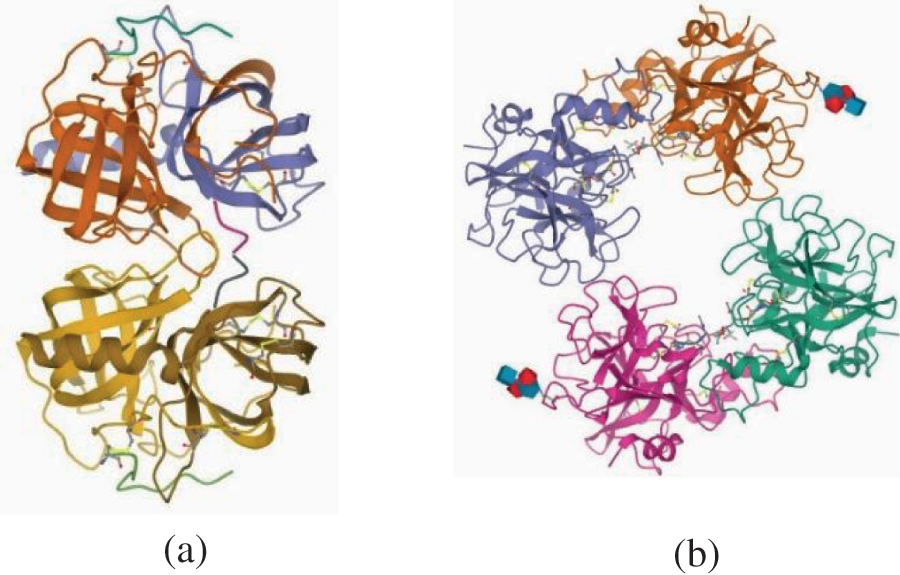
Figure 3: Sample protein crystal structure (a) 1GMC1 (b)2F9N2
Tokenization is defined as separating a large amount of text into smaller chunks known as tokens. These pieces or tokens are precious for finding patterns. Tokenization also allows for the replacement of sensitive data components with non-sensitive ones. Tokenization can be performed for either individual words or entire phrases. Stop words in the text add no sense to the phrase. Removing stop words will not influence text processing for the specified goal. They are deleted from the lexicon to minimize noise and the size of the feature set. In this study, input_grams is a list containing windows of variable length for each sequence. Each window is a ‘word’ and is encoded as an integer using a dictionary. Each list of window encoded integers is padded with 0 s until it becomes 128 integers long.
For example, the sequence KCK will have three frames: KCK, CK and K. In this case, preferred_amino_acid_chunk_size is 3. Those frames are then converted into integers and added to a list for the sequence added to input_data. The target_data contains the one-hot encoded secondary structure with an additional integer for no structure used when there is no sequence in the padding. The target_data for sequence KCK could thus possibly be [[0. 1. 0. 0.], [0. 0. 0. 1.], [0. 1. 0. 0.], [1. 0. 0. 0.]
This study employed CNN and LSTM deep learning models for the PSSP problem. These models were trained on the preprocessed dataset to attain better performance. To evaluate the performance for each parameter combination, cross-validation was used. The training and validation dataset is used to find accuracy for each parameter setting for each split in the cross-validation. Stratified k fold cross-validation with hyperparameter tuning is used to find the best parameters [36,37]. The proposed models were retrained using these best parameters. We considered batch size, a number of the epoch, and activation function at each layer. The best parameters values attained using hyperparameter tuning for epochs, batch_size, and optimizer attained are 20, 128, and Adam, respectively. Furthermore, dimensionality reduction techniques were employed [38].
The proposed CNN model for PSSP is shown in Fig. 4. The input to the model is protein images. First, dictionary integer input is converted to floats by the embedding layer. This layer creates a filter (also known as a feature detector). The neural network can learn features depending on filters. We have employed 128 filters and 40 x 128 neuron matrix is the output of the first layer. The weights of one single filter are stored in each column of the output matrix. Each filter will have 40 weights if the kernel size is defined and the input matrix length is considered. Next, a dropout layer is used to prevent over-fitting (deactivates 30% of input neurons). The dropout layer assigns zero weights to the network's neurons at random. In this study, we set a rate of 0.3 which means less than half of the neurons will have no weight. The network becomes less sensitive to tiny fluctuations in the data due to this process. It should improve the accuracy of previously unknown data. The output of this layer is a 40 x 64 neuron matrix. Then, another convolutional layer is added that now has 64 filters. Next, another dropout layer is added that deactivates 30% of input neurons. The final convolution layer reduces output to four classes and has a softmax activation function (Fig. 4).
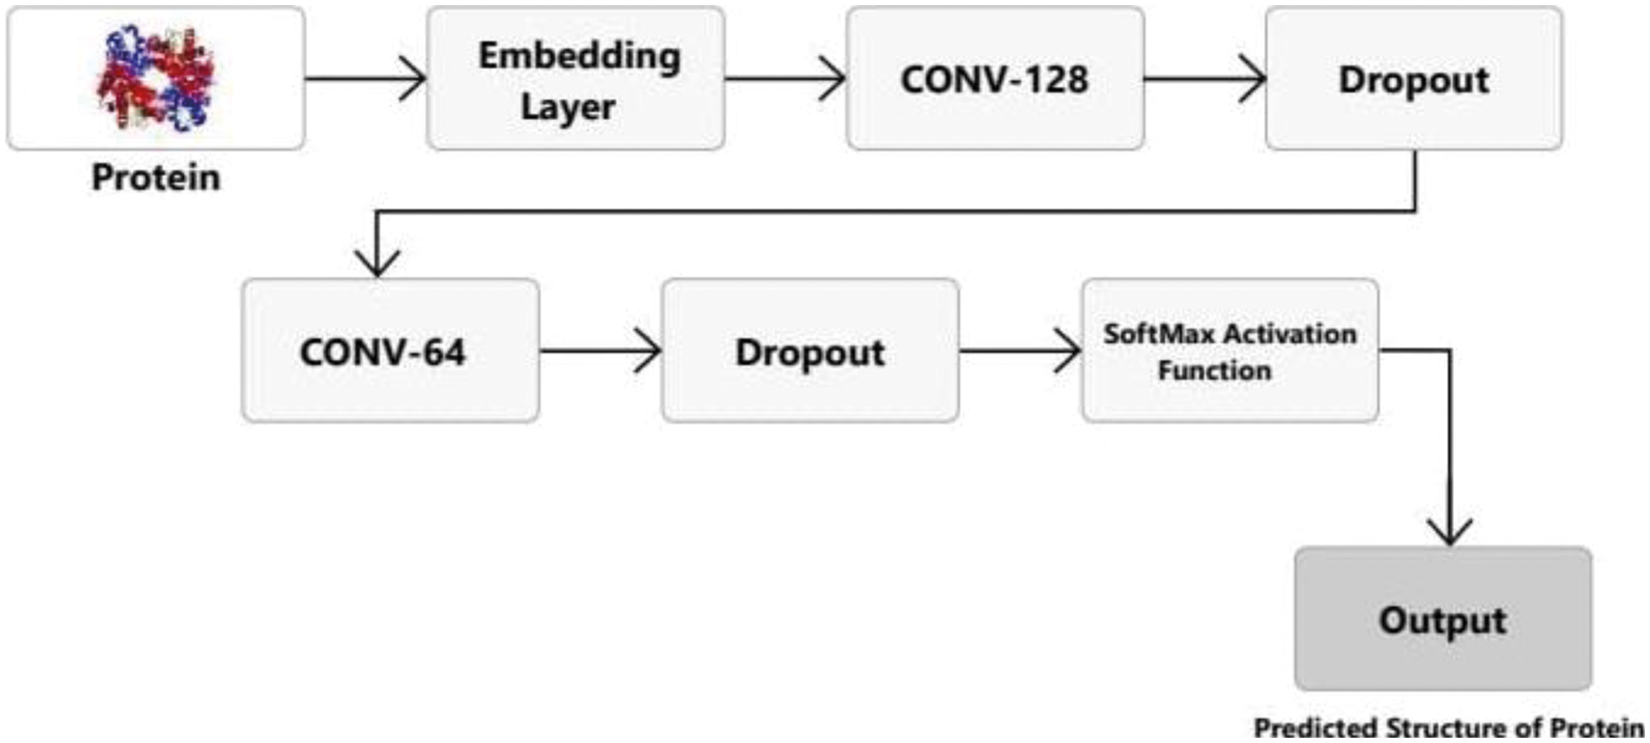
Figure 4: Proposed CNN model layers for PSSP
Next, the LSTM model was employed for PSSP (Fig. 5). The embedding layer converts data sequences into float values. A bidirectional LSTM (BiLSTM) layer is used to learn long-term bidirectional relationships between time steps of time series or sequence data. These dependencies may be helpful when the network learns from the whole time series at each time step. This model added a bidirectional layer that will pass on information from the past and future states to the output.
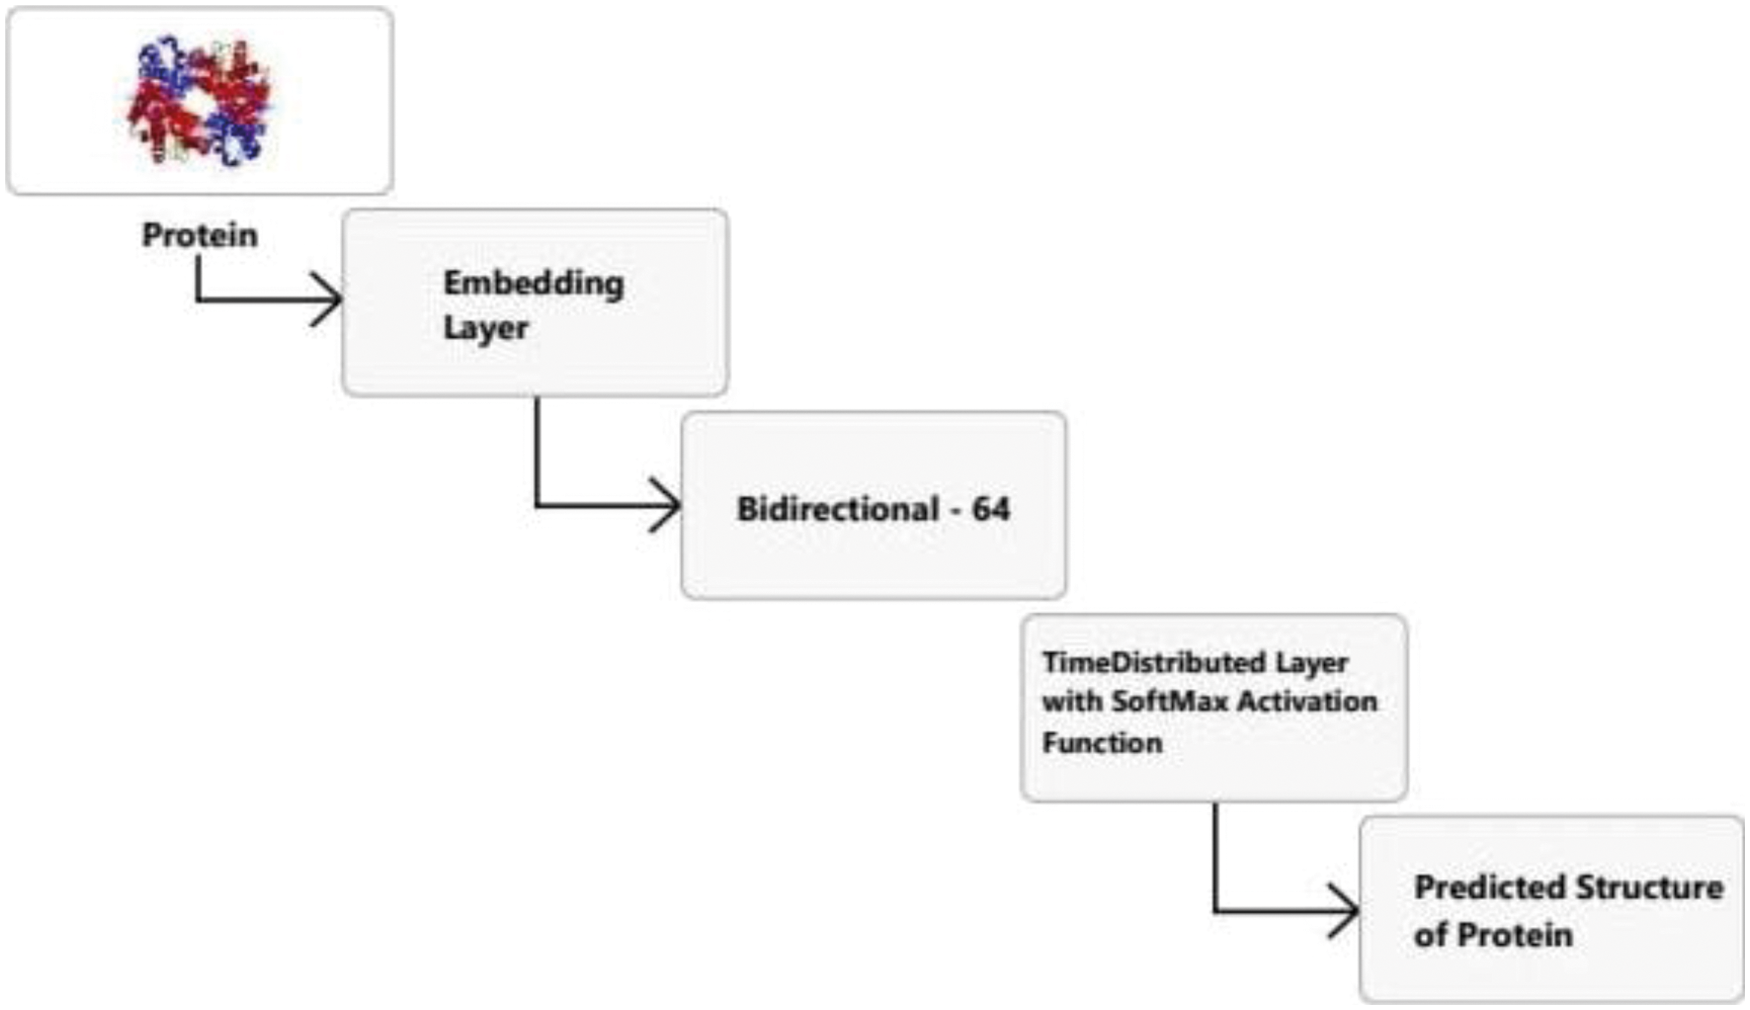
Figure 5: Proposed LSTM model for PSSP
Moreover, the time distribution layer is added that will apply the dense layer to every neuron and thus make the output “n_tags.” The time distribution layer does not affect how layers work. Instead, the goal is to create a second “time” dimension (which may or may not represent time). With this temporal dimension in mind, the wrapped layer is applied to each slice of the input tensor.
The attempt to solve the PSSP problem was significant since the experimental methods that are currently available are extremely expensive in both money and time. PSSP focuses on predicting structures as correctly as feasible based on their basic structure. The Q3 metric is frequently employed for PSSP to determine the effectiveness of the trained models. The Q3 accuracy is the percent of correctly predicted protein secondary structure using three states and is calculated by dividing the number of adequately categorized amino acids by the total amount of amino acids. In this study, per residue Q3 accuracy metric is used to evaluate the performance of the proposed models.
This research aimed to design and implement CNN and LSTM models that can predict the PSSP from its primary structure. The dataset used in this research was a combination of PDB and PISCES. The dataset was split into training and testing test data. 40% of sequences are selected for testing and 60% for training the model. Fig. 6 shows sample training and testing data. The proposed model is trained on protein to check how accurately the model reads proteins structures like helix, sheet, and loop. The portion which the model can not predict is labeled as unknown.
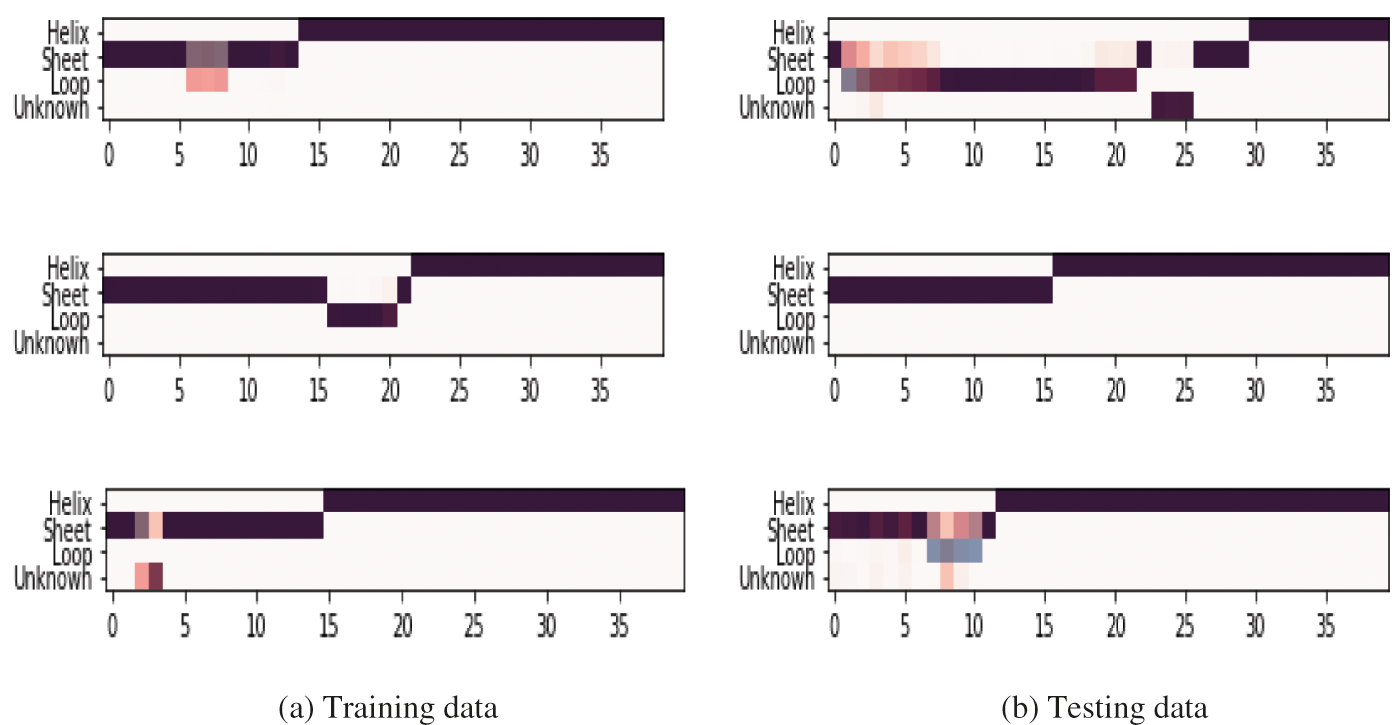
Figure 6: Sample dataset used for training and testing
The proposed models were trained and tested on the prepared dataset. This dataset lists chains of proteins in rows. The chains are identified by a chain code and the underlying protein id within the protein database. In addition to pdb id and chain codes, the dataset also has the sequence of amino acids and the secondary structures (3 and 8 states) for a given chain. The categorical cross-entropy is reduced by training the model. The Q3 accuracy is obtained by computing the accuracy exclusively for coding characters. Cross validation was employed to address overfitting and underfitting issues. The loss function is one of the most important aspects of neural networks. The term “loss” refers to a prediction error made by a neural network. The loss function determines the gradients. Gradients are also used to update the neural network weights. Maximum Q3 accuracy obtained using CNN and LSTM is 87.05% and 87.47%, respectively.
Fig. 7 shows the CNN training and testing accuracy. Maximum accuracy for CNN's training and validation is approximately 97.50% and 93.23%, respectively. The training and validation accuracy of LSTM is 97.61% and 93.44%, respectively (Fig. 8). Testing accuracy is less than training accuracy for CNN and LSTM. The reason is model was trained using training data. However, testing data is a collection of data which is new to the model. The accuracy of both models is approximately 90% which shows model performs well on dataset. This is due to choosing best parameters obtained using hyperparameter tuning and cross validation. The results demonstrate that features derived from CNN and LSTM models can significantly enhance the accuracy of PSSP.
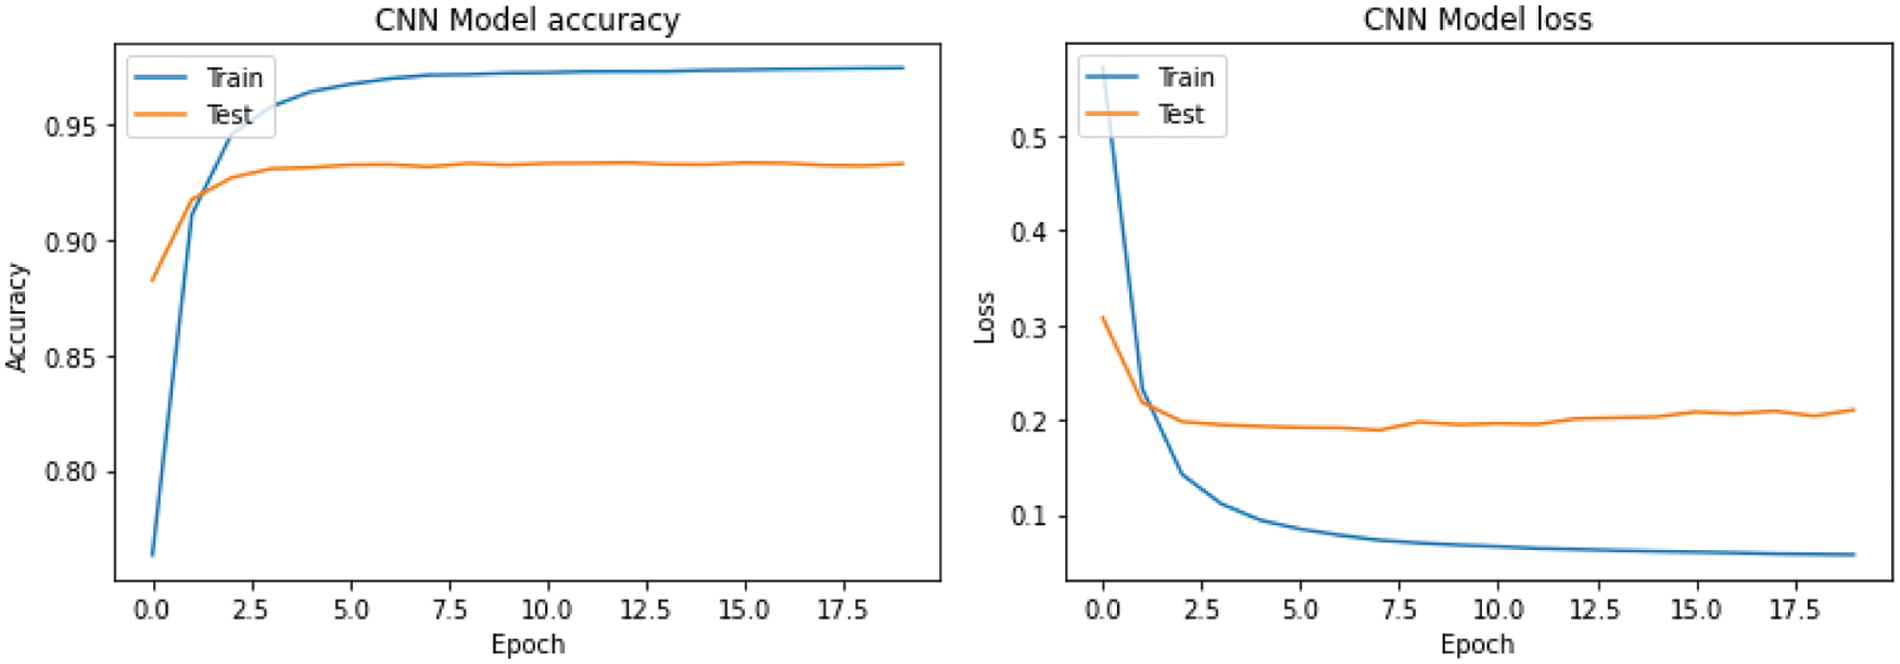
Figure 7: Performance of the proposed CNN model
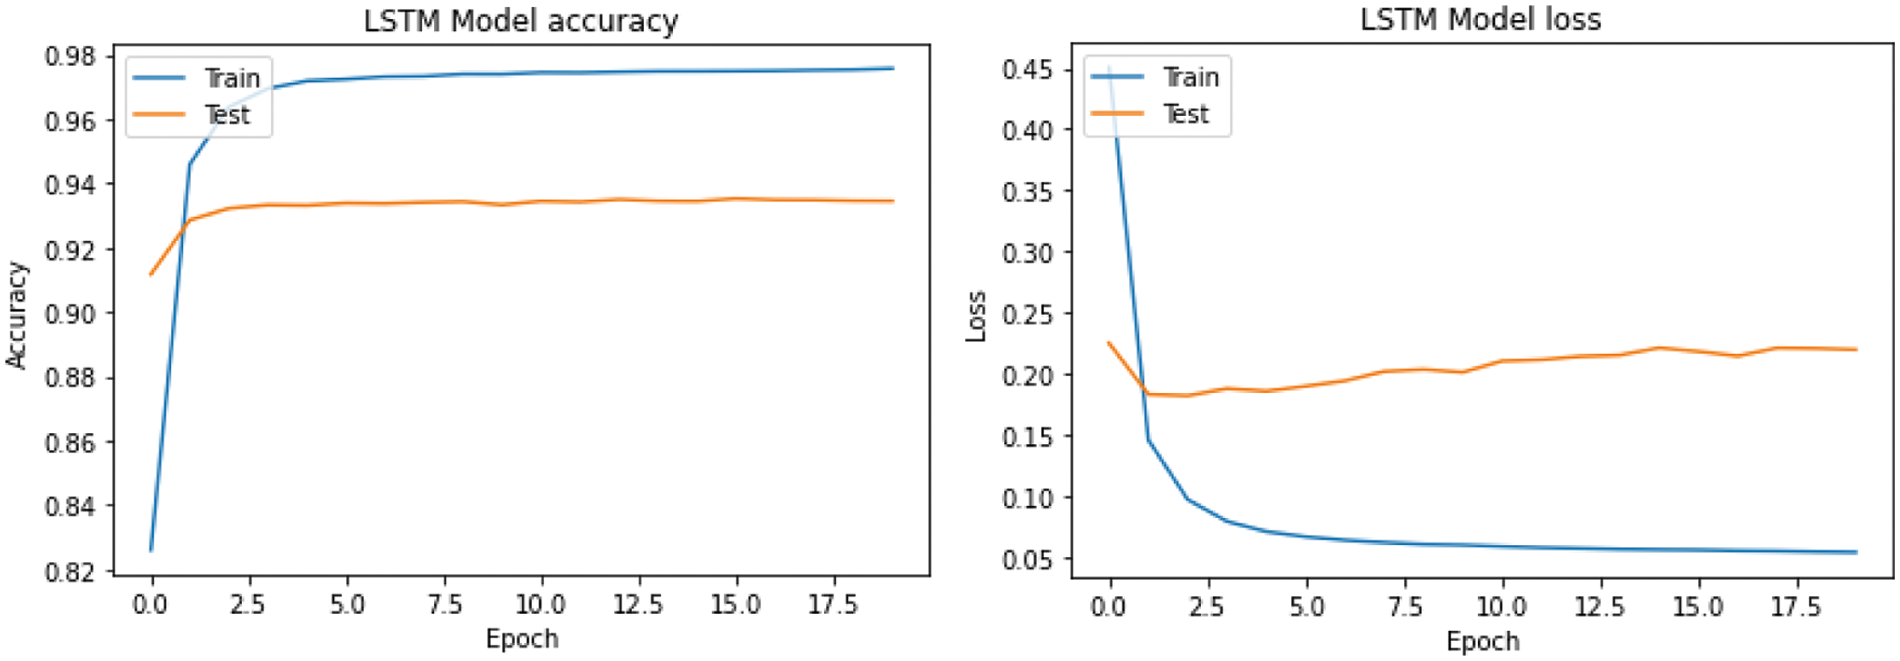
Figure 8: Performance of the proposed LSTM model
PSS provides important characteristics for predicting protein tertiary structure. However, PSSP prediction techniques used in laboratories are expensive and time consuming. In this work, CNN and LSTM models were proposed to predict PSS from the amino acid sequences. The input to proposed models was amino acids which were obtained from the CulledPDB dataset. Moreover, this study employed cross-validation with hyperparameter tuning to enhance the performance of the proposed models. Experimental results showed proposed CNN and LSTM models achieved 87.05% and 87.47% Q3 accuracy, respectively. Despite the goodness and validity of proposed methods, current methods cannot deal with highly long dependencies. In future work, we will apply the attention mechanism to the study of low-frequency long-range interactions of PSSP.
1https://www.rcsb.org/structure/1GMC
2https://www.rcsb.org/structure/2F9N
Funding Statement: Princess Nourah bint Abdulrahman University Researchers Supporting Project number (PNURSP2022R161), Princes Nourah bint Abdulrahman University, Riyadh, Saudi Arabia.
Conflicts of Interest: The authors declare that they have no conflicts of interest to report regarding the present study.
1. K. A. Dill and J. L. MacCallum, “The protein-folding problem, 50 years on,” Science, vol. 338, pp. 1042–1046, 2012. [Google Scholar]
2. Y. Yang, J. Gao, J. Wang, R. Heffernan, J. Hanson et al., “Sixty-five years of the long march in protein secondary structure prediction: The final stretch?,” Briefings in Bioinformatics, vol. 19, pp. 482–494, 2018. [Google Scholar]
3. D. Thirumalai, Z. Liu, E. P. O'Brien and G. Reddy, “Protein folding: From theory to practice,” Current Opinion in Structural Biology, vol. 23, pp. 22–29, 2013. [Google Scholar]
4. Y. Tang, Y. J. Huang, T. A. Hopf, C. Sander, D. S. Marks et al., “Protein structure determination by combining sparse NMR data with evolutionary couplings,” Nature Methods, vol. 12, pp. 751–754, 2015. [Google Scholar]
5. P. -S. Huang, S. E. Boyken and D. Baker, “The coming of age of de novo protein design,” Nature, vol. 537, pp. 320–327, 2016. [Google Scholar]
6. S. K. Sønderby and O. Winther, “Protein secondary structure prediction with long short term memory networks,” ArXiv Preprint ArXiv:1412.7828, 2014. [Google Scholar]
7. P. D. Yoo, B. B. Zhou and A. Y. Zomaya, “Machine learning techniques for protein secondary structure prediction: An overview and evaluation,” Current Bioinformatics, vol. 3, pp. 74–86, 2008. [Google Scholar]
8. G. -Z. Zhang, D. -S. Huang, Y. P. Zhu and Y. -X. Li, “Improving protein secondary structure prediction by using the residue conformational classes,” Pattern Recognition Letters, vol. 26, pp. 2346–2352, 2005. [Google Scholar]
9. S. Wang, J. Peng, J. Ma and J. Xu, “Protein secondary structure prediction using deep convolutional neural fields,” Scientific Reports, vol. 6, pp. 1–11, 2016. [Google Scholar]
10. J. P. Hendrick and F. -U. Hartl, “The role of molecular chaperones in protein folding,” The FASEB Journal, vol. 9, pp. 1559–1569, 1995. [Google Scholar]
11. S. B. Ozkan, G. A. Wu, J. D. Chodera and K. A. Dill, “Protein folding by zipping and assembly,” Proceedings of the National Academy of Sciences, vol. 104, pp. 11987–11992, 2007. [Google Scholar]
12. R. Truman, “Searching for needles in a haystack,” Journal of Creation, vol. 20, pp. 90–99, 2006. [Google Scholar]
13. I. Wagner and H. Musso, “New naturally occurring amino acids,” Angewandte Chemie International Edition in English, vol. 22, pp. 816–828, 1983. [Google Scholar]
14. A. Shilova, “Development of serial protein crystallography with synchrotron radiation,” Ph.D. dissertation, The Université Grenoble Alpes, France, 2016. [Google Scholar]
15. M. A. Haque, Y. P. Timilsena and B. Adhikari, “Food proteins, structure, and function,” in Reference Module in Food Science, Amsterdam, The Netherlands: Elsevier, pp. 1–8, 2016. [Google Scholar]
16. L. J. Slieker, G. S. Brooke, R. D. DiMarchi, D. B. Flora, L. K. Green et al., “Modifications in the B10 and B26–30 regions of the B chain of human insulin alter affinity for the human IGF-I receptor more than for the insulin receptor,” Diabetologia, vol. 40, pp. S54–S61, 1997. [Google Scholar]
17. F. Asmelash, “Techniques and applications of proteomics in plant ecophysiology,” Biochemistry and Biotechnology Research, vol. 4, pp. 1–16, 2016. [Google Scholar]
18. A. Krizhevsky, I. Sutskever and G. E. Hinton, “Imagenet classification with deep convolutional neural networks,” Advances in Neural Information Processing Systems, vol. 25, pp. 1097–1105, 2012. [Google Scholar]
19. Y. Li, C. Huang, L. Ding, Z. Li, Y. Pan et al., “Deep learning in bioinformatics: Introduction, application, and perspective in the big data era,” Methods, vol. 166, pp. 4–21, 2019. [Google Scholar]
20. R. Umarov, H. Kuwahara, Y. Li, X. Gao and V. Solovyev, “Promoter analysis and prediction in the human genome using sequence-based deep learning models,” Bioinformatics, vol. 35, pp. 2730–2737, 2019. [Google Scholar]
21. X. Chen, Y. Li, R. Umarov, X. Gao and L. Song, “RNA secondary structure prediction by learning unrolled algorithms,” ArXiv Preprint ArXiv:2002.05810, 2020. [Google Scholar]
22. Y. Li, S. Wang, R. Umarov, B. Xie, M. Fan et al., “DEEPre: Sequence-based enzyme EC number prediction by deep learning,” Bioinformatics, vol. 34, pp. 760–769, 2018. [Google Scholar]
23. W. Yang, K. Wang and W. Zuo, “Prediction of protein secondary structure using large margin nearest neighbour classification,” International Journal of Bioinformatics Research and Applications, vol. 9, pp. 207–219, 2013. [Google Scholar]
24. Y. Feng and L. Luo, “Using long-range contact number information for protein secondary structure prediction,” International Journal of Biomathematics, vol. 7, pp. 1450052, 2014. [Google Scholar]
25. M. Spencer, J. Eickholt and J. Cheng, “A deep learning network approach to ab initio protein secondary structure prediction,” IEEE/ACM Transactions on Computational Biology and Bioinformatics, vol. 12, pp. 103–112, 2014. [Google Scholar]
26. R. Heffernan, K. Paliwal, J. Lyons, A. Dehzangi, A. Sharma et al., “Improving prediction of secondary structure, local backbone angles and solvent accessible surface area of proteins by iterative deep learning,” Scientific Reports, vol. 5, pp. 1–11, 2015. [Google Scholar]
27. T. Nguyen, A. Khosravi, D. Creighton and S. Nahavandi, “Multi-output interval type-2 fuzzy logic system for protein secondary structure prediction,” International Journal of Uncertainty, Fuzziness and Knowledge-Based Systems, vol. 23, pp. 735–760, 2015. [Google Scholar]
28. R. Heffernan, Y. Yang, K. Paliwal and Y. Zhou, “Capturing non-local interactions by long short-term memory bidirectional recurrent neural networks for improving prediction of protein secondary structure, backbone angles, contact numbers and solvent accessibility,” Bioinformatics, vol. 33, pp. 2842–2849, 2017. [Google Scholar]
29. M. Zamani and S. C. Kremer, “Protein secondary structure prediction using an evolutionary computation method and clustering,” in Proc. IEEE Conf. on Computational Intelligence in Bioinformatics and Computational Biology (CIBCB), Niagara Falls, ON, Canada, pp. 1–6, 2015. [Google Scholar]
30. J. Cheng, Y. Liu and Y. Ma, “Protein secondary structure prediction based on integration of CNN and LSTM model,” Journal of Visual Communication and Image Representation, vol. 71, pp. 102844, 2020. [Google Scholar]
31. E. Asgari, N. Poerner, A. C. McHardy and M. R. K. Mofrad, “Deepprime2sec: Deep learning for protein secondary structure prediction from the primary sequences,” BioRxiv, pp. 705426, 2019. [Google Scholar]
32. M. Aminur Rab Ratul, M. Tavakol Elahi, M. Hamed Mozaffari and W. Lee, “PS8-Net: A deep convolutional neural network to predict the eight-state protein secondary structure,” in Proc. Digital Image Computing: Techniques and Applications (DICTA), pp. 1–3, 2020. [Google Scholar]
33. H. Hu, Z. Li, A. Elofsson and S. Xie, “A bi-LSTM based ensemble algorithm for prediction of protein secondary structure,” Applied Sciences, vol. 9, pp. 3538, 2019. [Google Scholar]
34. F. J. Moy, K. Haraki, D. Mobilio, G. Walker, R. Powers et al., “MS/NMR: A structure-based approach for discovering protein ligands and for drug design by coupling size exclusion chromatography, mass spectrometry, and nuclear magnetic resonance spectroscopy,” Analytical Chemistry, Melbourne, Australia, vol. 73, pp. 571–581, 2001. [Google Scholar]
35. G. Wang and R. L. Dunbrack Jr, “PISCES: A protein sequence culling server,” Bioinformatics, vol. 19, pp. 1589–1591, 2003. [Google Scholar]
36. A. C. Müller and S. Guido, Introduction to Machine Learning with Python: A Guide for Data Scientists, Sebastopol, CA, USA: O'Reilly Media, Inc., 2016. [Google Scholar]
37. M. K. Hanif, N. Ashraf, M. U. Sarwar, D. M. Adinew and R. Yaqoob, “Employing machine learning-based predictive analytical approaches to classify autism spectrum disorder types,” Complexity, 2022. [Google Scholar]
38. S. Ayesha, M. K. Hanif, and R. Talib, “Performance enhancement of predictive analytics for health informatics using dimensionality reduction techniques and fusion frameworks,” IEEE Access, vol. 10, pp. 753–769, 2021. [Google Scholar]
 | This work is licensed under a Creative Commons Attribution 4.0 International License, which permits unrestricted use, distribution, and reproduction in any medium, provided the original work is properly cited. |