DOI:10.32604/cmc.2022.026515
| Computers, Materials & Continua DOI:10.32604/cmc.2022.026515 | |
| Article |
Cognitive Computing-Based Mammographic Image Classification on an Internet of Medical
1Department of Mathematics, Faculty of Science, New Valley University, El-Kharga, 72511, Egypt
2Department of Computer Science, College of Computers and Information Technology, Taif University, Taif, 21944, Saudi Arabia
*Corresponding Author: Romany F. Mansour. Email: romanyf@sci.nvu.edu.eg
Received: 29 December 2021; Accepted: 02 March 2022
Abstract: Recently, the Internet of Medical Things (IoMT) has become a research hotspot due to its various applicability in medical field. However, the data analysis and management in IoMT remain challenging owing to the existence of a massive number of devices linked to the server environment, generating a massive quantity of healthcare data. In such cases, cognitive computing can be employed that uses many intelligent technologies–machine learning (ML), deep learning (DL), artificial intelligence (AI), natural language processing (NLP) and others–to comprehend data expansively. Furthermore, breast cancer (BC) has been found to be a major cause of mortality among ladies globally. Earlier detection and classification of BC using digital mammograms can decrease the mortality rate. This paper presents a novel deep learning-enabled multi-objective mayfly optimization algorithm (DL-MOMFO) for BC diagnosis and classification in the IoMT environment. The goal of this paper is to integrate deep learning (DL) and cognitive computing-based techniques for e-healthcare applications as a part of IoMT technology to detect and classify BC. The proposed DL-MOMFO algorithm involved Adaptive Weighted Mean Filter (AWMF)-based noise removal and contrast-limited adaptive histogram equalisation (CLAHE)-based contrast improvement techniques to improve the quality of the digital mammograms. In addition, a U-Net architecture-based segmentation method was utilised to detect diseased regions in the mammograms. Moreover, a SqueezeNet-based feature extraction and a fuzzy support vector machine (FSVM) classifier were used in the presented technique. To enhance the diagnostic performance of the presented method, the MOMFO algorithm was used to effectively tune the parameters of the SqueezeNet and FSVM techniques. The DL-MOMFO technique was tested on the MIAS database, and the experimental outcomes revealed that the DL-MOMFO technique outperformed existing techniques.
Keywords: Cognitive computing; breast cancer; digital mammograms; image processing; internet of medical things; smart healthcare
With the increasing medical device and diagnostic development, the costs of drugs, the healthcare industry, the demand for more personalised medicines, and the pressure to lower procedural and prescription costs have received attention. The Internet of Medical Things (IoMT) comprises wearable devices, medical devices, apps and sensors, which interconnect to healthcare data systems, harnessing the technologies that consumers previously have available for them to change the manner they keep patient connected, safe and healthy [1]. IoMT is collected to change how patients are being kept healthy and safe, particularly as demand for solutions to reduce healthcare costs increases in the upcoming years [2]. IoMT could assist in monitoring, helping, notifying and informing caregivers; however, it provides healthcare providers with real data for identifying the problems beforehand they turn into a crucial or to permit for previous development. However, it is a major problem for processing and analysing the medical big data poised by the IoMT due to its unstructured and complex features, such as variety, volume, value, velocity, strong relevance, sequence, closed loop and accuracy.
Furthermore, the medical big data processing technique is facing major transformation in every stage comprising data cleaning, collecting, interpreting, organizing, utilizing, visualization and analytics [3]. Recently, cognitive computing as a technology-based solution has gained huge interest from both practitioners and researchers. This method utilizes multiple intelligent techniques, such as NLP, ML, DL, image recognition and AI, for understanding data completely. This technique could be directed at enhancing performance in creating smart healthcare [4]. However, latest developments in IoMT, AI, big data, cognitive computational theory and fog computing show that multidisciplinary cognitive-inspired computing still encounters long-standing, essential challenges, such as decision-making mechanisms and computational models, depending on the neurobiological procedures of the psychology, brain and cognitive sciences [5]. To address this problem, cognitive computing and integration might attain a sophisticated innovation based on low cost, seamless interoperability, low latency, increased efficiency and high speed for smart healthcare development.
Breast cancer (BC) is the most general and critical disease that highly affects women worldwide, according to the American Institute for Cancer Research. BC cells abnormally increase in BC tissues and slowly enhance the infected cell rate, creating BC. BC is a malignant tumour evolving from breast cell. The collection of splitting cells creates a mass/lump of extra tissues that are known tumours, and it could be noncancerous (benign)/cancerous (malignant). Commonly, computer vision-and image processing-based methods have been utilised in cancer screening for the past 30 years. Regarding this, methods like diagnoses of Magnetic Resonance Imaging (MRI), Mammograms (X-rays), Thermography and Ultrasound (sonography) are commonly utilised for diagnosing and detecting BC [6]. Human errors could be the reason for improper diagnosis or might delay accurate diagnosis, which could finally induce death. For handling this condition, the Computer-Aided Diagnosis (CAD) technique has been widely employed for minimising the false negative rates and increasing the true positive rate of BC [7]. Various scientists have explored the classification and detection of BC cells and projected distinct automatic solutions that depend on AI-based ML methods, such as Vector Quantisation, ANN, SVM, NB, RF, DT, etc., [8]. In a remote condition, where there is an absence of cancer specialists/medical expert, the service given through IoMT could be utilised by offering data through cytology images via mobile devices to e-Health care expert schemes for detecting and classifying cancer cells.
This paper presents a novel deep learning-enabled multi-objective mayfly optimization algorithm (DL-MOMFO) for BC diagnosis and classification in the IoMT environment. The proposed DL-MOMFO algorithm involves pre-processing in two levels: Adaptive Weighted Mean Filter (AWMF)-based noise removal and contrast-limited adaptive histogram equalisation (CLAHE)-based contrast enhancement. Besides, a U-Net architecture-based segmentation method is used for recognising diseased regions in the mammograms. Furthermore, a SqueezeNet-based feature extraction and a fuzzy support vector machine (FSVM) classifier are also used in the proposed model. The design of the MOMFO algorithm for parameter optimization of SqueezeNet and FSVM models shows the novelty of the work. For ensuring the improved diagnostic results of the proposed model, an extensive set of simulations is performed on a benchmark MIAS database. In short, the paper's contributions can be listed as follows.
• Proposes a new DL-MOMFO technique for BC diagnosis in the IoMT environment.
• Employs pre-processing in two stages: AWMF-based noise removal and CLAHE-based contrast enhancement.
• Proposes a U-Net architecture-based segmentation for detecting affected regions in digital mammograms.
• Design a SqueezeNet-based feature extractor and FSVM-based classification model for BC diagnosis.
• Presents a MOMFO technique for parameter tuning of the SqueezeNet and FSVM models for improving diagnostic performance.
• Validate the performance of the proposed model on a benchmark mammogram dataset and inspect the results regarding different evaluation metrics.
The rest of the paper is planned as follows. The existing BC classification techniques are surveyed in Section 2. Then, Section 3 introduces the proposed model, and Section 4 offers the performance validation. Finally, Section 5 draws a conclusion.
2 Prior BC Diagnosis Models in a Smart Healthcare Environment
This section briefly overviews existing BC diagnosis models. Khan et al. [9] projected an architecture that integrates computational intelligence and ML-based methods in e-Health care services as an application of the IoMT technique for the earlier classification and detection of malignant cells in BC. Memon et al. [10] presented an ML-based diagnosis scheme that efficiently categorises benign and malignant persons in the IoT platform. In the evolution of this presented scheme, an ML classifier SVM was utilized to classify benign and malignant persons. For enhancing the classification efficiency of the classification scheme, they utilised a recursive FS method for selecting better features from the BC dataset. The testing or training split technique was employed to train and test the classifier for an optimal prediction method.
Sadad et al. [11] discovered BD manually using mammogram images based on IoMT-supported devices. The two pre-trained DCNN methods, ResNet50 and DenseNet201, have been employed using a TL technique. The overall 322 mammogram images with 104 glandular, 106 fatties and 112 dense cases were obtained from the Mammogram Image Analyses Society dataset. Mathapati et al. [12] presented a smart IoMT-based BC diagnosis and detection using a DL method. IoMT-based image acquisition procedure occurs for gathering digital mammogram images. The existing LBP-DNN method can efficiently classify and detect BC from mammogram images. Turabieh et al. [13] presented a D-ANFIS method for imputing the lost values simply and precisely. The main involvement is to assign the lost value(s) when attained by separating the gathered data into 2 classes: 1) incomplete dataset (with lost data) and (2) complete dataset (without lost data). Zheng et al. [14] exploited the CNN-based TL for characterising breast masses for distinct prognostic, diagnostic and predictive tasks in various imaging models, such as MRI, US, digital breast mammography and tomosynthesis. The DL architecture has many convolution layers, including Max pooling and LSTM layers. The error estimation and classification have been involved in softmax and FC layers. The study emphasises integrating these ML methods with the method of choosing features and removing them by calculating their output via segmentation and classification methods to find the most suitable method.
Gopal et al. [15] suggested an approach for conducting earlier diagnoses of BC through the IoT and ML. The primary aim of the study was to examine ML techniques in forecasting BC using IoT devices. Zhang et al. [16] offered a DL architecture that integrates a method of essential processing of LDA and AE NN for classifying distinct features within the profile of gene expression. Henceforth, an innovative ensemble classifier is established based on the DL method for assessing the medical outcomes of BC. Moreover, several independent BC representations and datasets of the signature gene, comprising the key technique, were calculated for the optimization variables.
Fig. 1 demonstrates the overall process of DL-MOMFO technique. In this study, a new cognitive computing-enabled BC diagnosis model is developed in an IoMT environment for smart healthcare applications. The proposed DL-MOMFO algorithm involves different subprocesses, such as pre-processing, U-Net-based segmentation, SqueezeNet-based feature extraction, FSVM-based classification and MOMFO-based parameter optimisation. The detailed work of each module is offered neatly in the succeeding subsections.
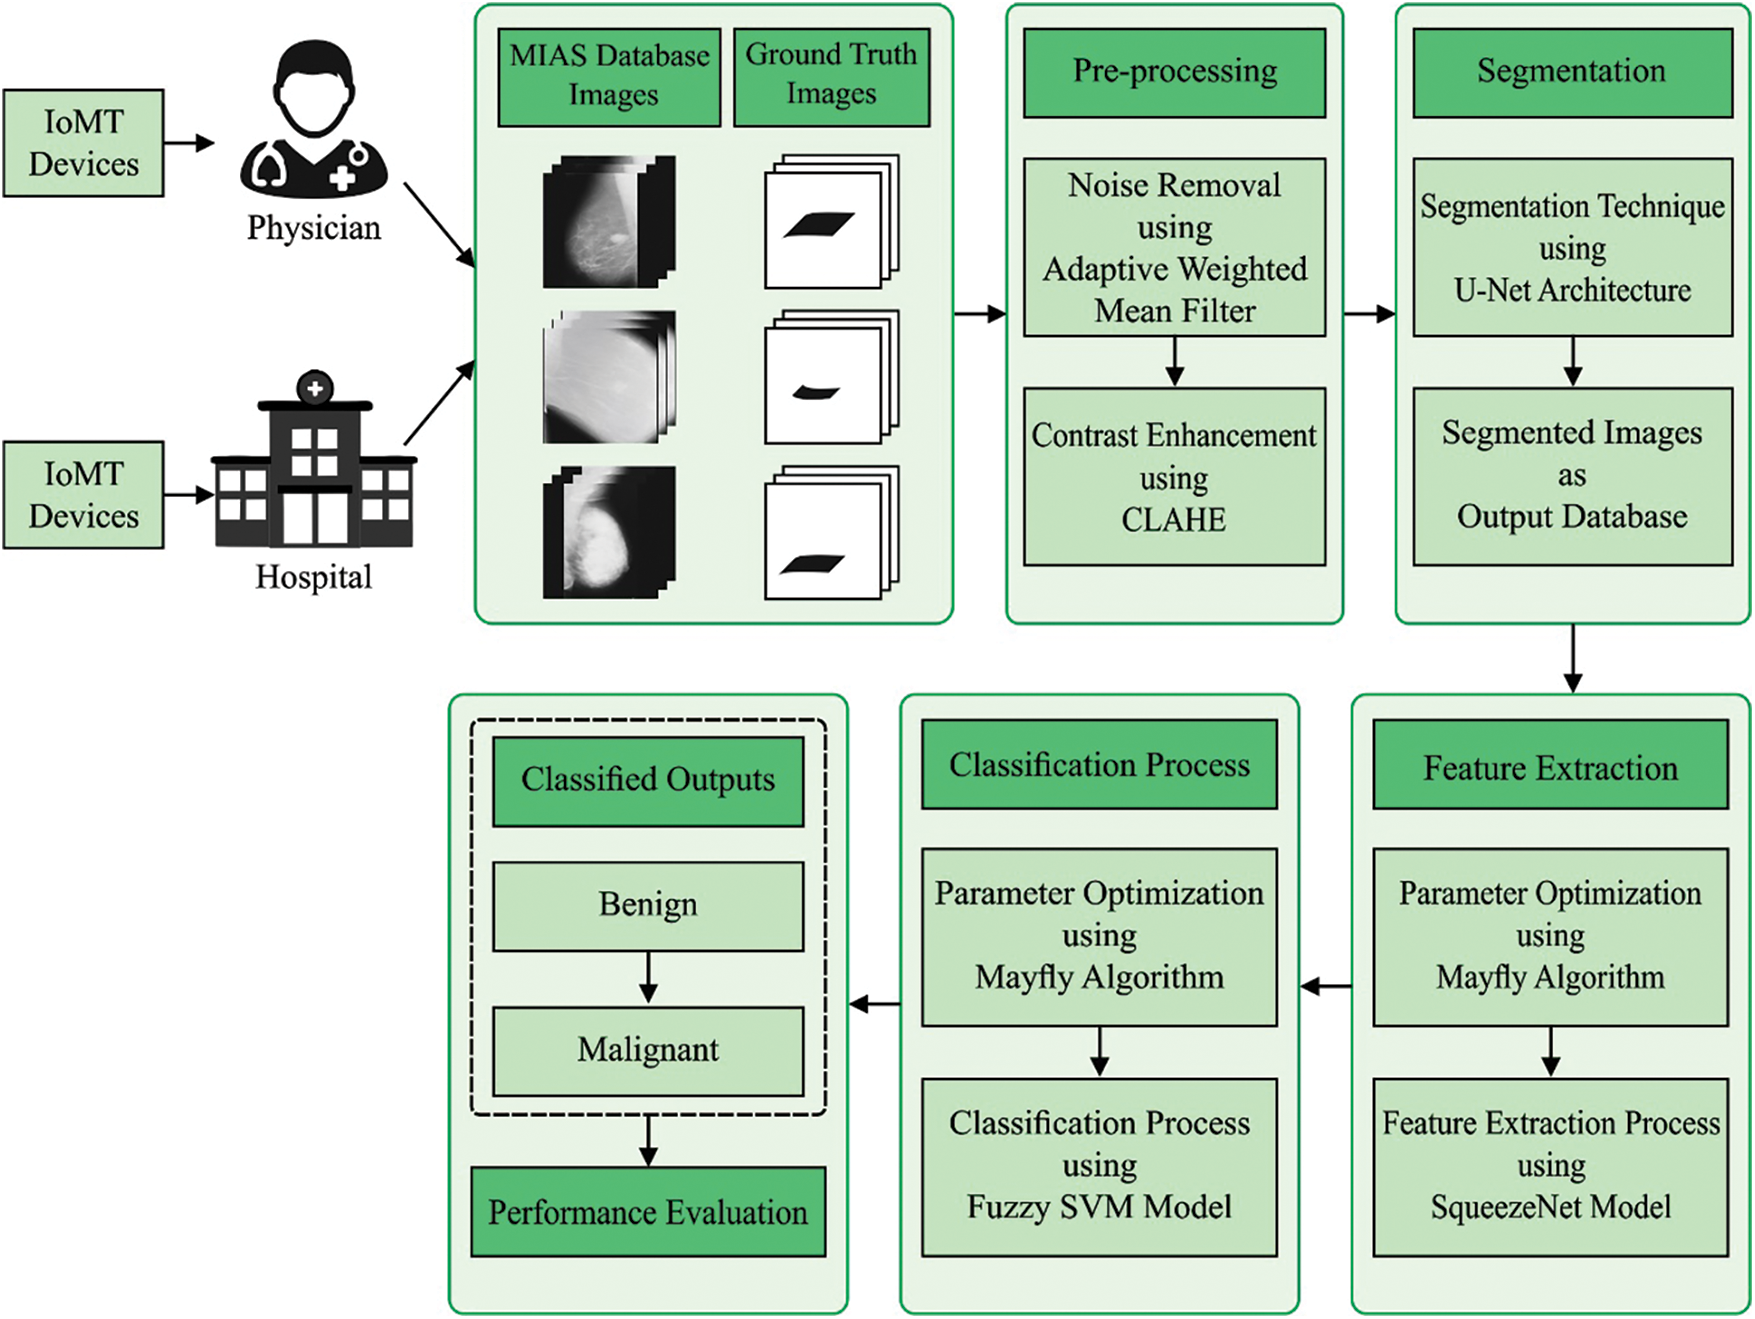
Figure 1: Overall process of DL-MOMFO model
As the presented framework follows a healthcare scheme, this scheme utilises specific processes, such as processing the data, sensing of data, delivering the data and analysing the data. The sensors should be aware of all environmental and medical situations. This can be attained by applying cheap, tiny intrusion smart home sensors using BAN in a home environment. By integrating this sensor, a complete level of real-world home monitoring is feasible, thus attaining effective and reliable healthcare decisions and quality of life for independent living. Each wireless sensor is deliberated as a node in a WSN; that is, it interacts with another node in the network, is competent in gathering sensory data and works on the sensory data. When placing, the layout of the home environment and the detection of ideal sensor location require deliberation. Such ideal sensor positions could select a broad range of radios being placed, such as sensitivity of sensors and MiWi. A wireless sensor includes a micro controller, possesses computation abilities of the environment; a radio transceiver, possesses lower power wireless communication; a sensor board, possesses hardware interface to the external sensor; and a power layer, possesses power via capacitors and batteries.
Primarily, the AWMF technique involves a noise removal process to enhance the image quality. In the classic MF technique, the window size is predefined. However, the AWMF utilises variable windows [17]. In AWMF, window sizes differ based on minimal and maximal pixel values in the window. When the centre pixel values in the window are equivalent to minimal/maximal values, afterwards, centre pixels are returned with the average weighted value of elected windows. When the centre pixel values are not equivalent to minimal/maximal values, the intensity value is unaffected. In this technique, the original image with
A noise level in the image is determined as
In this study, a pipeline of deeply supervised two-dimensional U-Nets is presented to obtain optimal segmentation accuracy. The encoding network contains six layers of convolutional operation using sixty-four kernels of size 3 x 3. Then, it is succeeded by the max pooling and ReLU operations using a stride factor of two. The encoding part has 1024 feature maps, while the number of feature channels is 512 in the decoding part [18]. The encoding part feature map is connected by the decoding feature part maps to get a segmented image detail. The combined feature map is again convoluted with the ReLU activation function and 3 * 3 kernel. This procedure continued until the amount of encoding part filter matches the amount of decoding filter feature map. In the final layer, 3*3 convolutional by softmax function is utilised.
3.4 SqueezeNet-Based Feature Extraction
Next to the segmentation process, the segmented outcome is fed into the SqueezeNet model to generate a set of feature vectors. SqueezeNet is an alternative CNN that was trained by the ImageNet database [19]. Fig. 2 illustrates the structure of SqueezeNet. It trained over one million images and fifty times fewer variables compared to AlexNet. The substance of this network is a fire component that contains expanded and squeeze layers. The squeeze layer contains 1 × 1 filters fed to an expanded layer containing a combination of 1 × 1 and 3 × 3 convolutional filters [20]. They utilised the SqueezeNet pre-trained module for detecting and classifying BC. Fig. 3 shows the process flow of SqueezeNet.
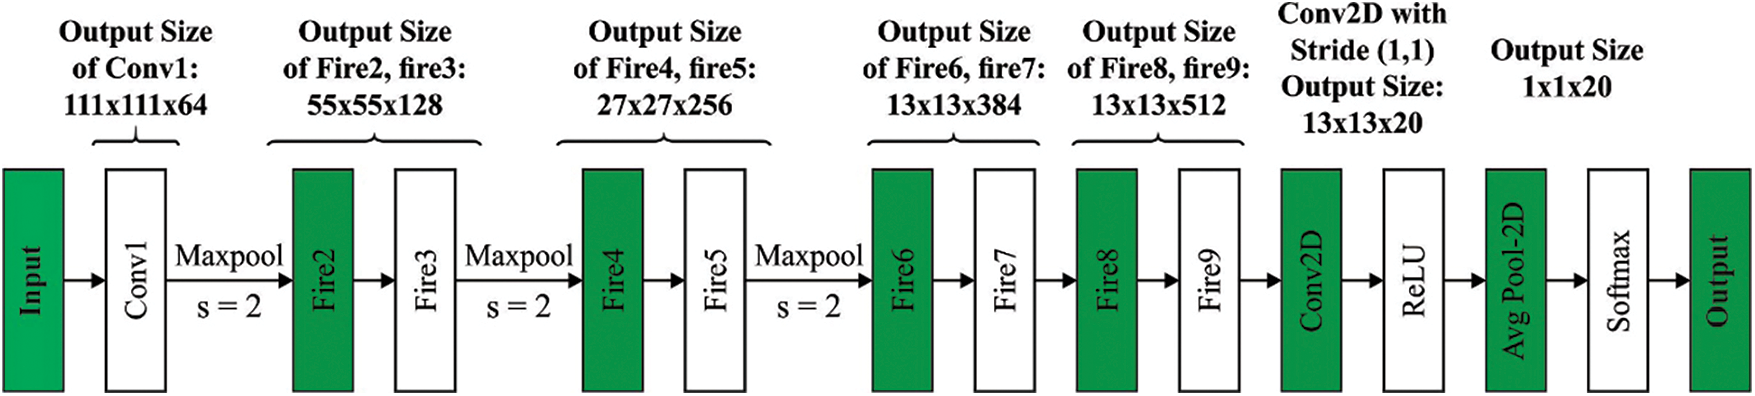
Figure 2: Structure of SqueezeNet
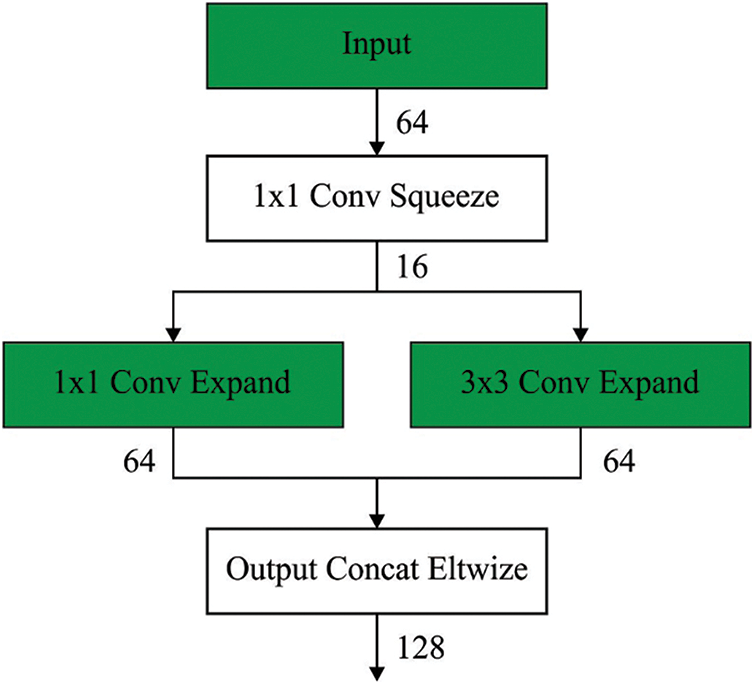
Figure 3: Process of SqueezeNet
In BC diagnoses, an accurate classifier is needed to allocate the proper class labels to the input mammograms. Specifically, there is a fuzzy membership (FM) connected to all applicants that is considered the attitude of equivalent feature nearer one class in classification. Lin et al. [21] presented the concept of FSVM, depending on a classic SVM. Assume that the group of labelled instance points with connected FM:
By generating a Lagrangian, the quadratic programmes are resolved in its dual space, just as that classic SVM:
With various of
and the radius of class
The FM of every instance as:
with
This technique carries out as FM is a function of the mean and radius of every class, and the outcome of the outlier is diminished, as it gives small to the last decision planes. However, the technique is performed as the original input space slightly to the feature space, and the non-linear membership functions are determined as feature space with mapped functions
where
Afterwards, the square of distance is computed as the feature space:
Finally, the FM of all samples is computed as:
with
The non-linear form of FSVM depicts the linear one, as it is further correctly signified as the contribution of all samples to the decision surface in feature space.
3.6 Design of MOMFO Algorithm for Parameter Optimization
In this study, the MOMFO algorithm is designed to optimally select the hyper parameters of the SqueezeNet and weight/bias parameters of the FSVM model. Using a MOMFO algorithm assists in significantly boosting the classification outcome. The MFO technique considers that an MF is an adult after hatch and the fittest one lives to disregard the lifespan. The set of male and female MFs are arbitrarily created. Specifically, a primary place of MFs as the search agents is arbitrarily elected in the search spaces that is demonstrated as a position vector of
Collecting male MFs in a swarm demonstrates that its place is upgraded based on the social and individual experience. The place of the male MF is upgraded as:
where,
At this point,
At this point,
To preserve an optimum outcome of the technique, the set of fittest MFs perform the nuptial dance with vertical movement. Therefore, the fittest MFs have to keep their speed as follows that further arbitrary feature to the technique.
At this point,
The attraction is demonstrated as deterministic procedure, where the fittest female is concerned with fittest male, the 2nd fittest female is involved to second fittest male, and so on. The subsequent formula is utilized for computing the velocity.
At this point,
The mating performance of MFs that is described in the subsequent is displayed utilizing the crossover operator. The elective model is completed arbitrarily or dependent upon the OF. The subsequent formula is utilized for computed the offspring of crossovers.
At this point,
This section validates the performance of the proposed model regarding different measures. The DL-MOMFO technique is experimented with using a benchmark Mini-MIAS dataset, comprising 322 images with three class labels. Fig. 4 shown sample test images. Tab. 1 shows the performance of the DL-MOMFO technique with other methods under varying training sizes. The experimental outcomes stated that the presented model has resulted in a maximum classification performance over the other recent methods. On examining the results for precision by varying TS = 40, the proposed DL-MOMFO algorithm gained a higher precision of 98.57%, whereas the DL-OFSVM, DL-FSVM and DL-SVM techniques achieved lower precisions of 99.78%, 97.10% and 96.99%, respectively. Likewise, on examining the outcomes regarding precision by varying TS = 60, the presented DL-MOMFO technique attained an improved precision of 96.26%, whereas the DL-OFSVM, DL-FSVM and DL-SVM methodologies reached lower precisions of 97.32%, 98.15% and 97.29%, respectively. Similarly, on investigating the outcomes regarding precision by varying TS = 80, the proposed DL-MOMFO algorithm gained a higher precision of 98.09%, whereas the DL-OFSVM, DL-FSVM and DL-SVM methods obtained lower precisions of 99.04%, 97.86% and 96.29%, respectively.
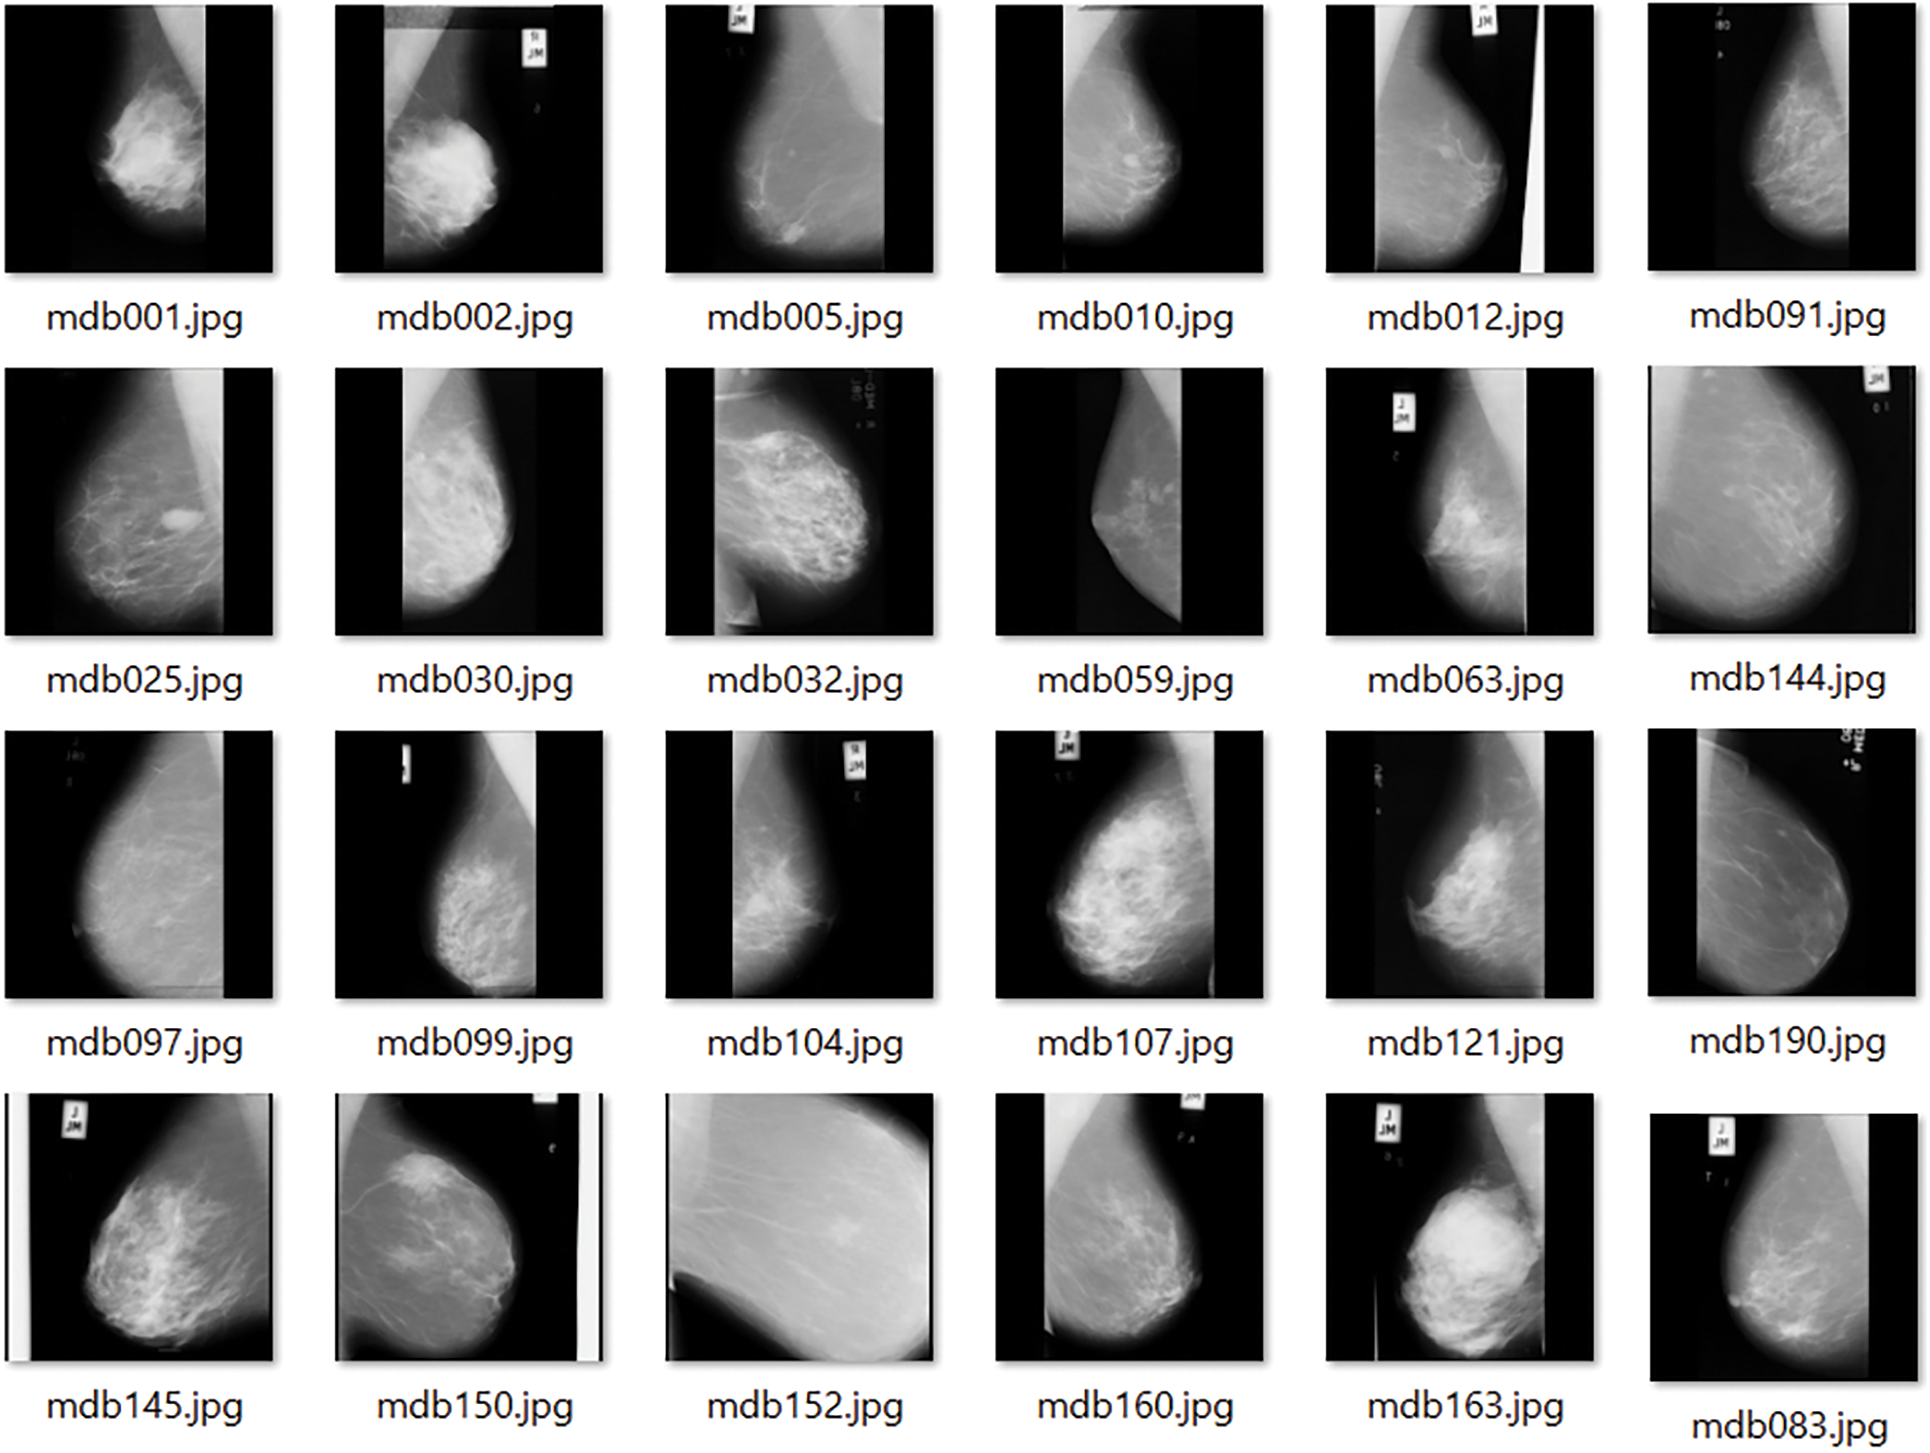
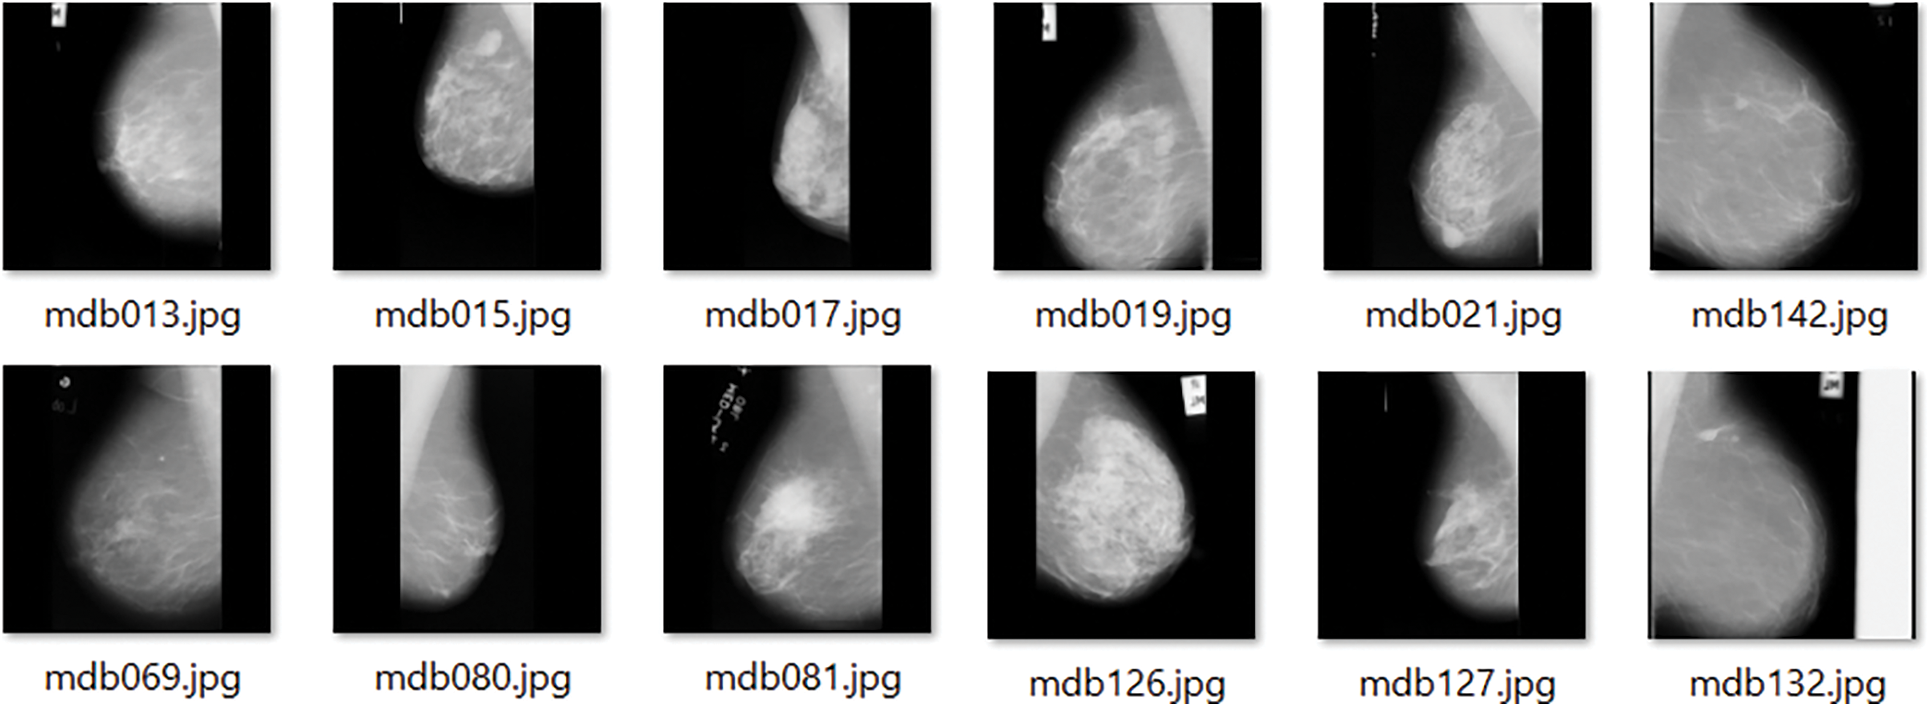
Figure 4: Sample test images
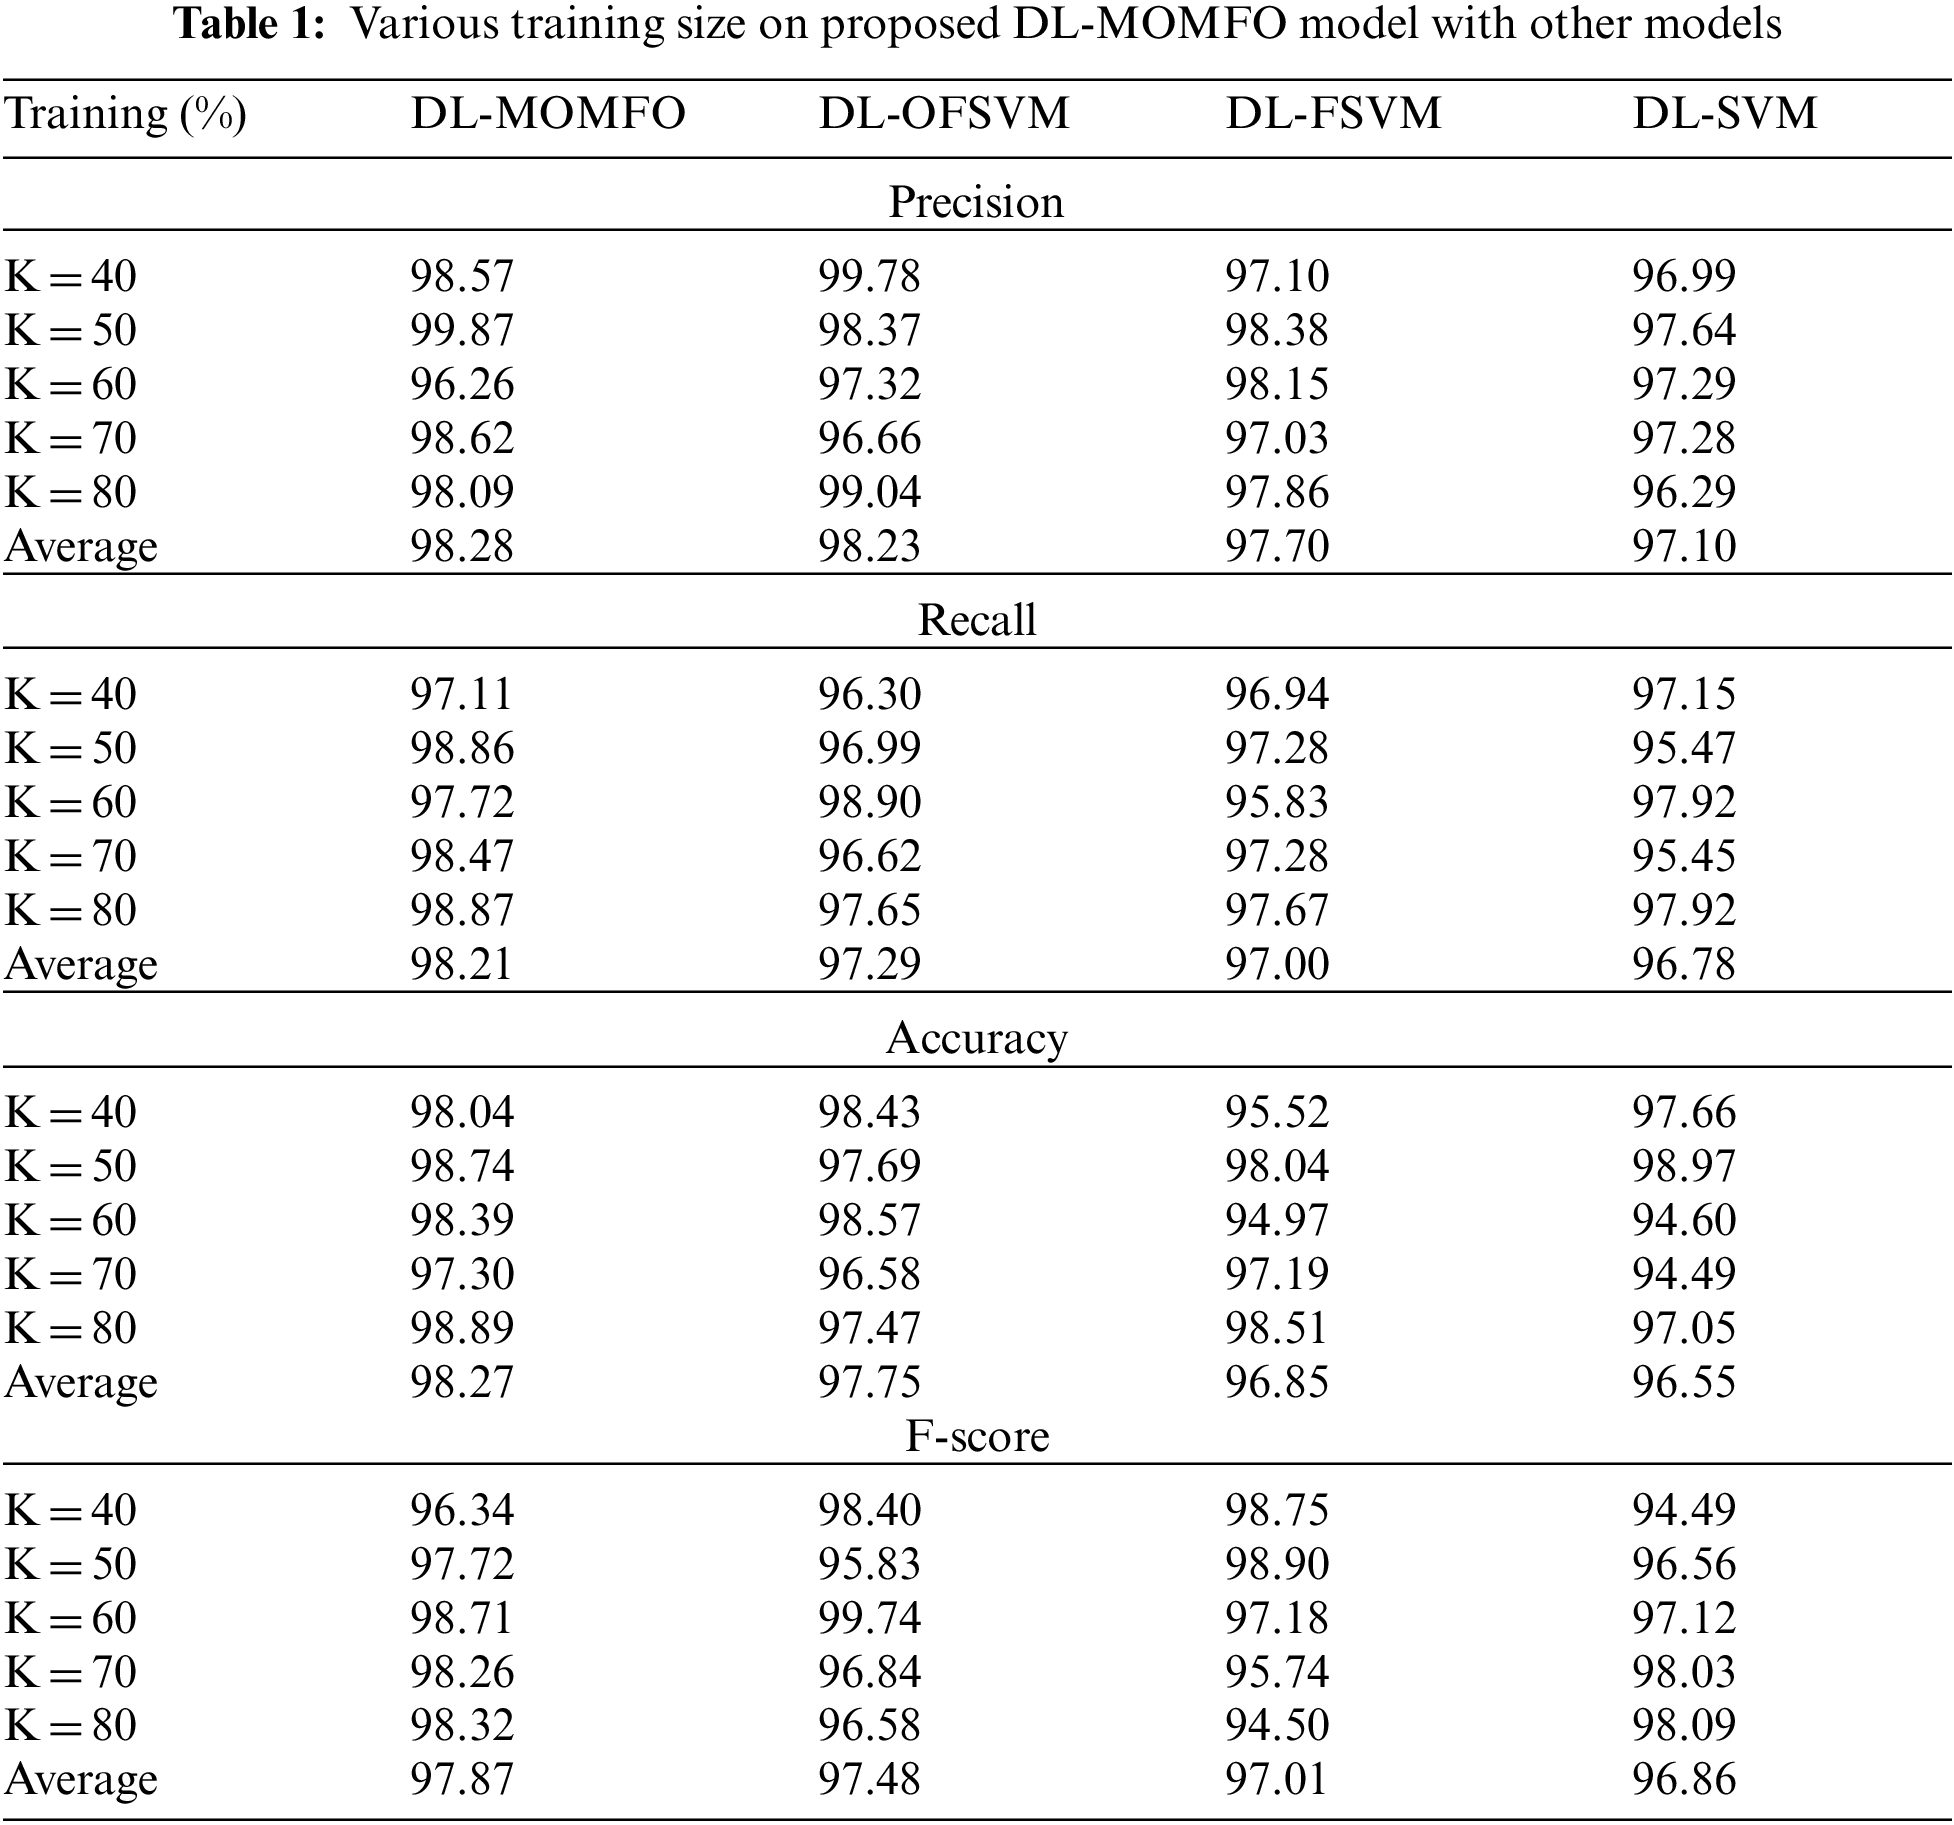
Fig. 5 showcases the ROC analysis of the DL-MOMFO techniques with other existing techniques under varying TS. From the figure, it is depicted that the ROC analysis of the DL-MOMFO technique has obtained a higher value over all the other compared methods.
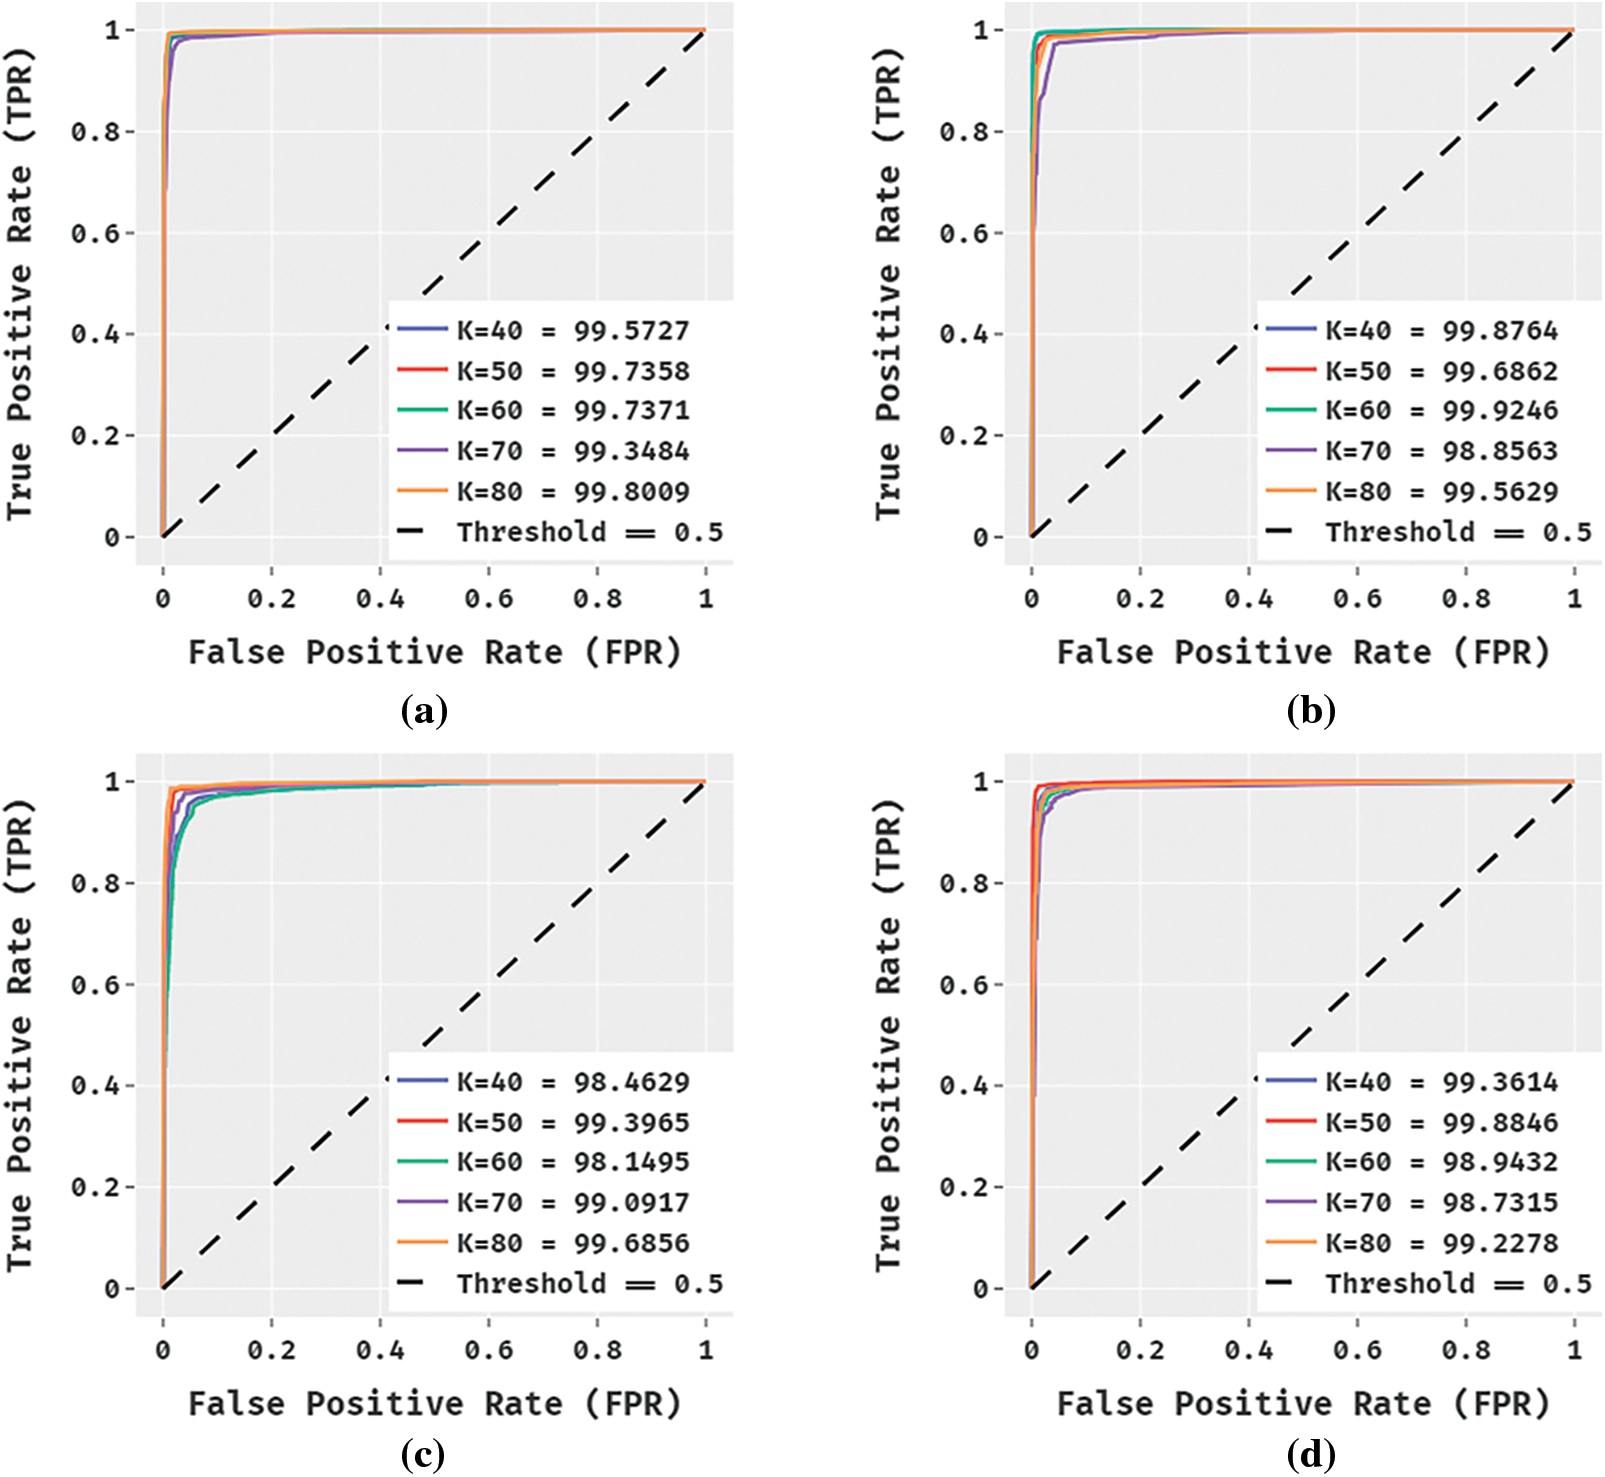
Figure 5: ROC Analysis a) DL-MOMFO b) DL-OFSVM c) DL-FSVM d) DL-SVM
To further ensure the improved performance of the presented DL-MOMFO, a brief comparison study is made in Tab. 2 [24]. Fig. 6 shows the precision and recall analysis of the DL-MOMFO technique over other existing techniques. From the figure, the ELM model showcased an ineffectual outcome with a precision of 79.12% and recall of 98.16%. Moreover, the NB technique achieved slightly enhanced performance with a precision of 80% and recall of 97.96%. Likewise, the KNN model accomplished somewhat improved outcomes with a precision of 92.11% and recall of 93.75%. Following this, the AdaBoost technique resulted in a moderate performance with a precision of 93.75% and recall of 95.45%. Afterwards, the SVM model offered a reasonable outcome with a precision of 94.64% and recall of 94.64%. Furthermore, the MLP technique demonstrated a competitive outcome with a precision of 97.65% and recall of 75.45%. However, the proposed DL-MOMFO technique demonstrated an effectual outcome with a precision of 98.28% and recall of 98.21%.
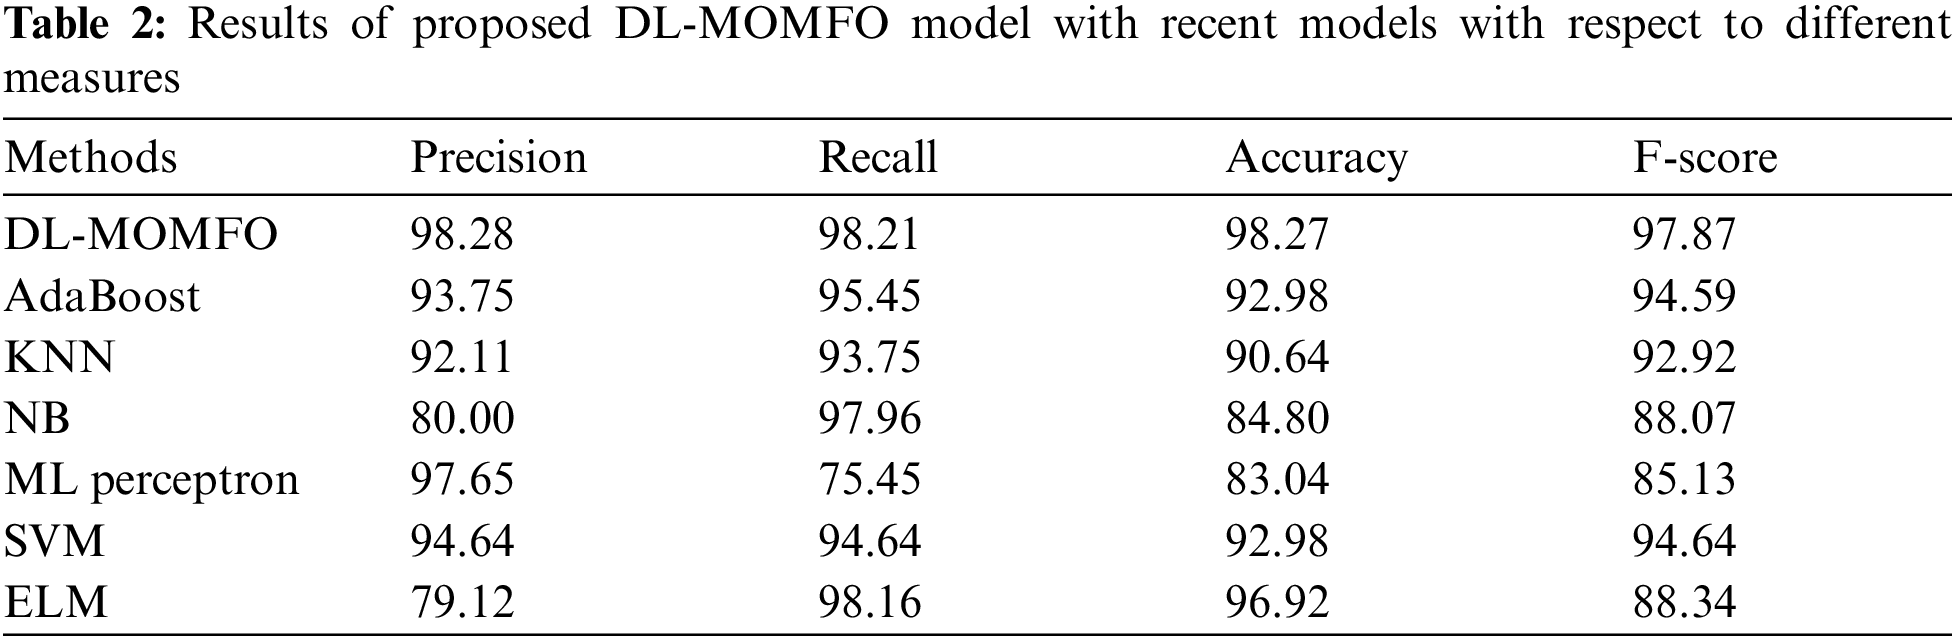
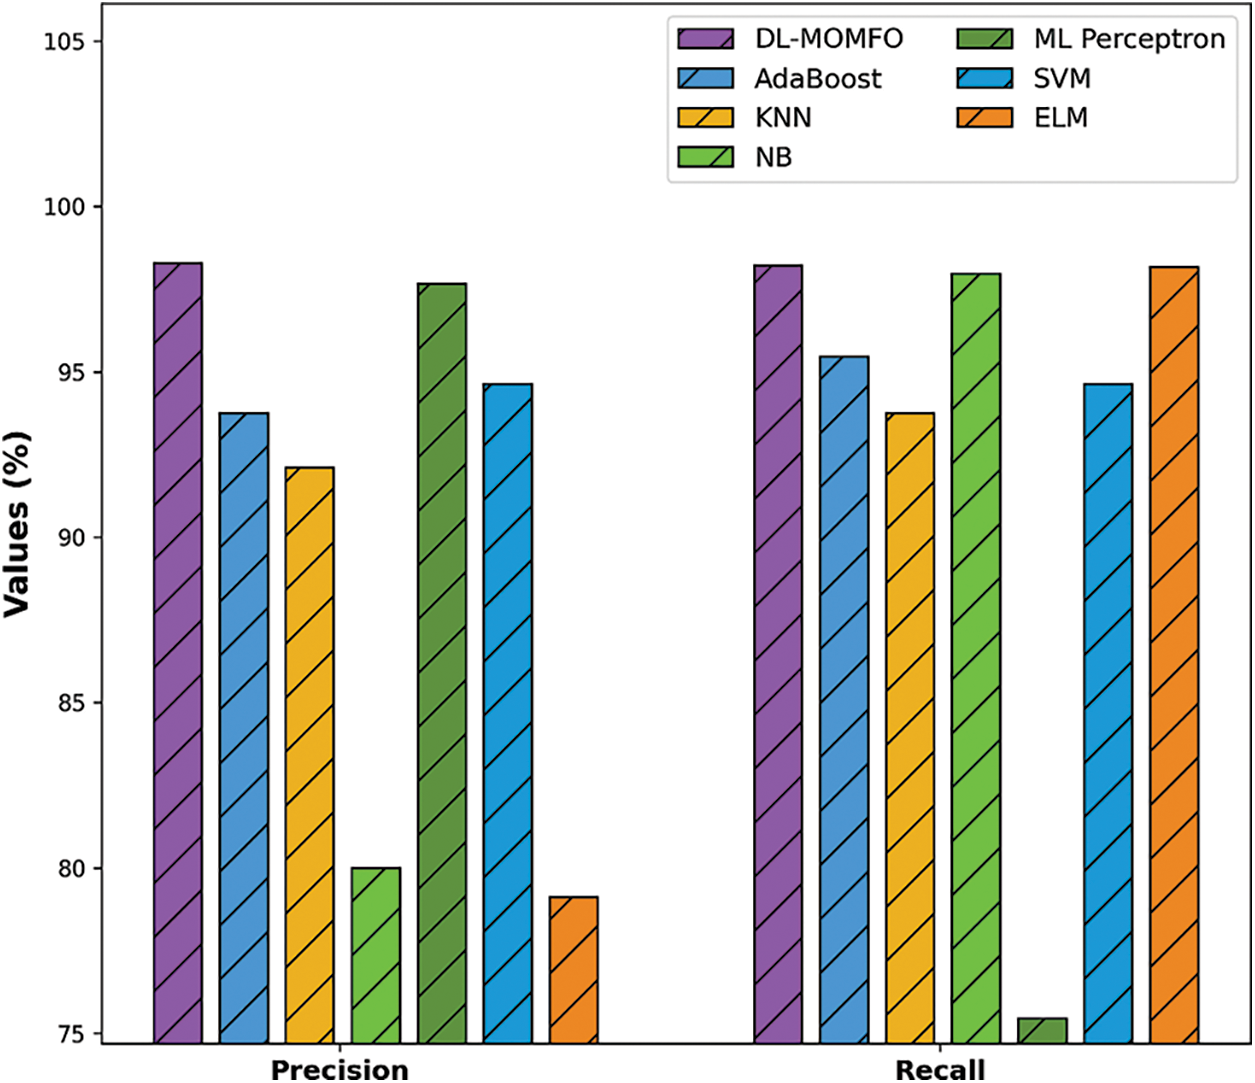
Figure 6: Precision and recall analysis of DL-MOMFO model
The MLP technique demonstrated an ineffectual outcome with an accuracy of 83.01% and an F-score of 85.13%. The NB manner achieved somewhat improved performance with an accuracy of 84.80% and an F-score of 88.07%. Also, the KNN technique accomplished a somewhat enhanced outcome with an accuracy of 90.64% and an F-score of 92.92%. Concurrently, the AdaBoost approach resulted in a reasonable performance with an accuracy of 92.98% and an F-score of 94.59%. Next, the SVM method offered a reasonable outcome with an accuracy of 92.98% and an F-score of 94.64%. Besides, the ELM technique portrayed competitive results with an accuracy of 96.92% and an F-score of 88.34%. Finally, the DL-MOMFO technique outperformed the effective outcome with an accuracy of 98.27% and an F-score of 97.87%.
In this study, a new cognitive computing-enabled BC diagnosis model was developed in an IoMT environment for smart healthcare applications. The proposed DL-MOMFO algorithm involved different subprocesses, such as pre-processing, U-Net-based segmentation, SqueezeNet-based feature extraction, FSVM-based classification and MOMFO-based parameter optimisation. The design of the MOMFO algorithm for parameter optimisation of the SqueezeNet and FSVM models forms the major reason for the improved diagnostic performance of the proposed DL-MOMFO technique. For ensuring the improved diagnostic results of the proposed model, an extensive set of simulations occurs on a benchmark MIAS database. The experimental outcomes revealed that the DL-MOMFO technique accomplished effectual outcomes over recent techniques. In the future, the performance of the DL-MOMFO technique will be increased using data augmentation and advanced DL architectures.
Acknowledgement: We deeply acknowledge Taif University for supporting this study through Taif University Researchers Supporting Project Number (TURSP-2020/328), Taif University, Taif, Saudi Arabia.
Funding Statement: Taif University Researchers Supporting Project Number (TURSP-2020/328), Taif University, Taif, Saudi Arabia.
Conflicts of Interest: The authors declare that they have no conflicts of interest to report regarding the present study
1. M. Chen, F. Herrera and K. Hwang, “ Cognitive computing: Architecture, technologies and intelligent applications,” IEEE Access, vol. 6, pp. 19774–19783, 2018. [Google Scholar]
2. S. Suwanvecho, H. Suwanrusme, M. Sangtian, A. D. Norden, A. Urman et al., “Concordance assessment of a cognitive computing system in Thailand,” Journal of Clinical Oncology, vol. 35, no. 15, pp. 6589, 2017. [Google Scholar]
3. D. McNamara, S. Goldberg, L. Latts, D. Atieh Graham, S. Waintraub et al., “Differential impact of cognitive computing augmented by real world evidence on novice and expert oncologists,” Cancer Medicine, vol. 8, no. 15, pp. 6578–6584, 2019. [Google Scholar]
4. S. Esser, A. Andreopoulos, R. Appuswamy, P. Datta, D. Barch et al., “August. cognitive computing systems: Algorithms and applications for networks of neurosynaptic cores,” in The 2013 Int. Joint Conf. on Neural Networks, Dallas, TX, USA, pp. 1–10, 2013. [Google Scholar]
5. R. Preissl, T. Wong, P. Datta, M. Flickner, R. Singh et al., “November. compass: A scalable simulator for an architecture for cognitive computing,” in SC'12: Proc. of the Int. Conf. on High Performance Computing, Networking, Storage and Analysis, Salt Lake City, UT, USA, pp. 1–11, 2012. [Google Scholar]
6. R. F. Mansour, “A robust deep neural network based breast cancer detection and classification,” International Journal of Computational Intelligence and Applications,” vol. 19, no. 1, pp. 2050007, 2020. [Google Scholar]
7. C. Kaushal, K. Kaushal and A. Singla, “Firefly optimization-based segmentation technique to analyse medical images of breast cancer,” International Journal of Computer Mathematics, vol. 98, no. 7, pp. 1293–1308, 2021. [Google Scholar]
8. S. Wessels and D. van der Haar, “Applying deep learning for the detection of abnormalities in mammograms,” Information Science and Applications, vol. 621, pp. 201–210, 2020. [Google Scholar]
9. S. Khan, N. Islam, Z. Jan, I. Din, A. Khan et al., “An e-health care services framework for the detection and classification of breast cancer in breast cytology images as an IoMT application,” Future Generation Computer Systems, vol. 98, pp. 286–296, 2019. [Google Scholar]
10. M. Memon, J. Li, A. Haq, M. Memon and W. Zhou, “Breast cancer detection in the IOT health environment using modified recursive feature selection,” Wireless Communications and Mobile Computing, vol. 2019, 2019, https://doi.org/10.1155/2019/5176705. [Google Scholar]
11. T. Sadad, A. Khan, A. Hussain, U. Tariq, S. Fati et al., “Internet of medical things embedding deep learning with data augmentation for mammogram density classification,” Microscopy Research and Technique, vol. 84, no. 9, pp. 2186–2194, 2021. [Google Scholar]
12. M. Mathapati, S. Chidambaranathan, A. Nasir, G. Vimalarani and S. Rani, “An intelligent internet of medical things with deep learning based automated breast cancer detection and classification model,” Cognitive Internet of Medical Things for Smart Healthcare, vol. 311, pp. 181–193, 2021, https://doi.org/10.1007/978-3-030-55833-8_11. [Google Scholar]
13. H. Turabieh, M. Mafarja and S. Mirjalili, “Dynamic adaptive network-based fuzzy inference system (D-ANFIS) for the imputation of missing data for internet of medical things applications,” IEEE Internet of Things Journal, vol. 6, no. 6, pp. 9316–9325, 2019. [Google Scholar]
14. J. Zheng, D. Lin, Z. Gao, S. Wang, M. He et al., “Deep learning assisted efficient AdaBoost algorithm for breast cancer detection and early diagnosis,” IEEE Access, vol. 8, pp. 96946–96954, 2020. [Google Scholar]
15. V. Gopal, F. Al-Turjman, R. Kumar, L. Anand and M. Rajesh, “Feature selection and classification in breast cancer prediction using IoT and machine learning,” Measurement, vol. 178, pp. 109442, 2021. [Google Scholar]
16. X. Zhang, D. He, Y. Zheng, H. Huo, S. Li et al., “Deep learning based analysis of breast cancer using advanced ensemble classifier and linear discriminant analysis,” IEEE Access, vol. 8, pp. 120208–120217, 2020. [Google Scholar]
17. P. Yugander, C. Tejaswini, J. Meenakshi, B. Varma and M. Jagannath, “MR image enhancement using adaptive weighted mean filtering and homomorphic filtering,” Procedia Computer Science, vol. 167, pp. 677–685, 2020. [Google Scholar]
18. P. Hambarde, S. Talbar, A. Mahajan, S. Chavan, M. Thakur et al., “Prostate lesion segmentation in MR images using radiomics based deeply supervised U-net,” Biocybernetics and Biomedical Engineering, vol. 40, no. 4, pp. 1421–1435, 2020. [Google Scholar]
19. DenseNet: Better CNN Model than ResNet. Available online: http://www.programmersought.com/article/7780717554/ (accessed on 23 December 2019). [Google Scholar]
20. R. Mansour, A. El Amraoui, I. Nouaouri, V. Díaz, D. Gupta et al., “Artificial intelligence and internet of things enabled disease diagnosis model for smart healthcare systems,” IEEE Access, vol. 9, pp. 45137–45146, 2021. [Google Scholar]
21. C. F. Lin and S. D. Wang, “Fuzzy support vector machines,” IEEE Transactions on Neural Networks, vol. 13, no. 2, pp. 464–471, 2002. [Google Scholar]
22. J. Shi and B. Xu, “Credit scoring by fuzzy support vector machines with a novel membership function,” Journal of Risk and Financial Management, vol. 9, no. 4, pp. 13, 2016. [Google Scholar]
23. X. Guo, X. Yan and K. Jermsittiparsert, “Using the modified mayfly algorithm for optimizing the component size and operation strategy of a high temperature PEMFC-powered CCHP,” Energy Reports, vol. 7, pp. 1234–1245, 2021. [Google Scholar]
24. V. Lahoura, H. Singh, A. Aggarwal, B. Sharma, M. Mohammed et al., “Cloud computing-based framework for breast cancer diagnosis using extreme learning machine,” Diagnostics, vol. 11, no. 2, pp. 241, 2021. [Google Scholar]
 | This work is licensed under a Creative Commons Attribution 4.0 International License, which permits unrestricted use, distribution, and reproduction in any medium, provided the original work is properly cited. |