DOI:10.32604/cmc.2022.026574
| Computers, Materials & Continua DOI:10.32604/cmc.2022.026574 | |
| Article |
Dynamic Intelligent Supply-Demand Adaptation Model Towards Intelligent Cloud Manufacturing
1School of Internet of Things, Nanjing University of Posts and Telecommunications, Nanjing, 210003, China
2College of Automation & College of Artificial Intelligence, Nanjing University of Posts and Telecommunications, Nanjing, 210003, China
3Department of Mathematics, Faculty of Science, New Valley University, El-Karaga, 72511, Egypt
*Corresponding Author: Jin Qi. Email: qijin@njupt.edu.cn
Received: 30 December 2021; Accepted: 02 March 2022
Abstract: As a new mode and means of smart manufacturing, smart cloud manufacturing (SCM) faces great challenges in massive supply and demand, dynamic resource collaboration and intelligent adaptation. To address the problem, this paper proposes an SCM-oriented dynamic supply-demand (S-D) intelligent adaptation model for massive manufacturing services. In this model, a collaborative network model is established based on the properties of both the supply-demand and their relationships; in addition, an algorithm based on deep graph clustering (DGC) and aligned sampling (AS) is used to divide and conquer the large adaptation domain to solve the problem of the slow computational speed caused by the high complexity of spatiotemporal search in the collaborative network model. At the same time, an intelligent supply-demand adaptation method driven by the quality of service (QoS) is established, in which the experiences of adaptation are shared among adaptation subdomains through deep reinforcement learning (DRL) powered by a transfer mechanism to improve the poor adaptation results caused by dynamic uncertainty. The results show that the model and the solution proposed in this paper can perform collaborative and intelligent supply-demand adaptation for the massive and dynamic resources in SCM through autonomous learning and can effectively perform global supply-demand matching and optimal resource allocation.
Keywords: Smart Cloud Manufacturing; supply and demand sides; dynamic adaptation; Deep Graph Clustering; transfer learning; reinforcement learning
SCM is the result of applying next-generation information technologies such as big data, artificial intelligence and Internet of Things [1] to the field of cloud manufacturing, and it has further expanded into the fields of production, circulation and consumption [2]. As a very new approach to manufacturing services, SCM has the characteristics of having a large scale and being highly dynamic. It is difficult to achieve collaborative, intelligent, intensive supply-demand matching and the optimal allocation of service resources, because there is a lack of an intelligent adaptation mechanism based on the interaction between supplies and demands. This has become one of the great challenges in this field [3].
In order to meet the above challenges, domestic and foreign researchers have built different models and proposed different methods to solve the demand for the adaptation of massive service resources in the field of intelligent cloud manufacturing, and achieved some results. It includes the construction of mixed integer linear programming model and the mathematical optimization model based on multi-index to solve the process of service matching [4,5]. However, the above research is based on the supply and demand matching scenario of static service resources, and does not take into account the dynamic changes of tasks and services. With the increasing demand for the optimal allocation of intelligent service resources in intelligent manufacturing driven by artificial intelligence, and the diversity and complexity of tasks and services in intelligent cloud manufacturing, the contradiction between collaborative supply and demand adaptation is becoming more and more prominent [6]. Intelligent adaptation of massive dynamic service resources in intelligent cloud manufacturing has gradually become the focus of research.
With the deepening of research, some achievements have been made in the research considering the dynamic change scenarios of tasks and services in the process of resource adaptation. Reference [7] established a model of the dynamic cloud manufacturing scheduling problem and proposed a scheduling method based on simulation to improve its performance. Reference [8] used a simulation-optimization approach based on a hedging strategy to capture the randomness of the uncertain parameters. Reference [9] presented a realistic production–distribution planning model that is robust to common supply interruptions and demand variations, which aims to reduce the dynamic impact on adaptation. Reference [10] considered the supply and demand matching method of the dynamic change of machine tool information, and reference [11] combined the static and dynamic characteristics of 3D printer to realize fast supply and demand matching. In view of the double uncertainty of supply and demand, a supply and demand adaptation method considering speculative delay strategy was proposed in reference [12]. This method can reduce the influence of dynamics on supply and demand adaptation as much as possible. The above research has made some progress in solving the dynamic uncertainty of service resource adaptation, but it has not taken into account the dynamic addition and withdrawal of service resources in the process of supply and demand adaptation. Therefore, considering the above factors, in order to meet the efficient interaction of service resources and improve the intelligence and robustness of adaptation, this paper innovatively transforms the traditional supply and demand adaptation problem into reinforcement learning (RL) problem [13]. so that the algorithm can learn the law of supply and demand adaptation.
With the explosive growth of massive service resources in SCM, in order to meet the demand for efficient and collaborative supply and demand adaptation, such as search, matching and selection of service resources, and to improve the efficiency and quality of supply and demand adaptation, the construction of a global service network model for collaborative interaction of massive service resources has become an urgent problem to be solved in the optimal allocation of intelligent cloud manufacturing service resources. At present, the research on this problem is in the preliminary stage, with few results. However, in other fields, common solutions to such problems are to divide the service resources by clustering [14,15] or to improve the efficiency of the traditional optimization algorithm so that it can overcome the impact of high-dimensional massive service resources [16,17]. However, these methods are not suitable for the massive and dynamic service resources in an SCM scenario. Reference [18] constructed a matching network model consisting of service network, manufacturing network and super-edge between them to match supply and demand. Reference [19] proposed enterprise collaboration network based on this network and adopted PSO algorithm to realize optimal collaboration. Reference [20] proposed a classified hypernetwork model and used NSGA-II algorithm to solve the supply-demand optimization. However, these methods do not have the dynamic processing and transfer characteristics of reinforcement learning. Therefore, an aggregated divide-and-conquer method based on DGC and an AS algorithm is proposed to divide the complex adaptation problem into several simple subproblems and transfer experiences among subproblems through transfer learning (TL) to improve the synergy and efficiency of supply-demand adaptation.
Therefore, this paper aims to solve the problem of the large scale and high dynamics encountered by the supply-demand adaptation of service resources in SCM, and it puts forward an SCM-oriented dynamic supply-demand intelligent adaptation model for massive manufacturing services. In this model, collaborative tasks and service networks are built based on both the properties of the supply-demand and their relationships; in addition, a divide-and-conquer framework of adaptation tasks based on DGC and TL is introduced to reduce the computational complexity; then, the DRL algorithm is used to solve this problem and finally achieve the collaborative, intelligent and intensive adaptation of the massive and dynamic service resources in SCM.
The main contributions of this paper are as follows: (1) An SCM-oriented dynamic supply-demand intelligent adaptation model for massive manufacturing services is proposed, in which a collaborative network model is established based on both the properties of supply-demand and their relationships; in addition, an intelligent adaptation method driven by the generalized QoS is proposed to achieve collaborative, intelligent and intensive adaptation; (2) A divide-and-conquer method based on DGC is proposed to solve the problem of the slow computational speed caused by the high complexity of spatiotemporal search in the collaborative network model; (3) An intelligent supply-demand adaptation method based on DRL is proposed, which makes use of the autonomous learning ability of DRL to reduce the adaptation difficulties caused by dynamic uncertainty and improve the effectiveness of dynamic adaptation; (4) An adaptation task collaboration mechanism based on TL is proposed to share experiences among the adaptation subdomains so that multiple tasks can cooperate with each other to improve the efficiency of dynamic adaptation; (5) The experimental results show that the model and the method proposed in this paper can not only effectively solve the problem of the supply-demand adaptation of massive and dynamic service resources in SCM but also greatly improve the universality and flexibility of supply-demand adaptation.
2 Supply-Demand Adaptation Model For SCM
This paper builds an SCM-oriented massive-resource dynamic adaptation model for both the supply and demand sides to achieve collaborative and intelligent optimal configuration of service resources in SCM.
2.1 Collaborative Supply-Demand Network Model for SCM
As our goal is to better cluster tasks and services to divide-and-conquer massive manufacturing resources, in order to simplify the supply-demand adaptation problem in SCM. Therefore, distinguish from traditional methods, we consider the potential relationships between tasks or services to improve the performance of clustering. Inspired by reference [18], a collaborative network model is established to provide a knowledge representation basis for the supply-demand adaptation of service resources, as well as to better divide-and-conquer the supply-demand adaptation problem.
(1) Network Model for Manufacturing Tasks
The tasks in SCM can be divided into indissoluble meta-tasks and composite tasks composed of meta-tasks, and the combination of meta-tasks into a composite task follows the rules of a working procedure and time sequence. Therefore, it is necessary to construct a task network (TN) model based on a weighted directed graph, in which positive and negative weights represent the directions of the edges:
where
Definition 1. Similar Tasks: When
Definition 2. Complementary Tasks: When
Definition 3. Sequential Tasks: When
(2) Network Model for Manufacturing Services
Service providers generally do not provide sequential services in the process of the supply-demand adaptation of service resources driven by task requirements [22], which makes the use of sequential relationships inappropriate for describing the services. Therefore, the service network (SN) model that is to be built is based on an undirected graph:
where
Definition 4. Similar Services: When
Definition 5. Complementary Services: When
2.2 Optimization Model for Supply-demand Adaptation in SCM
This paper considers the supply-demand adaptation problem of SCM in the adaptation domain:
Assume that
where
where
where
On the basis of the intelligent adaptation model of cloud manufacturing established in this paper, multiple constraints of service resource adaptation on both sides of supply and demand of intelligent cloud manufacturing should also be considered. The adaptation problem in this paper follows the principles of function matching and time domain (TD) matching. That is, the functions provided by the service must meet the requirements of the task, and the time of the task must be within the cycle of the service. Therefore, the matching of
Constraint 1. Functionality Constraint:
Constraint 2. TD Constraint:
For the indexes in
Constraint 3. Index Upper Limit Constraint:
where
3 Simplification and Solution of Dynamic Supply-Demand Adaptation of Massive Service Resources in SCM
The model established in this paper is to solve the problem of mass and dynamic service resource supply and demand optimization driven by quality of service. To simplify the proposed network model, reduce the computational complexity and increase the accuracy of artificial intelligence learning, an aggregated divide-and-conquer algorithm based on a graph neural network is introduced [23]. Then, a novel method based on DRL powered by the transfer mechanism is carried out to solve the dynamic adaptation problem intelligently while overcoming the drawback of the traditional optimization algorithm that is difficult to cope with dynamic changes in the environment. The general procedure of our solution is shown in Fig. 1

Figure 1: Procedure of the adaptation task
The corresponding algorithm flow is shown in Fig. 2. In the first stage of the flow chart, the network model is simplified by aggregated divide-and-conquer. In the second stage, transfer-based deep reinforcement learning is adopted for each sub-adaptive domain to cope with the dynamic changes of supply and demand adaptation.
3.1 Simplification of the Collaborative Network Model
Considering the high spatiotemporal search complexity of the collaborative network model established in this paper, which is large scale and highly hybrid in the adaptation domain
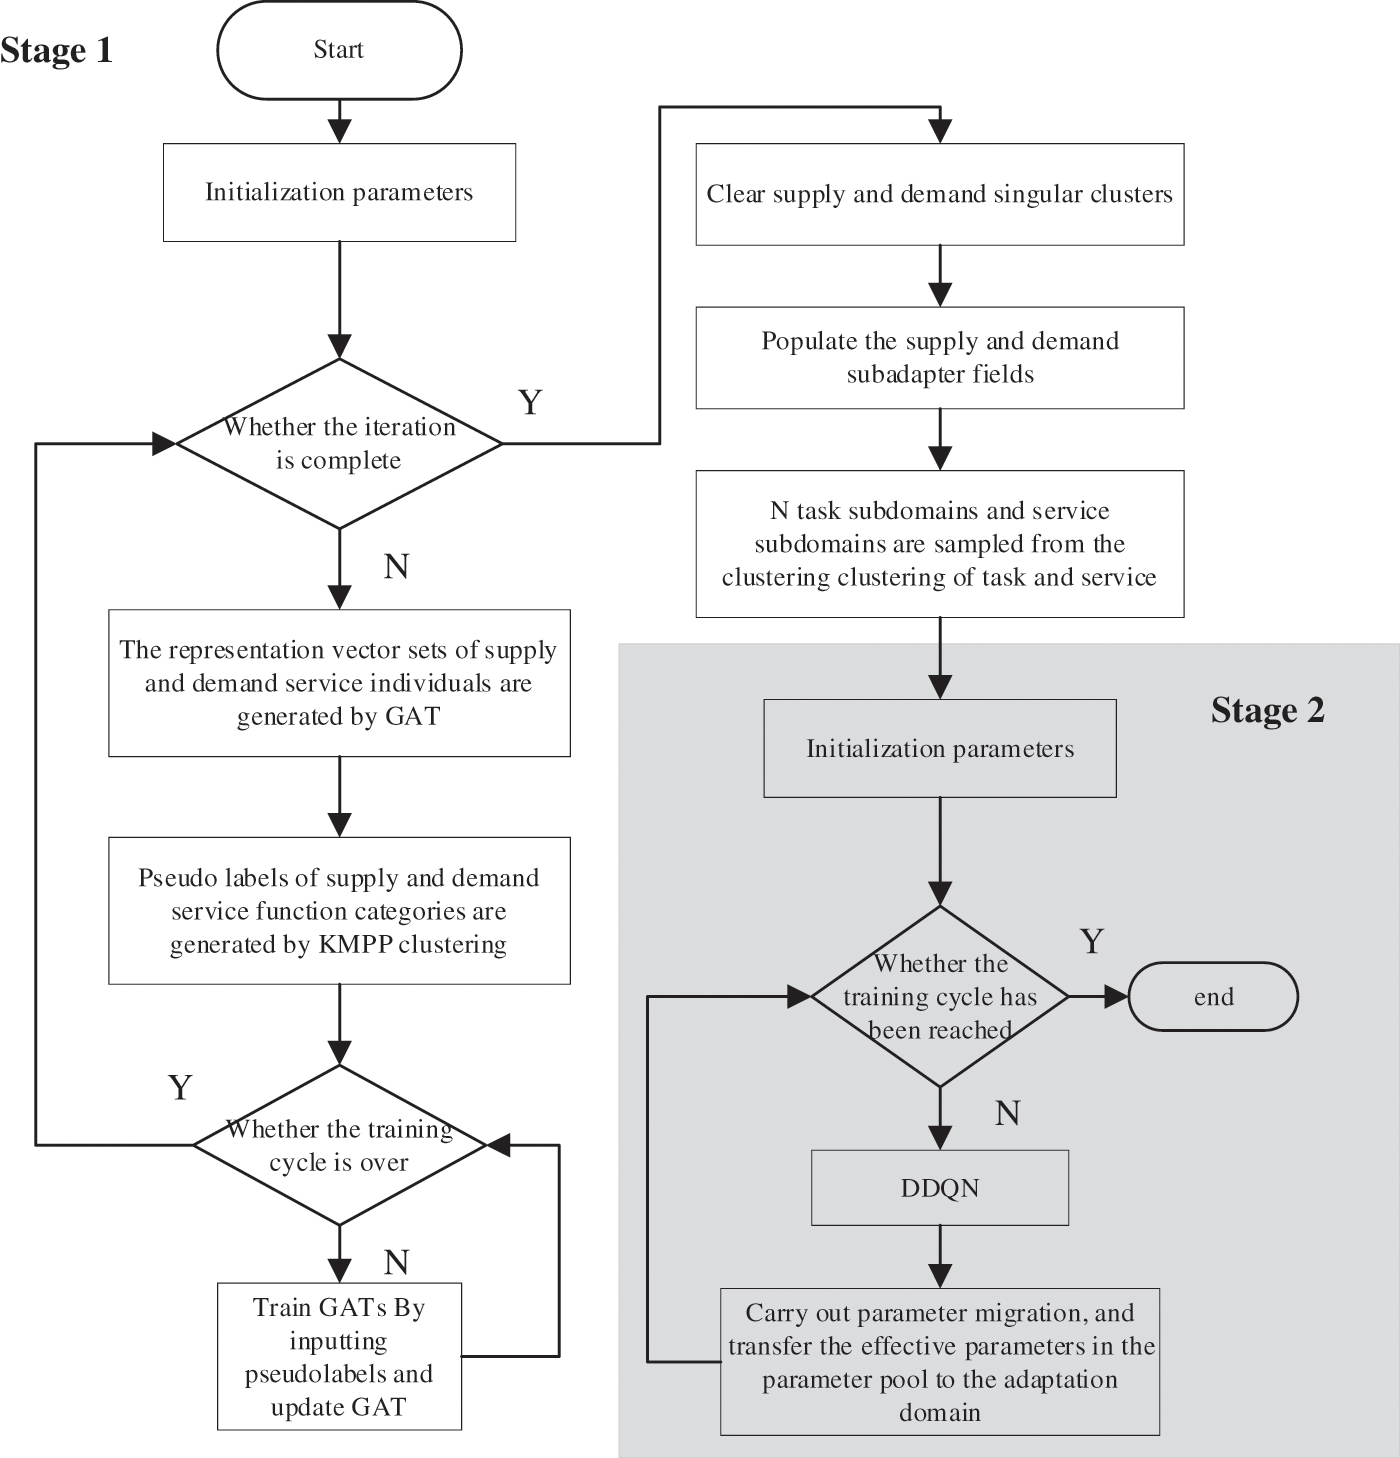
Figure 2: Flowchart of the adaptation task
(1) Optimization of Adaptation Domains Based on DGC
Optimization of adaptation domains of massive supply and demand data includes two steps: Clustering adaptation domains to form supply and demand service resource sets of different functional groups, and sampling from the above different resource sets to form multiple sub-adaptation domains.
The collaborative supply-demand network model is a graph network that considers the properties of the supply-demand and their relationships between the supply and demand. Inspired by [24], this paper proposes a novel graph clustering method based on graph neural networks and deep learning.
This method uses a graph attention network (GAT) to generate a unique vector representation of the nodes in the network model; next, it divides the nodes into several categories according to these vector representations with clustering algorithms. Then, it assigns the same pseudo-label to nodes in the same category; finally, it uses the pseudo-labels to train the GAT to achieve a satisfactory clustering result. The clustering process is shown in Fig. 3.
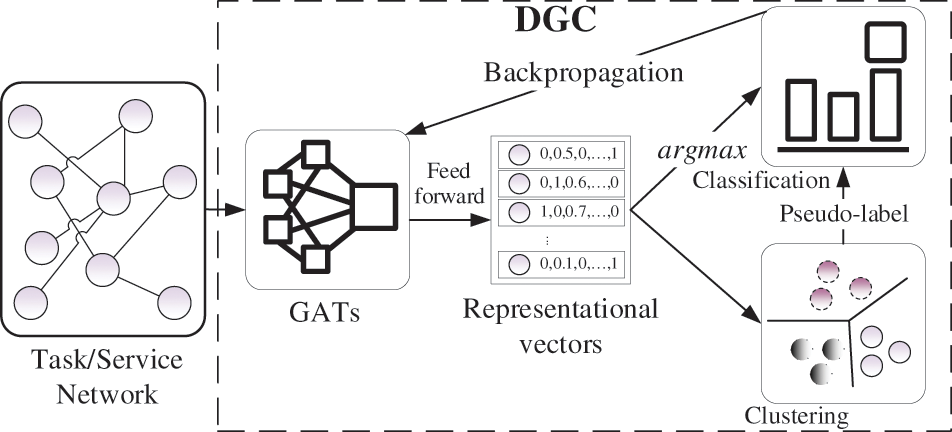
Figure 3: Process of the clustering of tasks and services in SCM
The GATs can handle both directed and undirected graph, due to its vertex-by-vertex operation mode, that is, each operation needs to loop through all the vertices on the graph. It means that the problem of directed graph can be solved by getting rid of the constraint of Laplacian matrix. So, the proposed DGC, which adopted GAT, can operate both the directed TN and the undirected SN.
The sampling algorithm guarantees the distribution consistency between the generated adaptation subdomain and the entire adaptation domain by ensuring that the subdomain covers the samples in each cluster and that the proportion of samples from each cluster in the subdomain is the same as that in the entire domain. Before sampling, to eliminate the interference of singular clusters, which have very small sample sizes, each singular cluster should be merged into the corresponding cluster with the smallest distance from its cluster center. After that, the number of samples in the smallest cluster should be ensured to be much larger than the number of subdomains
where
(2) Recursive Optimization Mechanism of Adaptation Domains
In the case of huge supply and demand adaptation data, the complexity of sub-adaptation domain is still too high after optimization of the adaptation domain. The adaptive domain optimization method proposed in this paper can be applied to sub-adaptive domains to further reduce the complexity of adaptation. That is, the optimization method can be used recursively until the complexity of the sub-adaptation domain is reduced to a reasonable value.
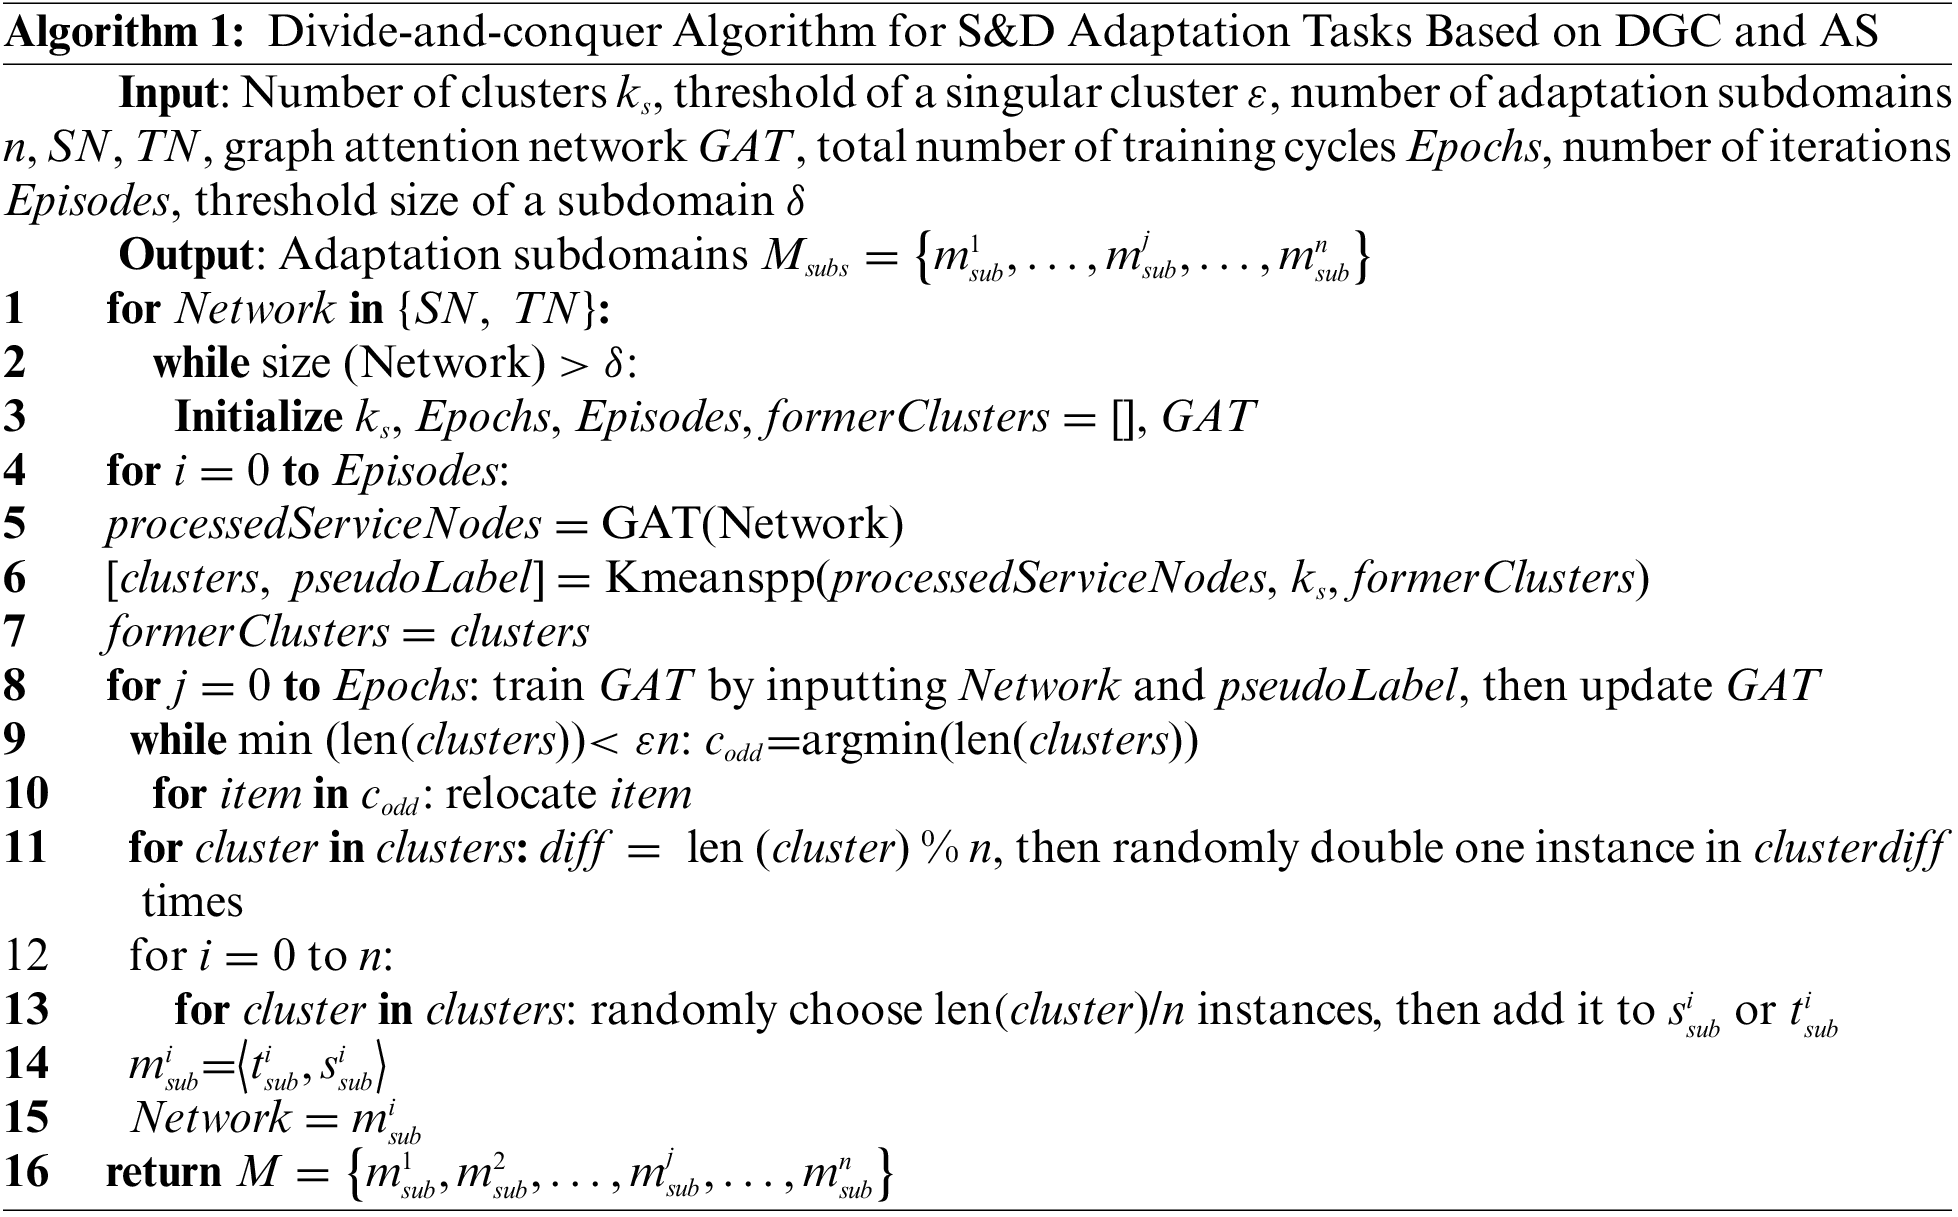
(3) Divide-and-conquer Algorithm Based on DGC and AS
To simplify the network model, first is to classify supplies and demands through DGC algorithm. Second, adaptation subdomains with similar distributions and less complexity are formed by applying AS to the clustered supply and demand instances. The divide-and-conquer algorithm for adaptation based on DGC and AS is shown in Algorithm 1:
3.2 Intelligent Solution to Adaptation Tasks Based on Deep Reinforcement Learning with Transfer Mechanism
The supplies and demands may appear or disappear at any time in SCM. The traditional optimization algorithm must address the problem that a tiny fluctuation will lead to a large change in the solution space. Therefore, this paper adopts the DRL algorithm, which has the abilities of migration and dynamic learning, to independently find the best adaptation scheme under a wide range of complicated decision-making [25]. At the same time, the parameters generated by DRL can be transferred among subdomains to improve the efficiency and results of adaptation tasks in other adaptation subdomains.
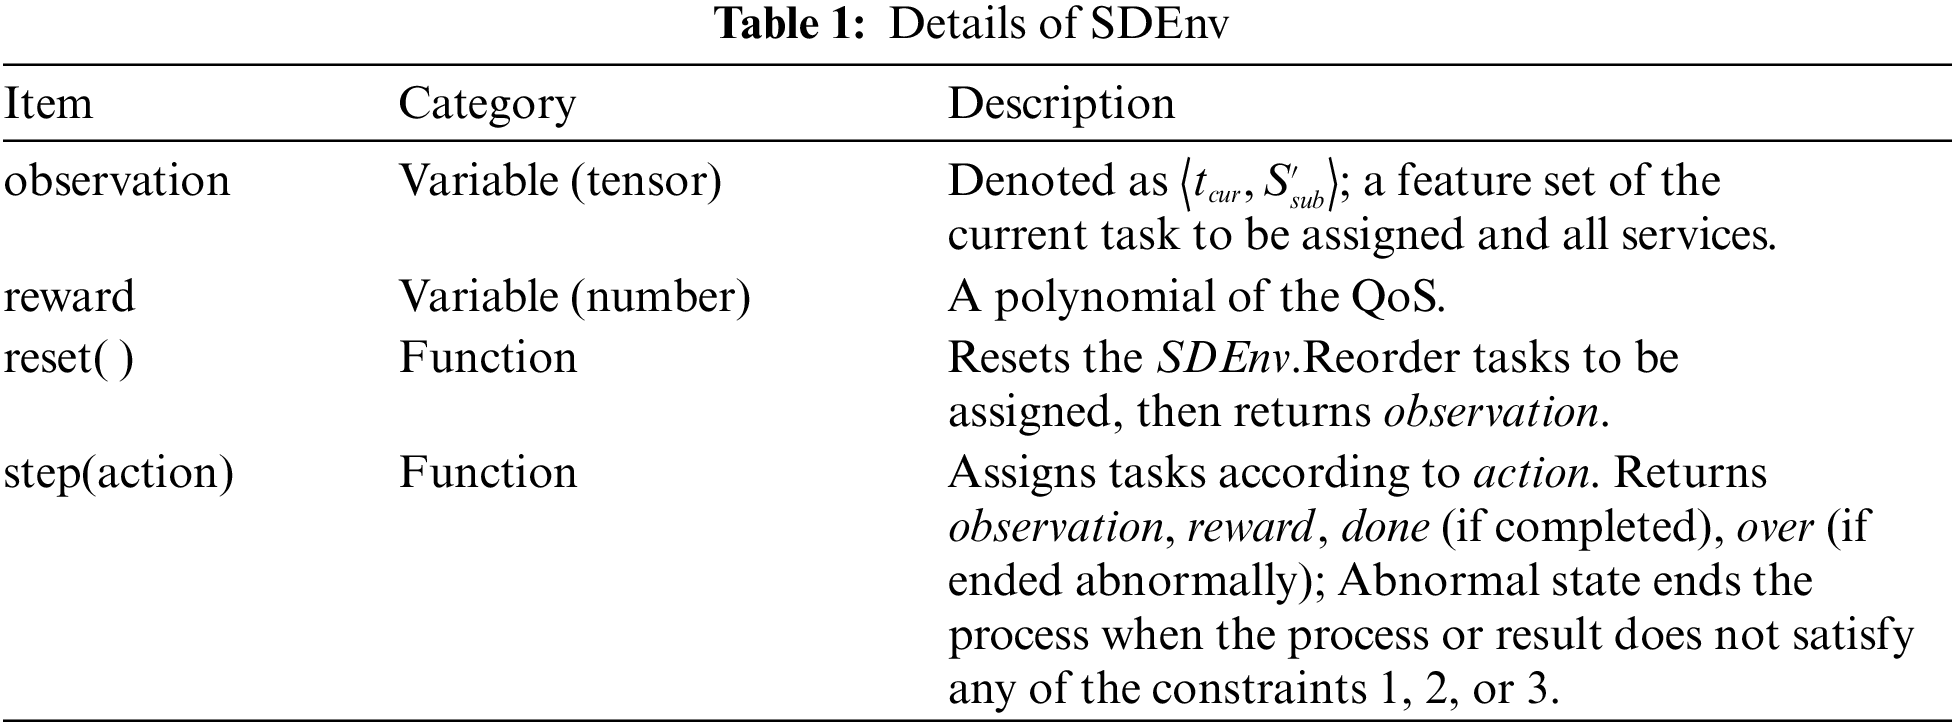
(1) Transformation of an Adaptation Task into an RL Problem
The adaptation environment in this paper is denoted as
(2) Collaborative Mechanism of S-D Adaptation Based on TL
The distributions among adaptation subdomains are similar, so the parameters of DRL can be transferred among subdomains at a low cost. Coupled with the randomness of DRL, it is easy to find the optimal strategy using parallel training. Therefore, we combine the parameter transfer mechanism with RL; that is, each subdomain performs an independent RL process and carries out parameter transfer among processes simultaneously. Transfer is achieved through an external shared parameter pool, where each process uploads its parameters to the pool and searches for better parameters from the pool to apply to itself according to the rules.
(3) Supply-demand Adaptation Algorithm Based on DRL Powered by a Transfer Mechanism
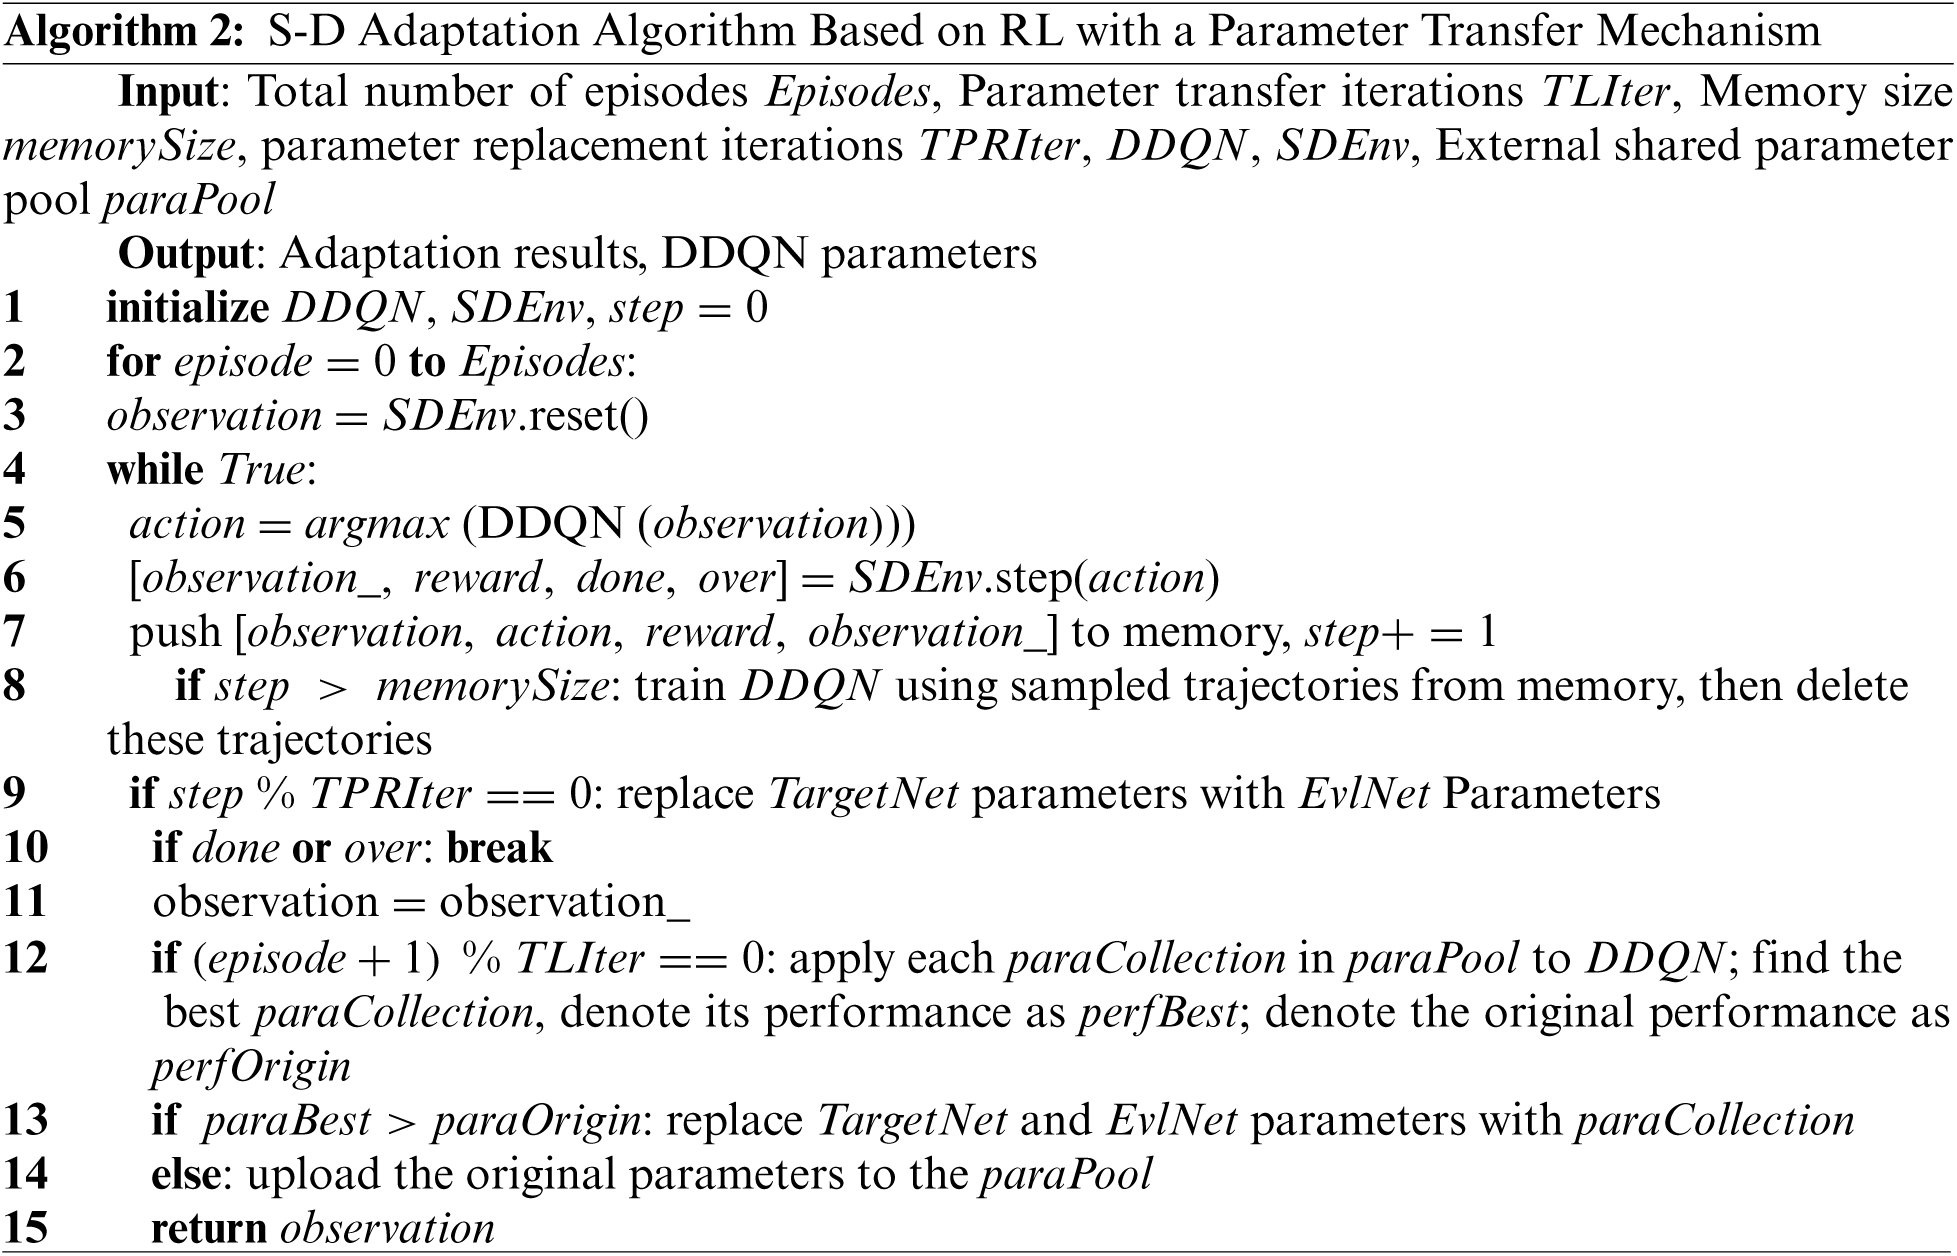
It is necessary to establish a proper external shared parameter pool to share the experiences and conduct transfer learning in order to perform supply-demand adaptation and result optimization. This paper takes the double DQN (DDQN) algorithm [27,28] as the baseline, as shown in Algorithm 2:
4 Analysis of Experimental Results
To verify the model and methods proposed in this paper, two experiments are designed. One aims to show the validity of the divide-and-conquer method for the adaptation domain, and the other aims to verify the effectiveness of the DRL powered by the transfer mechanism in performing the dynamic adaptation task. The experimental environment is set as follows: the hardware is an i7-9900k with 32 GB RAM and a GTX1080; the software is a Python 3.7.4 platform with CUDA 10.0, TensorFlow 1.14.0 and Ubuntu 16.04. For different experiments, the supply-demand service dataset, and the Cora dataset [29] are adopted in this paper. The service network in the supply-demand service dataset includes 100 nodes and 736 edges, and the task network has 400 nodes and 2,143 edges. The Cora dataset contains 2,708 nodes, 5,429 edges, and 7 types of nodes, each of which has 1,433 dimensions.
4.1 Results of the Divide-and-conquer Method Based on DGC
To achieve the intelligent dynamic adaptation of massive service resources, we propose a divide-and-conquer method based on DGC simplify the complex adaptation problem. In this experiment, both the Cora and the supply-demand service datasets are used to verify the validity of the method.
(1) Results on the Cora Dataset
In accordance with reference [30], the first 140 nodes in the dataset are selected for training, and the last 1000 nodes are selected for testing, while another 500 nodes are selected in the middle for cross-validation. The number of clusters is set to 7 according to the number of categories in the Cora dataset to obtain the best clustering results. Based on the parameter setting in reference [30] and the pretraining carried out before the experiment, the specific parameters are shown in Tab. 2:
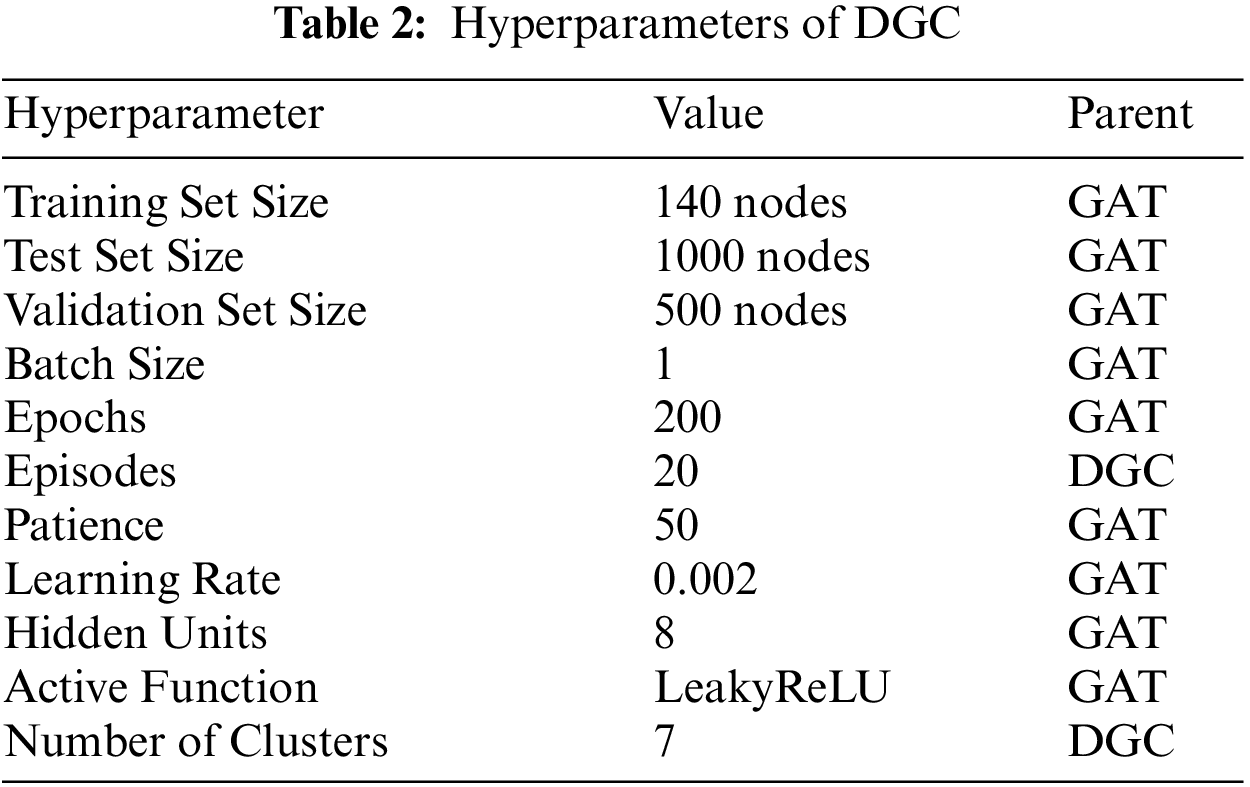
Where
The adjusted Rand index (ARI), adjusted mutual information (AMI)-based scores, the mean of homogeneity and completeness (V-measure), Fowlkes-Mallows scores and the silhouette coefficient (SC) are used to evaluate the clustering algorithms. Only the SC is used for situations where the ground truth is unknown; therefore, it is also used to evaluate the results on the supply-demand service dataset. We also use the results of K-means (KM), the Gaussian mixture model (GMM), the spectral clustering algorithm (SCA) and k-means++ (KMPP), which are implemented in scikit-learn, as comparisons. Since none of the above algorithms can properly process graph data, only the features of the nodes in the graph are considered, when clustering with these algorithms.
As shown in Fig. 4, the performance of DGC on various evaluation indicators increases with the number of iterations and tends to level off and eventually converge after 5-6 iterations. This is because the training of the DGC makes its neural network increasingly close to reality, leading to the correction and redistribution of pseudo-labels. The results of the clustering algorithms other than DGC fluctuate randomly, mainly because they have no “learning” process. Additionally, the result of the first episode of DGC is worse than that of its counterparts because the weights of the GAT are initialized randomly. It is also clear that the similarity between the results of DGC and the ground truth shows an obvious advantage over other traditional algorithms. That is, the results of DGC better represent the real categories of the original data.
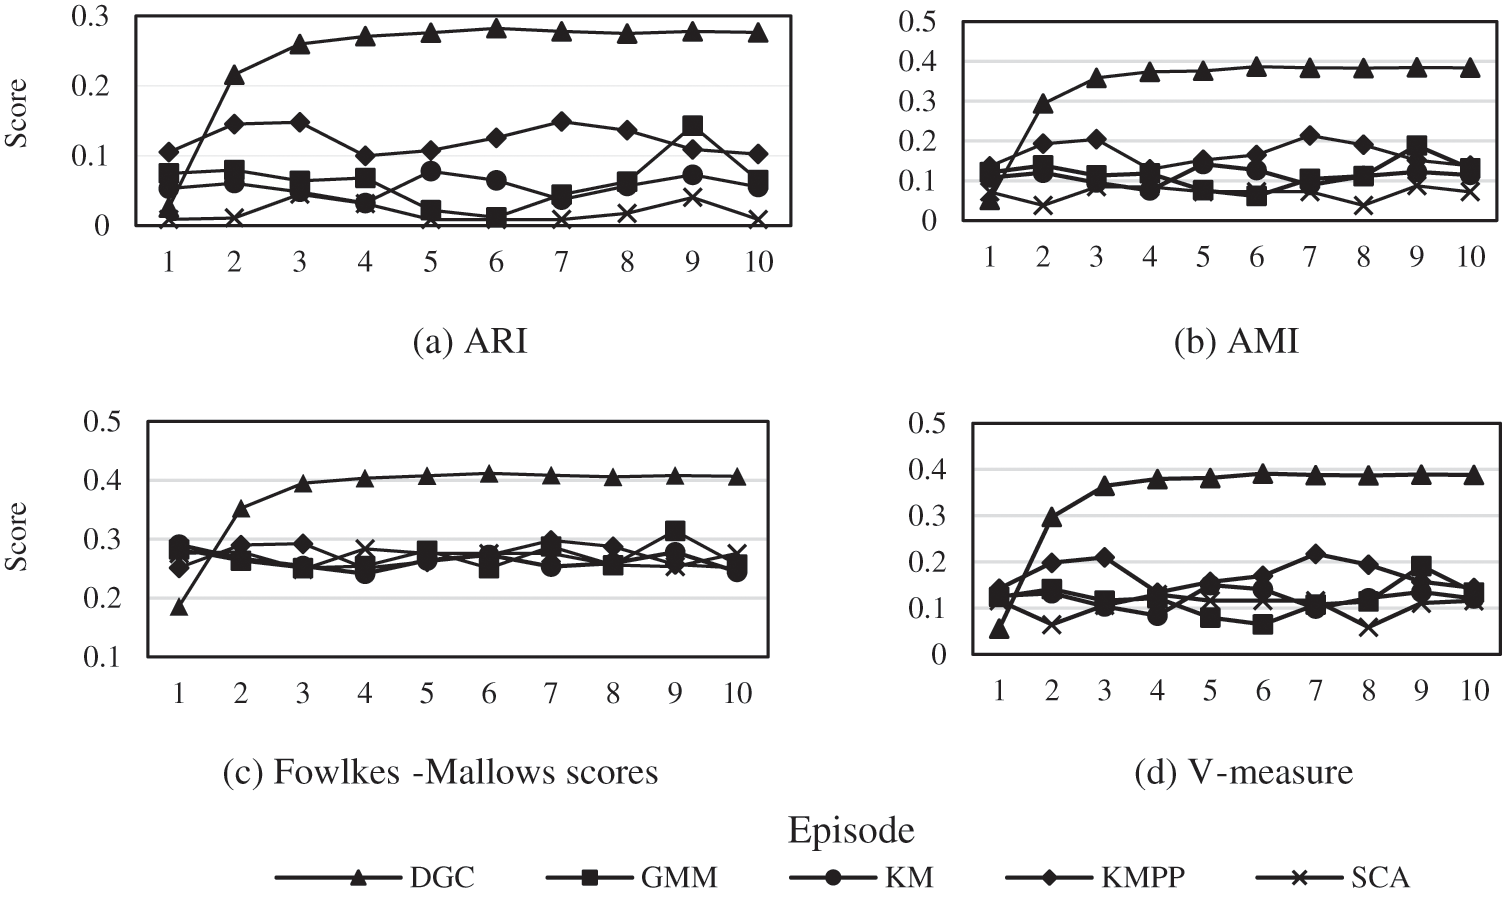
Figure 4: Performance of DGC on various evaluation indicators
Fig. 5a shows the variation in the number of samples in each cluster of DGC. In the first few episodes, it varies greatly because the DGC has not been fully trained. As training goes on, fewer samples are redistributed, and a balanced state is reached within approximately 5–6 episodes. This result is consistent with Fig. 4; that is, when the clustering results tend to be stable, the evaluation indicators also tend to be at their highest value. Fig. 5b shows the number of iterations required for the DGC and KMPP algorithms to converge. The KMPP algorithm fluctuates irregularly, while the DGC algorithm, as the neural network is trained, gradually reduces the number of iterations. Similarly, it reaches a balanced state at 5–6 episodes, which is consistent with the previous conclusion.
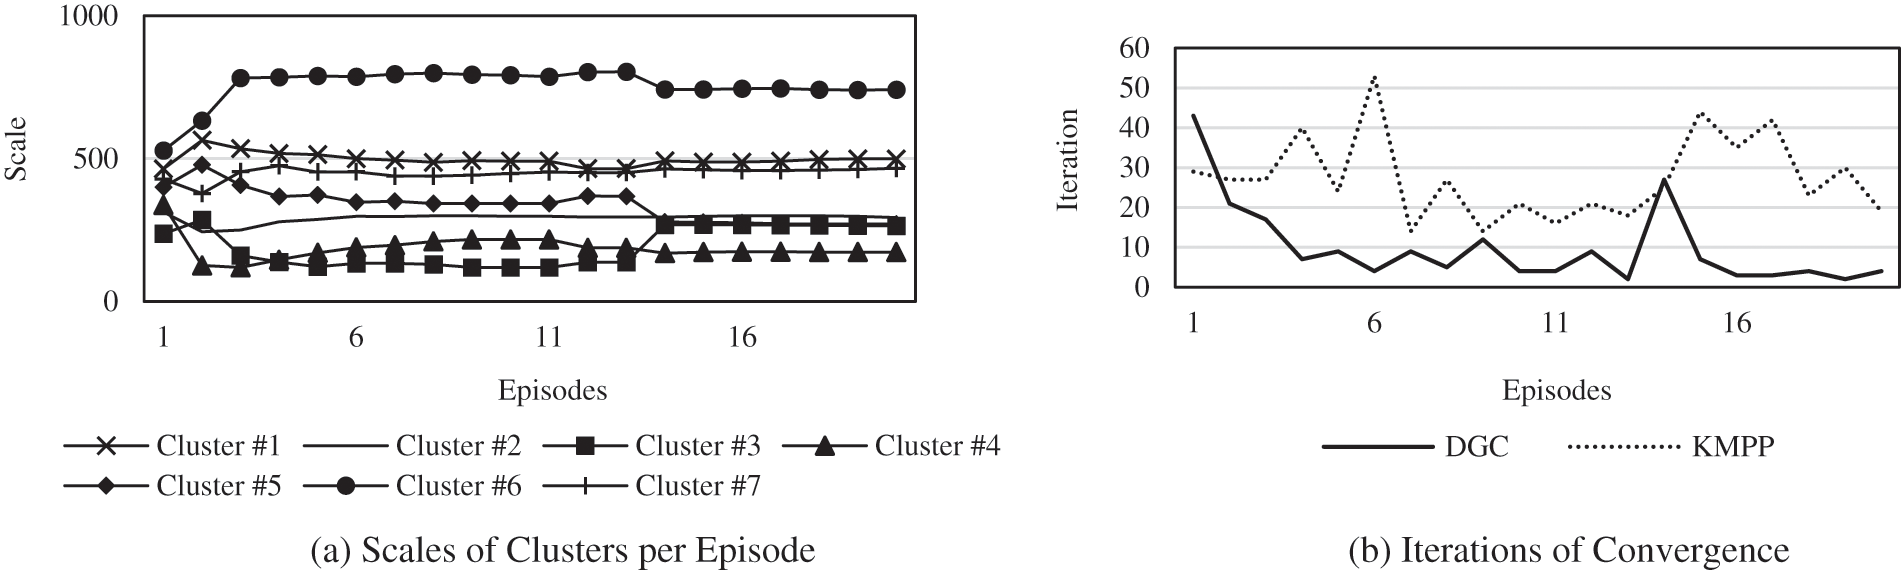
Figure 5: Details of the clustering process
(2) Results on the Supply-demand Service Dataset
The clustering result of the DGC algorithm on the task network and service network is also verified in this paper. We set different numbers of clustering categories and then calculate the mean value in each case. The results are shown in Fig. 6.
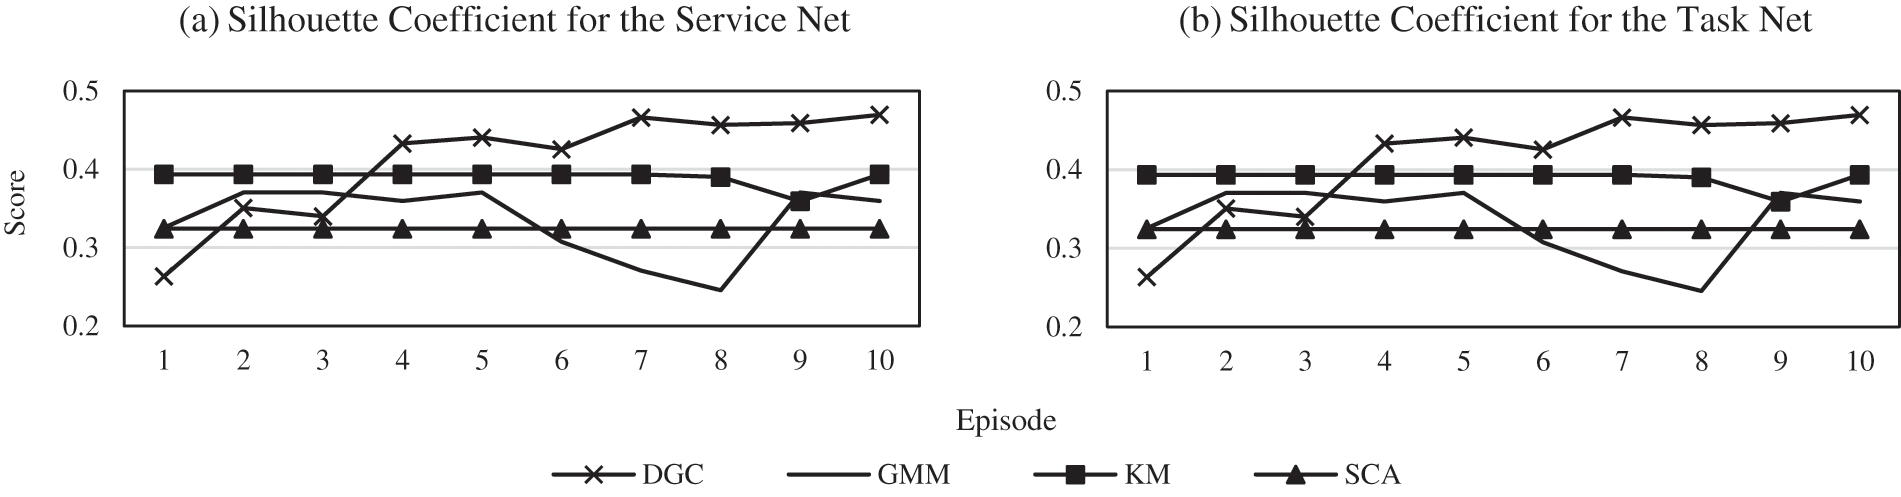
Figure 6: Performance of DGC on the supply-demand service dataset
Fig. 6 shows the results on the supply-demand service dataset and are consistent with the results on the Cora dataset. The clustering results of DGC improve as training deepens, and finally, it is far superior to the traditional algorithm. In summary, these experimental results show the effectiveness of the simplification method for the proposed collaborative network model. The divide-and-conquer algorithm based on DGC and AS can perform better classification and improve the distribution consistency between the adaptation subdomain and the entire domain. It also reduces the complexity of the intelligent adaptation algorithm and reduces the cost of the transfer of experience. Finally, it significantly reduces the difficulty of dynamic adaptation of large amounts of resources.
4.2 Results of the Divide-and-conquer Method Based on DGC
In Section 3, the problem of supply-demand adaptation was transformed into a problem of RL, and the DDQN algorithm, which has stable performance, was selected as the baseline for this problem. After some pretraining sets, the parameters of DDQN are shown in Tab. 3.
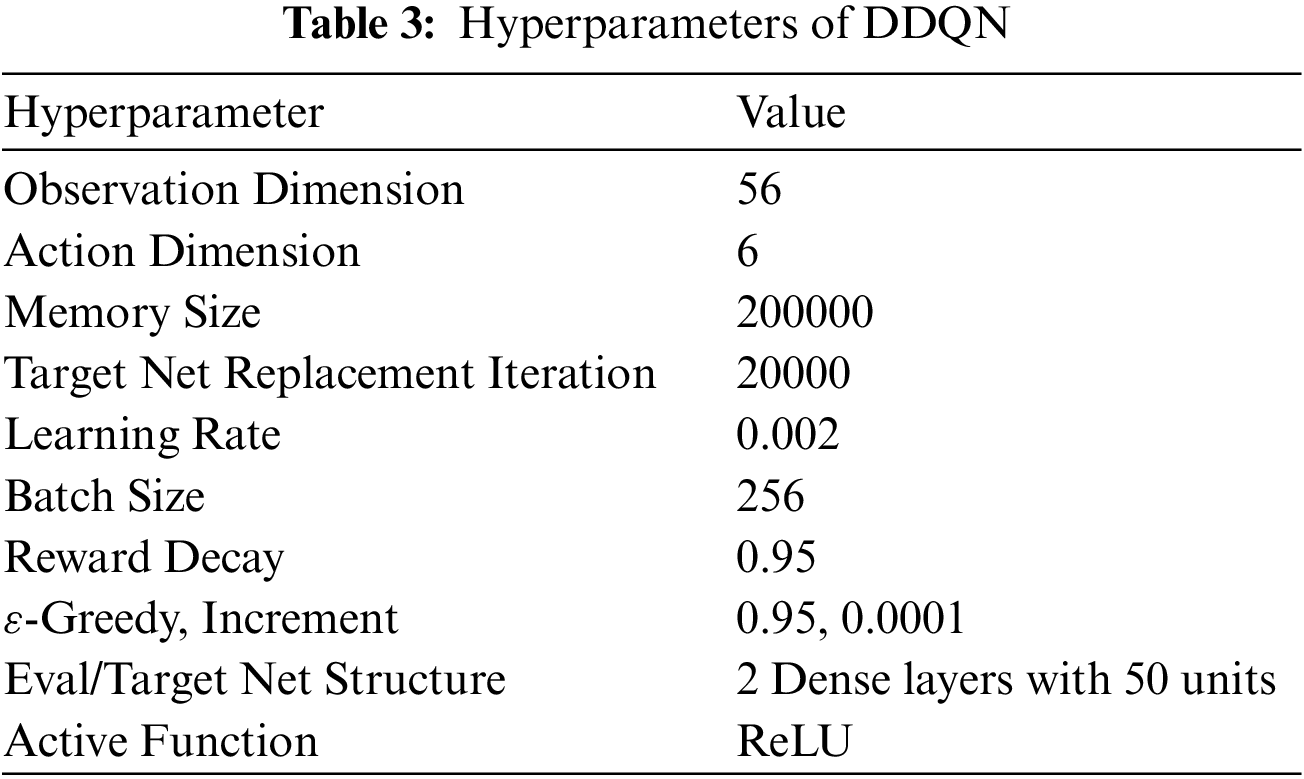
In this table, Memory Size represents the maximum number of trajectories stored in the playback library;
(1) Results of Intelligent Adaption
In this paper, the results of the intelligent supply-demand adaptation method for the model based on the generalized QoS are shown in Fig. 7.
Fig. 7 shows the changes in the normalized QoS value and the two evaluation indicators. As shown in the figure, the algorithm begins to learn in the 24th evaluation period after storing 200,000 experiences. Since the QoS function we set prefers the
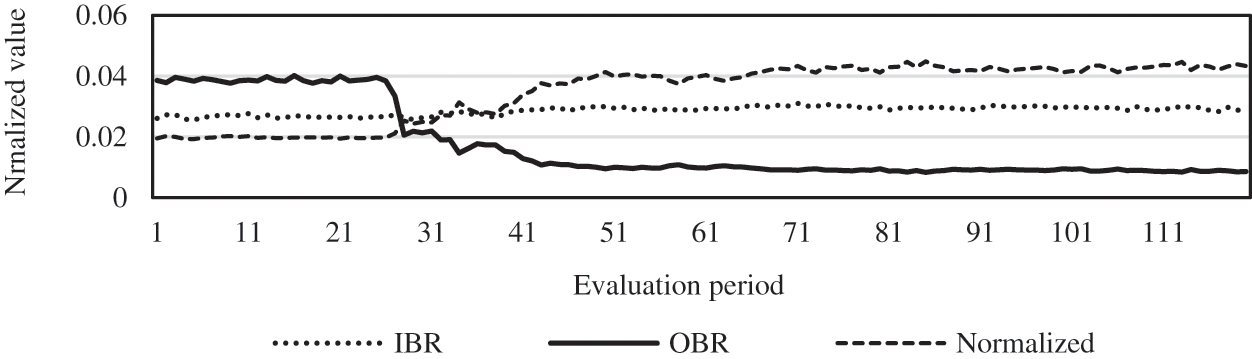
Figure 7: Results of the supply-demand adaptation
(2) Effectiveness in Solving the Dynamic Supply-demand Adaptation Problem
We studied the probability of completing the adaptation task and the change in the cumulative reward obtained after completion.
Fig. 8a shows the variation in the average failure rate of the adaptation tasks. For the subdomain, the failure rate reaches as high as 85% before learning begins, due to the random exploration of the DDQN. However, once learning starts, it rises briefly and then rapidly falls. After reaching a certain value, the failure rate declines slowly, with fluctuations, and eventually falls below 30%. This indicates that the RL algorithm has learned the law of supply-demand adaptation and is able to process the situation and then allocate the tasks effectively. In contrast, the adaptation task in the entire adaptation domain, which doesn’t adopt the divide-and-conquer method, cannot make any progress under the corresponding computational cost due to the large search space caused by the dimensional explosion. This indirectly demonstrates the practicality and effectiveness of the proposed divide-and-conquer method. Fig. 8b shows the change in the cumulative reward, which has the similar change law shown in Fig. 8a, and it also shows the effectiveness of the DRL algorithm in solving the problem of supply-demand adaptation.
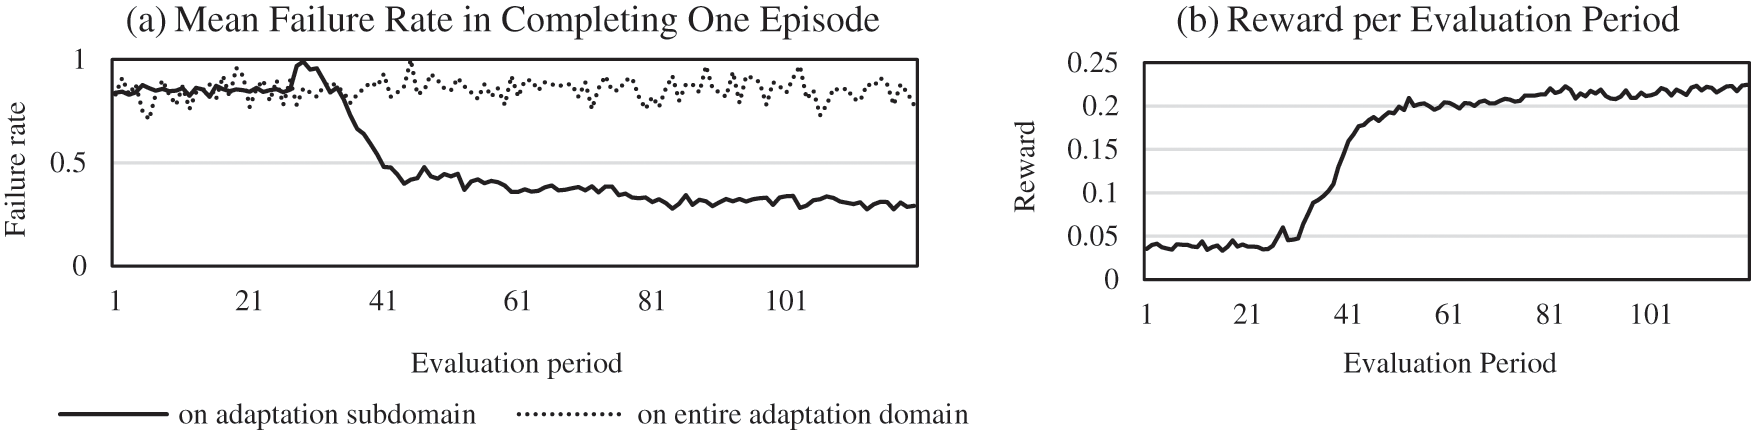
Figure 8: Progresses of the adaptation task along with training
In summary, RL has inherent advantages in solving dynamic supply-demand adaptation problems. When a task or service is introduced or removed, this algorithm can adapt according to previous experience without re-optimization, which greatly improves the efficiency of adaptation. Therefore, the method proposed in this paper can learn the laws of adaptation and can solve the dynamic adaptation problem.
(3) Advantages of TL in Solving Massive Supply-demand Adaptation Problems
In this paper, TL is used to share experiences in the adaptation subdomains to an external shared parameter pool as candidate experiences for other subdomains, and the performance improvements are investigated.
Fig. 9a shows the variation in the failure rate of the TL and non-TL methods. After the use of TL, the failure rate immediately decreases by approximately 30% compared with that of the non-TL method, indicating that the experience in the subdomain has some applicability. With the deepening of training, the final failure rate of TL is 5%–10% lower than that without TL, indicating that TL can improve the performance of adaptation. Fig. 9b shows how the rewards change, and the same conclusion can be drawn from this figure.
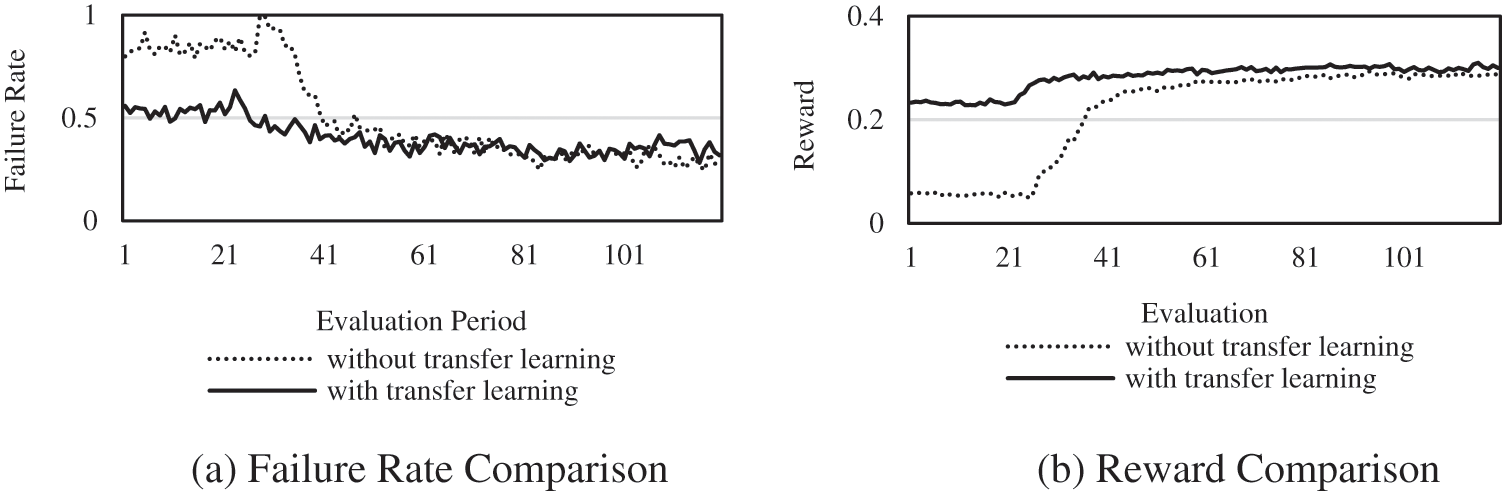
Figure 9: Comparison of methods with and without parameter transfer
We also recorded the change in the adaptation results and adaptation efficiency in each adaptation subdomain by turning the TL mechanism on and off.
As shown in Fig. 10a, the initial adaptation result of TL was greatly improved, with an average of 37.3% improvement in any subdomain. For the final adaptation result, there was an improvement in most cases, with the average reaching 4.7%. Fig. 10b shows a comparison of the number of evaluation periods needed with and without TL when achieving 80% of the optimal adaptation result. This indicator shows the advantage of TL in improving training efficiency. In most cases, TL has an advantage of more than 20 evaluation periods, and the mean number is 24.647.
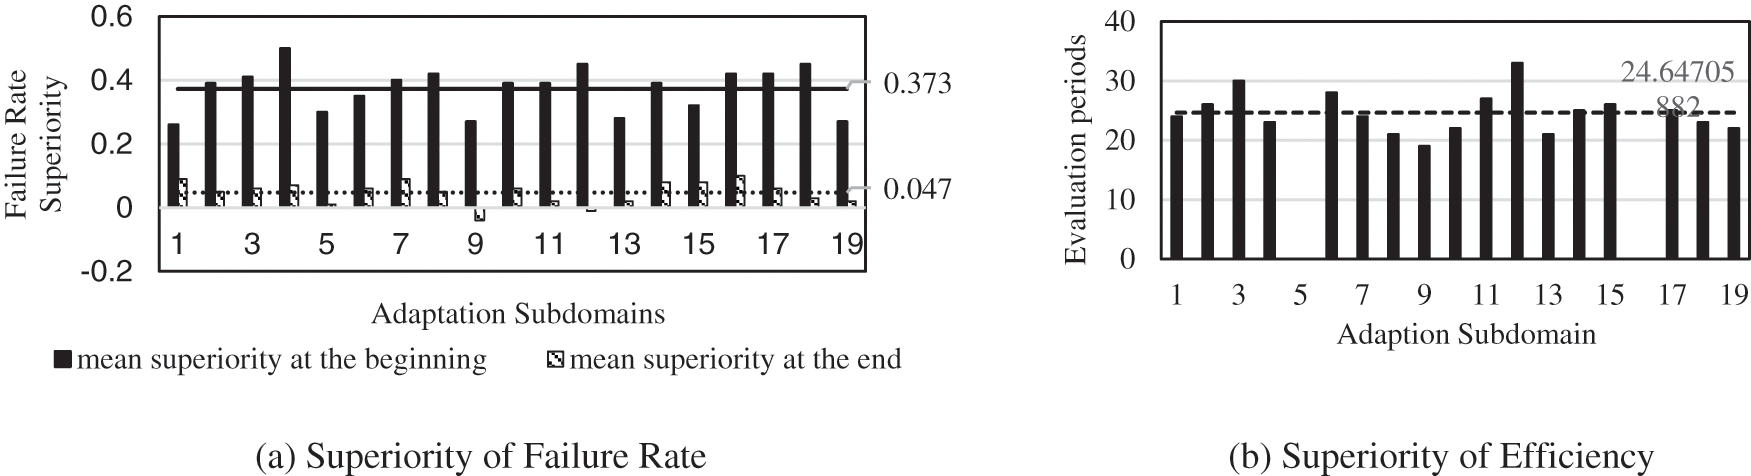
Figure 10: Overall advantages of TL
In summary, using TL to transfer parameters between adaptation subdomains can greatly improve not only the results but also the efficiency of adaptation. The excellent results of TL also indirectly show that there is a very similar distribution rule in the adaptation subdomains and the entire adaptation domain, which proves the great benefits of applying the divide-and-conquer method. Therefore, as a part of the framework proposed in this paper, TL greatly improves the ability to perform massive supply-demand adaptation.
This paper proposes a new dynamic supply-demand adaptation model that can handle the massive resources involved in SCM. The proposed model effectively solves the problem of highly dynamic and massive services caused by the expansion of cloud manufacturing. The goal is to simplify the adaptation tasks by a divide-and-conquer strategy and empower the model to cope with dynamic resources by transforming the adaptation task into an RL problem to achieve the collaborative, intelligent and intensive adaptation of the large amounts of dynamic service resources in SCM. In this article, TL is also used to share experiences among adaptation subdomains to further improve the synergy and efficiency of supply-demand adaptation.
The results of the experiments show that the dynamic supply-demand adaptation model proposed in this paper is reasonable. The divide-and-conquer method based on DGC can reduce both the complexity of intelligent supply-demand adaptation algorithms and the cost of transferring adaptation experiences. Additionally, the RL environment proposed in this paper can learn the laws of adaptation and can solve dynamic supply-demand adaptation problems. Furthermore, TL, as a part of the proposed divide-and-conquer framework, greatly improves the ability of the model to handle supply-demand adaptation tasks involving large amounts of service resources.
Acknowledgement: Thanks for the support and help of the team when writing the paper. Thanks to the reviewers and experts of your magazine for their valuable opinions on the article revision. This author has provided great inspiration when writing.
Funding Statement: This paper was supported in part by the National Natural Science Foundation of China under Grant 62172235, in part by Natural Science Foundation of Jiangsu Province of China under Grant BK20191381, in part by Primary Research & Development Plan of Jiangsu Province Grant BE2019742.
Conflicts of Interest: The authors declare that they have no conflicts of interest to report regarding the present study.
1. J. Almutairi and M. Aldossary, “Exploring and modelling iot offloading policies in edge cloud environments,” Computer Systems Science and Engineering, vol. 41, no. 2, pp. 611–624, 2022. [Google Scholar]
2. B. Li, L. Zhang and X. Chai, “Introduction to cloud manufacturing,” ZTE Communications, vol. 16, no. 4, pp. 5–8, 2010. [Google Scholar]
3. M. K. Lim, W. Xiong and Z. Lei, “Theory, supporting technology and application analysis of cloud manufacturing: a systematic and comprehensive literature review,” Industrial Management & Data Systems, vol. 120, no. 8, pp. 1585–1614, 2020. [Google Scholar]
4. H. Akbaripour, M. Houshmand, T. V. Woensel and N. Mutlu, “Cloud manufacturing service selection optimization and scheduling with transportation considerations: Mixed-integer programming models,” The International Journal of Advanced Manufacturing Technology, vol. 95, no. 1-4, pp. 43–70, 2018. [Google Scholar]
5. L. Wang, S. Guo, X. Li, B. Du and W. Xu, “Distributed manufacturing resource selection strategy in cloud manufacturing,” The International Journal of Advanced Manufacturing Technology, vol. 94, no. 9, pp. 3375–3388, 2018. [Google Scholar]
6. Y. J. Hu, L. T. Pan, D. W. Gu, Z. L. Wang, H. L. Liu et al., “Matching of manufacturing resources in cloud manufacturing environment,” Symmetry, vol. 13, no. 10, pp. 1970, 2021. [Google Scholar]
7. S. Wang, “An analysis of manufacturers supply and demand uncertainty based on the dynamic customization degree,” International Journal of Production Research, vol. 49, no. 10, pp. 3023–3043, 2011. [Google Scholar]
8. R. W. Salem and M. Haouari, “A simulation-optimization approach for supply chain network design under supply and demand uncertainties,” International Journal of Production Research, vol. 55, no. 7, pp. 1845–1861, 2017. [Google Scholar]
9. A. Jabbarzadeh, B. Fahimnia and J.-B. Sheu, “An enhanced robustness approach for managing supply and demand uncertainties,” International Journal of Production Economics, vol. 183, no. 1/2, pp. 620–631, 2017. [Google Scholar]
10. X. Gong, C. Yin and X. Li, “A grey correlation based supply-demand matching of machine tools with multiple quality factors in cloud manufacturing environment,” Journal of Ambient Intelligence and Humanized Computing, vol. 10, no. 3, pp. 1025–1038, 2019. [Google Scholar]
11. X. Luo, L. Zhang, L. Ren and Y. Lali, “A dynamic and static data based matching method for cloud 3D printing,” Robotics and Computer-Integrated Manufacturing, vol. 61, no. 4, pp. 101858, 2020. https://doi.org/10.1016/j.rcim.2019.101858. [Google Scholar]
12. H. Rau, S. D. Budiman and C. N. Monteiro, “Improving the sustainability of a reverse supply chain system under demand uncertainty by using postponement strategies,” Waste Management, vol. 131, pp. 72–87, 2021https://doi.org/10.1016/j.wasman.2021.05.018. [Google Scholar]
13. H. Zheng and D. Shi, “A multi-agent system for environmental monitoring using Boolean networks and reinforcement learning,” Journal of Cyber Security, vol. 2, no. 2, pp. 85–96, 2020. [Google Scholar]
14. S. Čaušević, M. Warnier and F. M. T. Brazier, “Dynamic, self-organized clusters as a means to supply and demand matching in large-scale energy systems,” in Proc. of the 2017 IEEE 14th Int. Conf. on Networking, Sensing and Control (ICNSC), Italy, Calabria, pp. 568–573, 2017https://10.1109/ICNSC.2017.8000154 [Google Scholar]
15. W. Chen and I. Paik, “Toward better quality of service composition based on a global social service network,” IEEE Transactions on Parallel and Distributed Systems, vol. 26, no. 5, pp. 1466–1476, 2015. [Google Scholar]
16. J. Zhou and X. Yao, “Multi-population parallel self-adaptive differential artificial bee colony algorithm with application in large-scale service composition for cloud manufacturing,” Applied Soft Computing, vol. 56, no. 5, pp. 379–397, 2017. [Google Scholar]
17. J. Salpakari, J. Mikkola and P. D. Lund, “Improved flexibility with large-scale variable renewable power in cities through optimal demand side management and power-to-heat conversion,” Energy Conversion and Management, vol. 126, no. 2014, pp. 649–661, 2016. [Google Scholar]
18. Y. Cheng, F. Tao, D. Zhao and L. Zhang, “Modeling of manufacturing service supply-demand matching hypernetwork in service-oriented manufacturing systems,” Robotics and Computer-Integrated Manufacturing, vol. 45, no. 10, pp. 59–72, 2017. [Google Scholar]
19. Y. Cheng, Y. Xie, D. Zhao, P. Ji and F. Tao, “Scalable hypernetwork-based manufacturing services supply demand matching toward industrial internet platforms,” IEEE Transactions on Systems, Man, and Cybernetics: Systems, vol. 50, no. 12, pp. 5000–5014, 2020. [Google Scholar]
20. R. Hao, Y. Cheng, Y. Zhang and F. Tao, “Manufacturing service supply-demand optimization with dual diversities for industrial internet platforms,” Computers & Industrial Engineering, vol. 156, no. 5, pp. 107237, 2021. https://doi.org/10.1016/j.cie.2021.107237. [Google Scholar]
21. Y. Hu, F. Tao, D. Zhao and Z. Zhou, “Manufacturing grid resource and resource service digital description,” International Journal of Advanced Manufacturing Technology, vol. 44, no. 9, pp. 1024–1035, 2009. [Google Scholar]
22. L. Zhou, L. Zhang, L. Ren and J. Wang, “Real-time scheduling of cloud manufacturing services based on dynamic data-driven simulation,” IEEE Transactions on Industrial Informatics, vol. 15, no. 9, pp. 5042–5051, 2019. [Google Scholar]
23. S. Lee, “A study on classification and detection of small moths using cnn model,” Computers, Materials & Continua, vol. 71, no. 1, pp. 1987–1998, 2022. [Google Scholar]
24. M. Caron, P. Bojanowski, A. Joulin and M. Douze, “Deep clustering for unsupervised learning of visual features,” in presented at the Proc. of the European Conf. on Computer Vision (ECCV), Germany, Munich, pp. 132–149, 2018. [Google Scholar]
25. M. Shoab and A. S. Alotaibi, “Deep q-learning based optimal query routing approach for unstructured p2p network,” Computers, Materials & Continua, vol. 70, no. 3, pp. 5765–5781, 2022. [Google Scholar]
26. H. Mao, M. Alizadeh, I. Menache and S. Kandula, “Resource management with deep reinforcement learning,” in Proc. of the 15th ACM Workshop on Hot Topics in Networks, Atlanta, GA, USA, HotNets-XV, pp. 50–56, 2016. [Google Scholar]
27. H. van Hasselt, A. Guez and D. Silver, “Deep reinforcement learning with double q-learning,” in Thirtieth AAAI Conf. on Artificial Intelligence, Worldwide, AAAI Press,30, pp. 2094–2100, 2016. [Google Scholar]
28. S. Sun, J. Zhou, J. Wen, Y. Wei and X. Wang, “A dqn-based cache strategy for mobile edge networks,” Computers, Materials & Continua, vol. 71, no. 2, pp. 3277–3291, 2022. [Google Scholar]
29. T. Kipf and M. Welling, “Semi-supervised classification with graph convolutional networks,” in 5th Int. Conf. on Learning Representations (ICLR), France, Toulon: OpenReview.net, pp. 1–14, 2017. [Google Scholar]
30. P. Veličković, G. Cucurull, A. Casanova, A. Romero, P. Liò et al., “Graph attention networks,” in 6th Int. Conf. on Learning Representations (ICLR), Vancouver, BC, Canada: OpenReview.net, pp. 1–12, 2018. [Google Scholar]
 | This work is licensed under a Creative Commons Attribution 4.0 International License, which permits unrestricted use, distribution, and reproduction in any medium, provided the original work is properly cited. |