DOI:10.32604/cmc.2022.026621
| Computers, Materials & Continua DOI:10.32604/cmc.2022.026621 | |
| Article |
Ransomware Classification Framework Using the Behavioral Performance Visualization of Execution Objects
Department of Computer and Information Security, and Convergence Engineering for Intelligent Drone, Sejong University, Seoul, 05006, Korea
*Corresponding Author: Ki-Woong Park. Email: woongbak@sejong.ac.kr
Received: 25 January 2022; Accepted: 22 February 2022
Abstract: A ransomware attack that interrupted the operation of Colonial Pipeline (a large U.S. oil pipeline company), showed that security threats by malware have become serious enough to affect industries and social infrastructure rather than individuals alone. The agents and characteristics of attacks should be identified, and appropriate strategies should be established accordingly in order to respond to such attacks. For this purpose, the first task that must be performed is malware classification. Malware creators are well aware of this and apply various concealment and avoidance techniques, making it difficult to classify malware. This study focuses on new features and classification techniques to overcome these difficulties. We propose a behavioral performance visualization method using utilization patterns of system resources, such as the central processing unit, memory, and input/output, that are commonly used in performance analysis or tuning of programs. We extracted the usage patterns of the system resources for ransomware to perform behavioral performance visualization. The results of the classification performance evaluation using the visualization results indicate an accuracy of at least 98.94% with a 3.69% loss rate. Furthermore, we designed and implemented a framework to perform the entire process—from data extraction to behavioral performance visualization and classification performance measurement—that is expected to contribute to related studies in the future.
Keywords: Behavioral performance visualization; ransomware; malware classification
A ransomware attack that interrupted the operation of Colonial Pipeline, a large oil pipeline company in the United States, occurred in 2021. A hacking group called DarkSide was responsible for the attack, and the pipeline operations were all stopped suddenly [1]. The attack demonstrated that security threats posed by malware have now become serious enough to affect industries and social infrastructure rather than individuals alone. In the past, attackers targeted many unspecified people; moreover, if malware was detected and removed quickly, further damage could be prevented, and the scale of the damage was limited. The goal of such attacks was mostly to spread massive amounts of malware in order to form a botnet or use it for bitcoin mining [2,3]. In recent years, attacks toward specific companies or social infrastructure have increased, and consequently, the extent of the damage has increased excessively. Ransomware, which causes the most serious damage, initially targeted unspecified people; however, ransomware has recently been attacking specific targets persistently until the attack succeeds. Furthermore, the goal of attacks is not only to demand money through data encryption but also to leak corporate information, leading to secondary damage [4]. Since attackers’ goals, targets, and methods are changing, response strategies must also be modified in order to block attacks. Targeted attacks cannot be blocked by standardized responses that simply detect and remove malware. Appropriate strategies should be established by identifying the agents and characteristics of the attacks. To this end, a classification of detected malware should be performed first to identify the malware. If the classification result shows that the malware is already known, the attacker who has used that particular malware can be identified. If the attacker is identified, the goal or method of the attack that was performed in the past can be determined. Based on this, the attack in progress and future ones can be predicted. Thus, a response strategy can be established, such as enhancing monitoring or patching the vulnerabilities that the attacker uses. Therefore, malware classification for identifying the attacker is an important task for the establishment of a response strategy.
To classify malware, features should be extracted from it. Traditional malware analysis techniques are mostly used for feature extraction, and a static code analysis-based method or behavior observation-based dynamic analysis method is usually used [5,6]. Attackers are well aware of this and create malware by employing various concealment and avoidance techniques to interfere with malware classification, making feature extraction difficult [7]. In most static analyses, code is first analyzed to extract the necessary information, but the analysis of malware that uses concealment techniques is not easy. Although it is possible if an experienced analyst uses a professional program, the task would require considerable time and effort. Therefore, in this case, it is difficult in practice to extract features from malware using concealment techniques.
Further, dynamic analysis is a method that can be applied to malware when static analysis is difficult to perform because it monitors its actual behavior. However, it requires a monitoring program for the behavior of malware and a limited analysis environment. Malware creators have been using this fact to their advantage and have developed various avoidance techniques, such as not performing malicious behavior for a long period or terminating execution immediately if the malware determines that a monitoring program is running or it identifies the running environment. Thus, even in the case of dynamic analysis, the features required for classification are difficult to extract from malware that employs avoidance techniques. In recent years, as in other security fields, artificial intelligence (AI) techniques such as machine learning and deep learning have often been used in the field of malware classification [8]. Nevertheless, it is difficult to classify malware equipped with various concealment and avoidance techniques because the features are extracted using a traditional malware analysis method. To overcome the difficulties faced by traditional methods, research is required to facilitate feature extraction from malware that uses concealment and avoidance techniques. Moreover, it is necessary to conduct research on new features that can be used in malware classification as well as classification techniques.
In this study, we focused on system resources such as the central processing unit (CPU), memory, and input/output (I/O), which are commonly used in performance analysis or the tuning of programs. The reason for focusing on system resources is the characteristics of programs that use resources such as the CPU, memory, and I/O as the code is executed to perform certain functions. Furthermore, programs use system resources in various forms depending on the libraries used in the software development, the code writing method, and the flow of code for performing the function. Since malware is also a program, it uses system resources in various forms while running, and these can be used as features to distinguish the malware. Indeed, using this approach makes it more challenging to analyze the malicious behavior of malware in as much detail as it could be using method calls or other dynamic analysis methods, but such detailed analysis is not needed to classify malware. Furthermore, the system resource usage data can be extracted for malware equipped with various concealment and avoidance techniques because they are basic performance metrics that can be obtained from the system. However, even if the usage information of the system resources can be extracted, it does not necessarily mean that the features that can classify malware will be readily available. Performance metrics are time-series data that change in real time and are of various types. To determine unique malware features, we investigated the metrics that should be selected, the extraction method that should be used, and how to visualize the extracted data. In addition, we conducted experiments with ransomware to confirm that malware can be classified using the usage patterns of the system resources. Ransomware is suitable for measuring classification performance because it has been the most harmful malware so far and various types exist.
The first contribution of this study is the proposed behavioral performance visualization method using the usage patterns of system resources and a demonstration of its usability in malware classification through a classification performance evaluation. The proposed method can be utilized in a malware classification system because the unique characteristics of malware can be represented by the visualization results. Moreover, the proposed method can assist analysts in practice because it enables them to visually identify the similarities and differences between malware. Furthermore, its suitability for use with AI techniques was confirmed by assessing the classification performance using deep learning, which is widely used in image classification. Second, a framework was designed and implemented to perform the entire process, from data extraction to behavioral performance visualization and classification performance measurement. The design and implementation of this framework are expected to help related research and be useful in practice.
The structure of the remainder of this paper is as follows. Section 2 examines related studies, and Section 3 describes the behavioral performance visualization method using usage patterns of system resources. Section 4 explains the design and implementation of the framework for behavioral performance visualization, and Section 5 discusses the results of the proposed method and classification. Finally, Section 6 summarizes the conclusions and future plans.
Most studies on malware classification focus on extracting features using traditional malware analysis methods and classifying malware using machine learning or deep learning [9]. In this section, we examine studies that have attempted to classify malware through visualizing features extracted from the malware.
2.1 Visualization of a Malware File as an Image
Among the studies that attempted to visualize features of malware, the study presented in [10] visualized the file itself as an image. In this method, a malware file is read as binary data (vectors of 8-bit unsigned integers) and converted into a grayscale image, as shown in Fig. 1. The converted image has different characteristics (shape or texture) of the image depending on the type of malware, and this method uses these differences to detect and classify malware.

Figure 1: Reading a malware file as binary data and converting it into an image
The study showed that when malware files are visualized as images based on static features, there are differences among the malware types. It also demonstrated that malware could be classified without code analysis, such as decompiling (disassembling) malware, unlike conventional static analysis methods. Given that features are visualized as images, follow-up studies have been continually conducted to classify malware using AI techniques such as deep learning, which has shown high performance in image classification.
2.2 Visualization of the Behavior of Malware as an Image
The study described in [11] visualized application programming interface (API) calls in the user mode to classify malware. This method classifies high-risk and relatively less risky APIs in terms of the possibility that user APIs are used maliciously and represents them using a color map, as shown in Fig. 2a. If the API calls of malware are visualized using this method, they are expressed differently depending on the malware type, as shown in Fig. 2b. The study demonstrated that when API call information (the dynamic features of malware) is used and visualized, the result varies depending on the malware type. Furthermore, it showed that the characteristics of malware can be better revealed when API call information is visualized instead of simply listed.

Figure 2: (a) API and color map, (b) visualization results of three malware types
2.3 Malware Detection Using the Usage Patterns of System Resources
As shown in Fig. 3, the study in [12] used the changes in CPU and random access memory (RAM) usage before and after running malware in a certain system environment to detect certain types of malware. The study proposed a method that uses a one class support vector machine (OC-SVM) [13,14], which is a machine learning algorithm, to detect changes in CPU and RAM usage before and after running malware distributed through a drive-by download [15].

Figure 3: Differences in CPU and RAM usage in a specific system environment
Given that the CPU and RAM usage of the entire system was used, significant differences could occur in the measured data depending on the system condition at the time of measurement, even in the same system environment; thus, it was difficult to determine the specific time for measuring data. Despite these limitations, the study was important because usage patterns of system resources—CPU and RAM—were used as features for malware detection.
3 Behavioral Performance Visualization Method Using the Usage Patterns of System Resources
In this section, we describe the behavioral performance visualization method that specifies unique features required in malware classification using the usage patterns of system resources (such as CPU, memory, and I/O).
3.1 Overview of Behavioral Performance Visualization
Features that are extracted from a specific type of malware must be distinguishable from those of other malware types to classify the malware. In this study, we focus on the usage patterns of systems resources (such as CPU, memory, and I/O) because malware is also a program. A program uses system resources depending on the libraries used in its development, the method of writing code, and the flow of code for executing a certain function. Given that malware is a program, it uses system resources in various forms when running. Furthermore, because system resource usage derives from basic performance metrics that can be obtained from the system, they can be extracted even for malware in which various concealment and avoidance techniques have been applied. Usage patterns of system resources are time-series data of performance metrics called system resource usage metrics, which appear as the program performs certain behaviors. If the extracted data are normalized and visualized, unique characteristics that are distinguishable from those of other malware types appear, and they can be used as the features for malware classification. Fig. 4 shows an overview of behavioral performance visualization using the usage patterns of system resources.

Figure 4: Overview of behavioral performance visualization using the usage patterns of system resources
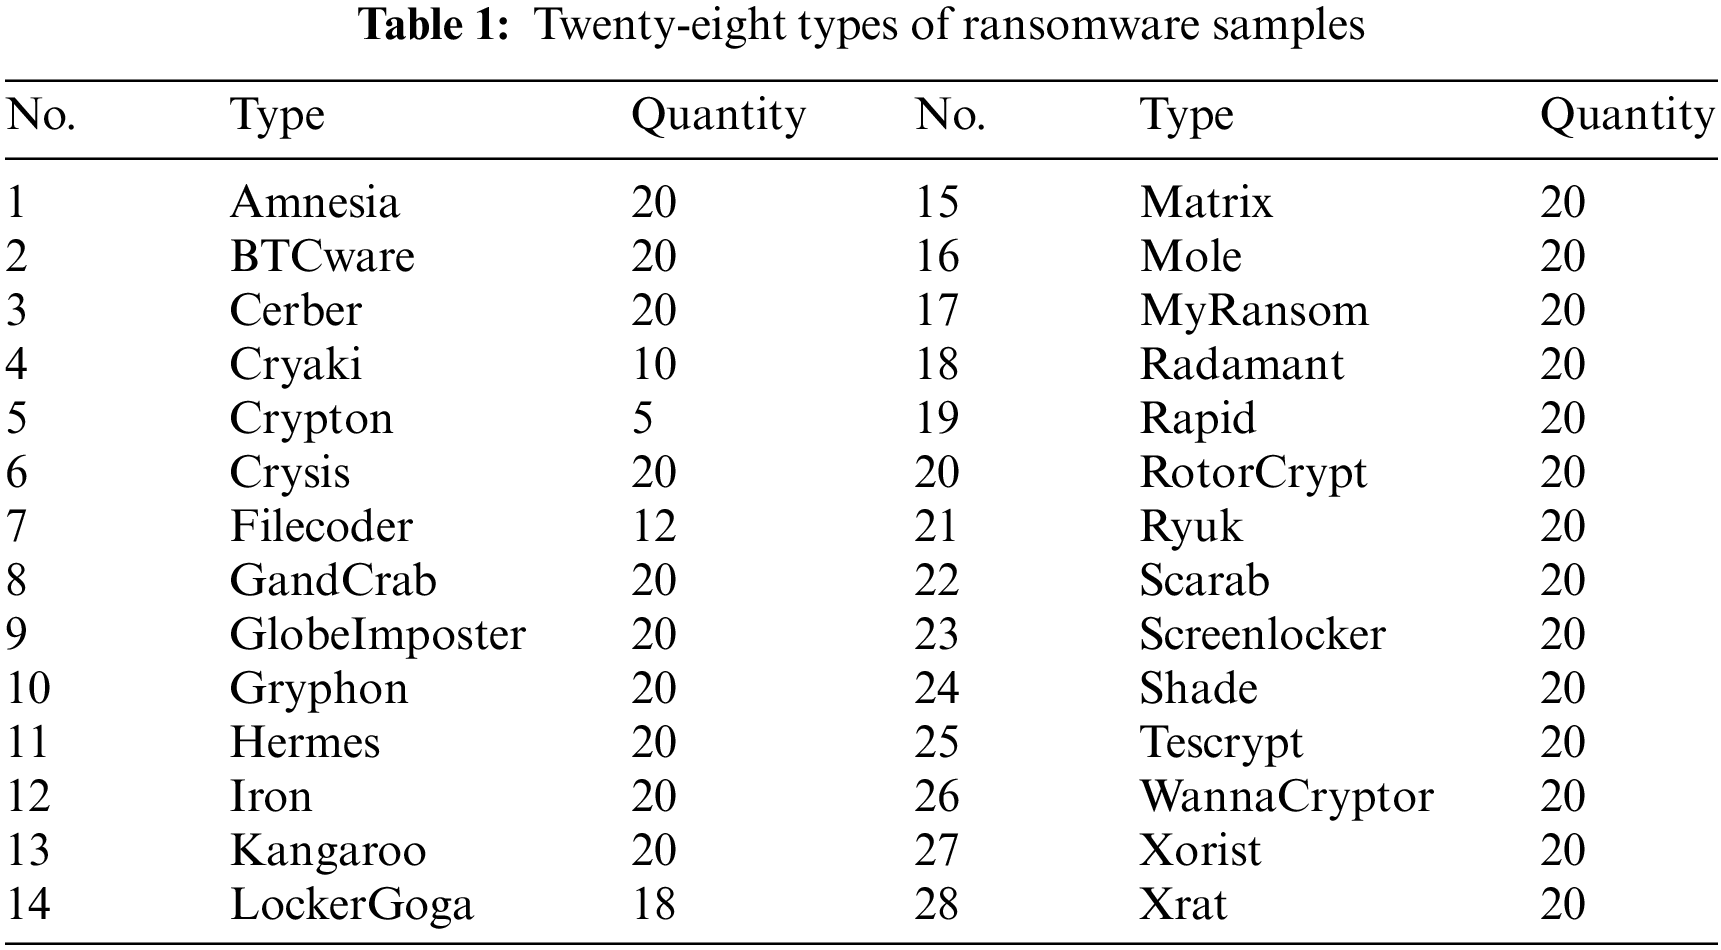
3.2 Selection of the Ransomware Samples
We collected 525 samples of 28 ransomware types from ransomware that was registered between 2018 and 2020 in VirusTotal [16]. The reason for choosing ransomware instead of other types of malware is that it has been the most harmful malware so far, and it is suitable for measuring classification performance because there are a variety of types whereas the file encryption functions are similar. Tab. 1 lists the types of malware samples.
3.3 Selection of Extracted Data and Extraction Method
We chose 12 metrics for the system resources, as listed in Tab. 2. They reflect the execution features of malware quite well, and the relevant usage patterns can be easily extracted.
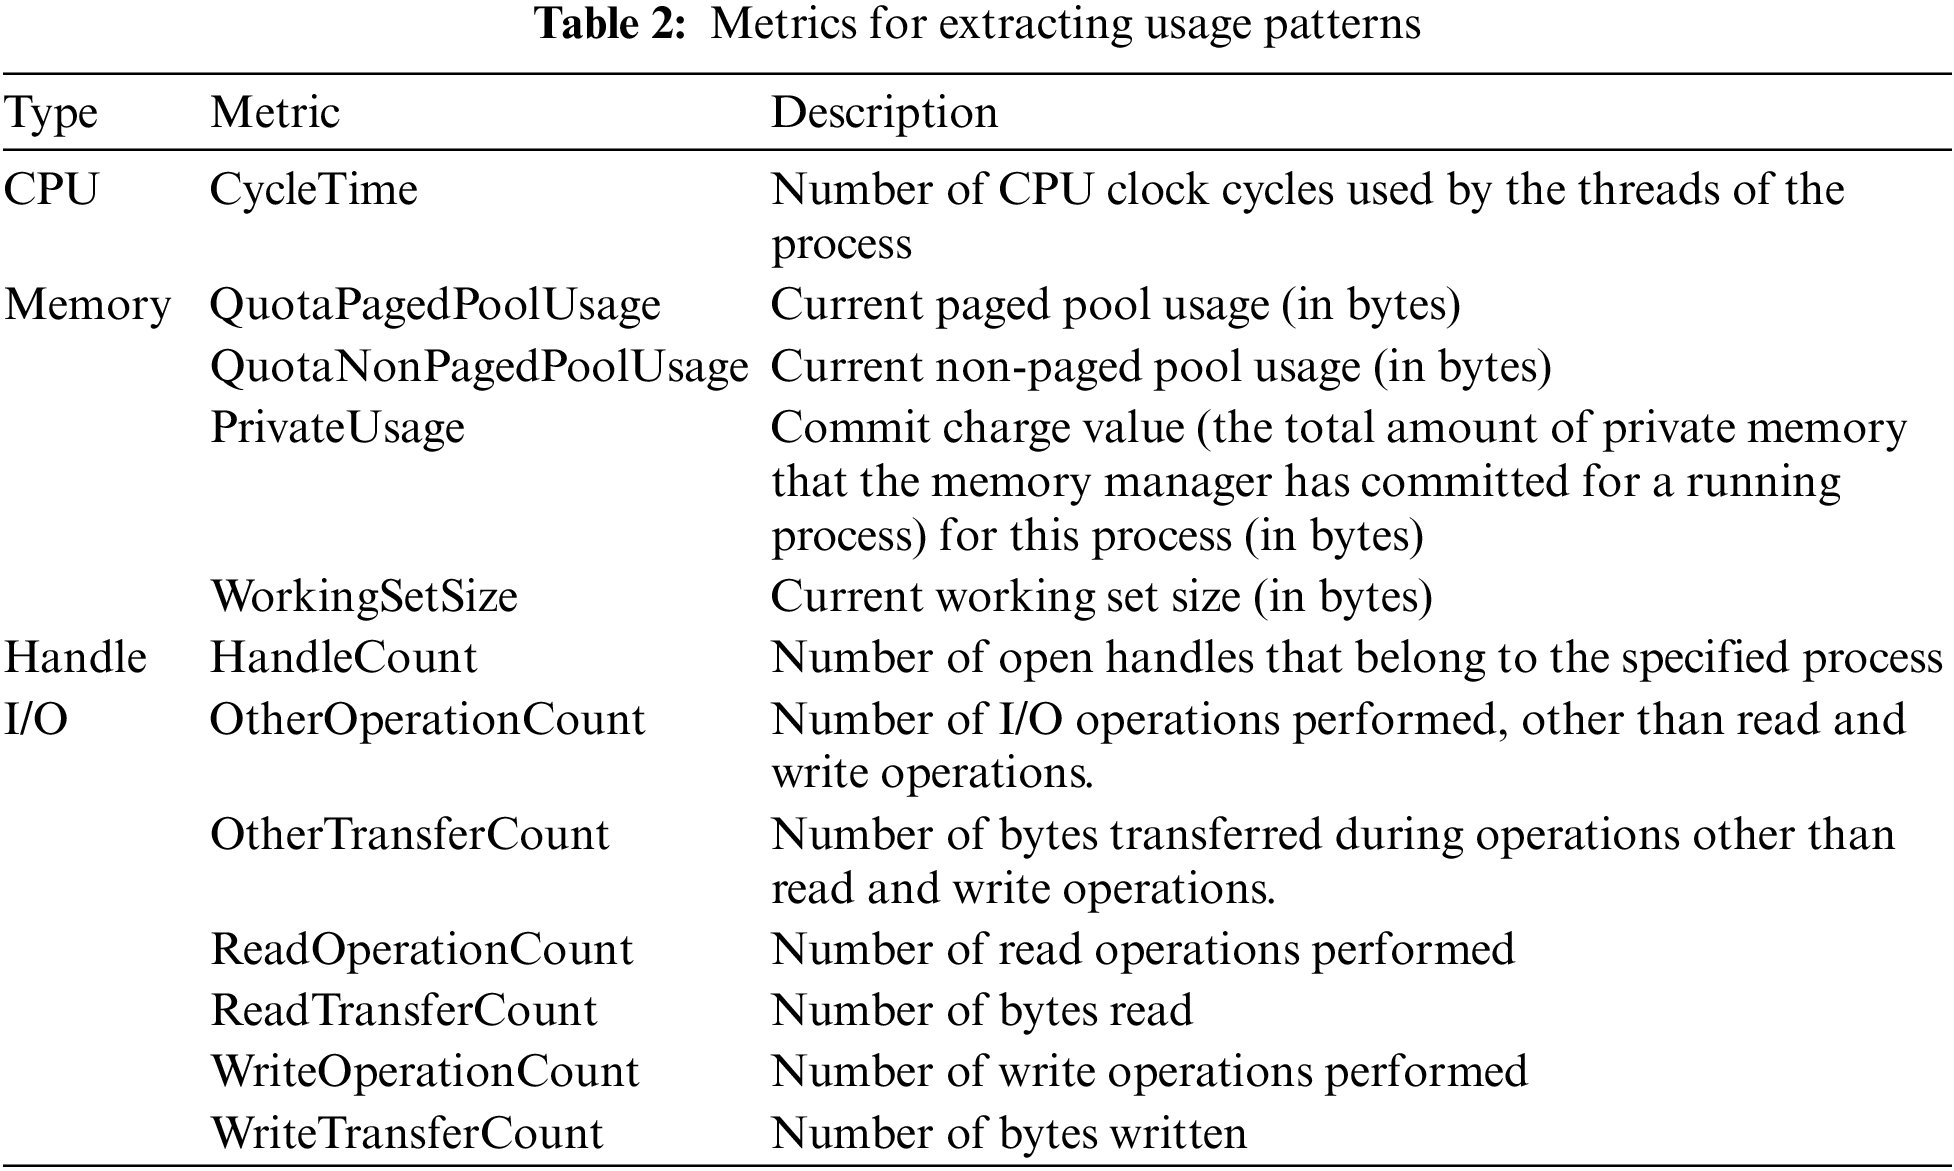
Performance metrics that best represent the execution features of malware are metrics related to the CPU, memory, and I/O and related to code execution for performing certain behaviors of malware. CPU CycleTime refers to the number of CPU clock cycles allocated during the operation of the process; it was chosen because it shows CPU resource usage characteristics related to malware execution. Memory-related metrics were chosen because they show memory usage characteristics based on the allocation and release of memory in the process of executing malware. We chose the paged pool/non-paged pool used to manage memory needed by the system in the Windows operating system, a set of private operations allocated to the program excluding the shared library, and a set of operations corresponding to the memory usage shown in the task manager. The HandleCount is a metric related to resource management in the Windows operating system, and it was chosen because the number of handles reveals the characteristics of resource usage. I/O refers to metrics showing characteristics related to inputs and outputs of the system, and we chose the number of read, write, and other operations, and bytes.
As for the data extraction method, because we used Python and considering the time required for metric extraction, we extracted data 2,000 times in 0.001 s intervals for 12 metrics. We could have set the data extraction time differently, but in this study, we kept it short to determine if only the data extracted at the beginning of malware execution can reveal unique features required for malware classification. To extract data quickly for the selected metrics only, we called related Windows APIs directly from Python instead of using a Python library.
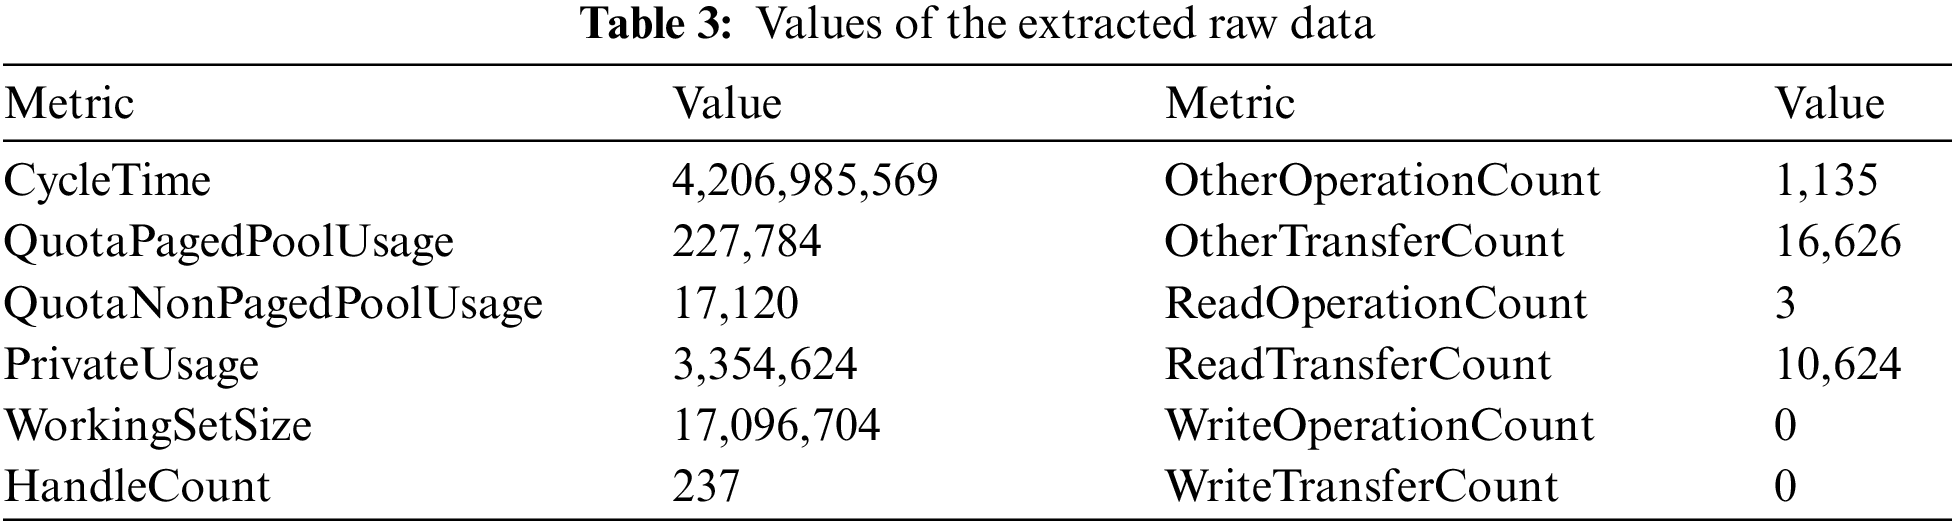
The extracted raw data show very large differences among each metric, as presented in Tab. 3. If the data are visualized as they are, only the metrics with large data values will be emphasized when they are visualized. Therefore, the data scales needed to be adjusted, and there are many methods for doing this. In this study, we used min-max normalization, which simply adjusts only the scale for each metric to maintain the characteristics of the data values shown in the usage patterns of the system resources as much as possible.
3.5 Behavioral Performance Visualization
Given that malware is also a program, it uses system resources to perform certain functions. Behavioral performance visualization is a method that visualizes the system resource usage patterns of malware while it performs certain functions.
3.5.1 Visualization Using Time-Series Graphs
Time-series graphs are a visualization method that can help analysts to distinguish malware intuitively because differences can be compared in detail. After normalizing the extracted time-series data, the plot function provided by the pyplot module of the Python Matplotlib library can be used to visualize them in time-series graphs. Five samples were collected for the Crypton ransomware, and their time-series graphs were classified into two very similar groups, as shown in Fig. 5.

Figure 5: Crypton ransomware visualized as time-series graphs
We used an open-source reverse-engineering tool called Cutter 1.12.0 [17] to examine the similarity of the time-series graphs in terms of actual code. First, when we examined the structure of the entry point, the structure was the same in all samples, as shown in Fig. 6, and only the address of the function called was different between the two groups. This shows that the entry point structure is the same in all types of Crypton ransomware.

Figure 6: Entry point structure of Crypton ransomware
The difference between the two groups was more noticeable when they were examined after the functions were sorted by size, as shown in Fig. 7. Furthermore, in the second group, two samples had the same information, but one sample showed some differences in the reference-related and code size information. However, the function-related information was all the same, and the results visualized in the time-series graphs showed almost no difference in the samples.

Figure 7: Crypton ransomware static code information and functions sorted by size
When the graphs of all function calls including the entry point are compared, differences are found between the two groups, as shown in Fig. 8. When the results visualized in time-series graphs are compared with the static code information, it is found that if the similarity of the static code is high, the similarity in the time-series graphs is high as well.

Figure 8: Graphs for all function calls of Crypton ransomware
3.5.2 Visualization Using Grayscale Images of Fixed Size
Although similarities can be checked through visualization using time-series graphs, we can also use a visualization method using fixed-size images as a simpler and more intuitive method of visualization. Extracted data can be saved in a two-dimensional (2D) array 2,000 × 12 in size, and the 2D array data can be easily visualized as an image after normalization. In other words, a 2D array of 2,000 × 12 can be converted into a grayscale image of 12 × 2,000 (width × height). First, the normalized data of the 2D array are multiplied by 255 and then converted into 8-bit unsigned integers. Then, the from array function provided by the Image module of the Python Pillow library can be used to create a grayscale image. However, because the generated image is very long (12 × 2000 in size), it is difficult for a human to identify it quickly. Hence, this vertically long image should be resized. Although images can be created in various sizes, 200 × 200 was selected for easy identification and use in the classification tasks in this study. For resizing, we used the resize function of the Image module with the Lanczos filter, which leads to the least image breakage. The final generated image is shown in Fig. 9.

Figure 9: Crypton ransomware samples converted into fixed-size grayscale images
Two groups were classified when the results visualized with time-series graphs and the static code information were compared, and likewise, two groups were classified when visualized as grayscale images of a fixed size. This is a visualization method that can be effectively used in malware classification based on image similarity comparison because the characteristics of malware are well represented, even when visualized as a small image, owing to the characteristics of grayscale images.
3.5.3 Visualization Using Fixed Size Color Images
Another method of visualization that can better express the characteristics of malware is one using color images. In this case, we used the imshow function provided by the pyplot module of the Python Matplotlib library. To visualize the normalized 2D array as a grayscale image, the data must be converted. However, if the imshow function is used, the normalized 2D array can be directly used for the visualization, and the created image has a high resolution while representing the real values of the data properly. Next, the size is adjusted to 200 × 200 so that it will be easy to examine visually. Furthermore, the imshow function can use a color map to create a color image. A color map is a type of color table that determines how to represent the color of a pixel, and various color maps can be used, as shown in Fig. 10. Fig. 11 shows images visualized by applying the “jet” color map, which is the most appropriate color map for representing the characteristics.

Figure 10: Various color maps

Figure 11: Crypton ransomware samples converted into fixed-size color images
Visualization using fixed-size color images can help analysts classify malware intuitively because similarities and differences can be easily compared in detail since the images have a high resolution when created and are represented in color. Furthermore, it can be used effectively in malware classification using AI techniques such as deep learning.
3.5.4 Visualization with Small Extracted Data
In some cases, malware inspects the execution environment and terminates immediately if the conditions are not met; alternatively, it copies itself to a different area of the system and after executing, it terminates itself. In these cases, the amount of extracted data is small because the actual running time is short. When the visualization is performed using the extracted data alone, the system resource usage patterns when the malware begins to run are still reflected, as shown in Fig. 12. In other words, even with only the system resource usage patterns at the beginning of malware execution, characteristics that can be distinguished from those of other malware types are noticeable.

Figure 12: Visualized images of small amount of extracted data
4 Design and Implementation of the Classification Framework
In this section, we describe the design and implementation of a framework for data extraction, behavioral performance visualization, and classification performance assessment.
Fig. 13 shows the overall framework. The framework for behavioral performance visualization consists of a data extraction system for extracting data from malware, a data visualization system for behavioral performance visualization using the extracted data, and a classification performance measurement system for measuring the classification performance using the visualized images. Each system operates independently.

Figure 13: Design of a classification framework for behavioral performance visualization
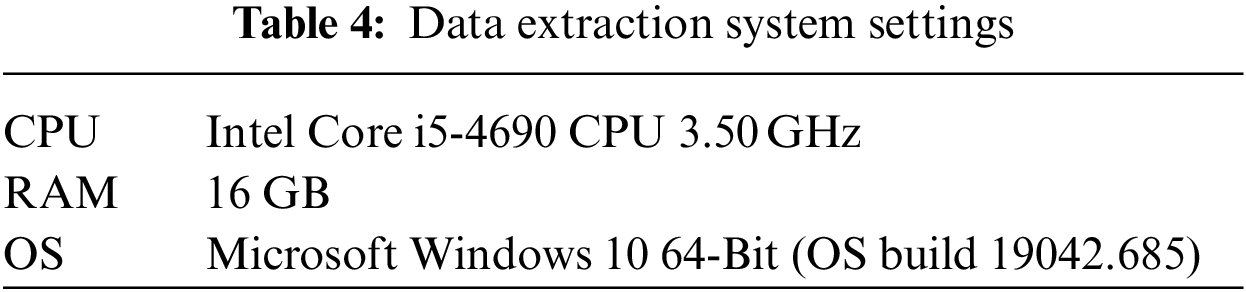
In this study, a data extraction system was constructed using an actual system, as detailed in Tab. 4, instead of a virtual machine or a professional analysis environment, such as Cuckoo Sandbox [18], in order to extract data in an environment similar to that of common users.
To extract data continuously and prevent malware from affecting the data extraction program, we built the extraction environment using Sandboxie-plus 0.8.8 [19] (an open-source sandbox program), which allows the program to operate in an isolated environment in Windows operating systems. The network was disabled because network-related metrics were not used when configuring the system. Microsoft Defender was disabled because malware is directly executed, and Windows Search was also disabled because it can have a significant impact on the I/O-related parts when data are extracted.
The programs used for data extraction were written using Python, and executable files were created using Pyinstaller 3.6 [20]. The programs were all executed as console programs using the command prompt (cmd.exe) with administrator privileges. There are libraries such as Psutil 5.7.2 [21] that can be used in Python for data extraction, but they cannot specifically target only the selected metrics when extracting system resource-related information, and the extraction takes a long time. Another problem is that a long extraction cycle has to be set to maintain a constant extraction cycle because there were large errors in the time required for extraction. Therefore, a method of directly calling Windows APIs from Python programs was implemented to extract data for only the selected metrics in a more precise cycle. In the pscollect.exe program, which extracts data from the malware process, only the last core of the usable CPU cores was configured for use to minimize the influence of other programs. Moreover, the priority of the process was set to ABOVE_NORMAL_PRIORITY _CLASS, i.e., one level higher than the default state. Considering the time required for metric data extraction using Python, we set the extraction cycle of the system resource usage patterns to run in intervals of 0.001 s and extracted data 2,000 times. The reason for separating psrun.exe, which executes malware, and pscollect.exe, which extracts data, was that some malware forcibly terminates the parent process that executed it, and this stops data extraction. Hence, psmon.exe was executed outside the sandbox, and the other two programs, psrun.exe and pscollect.exe, were configured to run inside the sandbox so that both the execution of malware and data extraction process would operate in the sandbox. After the data extraction was completed, all processes executed in the sandbox were terminated, and the changes made in the system by the malware were removed to return the data extraction environment to its initial state. Fig. 14 shows the programs and their operations for data extraction.

Figure 14: Overview of programs for data extraction
The data extraction process consists of the following steps: (1) psmon.exe executes psrun.exe in the sandbox and then sends the path of the executable file of the malware; (2) psrun.exe executes the malware in the path received from psmon.exe in a suspended state; (3) psrun.exe sends the process ID (PID) of the malware executed in a suspended state to psmon.exe; (4) psmon.exe executes pscollect.exe in the sandbox and then sends the PID of the malware received from psrun.exe; (5) pscollect.exe uses the received PID of the malware to resume the execution of the malware, which is in a suspended state; (6) pscollect.exe extracts the usage information of the system resources from the malware process at predetermined cycles; and (7) once the data extraction is completed, pscollect.exe sends all the extracted data to psmon.exe so that it can save them in a data file.
The data visualization system reads a comma-separated values (CSV) file, where the raw data extracted from malware have been saved, and performs the visualization work. Tab. 5 lists the data visualization system settings.

First, to adjust the scales of the data, the data are normalized to values between 0 and 1 for each metric using min-max normalization, and the data are visualized using a time-series graph and fixed-size images (grayscale and color). Fig. 15 shows the visualization process.

Figure 15: Data visualization process
4.4 Classification Performance Measurement System
The classification performance measurement system uses a convolutional neural network (CNN) [22], which is a deep learning technique, to classify the images visualized through the data visualization system. Tab. 6 presents the system settings.

We implemented the classification performance measurement system using a CNN—a deep learning technique widely used in image classification—because the visualization results produced by the data visualization system are images. Considering that even a simple model can produce good classification performance if the characteristics of each malware type are well represented in the visualized image, we created a simple CNN model using Keras. For this model, 20% of the data were used as the test dataset, and the training was performed by setting the number of epochs to a maximum of 500 and the batch size to 64. Fig. 16 shows the CNN model that was used.

Figure 16: Structure of the CNN model used for classification
In this study, among the visualization methods proposed in the behavioral performance visualization technique, fixed-size color images, which represent well the characteristics of malware and are small in size, were used as the inputs of the CNN model. The task of assigning labels to the images was performed manually by grouping images with similar shapes. However, when we examined the images to assign labels, we found shapes that required more detailed classification, even for the same type of malware. Fig. 17 shows the fixed-size visualization results of Amnesia ransomware samples; as shown in cases (1) and (2), some malware samples have different shapes even though they belong to the same ransomware type.

Figure 17: Fixed-size visualization images of Amnesia ransomware samples
Samples with different shapes can appear because there are variants or many versions of malware that perform different functions in detail, even within the same malware type. However, when there was only one sample that had the same shape, as shown in case (2), that particular sample was removed because it could not be used in the training process. The final dataset included 62 labels and 474 samples, as detailed in Tab. 7.

This section describes the behavioral performance visualization and deep learning-based classification performance results. The images visualized with the behavioral performance visualization method using system resource usage patterns were visually checked to determine how similar they appear when examined by malware type.
5.1 Behavioral Performance Visualization Results
When the visualization results of the Radamant ransomware samples were examined, as shown in Fig. 18, all samples appeared to be of a single type. Despite the fact that samples with large differences in file size were mixed together, the patterns of the system resources used when they were running were all the same. This was also true for the packed samples. Packing is a concealment method that hides the original code by compressing the executable. A program that performs this function is called a packer. When an executable file is packed using a packer, the information related to the original code is hidden, making static analysis difficult. Given that the behavioral performance visualization is a type of dynamic analysis, the characteristics related to the execution are reflected when the malware is actually running, even for malware that uses concealment techniques, demonstrating that all visualization results are the same. Fig. 19 shows the visualization results of the samples packed by three types of packers, all of which have the same appearance.

Figure 18: Fixed-size visualization images of Radamant ransomware samples

Figure 19: Visualization results of samples packed by three types of packers
In the case of Shade ransomware, various types appeared, although these types were similar, as shown in Fig. 20. The code structure of the Shade ransomware was quite different in the samples, as shown in Fig. 21, and the usage patterns of the system resources also showed differences. This indicates that different types of variants have been produced in the case of Shade ransomware.

Figure 20: Fixed-size images of Shade ransomware samples

Figure 21: Shade ransomware consisting of various sample types
Malware with an avoidance function such as RotorCrypt maintains a suspended state without performing any operation using the “sleep” function, which waits for a specified period of time after being triggered or until a certain condition is met. Because it barely uses the system resources during the waiting period, there is almost no change in each metric, as shown in Fig. 22.

Figure 22: Fixed-size visualization images of RotorCrypt ransomware samples
However, these malware samples use system resources when they are executed. Therefore, if only the first 100 data records (out of a total of 2,000 records) are used for visualization, the shapes shown in Fig. 23 appear.

Figure 23: Visualization images for the first 100 data records of RotorCrypt ransomware samples
Fig. 24 shows the visualization results of each ransomware type for all samples. In some cases, the entire shape is similar to those of the other samples within the same ransomware type, whereas in other cases, various detailed shapes are found.

Figure 24: Visualization results for each ransomware type
5.2 Classification Performance Results Using Deep Learning
In this section, the images created as fixed-size visualization results are classified using a CNN to evaluate the classification performance. After training the CNN model using the dataset consisting of 474 samples, in which 62 labels were manually classified, the classification performance was measured. After running the process a total of 20 times, the best result had an accuracy of 1.000000 and a loss of 0.000068. In the worst result, the accuracy was 0.989474, and the loss was 0.036920. Fig. 25 shows the performance results for worst-case executions, Fig. 26 shows the performance results for all executions, and Tab. 8 presents the results of all executions.

Figure 25: Performance results for the worst-case execution

Figure 26: Performance results for all executions

The quantitative results of the behavioral performance visualization method using a CNN show that it can be used for malware classification.
Given that attacks using malware are evolving to target specific companies or social infrastructure rather than people, changes are required in the response strategies to block them. The agent and characteristics of the attack should be identified to respond appropriately rather than simply detecting and removing malware. This requires the establishment of response strategies based on the method or goal of the attacks that the attacker has performed in the past by identifying the malware through malware classification and attacker identification. Therefore, it is very important to classify malware for attacker identification when establishing a response strategy. However, malware creators are well aware of this and employ various concealment and avoidance techniques, making it difficult to extract the features required for malware classification. To overcome this difficulty, research is needed to enhance traditional malware analysis and facilitate the extraction of features needed for classification, even for malware that uses concealment and avoidance techniques. Moreover, it is necessary to investigate new features and classification techniques for malware classification.
This study aimed to investigate the possibility of classifying malware using the usage patterns of system resources, such as CPU, memory, and I/O, that are usually used in performance characteristics analysis and the tuning of executable programs. We proposed a behavioral performance visualization method that visualizes the unique characteristics of malware by selecting the metrics to be evaluated and extracting the usage patterns of the system resources as a time series. Furthermore, we evaluated the classification performance using a CNN for the visualization results of ransomware. The obtained results were quite good, confirming its suitability for malware classification and AI techniques. These findings are significant and demonstrate the suitability of malware classification, even when considering the limitation of dynamic analysis—since usage patterns of the system resources are a type of dynamic characteristic—and the limitation that the set of malware samples used in the experiment was small and only consisted of ransomware. Furthermore, we designed and implemented a framework that performs the entire process—from data extraction to behavioral performance visualization and classification performance measurement—that is expected to help related studies in the future.
In future work, because the malware samples were limited to ransomware in this study, we should further evaluate the malware classification performance by expanding the samples to include benign programs and different types of malware. Further, we plan to research data processing methods (i.e., various methods for analyzing and interpreting time series data) and additional visualization methods. Finally, we plan to conduct a study to determine the optimal classification technology by applying the results of the behavioral performance visualization method proposed in this paper to various machine learning and deep learning techniques.
Funding Statement: This work was supported by the Institute of Information & Communications Technology Planning & Evaluation (IITP) (Project No. 2019-0-00426%, 10%), the ICT R&D Program of MSIT/IITP (Project No. 2021-0-01816, A Research on Core Technology of Autonomous Twins for Metaverse, 10%), and a National Research Foundation of Korea (NRF) grant funded by the Korean government (Project No. NRF-2020R1A2C4002737%, 80%).
Conflicts of Interest: The authors declare that they have no conflicts of interest to report regarding the present study.
1. J. R. Reeder and C. T. Hall, “Cybersecurity's Pearl Harbor moment: Lessons learned from the Colonial Pipeline ransomware attack,” Cyber Defense Review, vol. 6, no. 3, pp. 15–40, 2021. [Google Scholar]
2. S. Soltani, S. A. Hosseini Seno, M. Nezhadkamali and R. Budirato, “A survey on real world botnets and detection mechanisms,” International Journal of Information and Network Security, vol. 3, no. 2, pp. 116–127, 2014. [Google Scholar]
3. K. Sigler, “Crypto-jacking: How cyber-criminals are exploiting the crypto-currency boom,” Computer Fraud & Security, vol. 2018, no. 9, pp. 12–14, 2018. [Google Scholar]
4. L. Magno, M. Erika, M. Ryan and T. Nikko, “The state of ransomware: 2020's catch-22,” Trend Micro, 2021. [Online]. Available: https://www.trendmicro.com/vinfo/us/security/news/cybercrime-and-digital-threats/the-state-of-ransomware-2020-s-catch-22. [Google Scholar]
5. R. Komatwar and M. Kokare, “A survey on malware detection and classification,” Journal of Applied Security Research, vol. 16, no. 3, pp. 390–420, 2021. [Google Scholar]
6. R. Sihwail, K. Omar and K. A. Z. Ariffin, “A survey on malware analysis techniques: Static, dynamic, hybrid and memory analysis,” International Journal on Advanced Science, Engineering and Information Technology, vol. 8, no. 4–2, pp. 1662–1671, 2018. [Google Scholar]
7. J. Singh and J. Singh, “Challenge of malware analysis: Malware obfuscation techniques,” International Journal of Information Security Science, vol. 7, no. 3, pp. 100–110, 2018. [Google Scholar]
8. K. Shaukat, S. Luo, V. Varadharajan, I. A. Hameed, S. Chen et al., “Performance comparison and current challenges of using machine learning techniques in cybersecurity,” Energies, vol. 13, no. 10, pp. 2509, 2020. [Google Scholar]
9. D. Gibert, C. Mateu and J. Planes, “The rise of machine learning for detection and classification of malware: Research developments, trends and challenges,” Journal of Network and Computer Applications, vol. 153, art. no. 102526, pp. 1–21, 2020. [Google Scholar]
10. L. Nataraj, S. Karthikeyan, G. Jacob and B. S. Manjunath, “Malware images: Visualization and automatic classification,” in Proc. of the 8th Int. Symposium on Visualization for Cyber Security, NY, USA, no. 4, pp. 1–7, 2011. [Google Scholar]
11. S. Z. M. Shaid and M. A. Maarof, “Malware behavior image for malware variant identification,” in 2014 Int. Symposium on Biometrics and Security Technologies (ISBAST), Kuala Lumpur, Malaysia, pp. 238–243, IEEE, 2014. [Google Scholar]
12. P. Poornachandran, S. Praveen, A. Ashok, M. R. Krishnan and K. P. Soman, “Drive-by-download malware detection in hosts by analyzing system resource utilization using one class support vector machines,” in Proc. of the 5th Int. Conf. on Frontiers in Intelligent Computing: Theory and Applications, pp. 129–137, Singapore, Springer, 2017. [Google Scholar]
13. K. P. Soman, R. Loganathan and V. Ajay, in Machine Learning with SVM and other Kernel Methods, New Delhi, India: PHI Learning Pvt. Ltd., 2009. [Google Scholar]
14. R. Perdisci, G. Gu and W. Lee, “Using an ensemble of one-class SVM classifiers to harden payload-based anomaly detection systems,” in Sixth Int. Conf. on Data Mining (ICDM'06), Hong Kong, China, pp. 488–498, 2006. [Google Scholar]
15. A. K. Sood and S. Zeadally, “Drive-by download attacks: A comparative study,” IT Professional, vol. 18, no. 5, pp. 18–25, 2016. [Google Scholar]
16. VirusTotal, “Analyze suspicious files and URLs to detect types of malware, automatically share them with the security community,” 2022. [Online]. Available: https://www.virustotal.com. [Google Scholar]
17. Cutter, “Free and open source reverse engineering platform,” 2022. [Online]. Available: https://cutter.re. [Google Scholar]
18. S. Jamalpur, Y. S. Navya, P. Raja, G. Tagore and G. R. K. Rao, “Dynamic malware analysis using cuckoo sandbox,” in 2018 Second Int. Conf. on Inventive Communication and Computational Technologies (ICICCT), Coimbatore, India, pp. 1056–1060, 2018. [Google Scholar]
19. Sandboxie-Plus, “Open-source OS-level virtualization solution for Microsoft Windows,” 2022. [Online]. Available: https://en.wikipedia.org/wiki/Sandboxie_Plus. [Google Scholar]
20. PyInstaller, “Freeze (package) python programs into stand-alone executables,” 2022. [Online]. Available: https://github.com/pyinstaller/pyinstaller. [Google Scholar]
21. Psutil, “Cross-platform lib for process and system monitoring in Python,” 2022, [Online]. Available: https://github.com/giampaolo/psutil. [Google Scholar]
22. S. Albawi, T. A. Mohammed and S. Al-Zawi, “Understanding of a convolutional neural network,” in 2017 Int. Conf. on Engineering and Technology (ICET), Antalya, Turkey, pp. 1–6, 2017. [Google Scholar]
 | This work is licensed under a Creative Commons Attribution 4.0 International License, which permits unrestricted use, distribution, and reproduction in any medium, provided the original work is properly cited. |