DOI:10.32604/cmc.2022.026625
| Computers, Materials & Continua DOI:10.32604/cmc.2022.026625 | |
| Article |
Fuzzy Hybrid Coyote Optimization Algorithm for Image Thresholding
1School of Computer, Nanjing University of Posts and Telecommunications, Nanjing, 210003, China
2School of Computer and Information Engineering, Fuyang Normal University, Fuyang, 236041, China
3Department of Mathematics, Faculty of Science, New Valley University, El-Kharga, 72511, Egypt
*Corresponding Author: Shujing Li. Email: lsjing1981@163.com
Received: 31 December 2021; Accepted: 11 February 2022
Abstract: In order to address the problems of Coyote Optimization Algorithm in image thresholding, such as easily falling into local optimum, and slow convergence speed, a Fuzzy Hybrid Coyote Optimization Algorithm (hereinafter referred to as FHCOA) based on chaotic initialization and reverse learning strategy is proposed, and its effect on image thresholding is verified. Through chaotic initialization, the random number initialization mode in the standard coyote optimization algorithm (COA) is replaced by chaotic sequence. Such sequence is nonlinear and long-term unpredictable, these characteristics can effectively improve the diversity of the population in the optimization algorithm. Therefore, in this paper we first perform chaotic initialization, using chaotic sequence to replace random number initialization in standard COA. By combining the lens imaging reverse learning strategy and the optimal worst reverse learning strategy, a hybrid reverse learning strategy is then formed. In the process of algorithm traversal, the best coyote and the worst coyote in the pack are selected for reverse learning operation respectively, which prevents the algorithm falling into local optimum to a certain extent and also solves the problem of premature convergence. Based on the above improvements, the coyote optimization algorithm has better global convergence and computational robustness. The simulation results show that the algorithm has better thresholding effect than the five commonly used optimization algorithms in image thresholding when multiple images are selected and different threshold numbers are set.
Keywords: Coyote optimization algorithm; image segmentation; multilevel thresholding; logistic chaotic map; hybrid inverse learning strategy
Image thresholding is a main method in computer vision [1,2], which is widely used in pattern recognition, medical diagnosis, target detection, damage detection, agricultural pest recognition and other fields [3–6]. The goal of this method is to subdivide an image into multiple complementary and non-coincident pixel groups based on a specific set of thresholds, so as to extract the region ofinterest or feature information from the original image [7]. This method can be divided into two categories: Bilevel and Multilevel. In the first category, the image is divided into foreground and background by a single threshold. The second category is the extension of the first one, which uses multiple thresholds to divide the image into more than two regions. Generally, bi-level threshold is only suitable for images with clear foreground and background and simple pixel information, while multi-level threshold is more suitable for images with more target units and complex scenes. As image acquisition equipment improves continuously, it enriches the resolution, color and texture of digital images. As a result, multi-level threshold is more widely used in image thresholding [2]. However, with the increase of threshold numbers, the computational complexity becomes increasingly higher. Therefore, a large number of nature-inspired meta-heuristic algorithms (NIMA) are used to improve thecomputational efficiency [8].
In practical application of NIMA, multi-thresholding segmentation is modeled as an objective function optimization problem. The first problem to be solved is the selection of objective function. In the field of multilevel image thresholding, the objective function is generally realized by the statistical function of image histogram, and the most commonly used objective functions are Chouksey et al. [9]. Pare et al. [10] used the fused Kapur, Otsu and Tsalli to form an energy objective function, and based on the search ability of NIMA, improved the efficiency and robustness of image thresholding. Experiments showed that Kapur entropy assisted bacterial foraging optimization (BFO) algorithm and differential evolution (DE) has the best visual effect. Song et al. [11] took Otsu and Kapur as objective functions and used electromagnetic field optimization (EFO) algorithm for optimal threshold extraction. Compared with artificial bee colony (ABC) and wind driven optimization (WDO), this algorithm has better robustness in thresholding of color images. Upadhyay et al. [12] proposed a multilevel thresholding method based on Kapur entropy, which has the advantages of fewer parameters and avoidance of prematurity. Compared with particle swarm optimization (PSO), moth flame optimization (MFO), DE, cuckoo search (CS) and grey wolf optimizer (GWO), in the comparative experiment of parameters such as PSNR, SSIM and FSIM, this algorithm is superior in thresholding quality and consistency. Singh et al. [13] used Otsu and Kapur entropy to combine dragonfly algorithm (DA) and firefly algorithm (FA). By segmenting the benchmark image of Berkeley segmentation dataset (BSD 500), it shows better results in convergence iteration times, threshold quality and segmentation effect when compared with NIMA such as EMO, GA, PSO and BFO. Houssein et al. [14] used black widow optimization (BWO) to obtain the optimal threshold based on Otsu and Kapur objective functions. Compared with the six heuristic algorithms of GWO, MFO, whale optimization algorithm (WOA), sine cosine algorithm (SCA), slap swarm algorithm (SSA) and equilibrium optimization (EO), this method is better in PSNR, SSIM and FSIM.
The above summarizes the use of objective function in multilevel thresholding in recent years. From the analyses, it can be seen that Kapur entropy has been widely used. After analyzing and determining the objective function, the following will analyze applications of NIMA using Kapur as the objective function. Bhandari et al. [15] segmented color images through electromagnetic like mechanism optimization (EMO), and compared it with bat algorithm (BA), backtracking search algorithm (BSA), FA, PSO and WDO, this method has better effect on average error, PSNR and other parameters. Li et al. [16] optimized the Kapur entropy through the improved GWO algorithm to obtain the optimal thresholds. compared with the standard GWO, EO and DE algorithm, it showed better performance in the optimal objective function and threshold stability. Raj [17] used DE method to realize image thresholding, and takes PSNR, SSIM and SNR as evaluation indices. Compared with BFO, bees’ algorithm and their improved algorithms, it has better effect in standard deviation of objective function and computing efficiency. Taking fuzzy Kapur as the objective function, Li et al. [18] improved GWO and used the algorithm to obtain the optimal threshold. Compared with the standard GWO and DE, such algorithm obtains better objective function value and more stable segmentation effect in the evaluation parameters such as standard deviation, average value and PSNR. With the same objective function, Li et al. [19] improved the local search ability of the ABC, and tried to aggregate domain information in median, mean and iterative mean modes. Compared with EMO, fuzzy DE and standard ABC, this method is superior in convergence speed, convergence stability and running time. Houssein et al. [20] verified the improved effect of opposition-based learning (OBL) on MPA (Marine predictors algorithm) convergence and search performance in multilevel thresholding. Compared with algorithms such as DE based on OBL, HHO and MPA, this method shows advantages in convergence speed of the optimization algorithm. At the same time, the author also experimentally analyzes the quantitative statistical performance in image thresholding. Singh et al. [21] summarized nearly 30 kinds of NIMA, including DE, FA, GA, PSO, ABC from 2005 to 2021. Compared with ANN (artificial neural networks), growing region, edge-based algorithms and other kinds, thresholding method has been widely used because it requires less prior knowledge and minimal steps. Based on [18,19], Li et al. [22] improved COA through differential and fuzzy strategies, and conducted image thresholding using Otsu and fuzzy Kapur as objective functions. The experimental results indicate that compared with GWO and other methods in [18,19], FCOA with fuzzy Kapur obtains better objective function value and segmentation quality. On this basis, with the similar framework, this paper introduces chaos initialization and reverse learning strategy to further improve it and form FHCOA.
The remainder of this paper is organized as follows: Section 2 introduces the selection of objective function and COA. Section 3 presents the improved COA by chaotic initialization and reverse learning in detail. Section 4 analyzes the performance of the improved optimization algorithm in parameter selection and segmentation quality through detailed experimental comparison, and provides a detailed quantitative and visual result analysis. Section 5 introduces the application of FHCOA in brain medical image thresholding. Finally, Section 6 concludes this study.
2 Objective Function Analysis and COA Introduction
Image thresholding requires two core steps, one is the selection of objective function, the other is application of threshold optimization of NIMA. Based on the analysis of Section 1, Kapur entropy and Ostu are still the main objective functions used in many thresholding methods. Some authors of this paper in [16] first verified the effect of Kapur entropy in image thresholding, they also analyzed and compared Otsu and fuzzy Kapur in [18,19]. From the experimental analysis, fuzzy Kapur is better than Otsu in most cases. Combined with the effectiveness of fuzzy Kapur in improving COA which is verified in [22], this study still takes fuzzy Kapur as the objective function. let i represent the gray level of the image, then the statistical quantity of each gray level can be expressed as h(i), thus the probability distribution of the gray level of the image can be obtained. On this basis, a group of Kapur entropy can be easily obtained (for detailed calculation equation, please refer to references [18,19,22]). Therefore, the fuzzy Kapur objective function used in this paper can be expressed as:
where th is the multi threshold vector,
In determining the objective function, the second core step involves selection and application of NIMA. This paper focuses on verifying the performance of improved COA in threshold optimization.
2.1 Coyote Groups and Initialization of Their Parameters
Firstly, the population formed by N coyotes is randomly assigned to
Wherein N is the search space dimension, it is also the threshold quantity in this paper. Therefore, at t-th instant, the initialization mode of the c-th coyote of the p-th group in the i-th dimension is shown in Eq. (3). The fitness value (i.e., objective function) of each group is shown in Eq. (4).
Wherein
2.2 Updating Coyotes in the Group
In order to improve the optimization effect, the growth of coyotes was affected by many factors, including: the best coyotes
When the coyotes in the group have grown up, update the coyotes’ social conditions according to the quality of the objective function (fitness value), that is, update the coyotes. As can be shown in Eq. (11).
2.3 Population Regeneration and Elimination
In order to avoid the algorithm falling into the local optimum, new coyotes need to be added constantly. In the standard COA, the addition of newborn coyotes is affected by the social conditions and environment of parent coyotes (which are randomly selected), as in Eq. (12). Where
In addition,
COA keeps the population constant by synchronizing the birth and death of coyotes. If only one coyote in the group has poorer social adaptability than the newborn coyote, the coyote dies and the newborn survives, then its age is set to age = 0; If the social adaptability of multiple coyotes in the group is worse than that of the newborn one, the oldest coyote with poor social adaptability will die, and the newborn will survive, and the age is set to 0; If there is no coyote with worse social adaptability than the newborn coyote, then the latter will die.
2.4 Eviction and Acceptance of Coyotes
During the natural evolution of coyotes, in order to maintain the continuity of the population or improve the population quality, individual coyotes need to be constantly updated according to their adaptability (some low-quality coyotes are evicted and some high-quality coyotes are accepted into the population). In the algorithm design, to reflect this natural phenomenon, the expulsion and acceptance of coyotes occur with certain probability, as is shown in Eq. (15).
3 Improved Coyote Optimization Algorithm
Population initialization is the key initial condition for all NIMA. Although the population can be optimized and updated continuously in algorithm optimization, a better population initialization method can ensure the convergence speed of the algorithm and prevent algorithm from falling into local optimum in a certain extent. The population initialization of standard COA algorithm uses random function to complete the assignment of coyote social conditions. It is highly probable that this method can cause a coyote group to fall into local optimization [22], consequently it puts higher requirements on COA population initialization.
Chaotic mapping is a random sequence generated by a simple deterministic system, which is characterized by nonlinearity, ergodicity, randomness and long-term unpredictability [23]. In optimization process, chaotic mapping can be used to replace the pseudo-random generator and initialize the population by chaotic sequence, so as to further improve the convergence of the algorithm and the accuracy of the final solution. In view of this, this paper uses the logistic mapping method to initialize the population of COA, and its equation is defined as:
where t is the number of iterations,
3.2 Best Coyote Lens Reverse Learning Strategy
In the improvement of NIMA, reverse learning takes the current solution (coyote) as the reference object, obtains the corresponding reverse solution through the reverse learning strategy, and updates the optimal solution through comparison of the objective function values. In this study, a hybrid reverse learning strategy is obtained by combining the lens imaging reverse learning strategy with the worst coyote reverse learning strategy [20]. When the COA updates all of the coyotes each time, the optimal coyote and the worst coyote in this iteration are selected for reverse learning operation to prevent the algorithm falling into local optimum prematurely.
In the process of optimal solution exploration, the current optimal solution is mirrored by a convex lens according to the lens imaging principle, so as to increase the differentiation of the updated solution, and maximize the search for a new optimal solution, thus the problem of the algorithm falling into local optimization can be overcome. Its working principle is shown in Fig. 1.
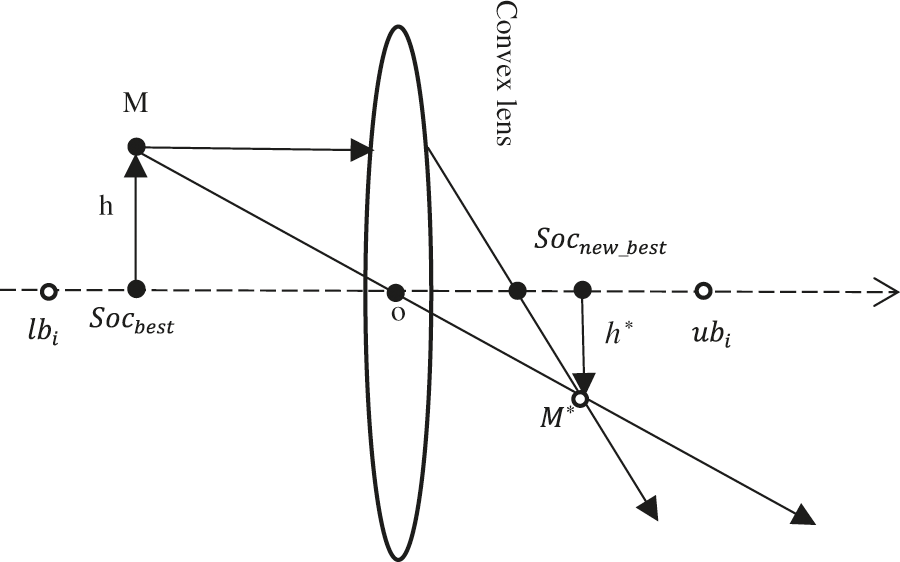
Figure 1: Lens imaging reverse learning
In practical applications, the coordinate origin o is the midpoint of the lower and upper bounds of the threshold, and a convex lens with focal length r is placed at the origin. According to the principle of convex lens imaging, the object M with height h forms a mirror image
Let
As can be observed from Eq. (19), by selecting different n, it can obtain new individuals different from the optimal coyote. When n = 1, the lens imaging reverse learning is simplified to an ordinary reverse learning strategy. To improve the differentiation of reverse solutions, n = 6000 is set in this work. when the lens reverse learning is completed, the selection rule of the optimal solution is shown in Eq. (20).
3.3 Worst Coyote Reverse Learning Strategy
Lens reverse learning solves the problem of updating the optimal coyote. In order to further increase the diversity of coyote population, this paper uses the worst coyote reverse learning strategy to update the worst coyote, so as to ensure the overall quality of coyote population. The equation is:
In Eq. (21),
In each iteration of COA, when the population update is completed, the best coyote and the worst coyote are updated respectively through Eqs. (19) and (21), and the relatively better individuals are selected through Eqs. (20) and (22).
4 Comparison and Analysis of Experimental Results
The standard image segmentation test set BSD 500 [18] published by Berkeley is selected as the experimental comparative analysis object, and five kinds of NIMA are selected for quantitative and visual analysis and discussion. Some authors of this study have done many comparative experiments in [16,18–20]. For example, in [16] they compared the effects of GWO, EMO and DE in mulilevel image thresholding. Through detailed data comparison, it is found that GWO has better thresholding effect and convergence stability. [18,19] respectively analyze the thresholding performance of FMGWOA (fuzzy modified GWO and aggregation) and FMABCA (fuzzy modified ABC and aggregation). Compared with standard GWO, standard ABC, FDE, EMO and those in [16], these two improved algorithms are also significantly better in segmentation speed and segmentation quality. Especially in [22], we improved the COA through fuzzy objective function, differential strategy and domain fuzzy information aggregation, and then verified its effect in thresholding segmentation. The experimental results show that our methods FCOA (fuzzy Coyote optimization algorithm) and FICOA (fuzzy and improved Coyote optimization algorithm) superior to the standard COA, GWO and others. Therefore, we will further compare the proposed method in this paper with FICOA (including FCOA) [22], FMGWOA [18], FMABCA [19] and GWO [24] which is also a wolf swarm heuristic algorithm, in order to illustrate that our method has better image thresholding performance.
4.1 Parameter Setting and Related Discussion of Experimental Result Analysis
In order to fully analyze the performance of FHCOA in visual and quantitative data, six images are selected from BSD500 according to the complexity of the scenes, the amount of color information and the length-width ratio of the images, as shown in Fig. 2. The experiments are run on Windows10–64bit, with Intel Core i5 processor and 16GB running memory, and processed by programming software Matlab 2016a. All experimental data are generated on the same platform.
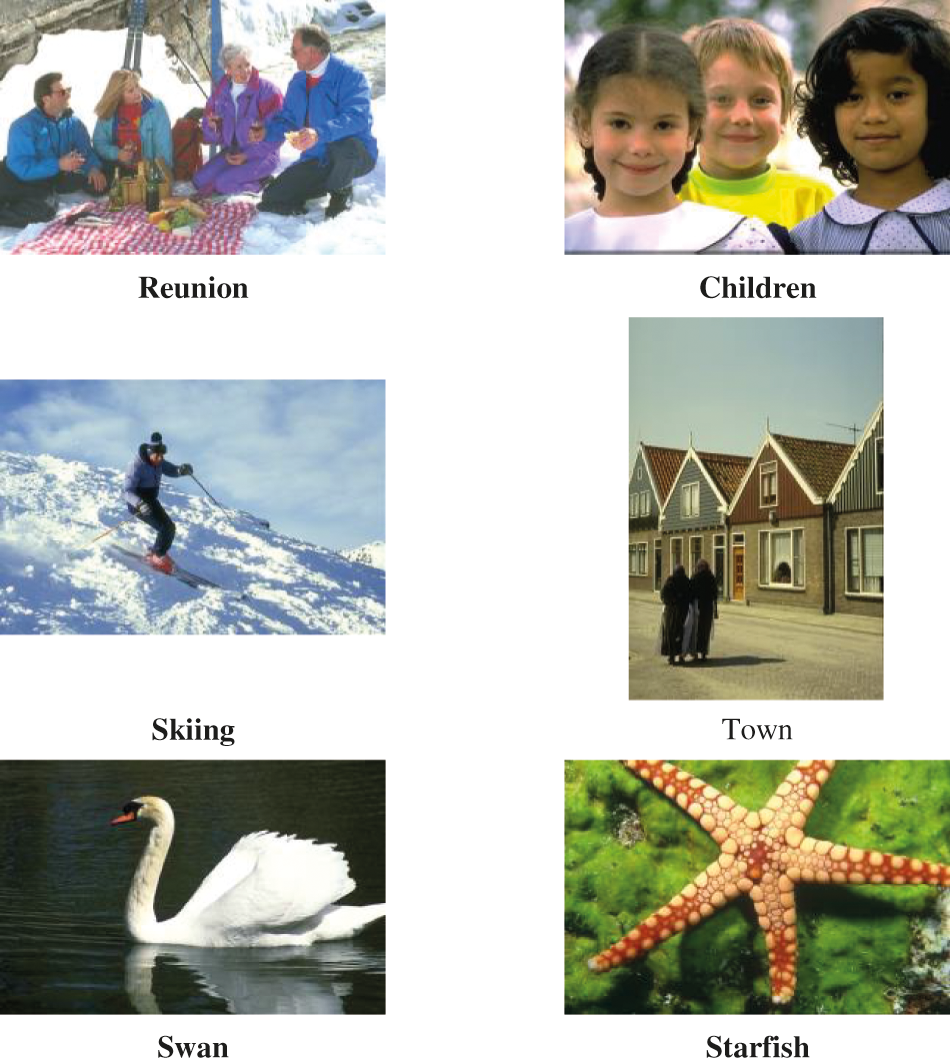
Figure 2: Original images for multi-level thresholding
According to the analysis of image thresholding evaluation in Section 1, this paper evaluates the differences between FHCOA and other algorithms through PSNR and FSIM [25]. These two evaluation parameters are also the evaluation mode selected in the comparative references [18–19,22,24], in which PSNR evaluates the degree of image distortion based on the comparison error of pixels between images. The larger the parameter value of PSNR, the smaller the degree of image distortion, and the better the effect of image segmentation. FSIM evaluates the segmentation effect by measuring the feature similarity between the images before and after segmentation. Similarly, the larger the value, the better the segmentation effect.
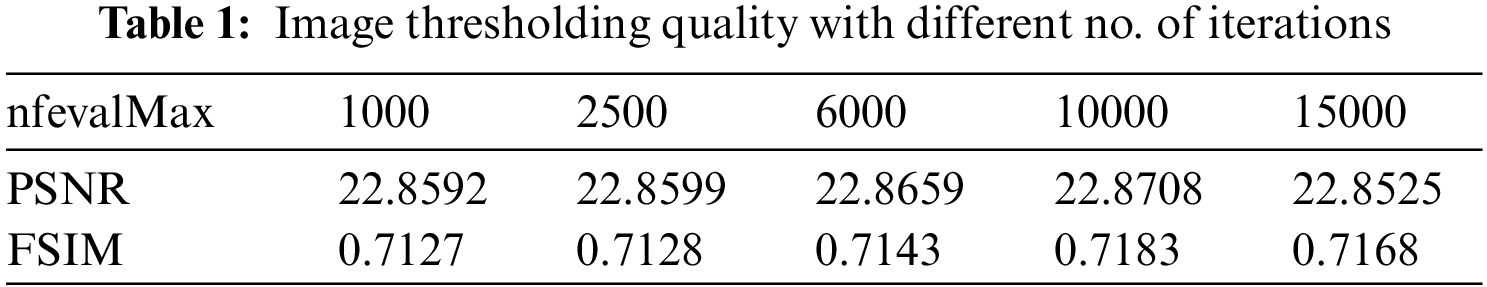
Regarding the setting of iteration numbers of the algorithm, Tab. 1 shows the PSNR and FSIM parameter values of the Starfish image (th = 5) in Fig. 2 with different no. of iterations. As can be seen from Tab. 1, when the number of iterations increases from 1000 to 10000, the values of PSNR and FSIM show an upward trend. However, when the number of iterations reaches 15000, the values of PSNR and FSIM do not increase significantly but show a slight downward trend. Considering the impact of the number of iterations on time efficiency of the algorithm, we finally determine the number of iterations to be 10, 000.
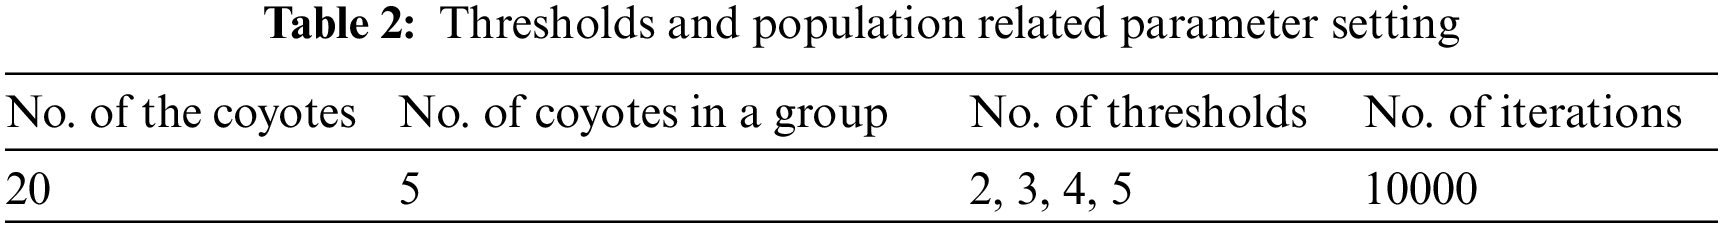
Based on the conventional parameter setting in the comparative reference and the literature analysis in Section 1 [1,2], the number of test thresholds is set to 2, 3, 4 and 5, and the number of coyotes in each group are set to 20 and 5 respectively, as shown in Tab. 2. The parameters of the comparative literature used in this paper follow the parameters of the original literature, and the hardware, operating system and software configuration of the running platform are consistent with those in this study.
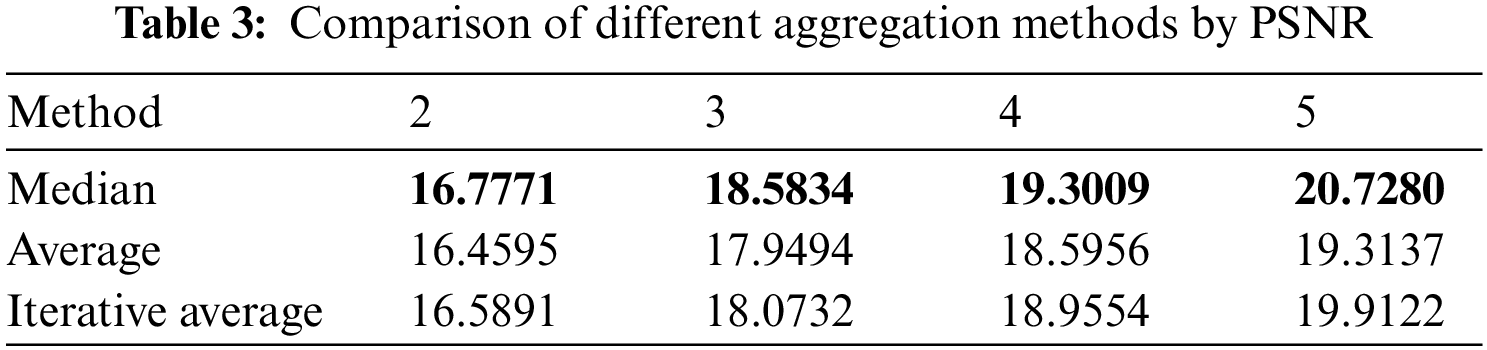
In order to avoid too small segmentation regions generated by isolated pixels in image thresholding process, similar to the analysis in [18–19,22], this paper aggregates the information of neighborhood regions with the help of fuzzy aggregation theory. Tab. 3 lists the PSNR parameter values obtained by the three methods with different thresholding numbers. Comparing the PSNR parameter values in Tab. 3, we can conclude that the median method gets the best thresholding effect with different threshold numbers, thus the median method is used in subsequent experiments.
4.2 Comparison of Image Thresholding Results of FHCOA, FICOA and FCOA
Based on the comprehensive analysis of the advantages and disadvantages of Kapur entropy and fuzzy Kapur entropy in [18,19], the experimental analysis shows that FMABCA and FMGWOA demonstrate greater advantages. The experimental analysis in [22] shows that the thresholding effect is better than that in [18,19]. Therefore, this paper first makes a comparative analysis with [22] using the same NIMA, and the comparison of other methods will be carried out in subsequent sections. Fig. 3 list the visual thresholding effects of FHCOA in this paper.
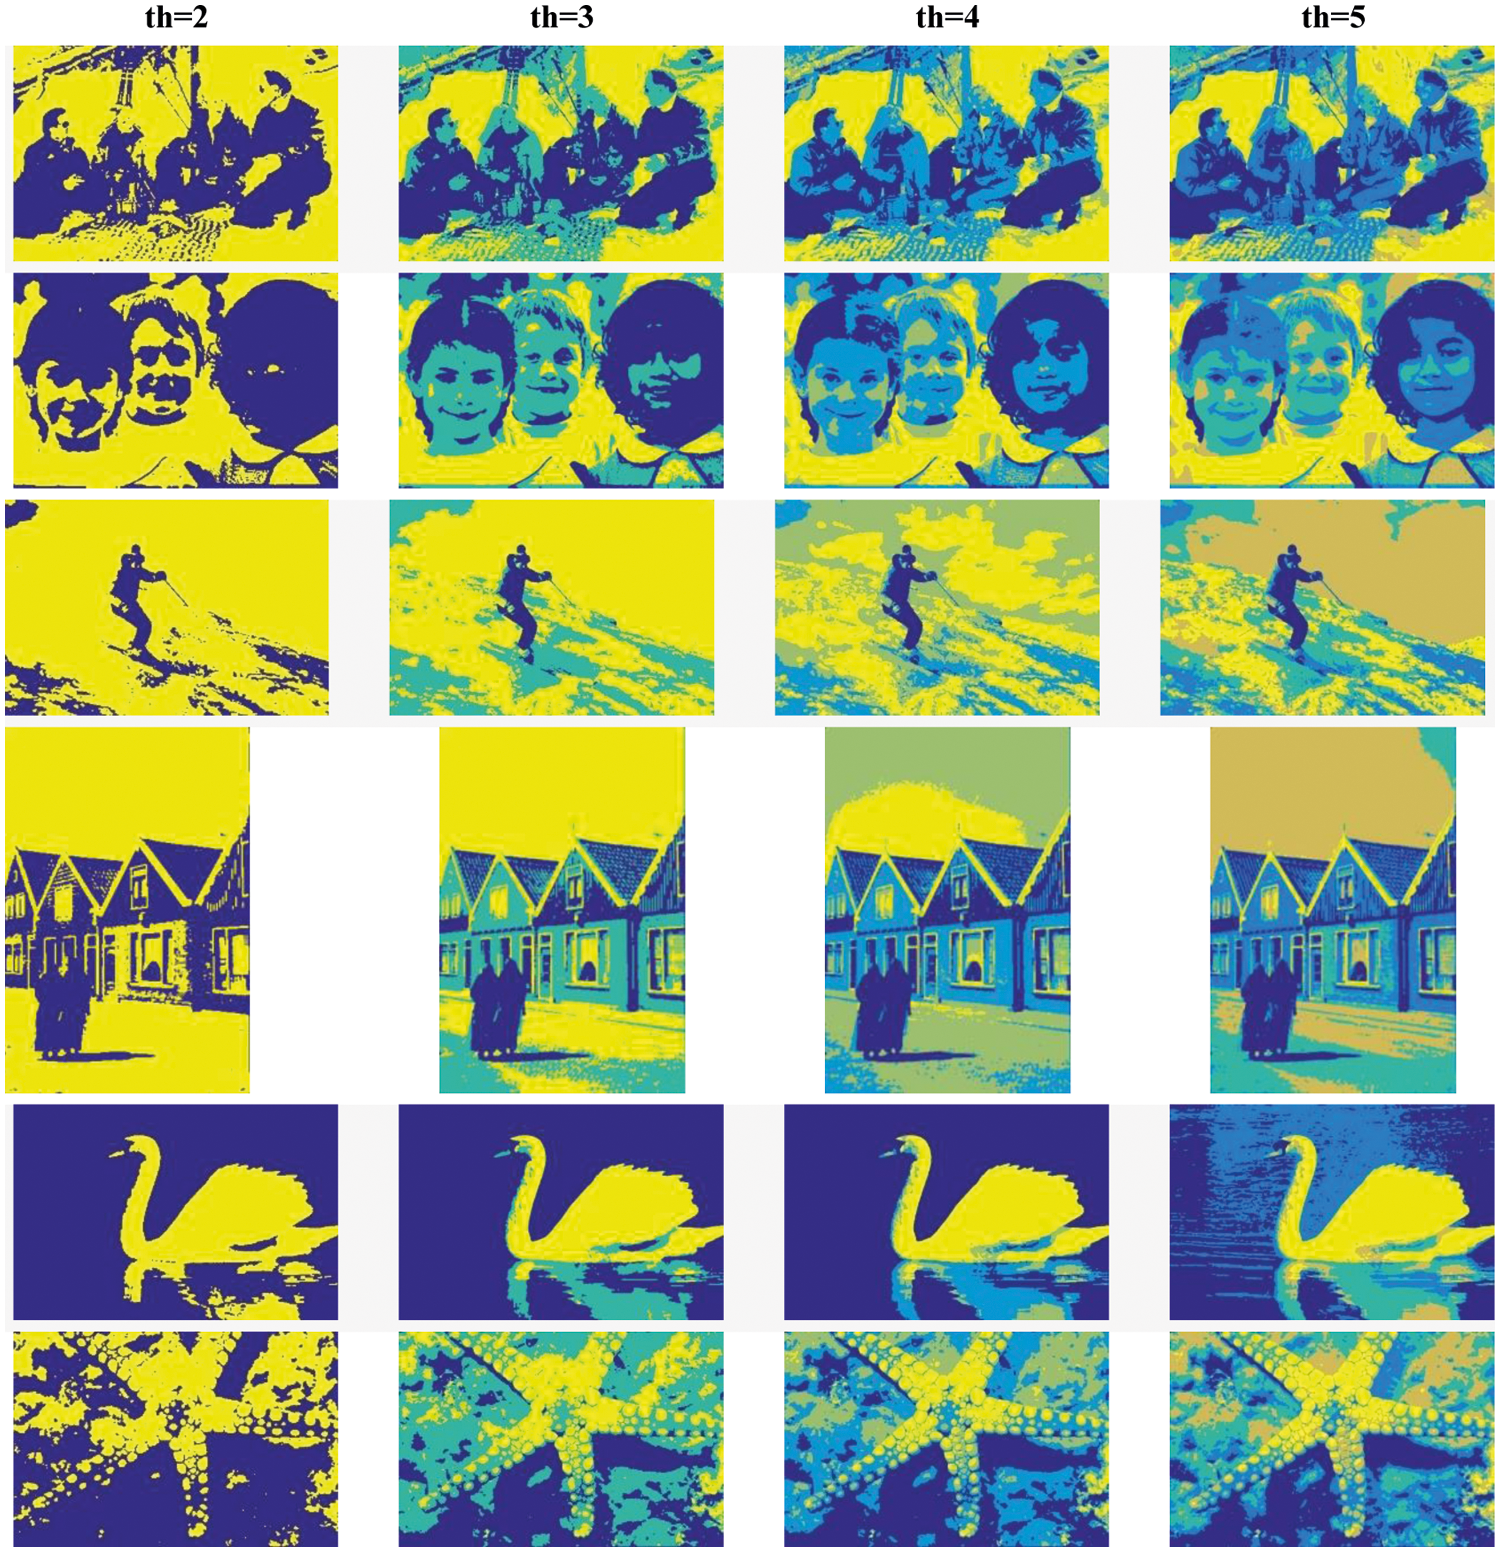
Figure 3: Image thresholding based on FHCOA
From pure visual effect in Fig. 3, it is difficult to evaluate which method is superior to the other. For more accurate comparative analysis, the threshold distribution and segmentation quantitative evaluation values optimized by FICOA and FHCOA are given in Tabs. 4 and 5 respectively. Tabs. 4 and 5 indicate that in comparison of threshold vector th, the threshold value range of FHCOA is wider (more widely distributed), which proves that FHCOA obtains a better threshold to a certain extent. However, the segmentation effect cannot be fully illustrated only by threshold distribution. Therefore, the data of segmentation quality evaluation parameters PSNR and FSIM are also listed in Tabs. 4 and 5.
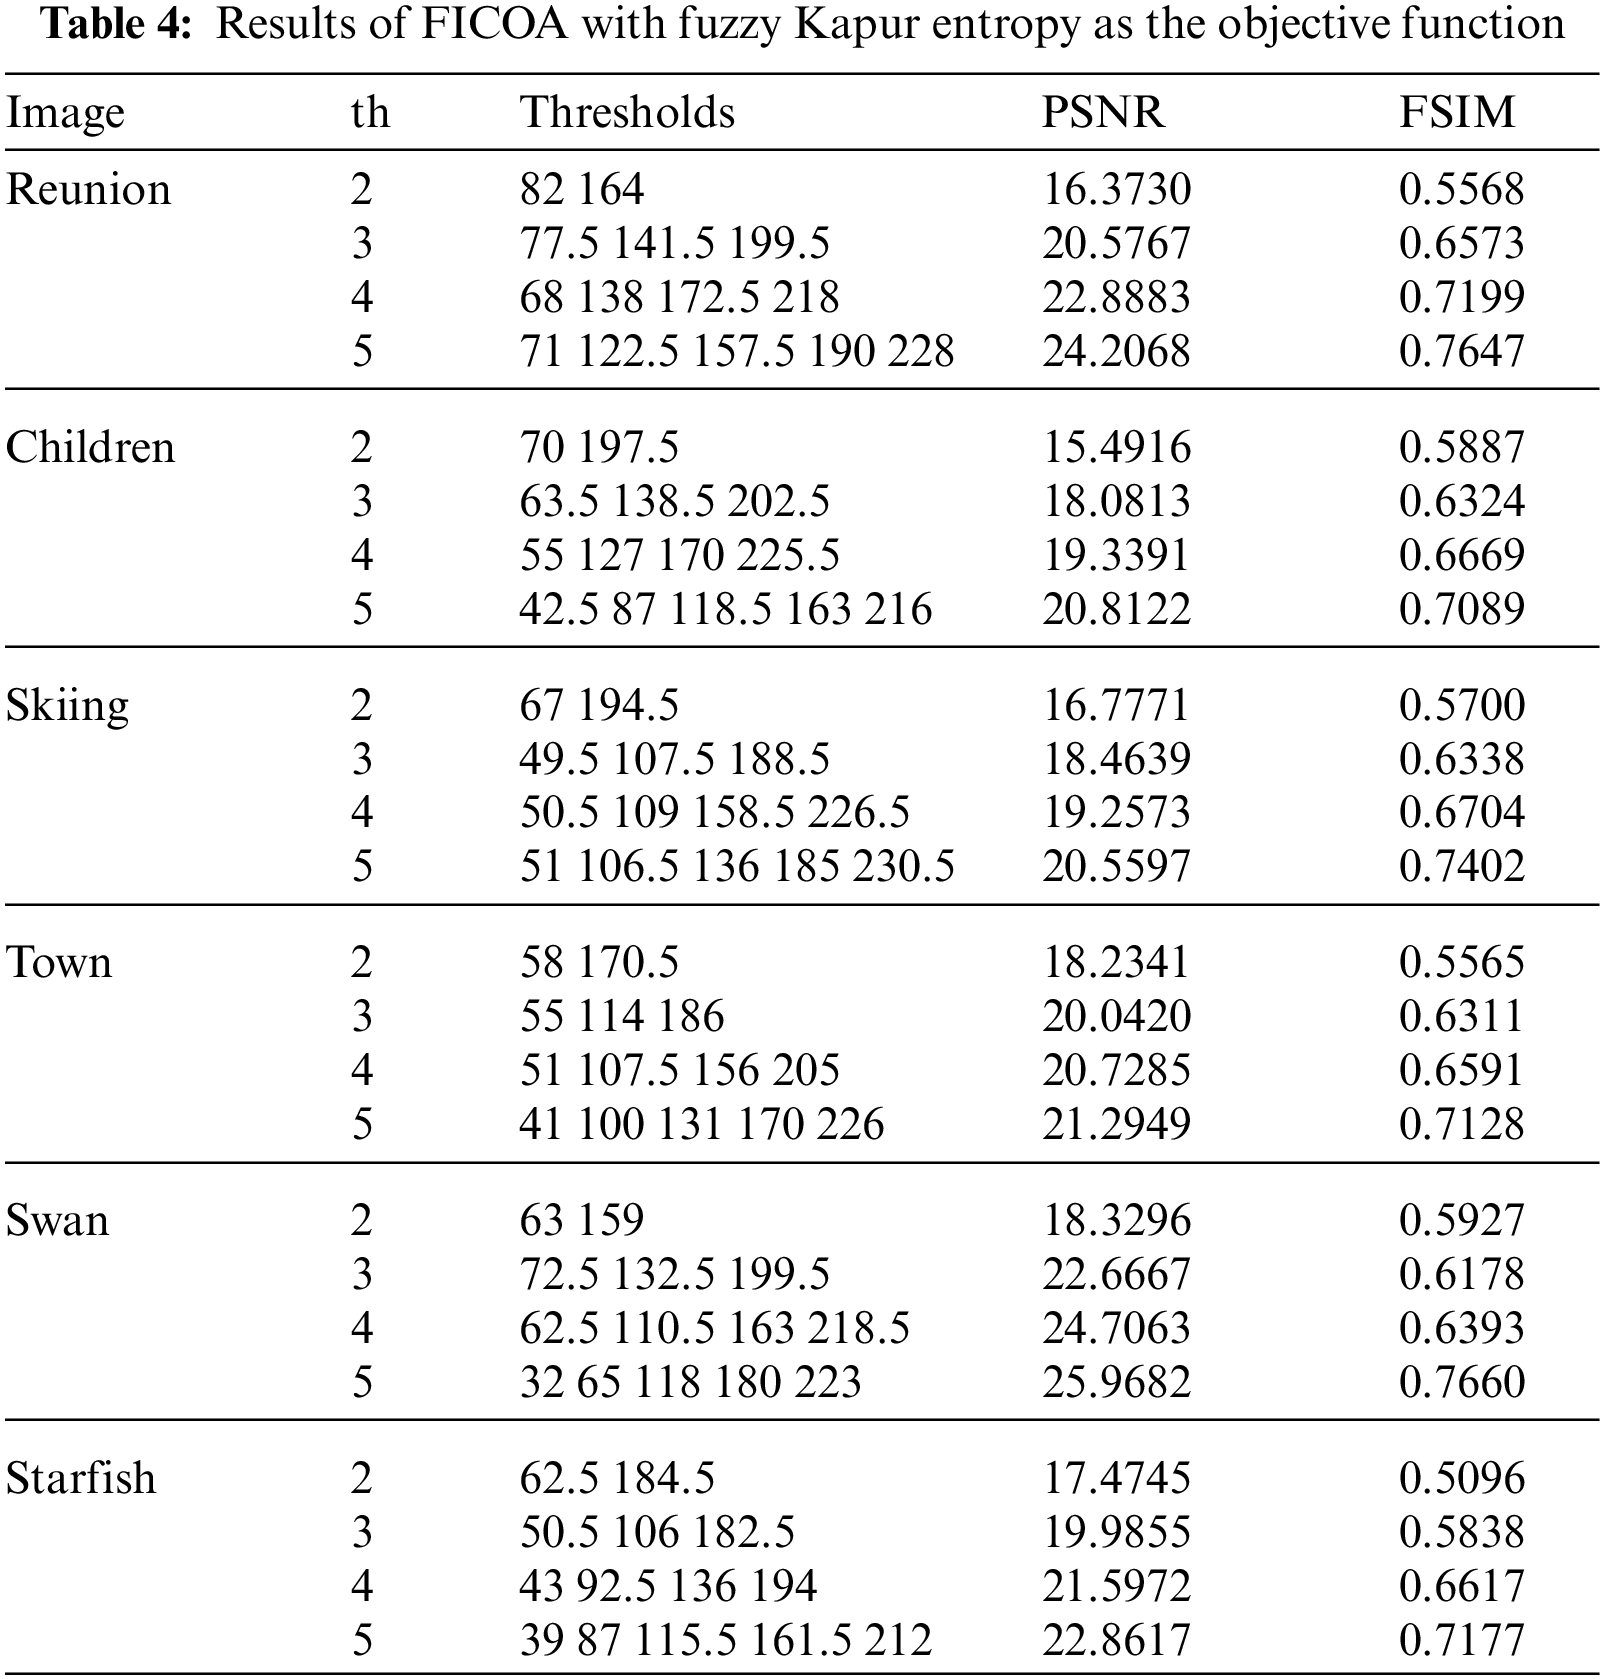
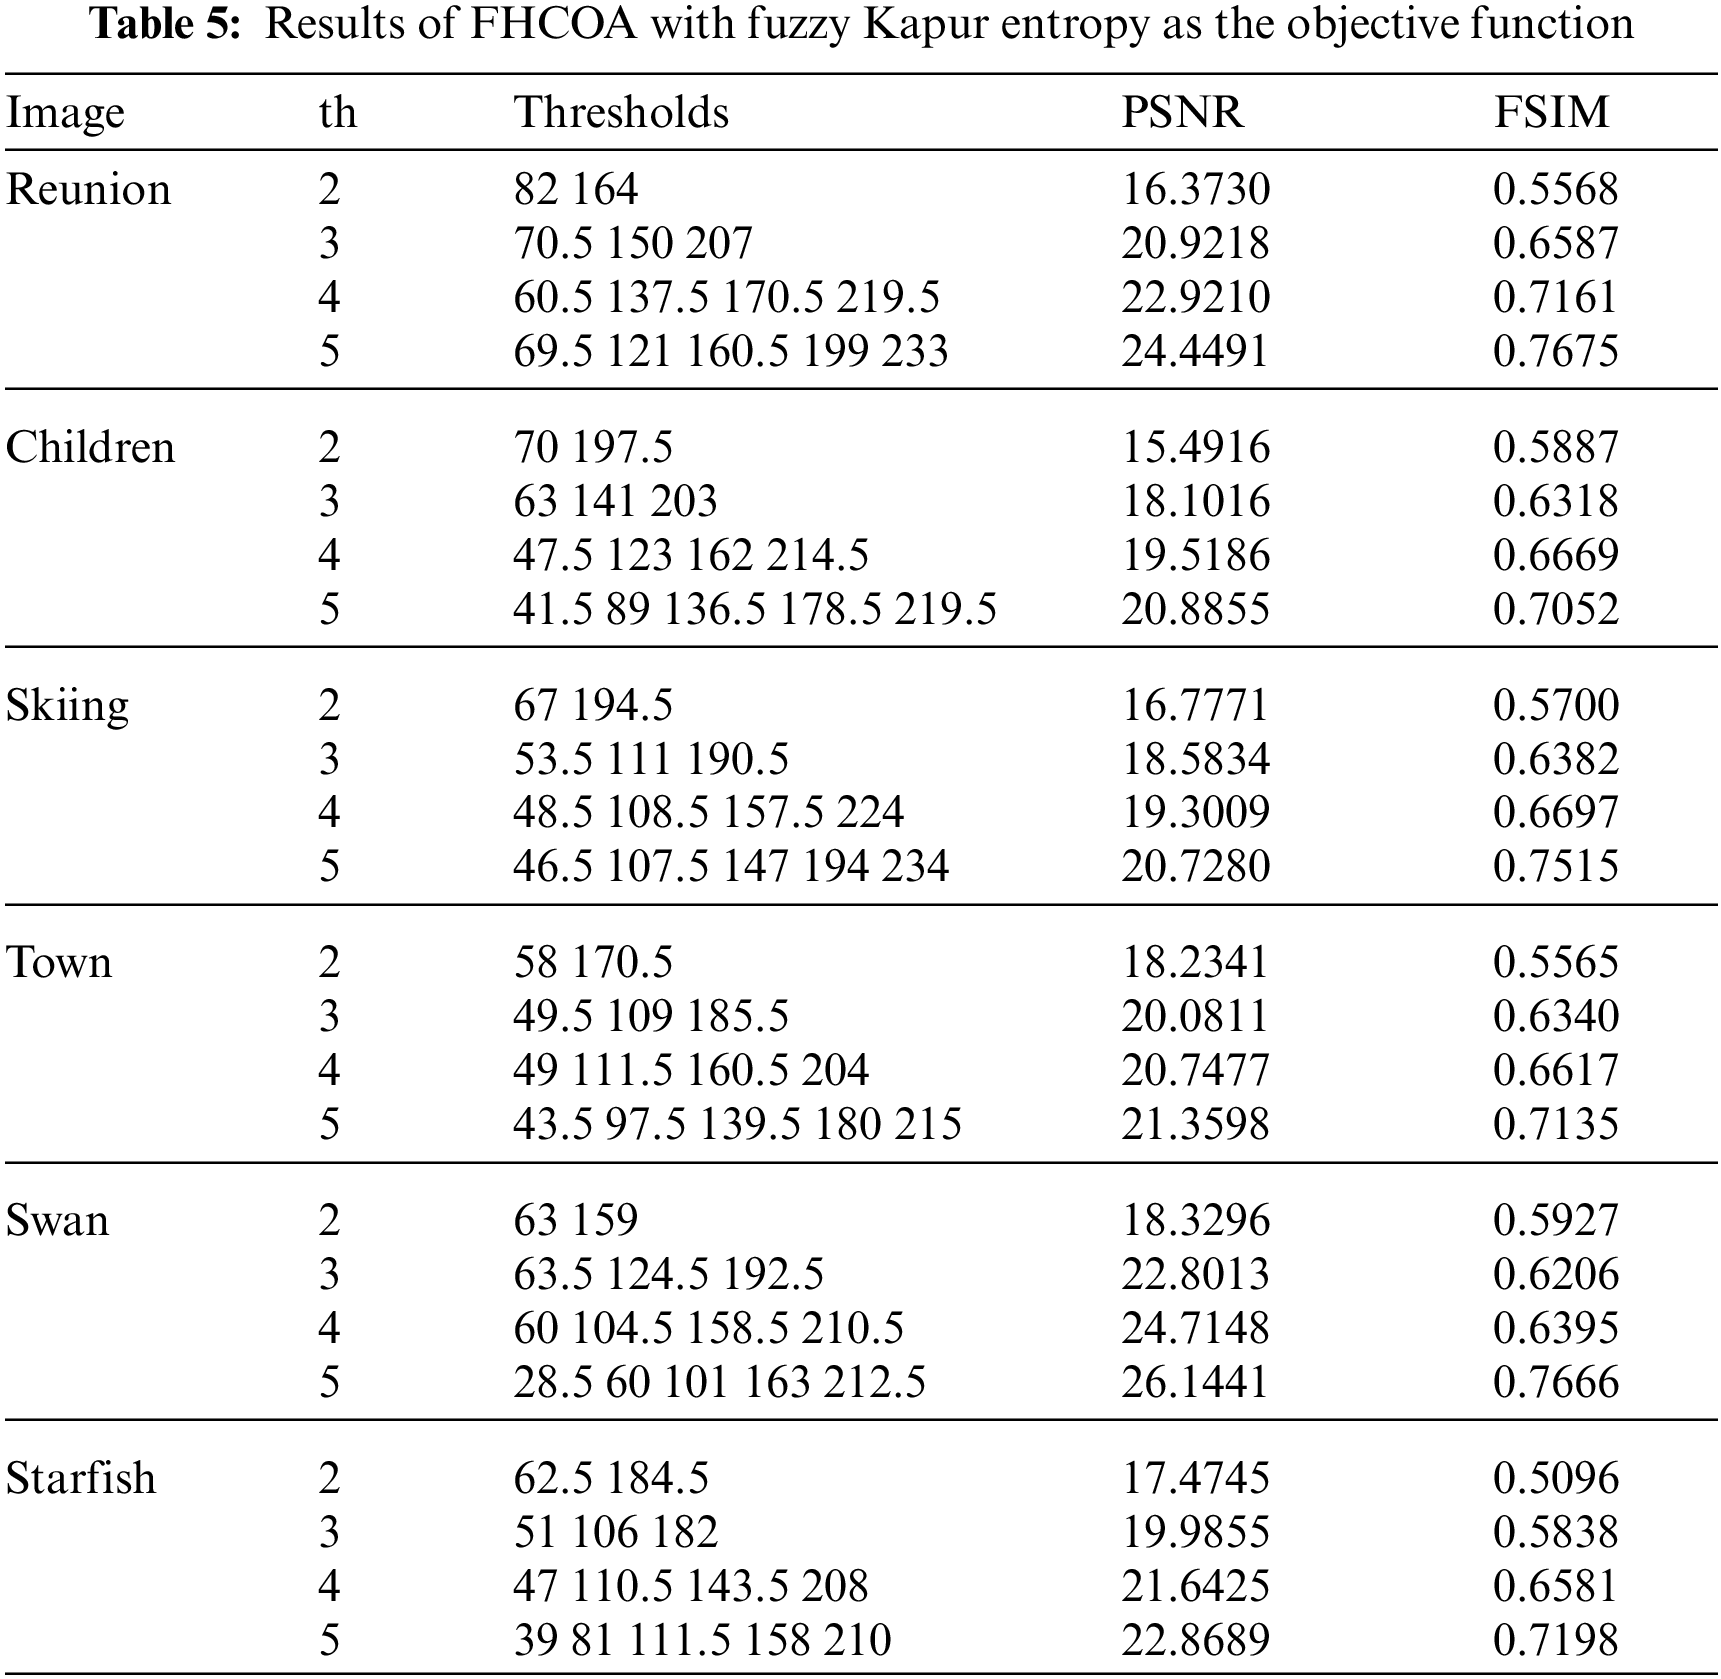
As can be observed in Tabs. 4 and 5, in terms of PSNR evaluation parameters, the values obtained by FHCOA are equal to those by FICOA when the threshold is 2, but with the gradual increase of threshold numbers, the values obtained by FHCOA are higher than FICOA, and the increase proportion basically shows an upward trend. Overall, compared with FICOA, the value obtained by FHCOA increased on average by 0.072, with an average increase ratio of 0.335%. The maximum improvement was obtained on the image Reunion when the threshold is 3, and the evaluation parameter value increased by 0.3451, with an increase ratio of 1.677%. For the FSIM evaluation value, the average increase ratio of FHCOA to FICOA is 1.13%. The maximum improvement occurred on the Skiing image when the threshold is 5, and the improvement ratio was 1.527%. In addition, FHCOA obtains higher values in most cases. Through the detailed comparison of the two evaluation indices, FHCOA has better comprehensive performance in image thresholding quality than FICOA.
4.3 Comparison of PSNR Values of Image Thresholding with Different Algorithms
The previous sections focus on the improved method in our work in aspects of running platform configuration, program parameter setting, data source selection and performance improvement compared with those in [22]. In order to further illustrate the comparative advantages of FHCOA improved by lens imaging strategy and worst coyote reverse learning strategy, this section will focus on comparing and analyzing the advantages and disadvantages of FHCOA with other popular thresholding methods based on NIMA. The comparison references [18–19,22,24] used in this paper take PSNR as the main standard to evaluate the image segmentation effect. Therefore, this section will use this evaluation index to compare FHCOA, FICOA, FCOA, GWO, FMABCA and FMGWOA. The relevant data are shown in Tab. 6.

In Section 4.2, FHCOA has been compared with FCOAF and FICOA in terms of PSNR and FSIM in detail, and it is concluded that the comprehensive performance of FHCOA in image thresholding quality is better than the other two algorithms. According to these comparative analyses, this section focuses on the advantages and disadvantages of FHCOA and other methods (GWO, FMABCA and FMGWOA). Compared with GWO segmentation method, the PSNR value of FHCOA under any threshold number of each image is much higher than GWO. The PSNR value optimized by FHCOA increased by 3.0657 on average, and the average increase ratio was 17.79%. The highest increase occurred on the Starfish image when the threshold is 5, with an increase value of 7.0577 and an increase ratio of 36.98%. The lowest increase occurred on the Children image with a threshold of 2, with an increase value of 0.9099 and an increase ratio of 5.63%. The comparison reveals that FHCOA has significantly improved the segmentation quality on six images, showing that FHCOA has significant advantages in thresholding image segmentation compared with GWO (the same type of NIMA) from the perspective of quantitative analysis.
Compared with FMABCA, except that the PSNR values of both skiing images with threshold number of 2 are equal, in other cases, the PSNR values obtained by FHCOA are higher than FMABCA, with an average increase of 0.462 and an average increase ratio of 2.23%. The highest increase occurs on Swan images with threshold number of 3, with an increase of 2.48 and an increase ratio of 12.2%. From the comparison of FHCOA and FMABCA, it can be found that FHCOA still performs well in image segmentation quality evaluation. Compared with FMABCA, the PSNR value obtained by FMABCA increased by 0.1354 on average, and the average increase ratio was 0.636%. The highest increase occurred on the Reunion image with a threshold of 5, with an increase value of 0.5141 and an increase ratio of 2.15%. In addition, when the threshold number of image skiing and town is 2, the segmentation quality evaluation values obtained by the two algorithms are equal. Only when the threshold number of image children is 3, the PSNR value is 0.0636 higher than FMABCA, with a decrease of only 0.35%. Other experimental data values are higher than FMGWOA. Although the quality evaluation of one image is slightly poor with a certain threshold number, FHCOA is better than FMGWOA in thresholding image segmentation on the whole, especially in terms of average and maximum value improvement.
According to the above comparisons, FHCOA in this study is significantly better than GWO and FMABCA in image segmentation effect, and slightly better than FMGWOA. Combined with the data analysis and comparison in Tabs. 4 and 6, and through the visual comparison in Fig. 3, the improved algorithm which optimizes the best coyote through lens imaging and the worst coyote through reverse learning has greater advantages in multilevel image thresholding.
5 Experimental Results of FHCOA in Brain Image Thresholding
Image thresholding has important application value in pattern recognition and target detection, it is also widely used in medical image processing [22]. In traditional medical diagnosis, the medical effect on patients is mainly observed and analyzed by the doctor's naked eye. Its application value entirely depends on the doctor's experience and professional knowledge, particularly when the medical effect on some mild patients makes it difficult for the doctor to locate the lesions. Therefore, automatic medical image thresholding through computer-aided means has attracted more and more attention. In order to reflect the value of FHCOA in medical image thresholding and to illustrate its practical application value proposed in this paper, this section analyzes the effect of FHCOA in medical image thresholding with five brain medical images.
Fig. 4 illustrates five different original brain images and the visual results after thresholding by FHCOA under different threshold conditions. It can be observed from Fig. 4 that as the threshold number increases, the segmentation of the brain image becomes finer, and all parts of the brain tissues gradually converge together. Drawing upon this segmented region, doctors can more effectively focus on a certain region of the brain, which is more conducive to the diagnosis of brain tissue lesions.
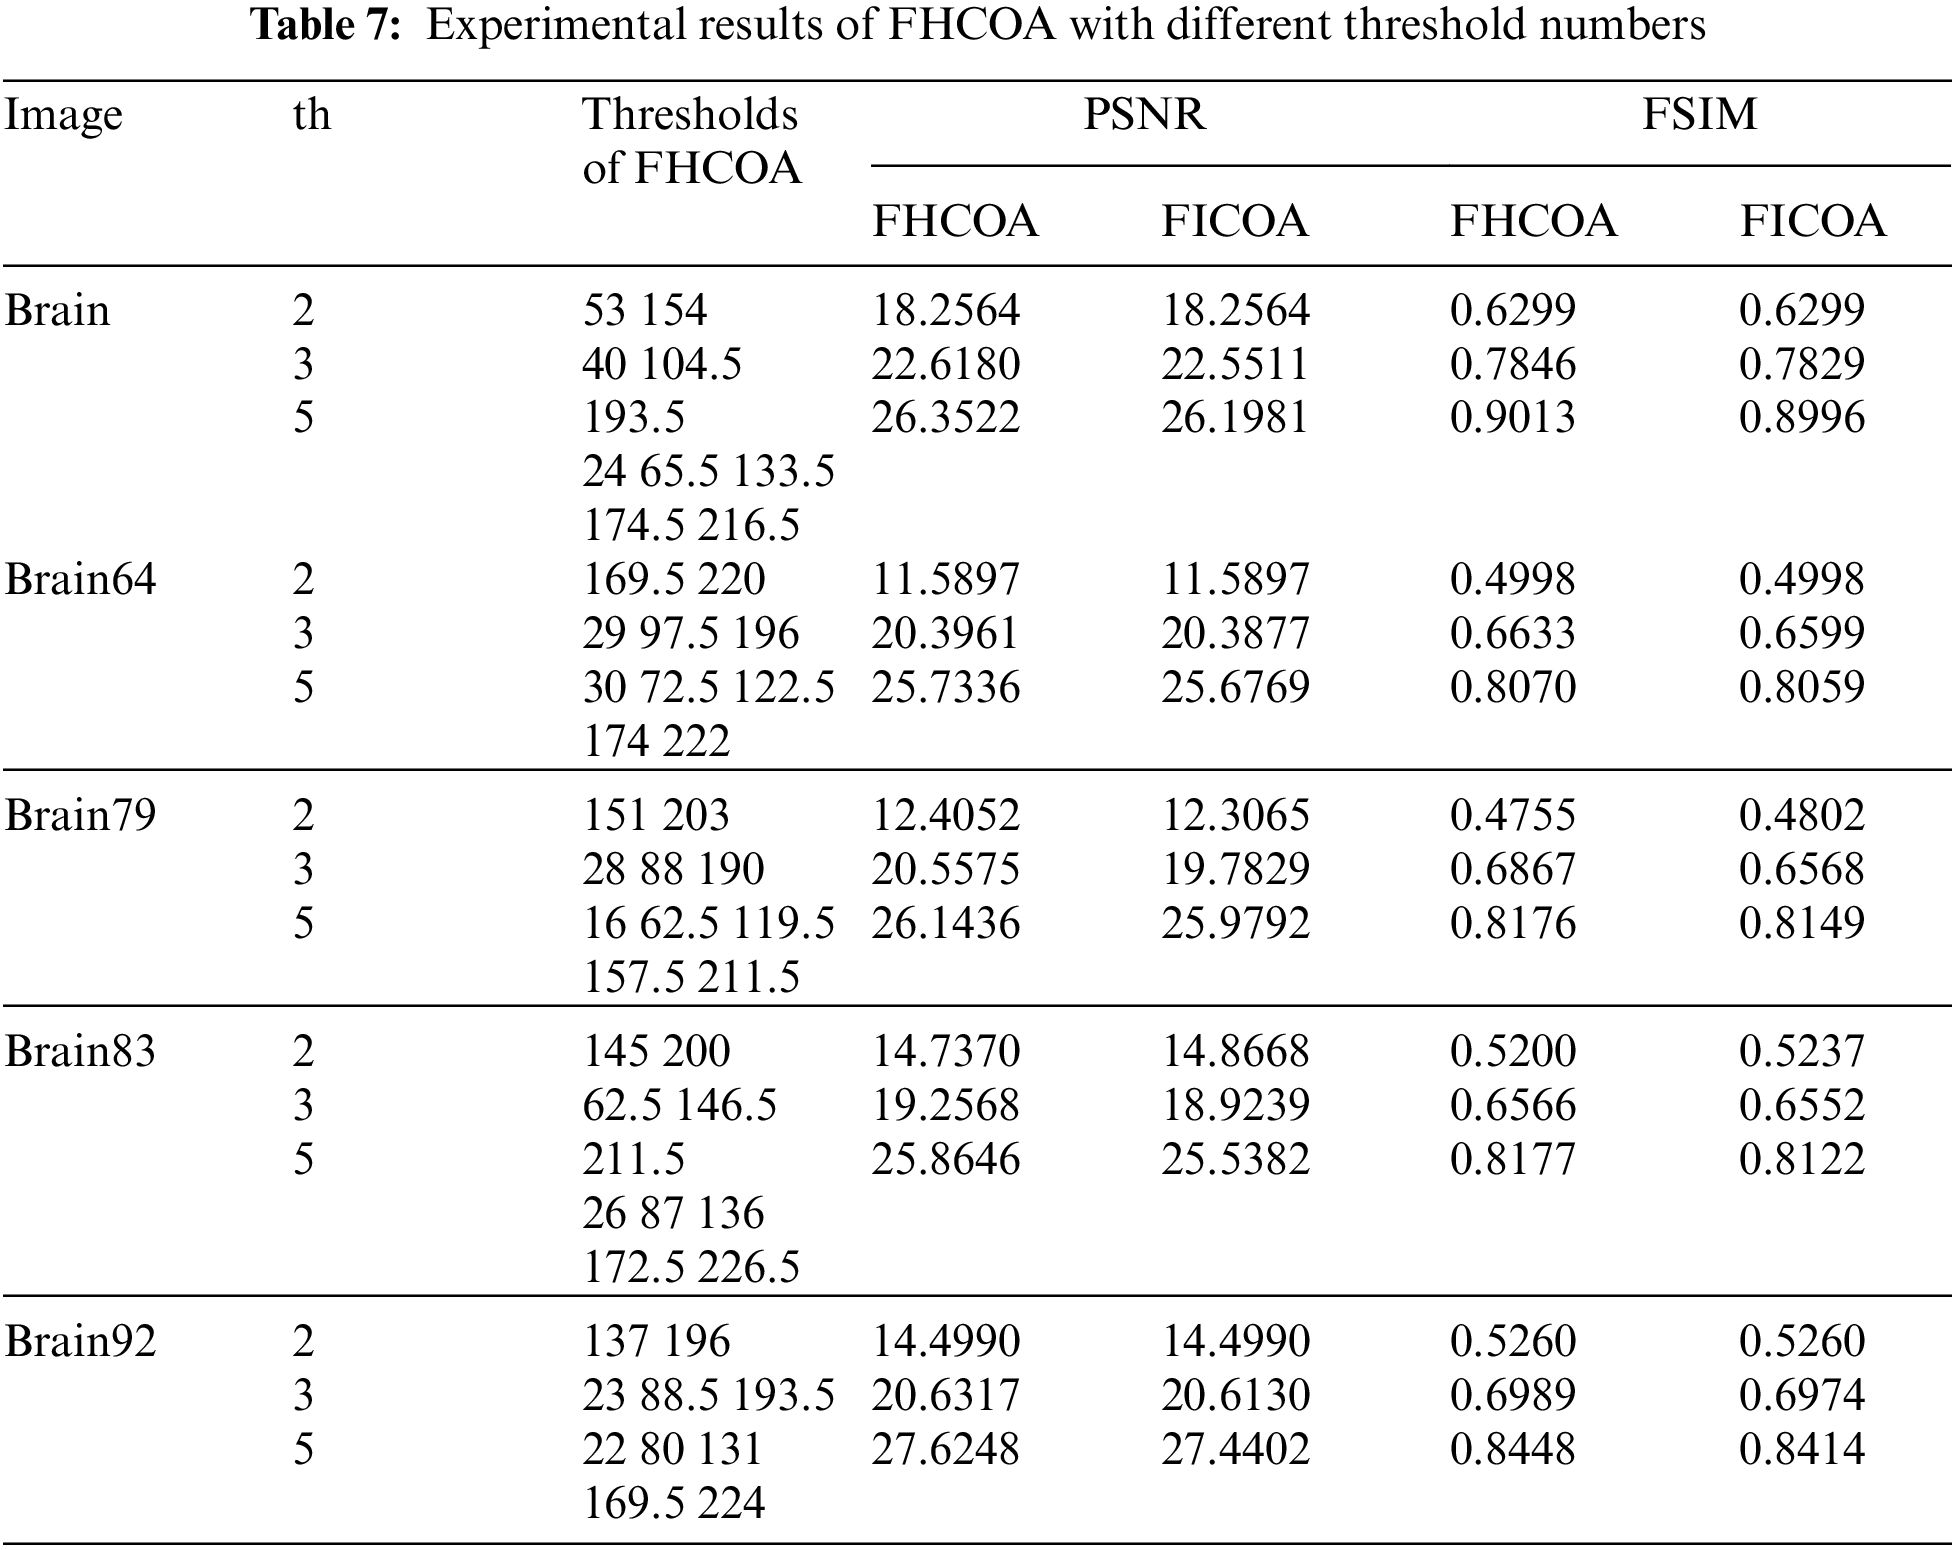
At the same time, if the lesion area is not significant enough, we can also add feature analysis and other means to locate it as soon as possible. In order to quantitatively analyze the brain image segmentation effect, Tab. 7 shows the threshold vector, PSNR and FSIM parameter values of FHCOA when the images in Fig. 4 are segmented with different threshold numbers. At the same time, in order to better analyze the effect of FICOA in medical image segmentation, the quantitative segmentation evaluation data of FICOA [22] under the same image conditions are also listed in Tab. 7. From the comparative analysis of FHCOA and FICOA, the PSNR value obtained by FHCOA increased by 0.1371 on average, and the average improvement ratio was 0.628%. The highest increase occurred on Brain 64 image when the threshold number is 3, with an increase value of 0.7746 and a maximum improvement range of 3.916%. In terms of FSIM evaluation indices, FHCOA is slightly better than FICOA, with an average improvement ratio of 0.38%. Based on the above analysis, FHCOA can not only effectively complete the threshold segmentation of normal images, but also realizes the segmentation of brain medical images, which has significant research value.
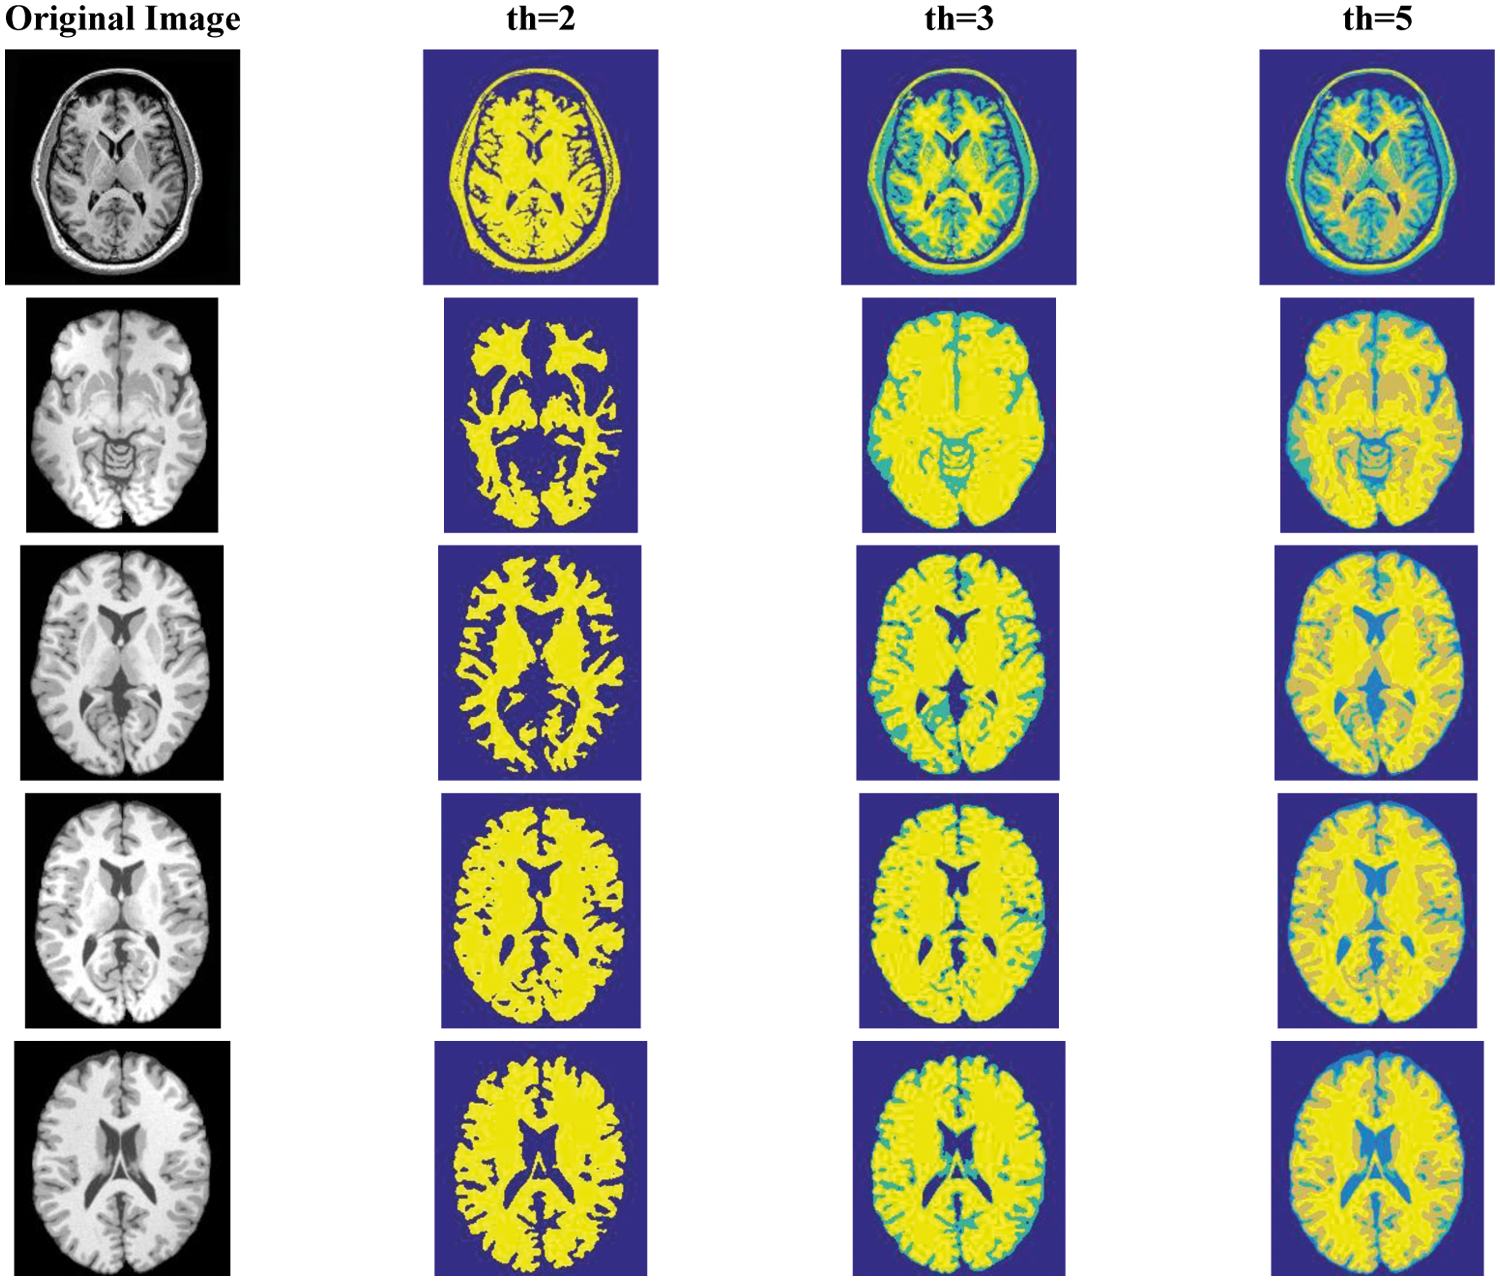
Figure 4: Medical image thresholding based on FHCOA
In order to improve the algorithm efficiency and segmentation quality of COA in multilevel thresholding, this paper introduces chaotic initialization and hybrid reverse learning strategy, proposes an improved coyote algorithm based on hybrid strategy, which combined with fuzzy aggregation method effectively realizes normal thresholding and brain medical image thresholding. In improving the two strategies, chaos initialization is used to initialize the initial coyote population distribution to make it more random and uniform, and hybrid reverse learning strategy is used to overcome the problem of the original algorithm falling into local optimization. On this basis, this paper takes the fuzzy Kapur entropy as the objective function and the fuzzy aggregation theory to have successfully avoided the problem of over segmentation (isolated points or detached island regions). The experimental results show that FHCOA outperforms the other five popular thresholding segmentation algorithms in the comprehensive performance of image segmentation quality with the same test images and the same number of thresholds. In practical applications, we can easily obtain the segmentation results that meet the needs of different conditions by only adjusting the number of thresholds according to the application purpose.
Acknowledgement: Thanks for the support and help of the team when writing the paper. Thanks to the reviewers and experts of your magazine for their valuable opinions on the article revision. This author has provided great inspiration when writing.
Funding Statement: This paper is supported by the National Youth Natural Science Foundation of China (61802208), the National Natural Science Foundation of China (61572261 and 61876089), the Natural Science Foundation of Anhui (1908085MF207, KJ2020A1215, KJ2021A1251 and KJ2021A1253), the Excellent Youth Talent Support Foundation of Anhui (gxyqZD2019097 and gxyqZD2021142), the Postdoctoral Foundation of Jiangsu (2018K009B), the Foundation of Fuyang Normal University (TDJC2021008).
Conflicts of Interest: The authors declare that they have no conflicts of interest to report regarding the present study.
1. S. S. Chouhan, A. Koul and U. P. Singh, “Soft computing approaches for image segmentation: A survey,” Multimedia Tools and Applications, vol. 77, no. 1, pp. 28483–28537, 2018. [Google Scholar]
2. S. Pare, A. Kumar, G. K. Singh and V. Bajaj, “Image segmentation using multilevel thresholding: A research review,” Iranian Journal of Science and Technology, Transactions of Electrical Engineering, vol. 44, no. 1, pp. 1–29, 2020. [Google Scholar]
3. J. Wang and Y. Li, “Splicing image and its localization: A survey,” Journal of Information Hiding and Privacy Protection, vol. 1, no. 2, pp. 77–86, 2019. [Google Scholar]
4. M. Abdel-Basset, R. Mohamed, M. Abouhawwash, R. K. Chakrabortty, M. J. Ryan et al., “An improved jellyfish algorithm for multilevel thresholding of magnetic resonance brain image segmentations,” Computers, Materials & Continua, vol. 68, no. 3, pp. 2961–2977, 2021. [Google Scholar]
5. K. Sowjanya and S. K. Injeti, “Investigation of butterfly optimization and gases brownian motion optimization algorithms for optimal multilevel image thresholding,” Expert Systems with Applications, vol. 182, no. 5, pp. 1–18, 2021. [Google Scholar]
6. F. Zhang, Y. Wu, M. Xu, S. Liu, C. Peng et al., “A morphological image segmentation algorithm for circular overlapping cells,” Intelligent Automation & Soft Computing, vol. 32, no. 1, pp. 301–321, 2022. [Google Scholar]
7. J. Peng, C. Xia, Y. Xu, X. Li, X. Wu et al., “A Multi-task network for cardiac magnetic resonance image segmentation and classification,” Intelligent Automation & Soft Computing, vol. 30, no. 1, pp. 259–272, 2021. [Google Scholar]
8. Y. Xue, H. Zhu and J. Y. Liang, “Adaptive crossover operator based multi-objective binary genetic algorithm for feature selection in classification,” Knowledge-Based Systems, vol. 227, no. 5, pp. 1–9, 2021. [Google Scholar]
9. M. Chouksey, R. K. Jha and R. Sharma, “A fast technique for image segmentation based on two meta-heuristic algorithms,” Multimedia Tools and Applications, vol. 79, no. 27, pp. 19075–19127, 2020. [Google Scholar]
10. S. Pare, A. Kumar, V. Bajaj and G. K. Singh, “Context sensitive multilevel thresholding using swarm based algorithms,” IEEE/CAA Journal of Automatica Sinica, vol. 6, no. 6, pp. 1471–1486, 2019. [Google Scholar]
11. S. Song, H. Jia and J. Ma, “A chaotic electromagnetic field optimization algorithm based on fuzzy entropy for multilevel thresholding color image segmentation,” Entropy, vol. 21, no. 4, pp. 1–36, 2019. [Google Scholar]
12. P. Upadhyay and J. K. Chhabra, “Kapur's entropy based optimal multilevel image segmentation using crow search algorithm,” Applied Soft Computing, vol. 97, pp. 1–15, 2019. [Google Scholar]
13. S. Singh, N. Mittal and H. Singh, “A multilevel thresholding algorithm using HDAFA for image segmentation,” Soft Computing, vol. 25, pp. 10677–10708, 2021. [Google Scholar]
14. E. H. Houssein, E. D. Helmy, D. Oliva, A. A. Elngar and H. Shaban, “A novel black widow optimization algorithm for multilevel thresholding image segmentation,” Expert Systems with Applications, vol. 167, pp. 1–25, 2020. [Google Scholar]
15. A. K. Bhandari, N. Singh and S. Shubham, “An efficient optimal multilevel image thresholding with electromagnetism-like mechanism,” Multimedia Tools and Applications, vol. 78, pp. 35733–35788, 2019. [Google Scholar]
16. L. Li, L. Sun, G. Jian, J. Qi, B. Xu et al., “Modified discrete grey wolf optimizer algorithm for multilevel image thresholding,” Computational Intelligence and Neuroscience, vol. 2017, pp. 1–16, 2017. [Google Scholar]
17. A. Raj, G. Gautam, S. Abdullah, A. S. Zaini and S. Mukhopadhyay, “Multi-level thresholding based on differential evolution and tsallis fuzzy entropy,” Image and Vision Computing, vol. 91, pp. 1–14, 2019. [Google Scholar]
18. L. Li, L. Sun, W. Kang, J. Guo, C. Han et al., “Fuzzy multilevel image thresholding based on modified discrete grey wolf optimizer and local information aggregation,” IEEE Access, vol. 4, pp. 6438–6450, 2016. [Google Scholar]
19. L. Li, L. Sun, G. Jian, C. Han and S. Li, “Fuzzy multilevel image thresholding based on modified quick artificial bee colony algorithm and local information aggregation,” Mathematical Problems in Engineering, vol. 2016, pp. 1–18, 2016. [Google Scholar]
20. E. H. Houssein, K. Hussain, L. Abualigah, M. A. Elaziz and E. Cuevas, “An improved opposition-based marine predators algorithm for global optimization and multilevel thresholding image segmentation,” Knowledge-Based Systems, vol. 229, pp. 1–33, 2021. [Google Scholar]
21. S. Singh, N. Mittal, D. Thakur, H. Singh, D. Oliva et al., “Nature and biologically inspired image segmentation techniques,” Archives of Computational Methods in Engineering, vol. 2021, pp. 1–28, 2021. [Google Scholar]
22. L. Li, L. Sun, Y. Xue, S. Li, X. Huang et al., “Fuzzy multilevel image thresholding based on improved coyote optimization algorithm,” IEEE Access, vol. 9, pp. 33595–33607, 2021. [Google Scholar]
23. O. Thinnukool, T. Panityakul and M. Bano, “Double encryption using trigonometric chaotic map and xor of an image,” Computers, Materials & Continua, vol. 69, no. 3, pp. 3033–3046, 2021. [Google Scholar]
24. A. Khairuzzaman and S. Chaudhury, “Multilevel thresholding using grey wolf optimizer for image segmentation,” Expert Systems with Applications, vol. 86, pp. 64–76, 2017. [Google Scholar]
25. L. Shen, X. Chen, Z. Pan, K. Fan and J. Lei, “No-reference stereoscopic image quality assessment based on global and local content characteristics,” Neurocomputing, vol. 424, pp. 132–142, 2021. [Google Scholar]
 | This work is licensed under a Creative Commons Attribution 4.0 International License, which permits unrestricted use, distribution, and reproduction in any medium, provided the original work is properly cited. |