DOI:10.32604/cmc.2022.026698
| Computers, Materials & Continua DOI:10.32604/cmc.2022.026698 | |
| Article |
Interest Points Analysis for Internet Forum Based on Long-Short Windows Similarity
1State Key Laboratory of Mathematical Engineering and Advanced Computing, Zhengzhou, 450001, China
2School of Computing and Information Systems, Singapore Management University, 188065, Singapore
3College of Computer Science and Big Data, Fuzhou University, Fuzhou, 350116, China
*Corresponding Author: Jicang Lu. Email: lujicang@sina.com
Received: 02 January 2022; Accepted: 12 February 2022
Abstract: For Internet forum Points of Interest (PoI), existing analysis methods are usually lack of usability analysis under different conditions and ignore the long-term variation, which lead to blindness in method selection. To address this problem, this paper proposed a PoI variation prediction framework based on similarity analysis between long and short windows. Based on the framework, this paper presented 5 PoI analysis algorithms which can be categorized into 2 types, i.e., the traditional sequence analysis methods such as autoregressive integrated moving average model (ARIMA), support vector regressor (SVR), and the deep learning methods such as convolutional neural network (CNN), long-short term memory network (LSTM), Transformer (TRM). Specifically, this paper firstly divides observed data into long and short windows, and extracts key words as PoI of each window. Then, the PoI similarities between long and short windows are calculated for training and prediction. Finally, series of experiments is conducted based on real Internet forum datasets. The results show that, all the 5 algorithms could predict PoI variations well, which indicate effectiveness of the proposed framework. When the length of long window is small, traditional methods perform better, and SVR is the best. On the contrary, the deep learning methods show superiority, and LSTM performs best. The results could provide beneficial references for PoI variation analysis and prediction algorithms selection under different parameter configurations.
Keywords: Point of interest (PoI) analysis; long and short windows; sequential analysis; deep learning
The 48th Statistical Reports on China's Internet Development [1] released by China Internet Network Information Center (CNNIC) points out that, the netizen from China has reached 1,011 million up to June, 2021, and is rising continuously. Internet has become an important platform that could publish people's opinions and reflect the dynamic social opinions. The researching on social media or social network have attracted lots of attentions, such as abnormal event analysis [2], user experience computing [3], community detection [4,5], etc. Internet forums such as Baidu Tieba could reflect the Point of Interest (PoI) of Internet users objectively and roundly, and has played an important role in information diffusion around the world. However, influenced by information diffusion on the Internet, users’ PoIs are always changing over time [6]. At the same time, with increasing of the scale and complexity of Internet forum data, the requirements for computing efficiency and prediction accuracy are raising too, which is also a difficult problem for both academic researches and practical applications.
For forum PoI analysis, existing studies focus on predicting and recommending by constructing data sequences from users’ historical posts and behaviors. Existing methods can be divided into two categories: the methods based on traditional sequential analysis and the methods based on recommendation system. Sequential analysis-based methods construct user PoIs as time sequences for prediction. For example, the dynamic sequences are modeled by user behaviors in [7] and social network in [8] to predict user PoI, respectively. Reference [9] tries to bridge the gap between causal relevance and pattern discriminability, which improves the mining performance of user PoI with explicit pattern. A content prediction method is proposed in [10,11] proposes a method to learn, model and predict the dynamic behavior in network. There are also methods to predict PoI based on popularity analysis in social networks or forums, such as AR (auto regression) model [12], SVR [13], logistic regression model [14], and the model based on micro and macro comprehensive analysis [15]. The methods based on recommendation system usually build user model by mining user interest [16] or behavior characteristics. For example, a recommendation method based on similarity analysis is proposed in [17]. In [18], a user interest point recommendation method is proposed based on user-item score matrix, which is constructed and calculated by users and their interest points. Reference [19] takes the user scores as recommendation basis and generate a list of recommended items for each user to address the cold start problem. A matrix decomposition-based recommendation method integrating forgetting function and user characteristics is proposed in [20]. In fact, above methods are generally based on the following assumptions: the user interest points or PoIs are time-variation but can be predicted according to historical information. By taking this assumption as basis, this paper would research the time-variation law and prediction method of network forum PoIs.
Although there are some researches on predicting PoI variation for online forums, the usability analysis of different methods in different situations is not enough. Most of existing researches ignore the long-term variation law of PoIs, which results in the blindness on selecting prediction methods in practical applications. In addition, the rapid development of deep learning and representation learning technology [21–23] in recent years also provides a referential idea for PoI variation prediction. Based on the in-depth analysis of user PoI prediction on Internet forum, this paper proposes a PoI variation prediction framework and corresponding prediction methods based on similarity analysis between long and short windows. The main contributions are as follows:
(1) A prediction and analysis framework of PoIs variation based on similarity analysis between long and short windows is proposed. Based on the division of long-term and short-term windows for collected historical data of Internet forum, the framework calculates the similarity of PoIs between them, predicts the variation trend of PoIs in the future short-term windows according to their historical changes. The results are conducive to the analysis of PoI variation law along long-term window.
(2) Five kinds of PoIs variation prediction methods based on two types of models are given. According to the variation law and characteristics of PoIs in online forums, five kinds of PoI variation prediction methods are given from the perspectives of traditional sequence analysis and deep learning models following the above PoI variation prediction and analysis framework.
(3) The variation law of PoIs and the selection strategy of prediction methods under different situations is analyzed. Based on the proposed method, series of experimental analysis are carried out on real-world datasets, which could verify the effectiveness of the proposed prediction framework and implementation method. In the meantime, based on the analysis of the test results, the paper provides a guiding analysis method for the construction of samples, the discovery of the variation law of PoIs, and the selection of prediction methods.
The following contents of this paper are organized as follows: Section 2 describes the problem of PoIs variations prediction in online forums. Section 3 introduces the PoI variation prediction and analysis framework proposed in this paper. Section 4 gives the PoI extraction and comparative analysis methods of the two types of models according to the proposed framework. In Section 5, the experiment settings and result analysis are described. Section 6 concludes the full paper.
In the real world, the hot events and popular culture usually change over time. people's PoIs will also transfer on the network forums. For example, some PoIs will gradually be forgotten by people and may disappear, new PoIs will thrive as a supplement continuously, but some may always be the objects of interest to users. Therefore, by analyzing and studying the rules as well as evolution trend of network forums, users and public opinion over time, people could further strengthen the sensitivity to network situation. It becomes more and more important to master public opinion situation and guide them according to the evolution situation.
In Chinese online forums, some very representative ones are Baidu Post Bar, Tianya Forum, Tiexue Forum, Douban, Zhihu and so on. There are some differences in the potential rules of different forums, but the structure and operation mode are usually similar. They all have a dynamic response to the real social public opinion in cyberspace. Therefore, they usually have similar characteristics and potential rules. Among them, Baidu Post Bar has 30 million theme bars and nearly 700 million registered users. It has a huge user group and quantity of information. It is considered the most representative platform. Therefore, this paper will take Baidu Post Bar as an example to study and analyze the variation rules and prediction method of user PoIs.
The public opinion reflected by the network forum is a more objective reflection of the behavior and activity regularity of human beings. Although people pay different attention to current events in different periods, the internal variation laws should conform to the regularity of people's behavior and activities. Therefore, the network public opinion often has a relatively similar variation laws in different periods. Similarly, for Baidu Post Bar concerned in this paper, although the PoI of a specific theme post bar are different in different periods, the variation laws are always similar. If the PoI at the current moment is the continuation of historical moment, it is similar to the PoI in a certain history period. With the transformation of network public opinion at different times, its PoI will also change regularly. If a new PoI appears at present, it will be quite different from the PoI in a certain historical period, which provides a basis for the prediction and analysis of the PoI change.
Based on the above analysis, we give the following description: for a post bar with specific topic, assume that the similarity between its PoI at time t and those in the past m times is
Next, based on the above description and assumptions, we propose a PoI variation prediction framework based on similarity calculation between long and short windows.
3 The Proposed PoI Variation Prediction Framework
Forum PoI prediction is a sub-task of network public opinion analysis, the core of which is to extract the description and representation of a specific topic from the forum user's comments, posts and other information, which might be a sequence of sentences, phrases or words. Some methods are proposed to extract features from social network text [24]. Due to the complexity and freedom of the online forum, multiple themes or topics are often involved in the same time period. Therefore, the use of word sequences will more objectively and comprehensively reflect the PoIs of forum users. In view of predicting the change of forum PoI, this paper presents the following analysis ideas and basic framework: first, determine the division and setting of long-term window and short-term window. Second, extract their PoIs from the posts in the two types of windows. Third, calculate the similarity of the two types of window PoIs, and obtain the sequence of similarity changes. Finally, select the prediction method based on the traditional sequence analysis or deep learning model, train and learn the corresponding prediction model, and predict the changes of future PoIs. Furthermore, the analysis of the potential change regularity of the forum's PoIs and relevant results could also provide reference for parameter configuration, prediction analysis method selection, etc. The above procedure could be described in Fig. 1, which could continuously improve the prediction performance through cyclic iteration processing.
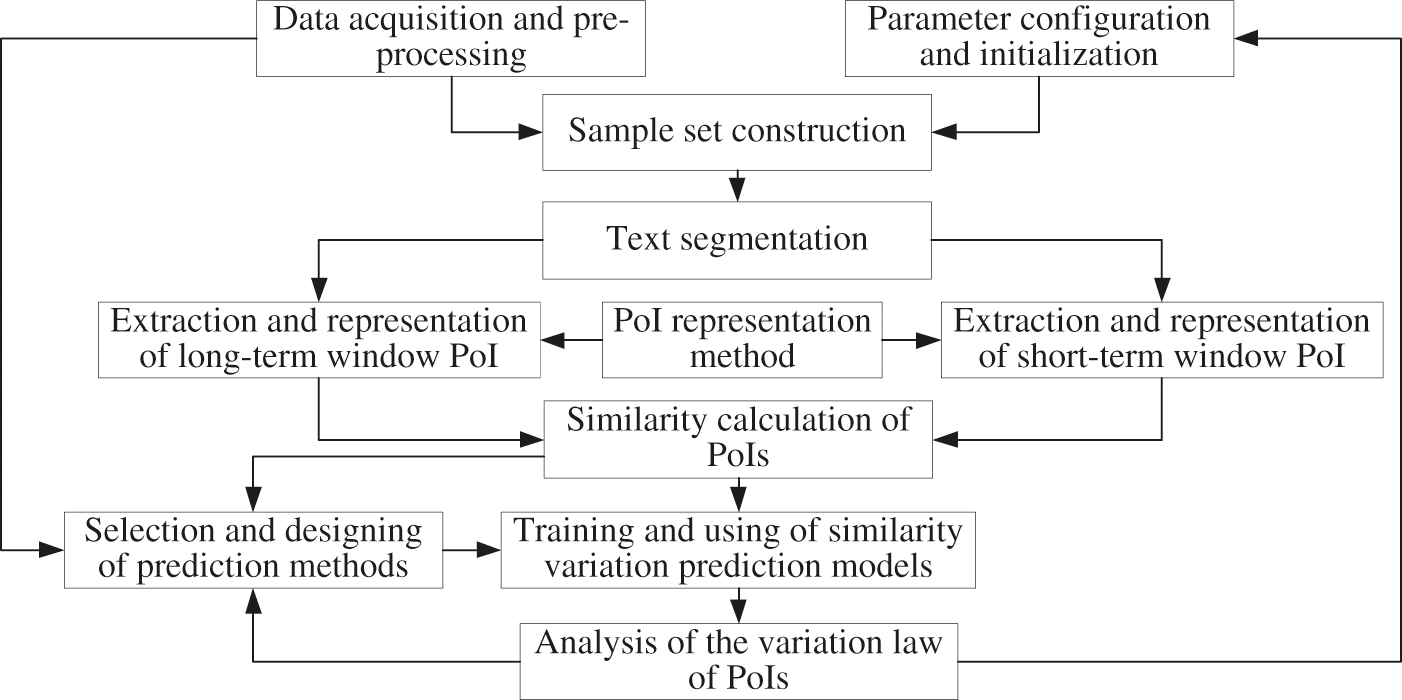
Figure 1: A framework for predicting PoI variation based on similarity between long and short windows
The prediction framework described in Fig. 1 can be implemented in seven steps as follows:
Step 1: Parameter initialization and sample set construction. According to the above analysis conclusions, the change of forum PoIs usually has a certain changing law over a period. When analyzing its possible laws of change, the obtained data should cover the corresponding time period as long as possible to maintain its integrity. Therefore, after sampling the forum data, the first step should be to set up a long-term window (abbreviated as “LW”, e.g., 1, 2, or 4 months.) and its sliding steps (abbreviated as “LS”, e.g., 1, 2, or 3 days.), short term window (abbreviated as “SW”, e.g., 1 day, 3 days, weeks, etc.) and its sliding steps (abbreviated as “SS”, e.g., 1 day, 2 days, 3 days, etc.). Where the sliding step is a parameter to determine the data sampling of the next window after data sampling and analysis of the current window is completed. After the above processing, we can get a long-term window sequence over a period of time and a short-term window sequence within each long-term window.
Step 2: Text segmentation. In forums, each post usually includes a title and content, which may involve text, image, audio, and so on. Before text segmentation, in order to maintain the semantic integrity of the post, the image and audio should be converted into text and merged with the original text content as the full description of the post. For example, if the content is given by image, the typical OCR (Optical Character Recognition) tools could be used to recognize and extract the text information. If the content is given by audio, the type speech recognition models or methods could be used to recognize and convert it into text. Then, try to use jieba, Baidu API or other tools for word-segmentation processing.
Step 3: Extraction of long-term window PoIs. For all posts in each long-term window, all keywords are sorted in importance based on text segmentation results in Step 2. The importance could be calculated using algorithms such as TF-IDF (Term Frequency-Inverse Document Frequency) or its improved algorithm. Then, select the most important part of the keywords, such as the top-k (k could be 10, 20 or 30) importance keywords, and consist of a sequence of keywords as the PoIs of the long-term window.
Step 4: Extraction of short-term window PoIs. For all posts in each short-term window, similar with step 3, all keywords are sorted in importance using TF-IDF or its improved algorithm based on the text segmentation results of step 2. Then, select the most important part of the keywords, such as the top-k (k could be 10, 20 or 30, and should be consistent with step 3, fill in with NULL when not enough) importance keywords), and consist of a sequence of keywords as the PoIs of the short-term window.
Step 5: PoIs similarity calculation. For each long-term window, calculate the similarity between each short-term window PoIs and the long-term window PoIs using SimHash and its improved algorithm or the popular word vector representation algorithm, and get the similarity sequence of PoIs within the long-term window over all time.
Step 6: The training and application of PoIs similarity prediction model. For the previous part (such as 80%) of the long-term window sequence obtained in step 1, the similarities of each short-term window and its long-term window PoIs are taken as a known sequence, which consist of the training sample set. And for the remaining part (such as 20%) of the long-term window sequence, the similarities of each short-term window and its long-term window PoIs are taken as an unknown sequence, which consist of the test sample set to be predicted. Then, based on the forum's PoIs characteristics, traditional sequence analysis models such as ARIMA, SVR or deep learning models such as CNN, LSTM, Transformer are used to train the corresponding prediction models. Finally, a prediction analysis method of future trends in the similarity of the PoIs of a short-term window to its long-term window is presented.
Step 7: Analysis of the variation law of PoIs. By comparing the prediction results under different parameter configurations in step 1, the variation law and the accurate judgment method are analyzed and presented for the PoIs, which provides reference for further public opinion guidance and control. For example, for two long-term windows which are 1 month and 2 months, analysis of each long-term window under two short term window which are 1 day and 2 days. All the sliding steps of the long-term window are 1 day. Then, we could get four cases of parameter configuration, and the corresponding 4 prediction results will also be obtained. When the long-term window is 2 months and its short-term window is 2 days, if accuracy of the prediction result is the highest, it could indicate that, compared with other parameter configurations, the configuration in this case can more fully reflect the general variation law of the forum's PoIs, which will be more meaningful to apply the analysis on real public opinion.
4 Two Types of Implementations for Extraction and Change Prediction of PoI
Based on the prediction and analysis framework designed in the previous section, combined with the current research progress of natural language processing, machine learning, deep learning and other techniques, this section will first give the PoI extraction method based on keyword sequence. Based on that, by combining with the traditional sequence analysis and deep learning models, respectively, this section will give the method on the corresponding PoI change prediction analysis.
4.1 PoI Extraction Based on Keyword Sequences
In order to reflect users’ PoI of the network forum more objectively and comprehensively, the description method based on keywords sequence is proposed. The procedures include word segmentation, word importance sorting, keyword selection, etc. For Chinese text, the tool that generally has better effect is Jieba Tokenizer, which plays an important role in many natural language processing tasks.
The basic idea of Jieba Tokenizer is to find the most appropriate sequence of words based on HMM (Hidden Markov Model). HMM marks each Chinese word as a combination of four states, where “B” indicates the beginning of a word, “M” indicates the inside of a word, “E” indicates the end of a word, and “S” indicates a single word. For example: “北京” is marked as “BE” or “北/B 京/E”, “联合国” is marked as “BME” or “联/B 合/M 国/E”, “人” is marked as “S” or “人/S”, etc. The core of HMM is to find an optimal sequence of states, that is, the state sequence with the highest joint probability. The calculated expression of the union probability is shown below:
where X is the observation sequence, i.e., the sentence to be tokenized. Y is the hidden state sequence, i.e., the possible state sequence corresponding to each word. T represents the length of the state sequence.
Based on the above word tokenize results, TF-IDF algorithm is used to extract keywords. It is an unsupervised learning algorithm, whose main idea is to measure the frequency of a given word in a number of documents, and then take it as an indicator of the importance of the word. The algorithm can be divided into two parts: Term Frequency (TF) and Inverse Document Frequency (IDF). In this paper, a document corresponds to a post. The documents set that belong to a long window is a collection of all posts within that long span, and the documents set that belong to a short window is a collection of all posts within that short span. Then, when the post collection contains a total of N posts, take frequency
where
If word i appears in
By combining the two results above, we can get the importance measurement of keyword
After calculating the importance of all words, we sort the results in descending order, and select the most important part, such as the first 10, 20, or 30 words, to form a sequence of keywords that represent the PoI described in this article.
4.1.2 Representation and Similarity Calculation of PoI
In view of predicting PoIs changes, this paper intends to reflect them with the similarity change of PoIs between long-term window and short-term window. The procedure mainly involves the representation of PoI and its similarity calculation. This paper proposes two ways to achieve that. One of them is to directly calculate and obtain the similarity value of PoI, which could be considered as one stage method, such as SimHash algorithm used in this paper. The other is to calculate the similarity of PoI based on word vector, which could be considered as two stage method, i.e., the PoI is first converted into a word vector representation. And then, the similarity value is calculated with the resulted vectors.
The basic idea of SimHash algorithm is that, for the keyword sequence of PoIs in the time window, Hash algorithm is used to map each keyword into a random signature vector firstly. Then, according to the importance value of each keyword, the vectors are combined into a signature vector by weighted summation, which is used as the signature vector of PoI. Finally, the similarity between the PoI signature vectors in long-term window and short-term window is calculated by Hamming distance. The calculation results of the similarity between multiple short-term windows with chronological order and long-term windows constitute the similarity sequence of PoI with chronological order.
In terms of calculating the similarity of PoI based on word vector representation, this paper first adopts the classical pre-trained language model in the NLP field, such as the pre-trained model [25] based on SGNS (Skip-Gram with Negative-Sample) that is proposed in [26]. The word vector representation is made for each keyword in the keyword sequence of PoIs. And then, by taking the keyword importance value as the weight, the comprehensive word vector representation of the corresponding window is calculated by weighted summation, which is taken as the word vector representation of the PoI. After getting the word vectors of PoIs of short window and corresponding long window, the cosine similarity algorithm is used to calculate the similarity value between the PoI of short and long window.
Next, based on the above PoI representation and similarity calculation, this paper proposes two specific implementations for predicting the change of PoI in the future.
4.2 Methods Based on Traditional Sequence Analysis Algorithms
This subsection will use the existing traditional sequence analysis model ARIMA and SVR to give the corresponding PoIs change prediction algorithms. Among them, the input of the relevant prediction algorithm is the similarity of PoIs between long and short windows, which could be obtained by SimHash algorithm or by means of word vector representation and cosine similarity calculation.
The ARIMA model, short for ARIMA (p, d, q), evolved from the ARMA (Auto-Regression Moving Average) model by adding d-order differential processing to the original data series. When d = 0, ARIMA (p, d, q) is ARMA (p, q).
For historical observation data series
where
SVR was evolved based on the classic model Support Vector Machine (SVM), which has a good theoretical basis and could solve practical problems such as small samples, nonlinearity, high dimensionality and local minimum points. In the case of small samples, SVM has strong competitiveness with neural networks, deep learning models, etc. The idea of the SVR algorithm is to map the data set to the high-dimensional feature space through a nonlinear mapping function, and to regress linearly in this space. And then, the nonlinear regression results of the original data could be obtained. In fact, the prediction of the change of PoIs in this paper is a nonlinear regression analysis problem.
For historical observation data series
where b is bias, the solving of SVR problems could be formalized as follows:
where C is a constant for regularization, which is used for the compromise of model complexity and sample fitting accuracy.
Therefore, according to the symmetrical characteristics of the SVR hyperplane, Eq. (7) could be converted into the following form by using the principle of pairing and Lagrangian multiplier:
where
When predicting changes of PoI based on ARIMA and SVR, we need to train the models using labeled data sets, and then use the trained models to predict unknown data. The label in this paper is the similarity value of the PoI, which is calculated automatically and does not need to be labeled manually.
4.3 Methods Based on Deep Learning Models
In recent years, deep learning technology has been developed rapidly. There have been many successful applications in the analysis of natural language processing, computer vision, speech signal and many other tasks such as data classification and recognition. Based on the extracted PoIs, this subsection will adapt typical models of CNN, LSTM and Transformer to predict and analyze the change of them. For the models, the input is the word vector representation of PoIs of the long-term windows and short-term windows. The word vector can be obtained by the two methods described above. When the SimHash algorithm is used, the word vector is the signature vector of the PoI before distance calculation using Hamming. When the method based on word vector representation is used, the word vector is obtained based on the pretrained model, and the output of the prediction is the similarity between the long window and the short window of the future moment. Based on the two representation vectors of PoI, the similarity of the two methods is obtained using the corresponding Hamming distance and cosine similarity. Next is a brief introduction to the relevant deep learning model.
Convolutional Neural Network (CNN) can handle local related data, obtain typical characteristics and complete the specified related tasks. For the problem of PoI change prediction, adjacent moments of PoIs often have a strong correlation, which can be captured by CNN's convolutional operation. And then, the change of PoI in the future can be predicted based on the analysis of trained models.
Assuming that the vector dimension of the PoI is d, the long window PoI is represented by
The CNN structure designed in this paper mainly includes a convolution layer and a full connection layer. The convolution kernal of the convolution layer has three sizes, each size has 100 kernals, so the number of neurons in the full connection layer is 300. The general structure, relevant parameters and calculation process of the network model are shown in Fig. 2.
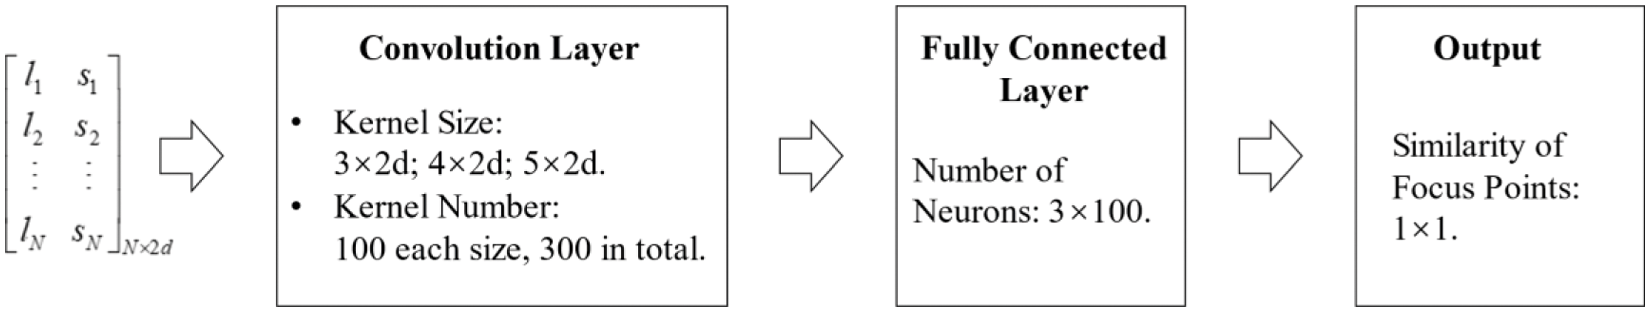
Figure 2: Structure diagram of CNN model for PoI change prediction
Compared with CNN, the biggest feature of Recurrent Neural Network (RNN) and LSTM is that, by adding a connection between the current moment and the next moment in hidden layer, the output of current moment can affect the next moment. The RNN has been used by some method to analyze spatio-temporal sequence [27]. Thus, RNN and LSTM might be better at capturing the temporal characteristics of sequence data, which is more consistent with the PoI change prediction described in Section 2.
LSTM is developed to address possible problems about gradient disappearance and gradient explosion of RNNs. LSTM adds a memory unit and three soft logic gates in the hidden layer, which are mainly used to firstly control the information which will be transmitted from the previous time to the next time, secondly control the information which needs to be transmitted from the current candidate information to the next time, and thirdly control the current candidate information to fuse with the previous information to obtain output. Above processing can better consider the correlation between PoIs at adjacent moments. Therefore, this paper will use LSTM to analyze and predict the PoI change.
Similar to the input of CNN, LSTM model still uses the word vector of the PoIs in the past N-windows as input, i.e., a matrix with dimensions of
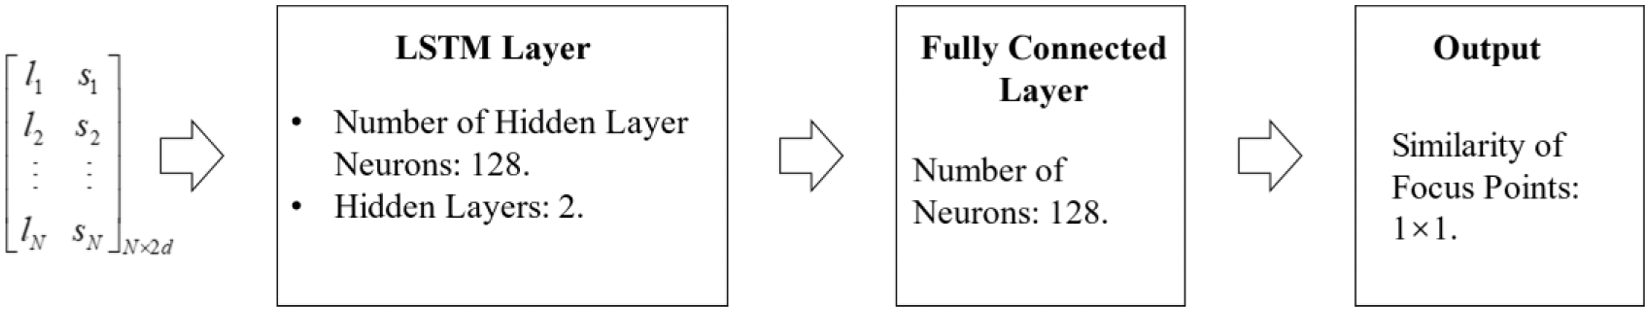
Figure 3: Structure diagram of LSTM model for PoI change prediction
Transformer is one of the most widely deep learning models in recent years, which has achieved many excellent SOTA (state-of-the-art) results in many fields of natural language processing and computer vision. This model is likely to continue playing a great role in the coming years. Transformer, which is proposed by Google, is a model mainly based on attention mechanism. This type of mechanism abandons the traditional RNN and CNN structures, and is implemented using multi-layer encoder and decoder architecture instead. It is easy to train in parallel with a relatively fast speed.
The core idea of Transformer model can be briefly described as follows: Firstly, the model needs to embed the input data, which can also be understood as an operation similar to word vector representation. After embedding, vectors are put into the encode layer, where the self-attention layer processes the data. After that, the result is sent to the feedforward neural network, and the calculated output will be put to the next encode layer. The decode layer of the model also includes the self-attention layer and feedforward neural network layer, while an attention layer is added between these two layers to obtain the key content which needs to be obtained at the current moment during decoding. Finally, the desired output is obtained through multi-layer operation.
In the algorithm implementation, the original Transformer architecture is adjusted. We only use the encode layer in this paper, and then put its results to the full connection layer. Finally, the similarity of PoIs could be obtained. The input of Transformer is the same as that of CNN and LSTM models. The structure, related parameters, and process diagrams of the model architecture are shown in Fig. 4.
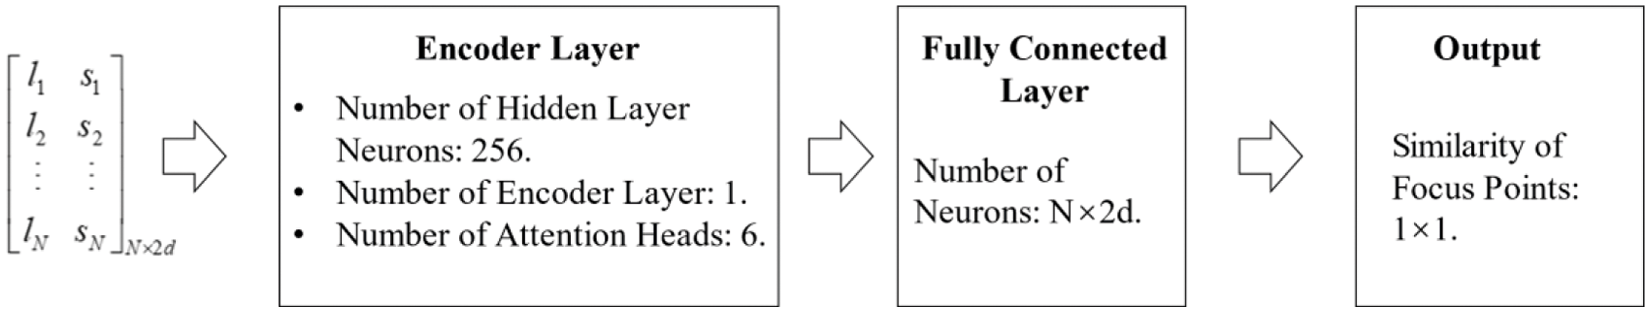
Figure 4: Structure diagram of Transformer model for PoI change prediction
5 Experiments and Results Analysis
In this section, we will construct a dataset according to the PoI prediction method proposed in this paper, test the performance of the proposed algorithm, and analyze the PoI changes of online forums in real network environment. This section will be introduced as four aspects: dataset preparation, algorithms and performance metric, prediction results analysis, and PoI change law analysis.
In the experiment, the “Aircraft Carrier Bar” and “China Bar” in Baidu Tieba will be taken as examples for analysis. And the posters and posts of 454 days are collected from February 2020 to April 2021. Among them, the total number of users involves 18,754 and 2,443, respectively. The total number of posts are 59,062 and 22,528, respectively. According to the analysis framework and method introduced previously, this article mainly predicts the PoI similarity of the next short-term window based on the PoI similarity sequence data between the historical short-term window and the long-term window. Then, changing trends of the PoI of future short-term windows are analyzed.
The number of days in the long-term window (referred to as DLW) in the experiment will be set under four situations: 30, 60, 90, and 120 days. The sliding step of the long-term window (referred to as DLS) will be set as 2 and 4 days. The number of days in the short-term window (referred to as DSW) will be set as 1, 2 and 3 days. The sliding step of the short-term window (DSS) will be set as 1 and 2 days. Among them, 1 day is suitable for all three short-term windows, and 2 days is only used when the short-term window is 3 days. For the above settings, each situation with different parameters is abbreviated as “DLW-DLS-DSW-DSS”. For example, “30-2-2-1” represents that the long-term window is 30 days with sliding step as 2 days, and the short-term window is 2 days with sliding step as 1 day. In summary, all parameter configurations include a total of 32 situations.
The goal of the PoI change prediction in this paper is to predict the change in the PoI similarity between a short-term window and a long-term window at a future time, where the PoI similarity value of each short-term window and its corresponding long-term window is a sample. Therefore, for all sampled data, how many short-term windows can be divided in each case, then the same number of sample sets can be obtained. For the above 32 cases, the number of samples N that can be constructed in each case can be obtained by Eq. (10), and the result is shown in Fig. 5.
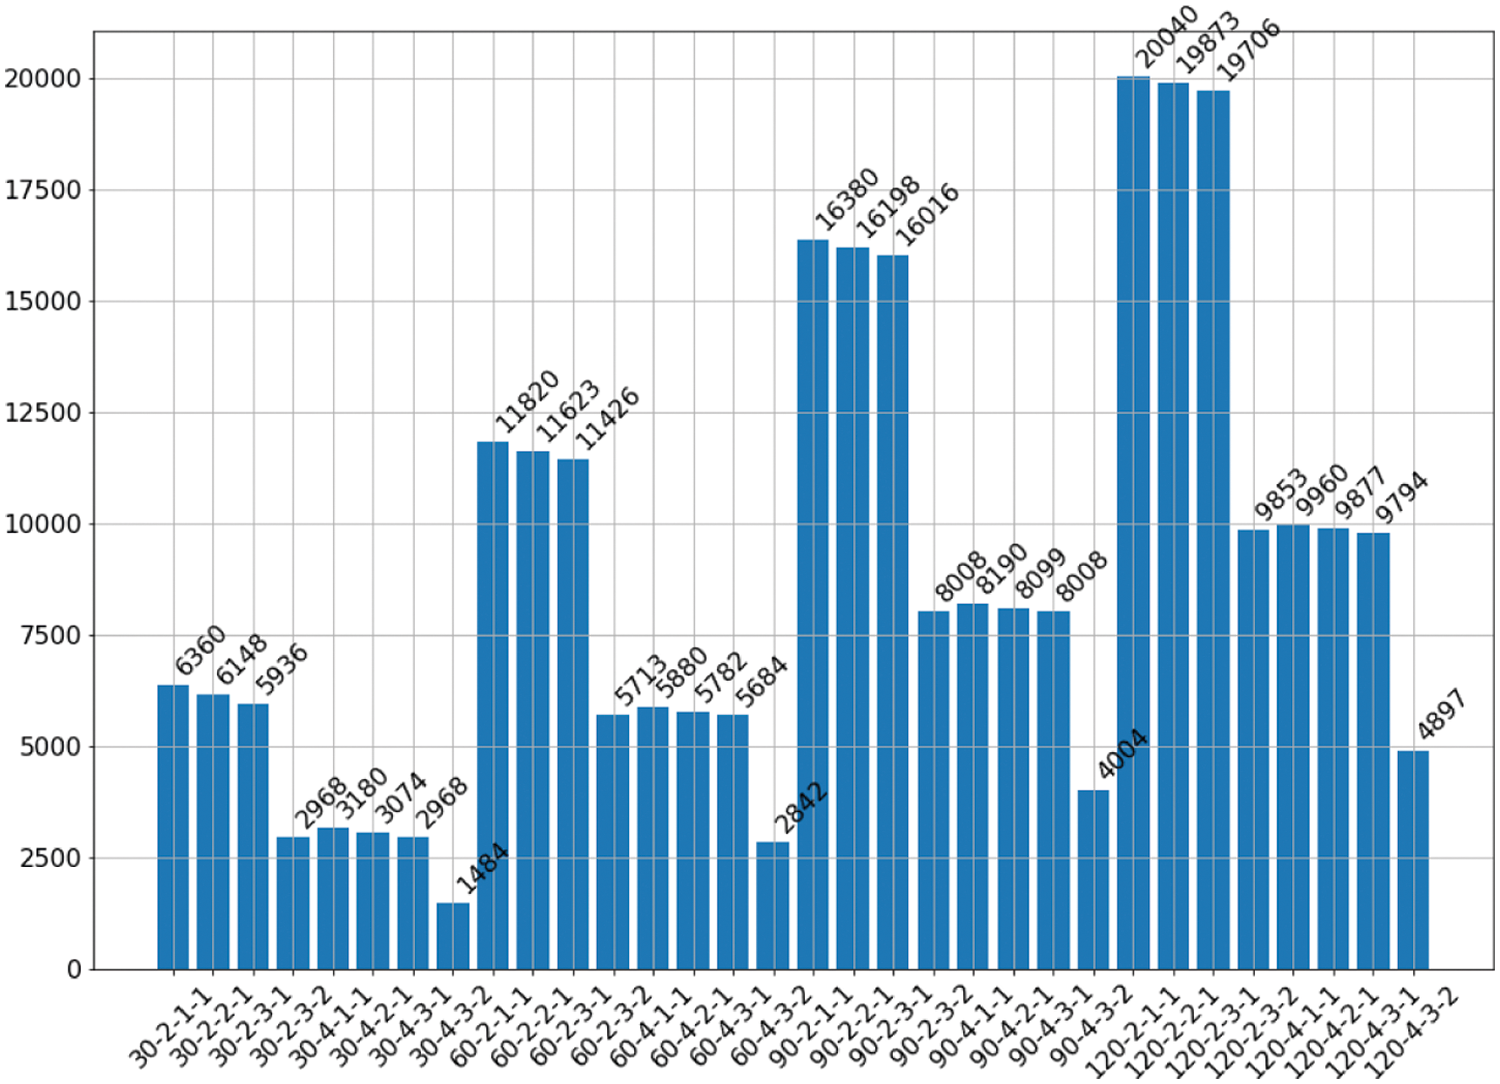
Figure 5: Number of data set samples under different parameter configurations of windows
As can be seen from the above figure, the number of samples are different under different parameter configurations of long and short window, and the difference is quite large in some cases. For example: in the case of “30-4-3-1”, only 1484 samples were obtained, and there are 20040 samples in the case of “90-4-3-2”. For algorithms that the performance does not rely too much on the number of training samples, it would not be a matter. However, for algorithms that the performance relies on many training samples, such as deep learning models, it is likely to have better results when the number of samples is large. We will analyze that in subsequent experiments.
For each data set constructed with parameter configuration, we will use the samples obtained in the first 80% of the long-term window as the training set, and the remaining 20% will be used as the test set.
In addition, the hardware environment of the experiment is that, there are two CPU Intel(R) Xeon Gold 6136 and each has 12 cores. The memory is 128 GB. The GPU is a Nvidia RTX 2080Ti with 12GB memory. The operating system is Ubuntu 18.04, and the experiments runs in the Docker1. The deep learning model is built by Pytorch, and the transformers model is from HuggingFace2.
5.2 Algorithms and Performance Metric
In the experiment, the TF-IDF algorithm is used to extract the keywords to describe the user's PoIs in the long-term and short-term windows. The number of keywords describing each PoI is 20. Then the similarities between existing PoIs are calculated and used to predict future PoI changes. For the two methods of traditional sequence analysis and deep learning models, the similarity calculation and PoI prediction analysis methods used in the experiment are described as follows:
(1) In terms of prediction analysis based on traditional sequence analysis methods, two existing algorithms, which are ARIMA [12] and SVR [13], are compared and analyzed based on two similarity calculation methods of PoIs and the corresponding results.
(2) In terms of predition analysis based on deep learning models, this paper proposed three algorithms based on typical models CNN, LSTM, and Transformer, respectively. Their performance are compared and analyzed based on two PoIs vector representations and similarity calculation methods. Among them, the representation dimension of the PoI word vector based on the SimHash algorithm is 64, and the dimension based on the pre-training model is 300.
The typical performance evaluation method of sequence analysis are mean absolute error (MAE) and standard deviation (STD), which will also be used for PoIs variation prediction in this paper.
The calculation expression of MAE is as follows:
where n is the total number of samples, yi is the historical observation data, and fi is the prediction value.
The calculation expression of STD is shown in Eq. (12).
the parameters above have the same meaning as the MAE calculation expression in Eq. (11).
5.3 Prediction Results Analysis of PoI Changes
In this paper, two types of implementations are adopted for the PoI representation and similarity calculation. One of them uses SimHash algorithm to obtain the representation of the PoI and calculates the similarity, which is abbreviated as the “SH” strategy. The other one uses the pre-training model and cosine similarity algorithm to obtain the representation of the PoI, and then calculate the similarity, which is abbreviated as the “CS” strategy. When using different strategies for further prediction and analysis of similarity changes of PoIs, it is considered that the input intermediate representations is different. Therefore, the results between two different strategies cannot be directly compared. Only under the same strategy, the results of similarity predictive algorithms are comparable. Therefore, in this section of the experiment, the results will be compared under the two strategies respectively. For the five kinds of PoI similarity variation prediction methods ARIMA, SVR, CNN, RNN, Transformer (abbreviated as TRM), when the “SH” strategy is adopted, the results are denoted as SH-ARIMA, SH-SVR, SH-CNN, SH-RNN and SH-TRM, respectively. When the “CS” strategy is adopted, the results are denoted as CS-ARIMA, CS-SVR, CS-CNN, CS-RNN, CS-TRM, respectively. The experimental results are shown in Figs. 6–13.
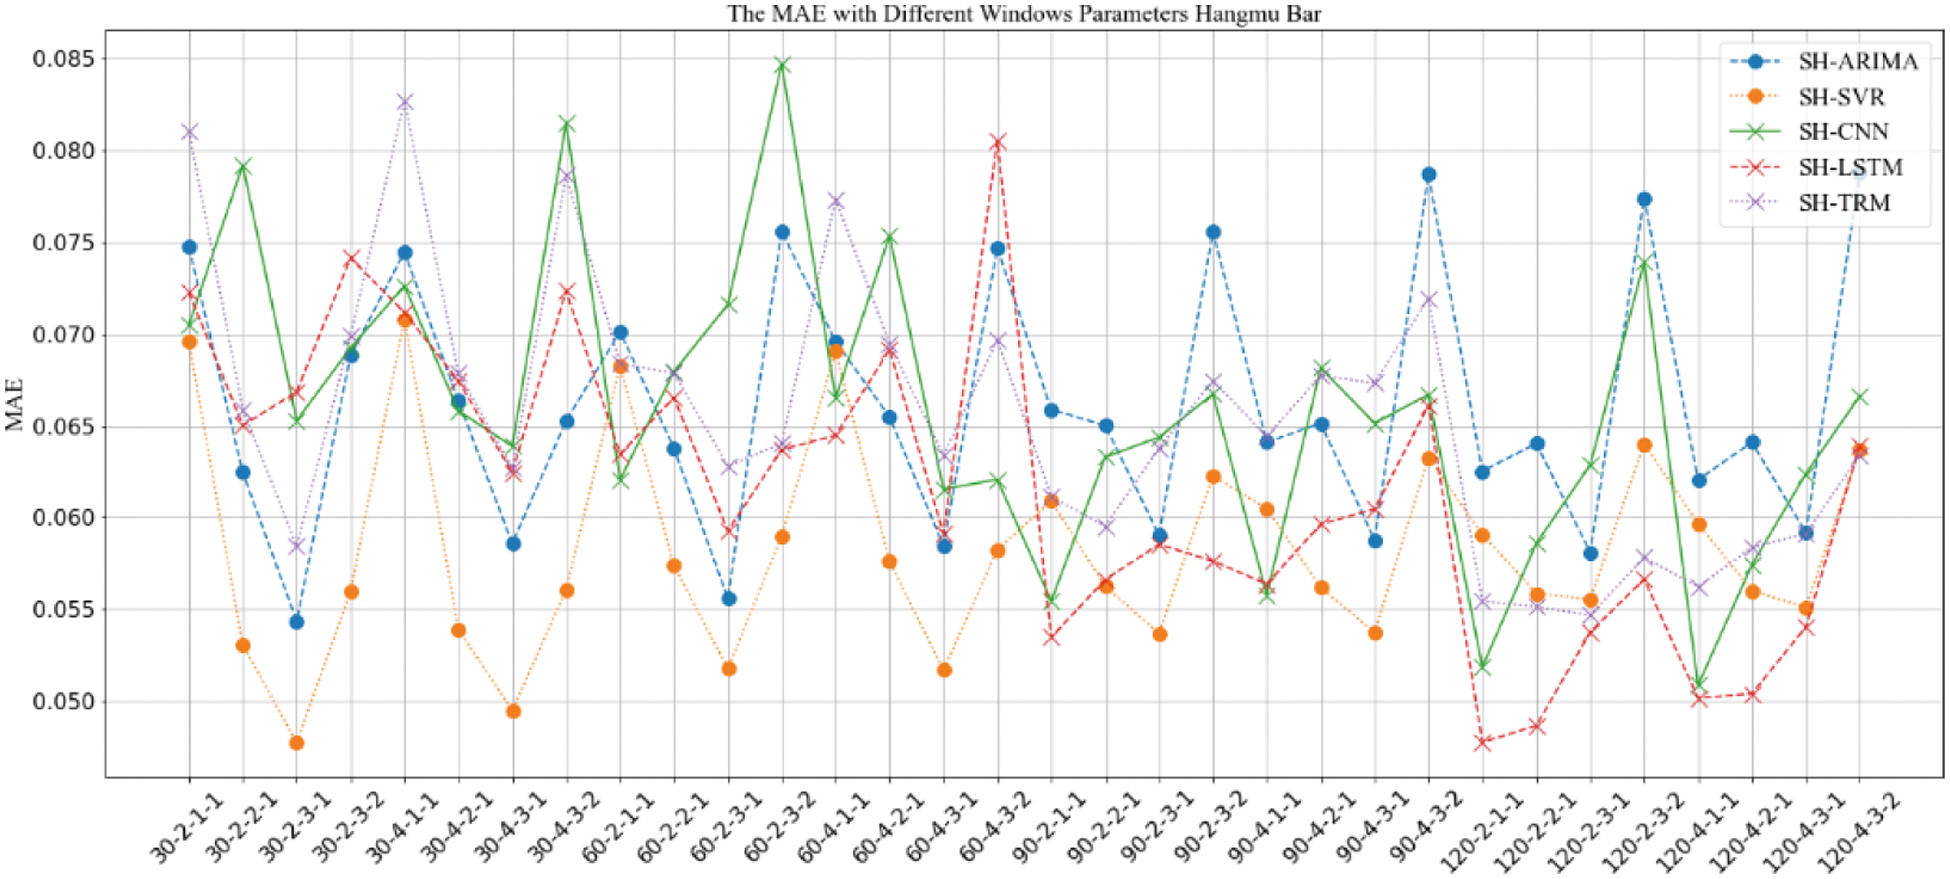
Figure 6: MAE comparison of prediction results with “SH” strategy under different window parameter configurations for “Aircraft Carrier Bar”
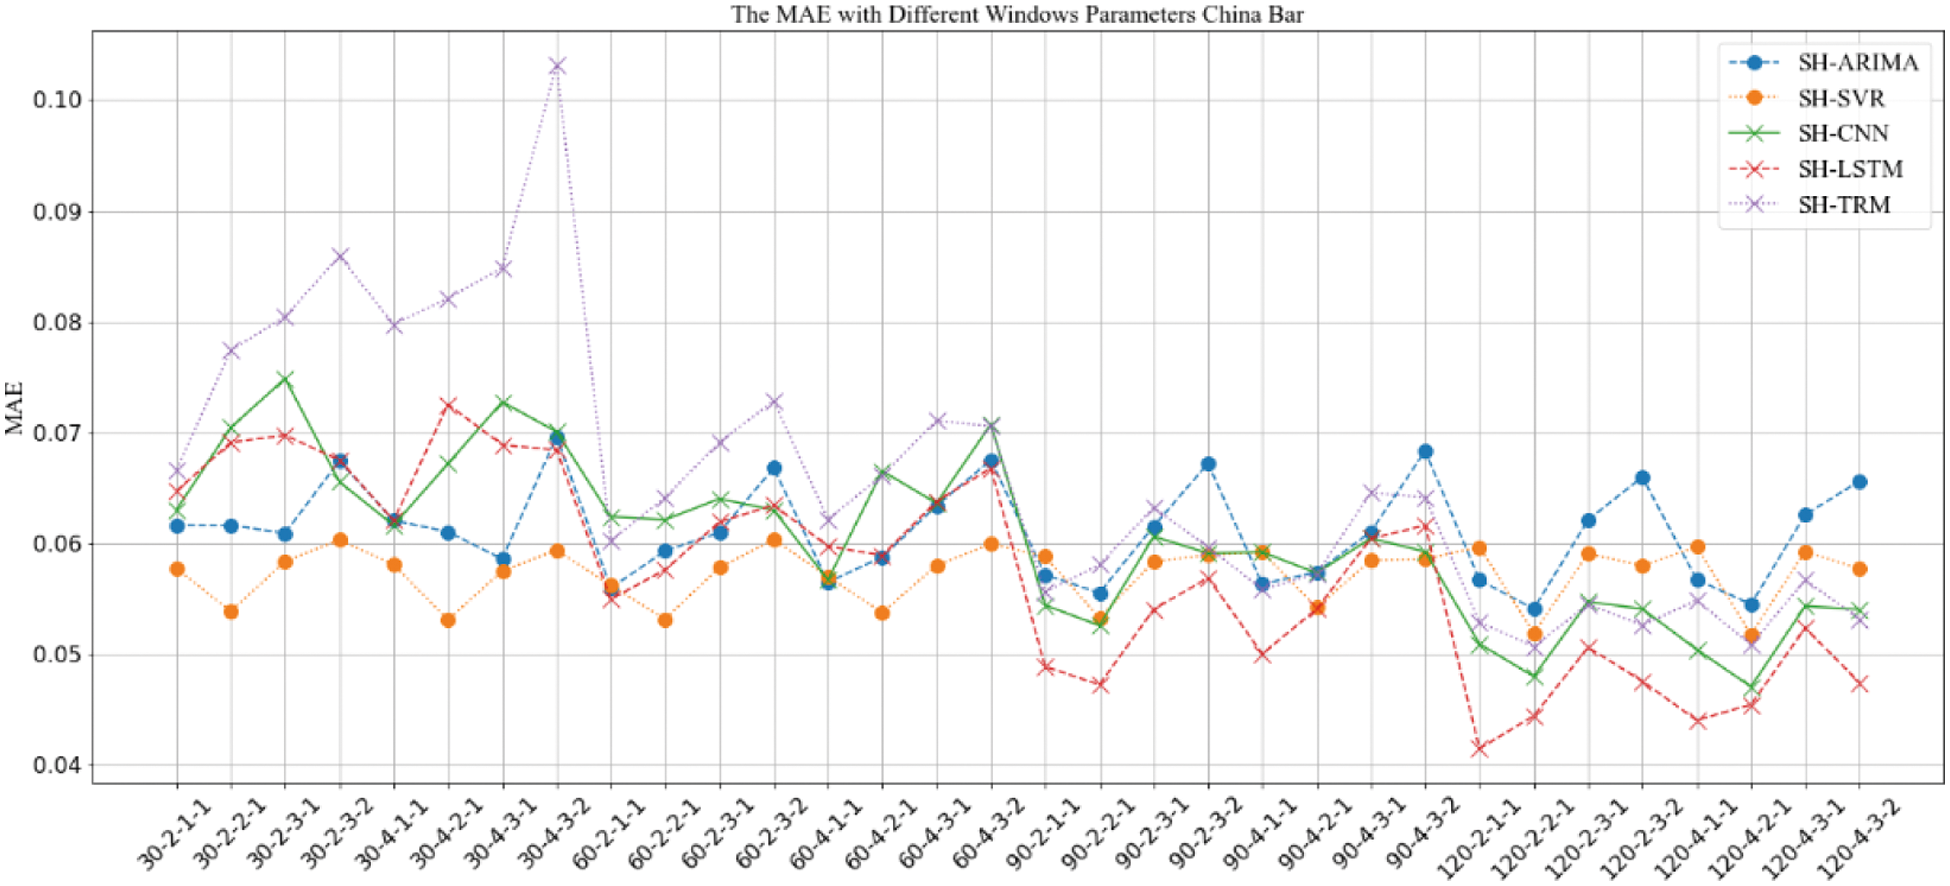
Figure 7: MAE comparison of prediction results with “SH” strategy under different window parameter configurations for “China Bar”
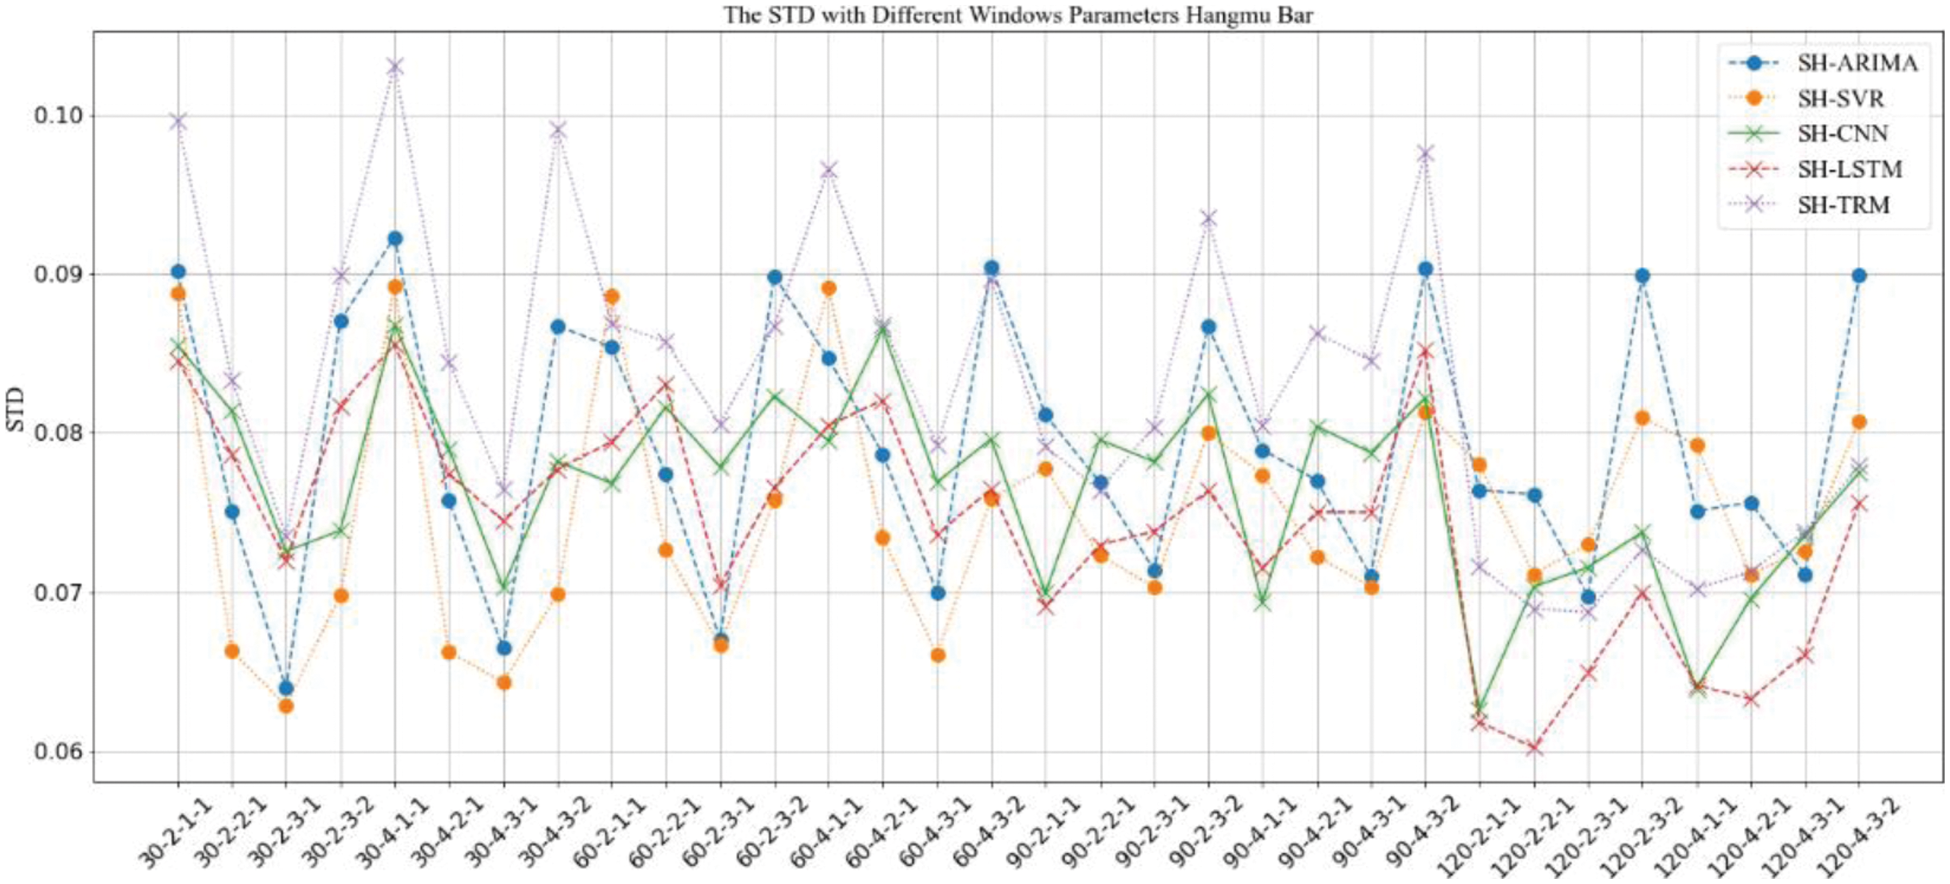
Figure 8: STD comparison of prediction results with “SH” strategy under different window parameter configurations for “Aircraft Carrier Bar”
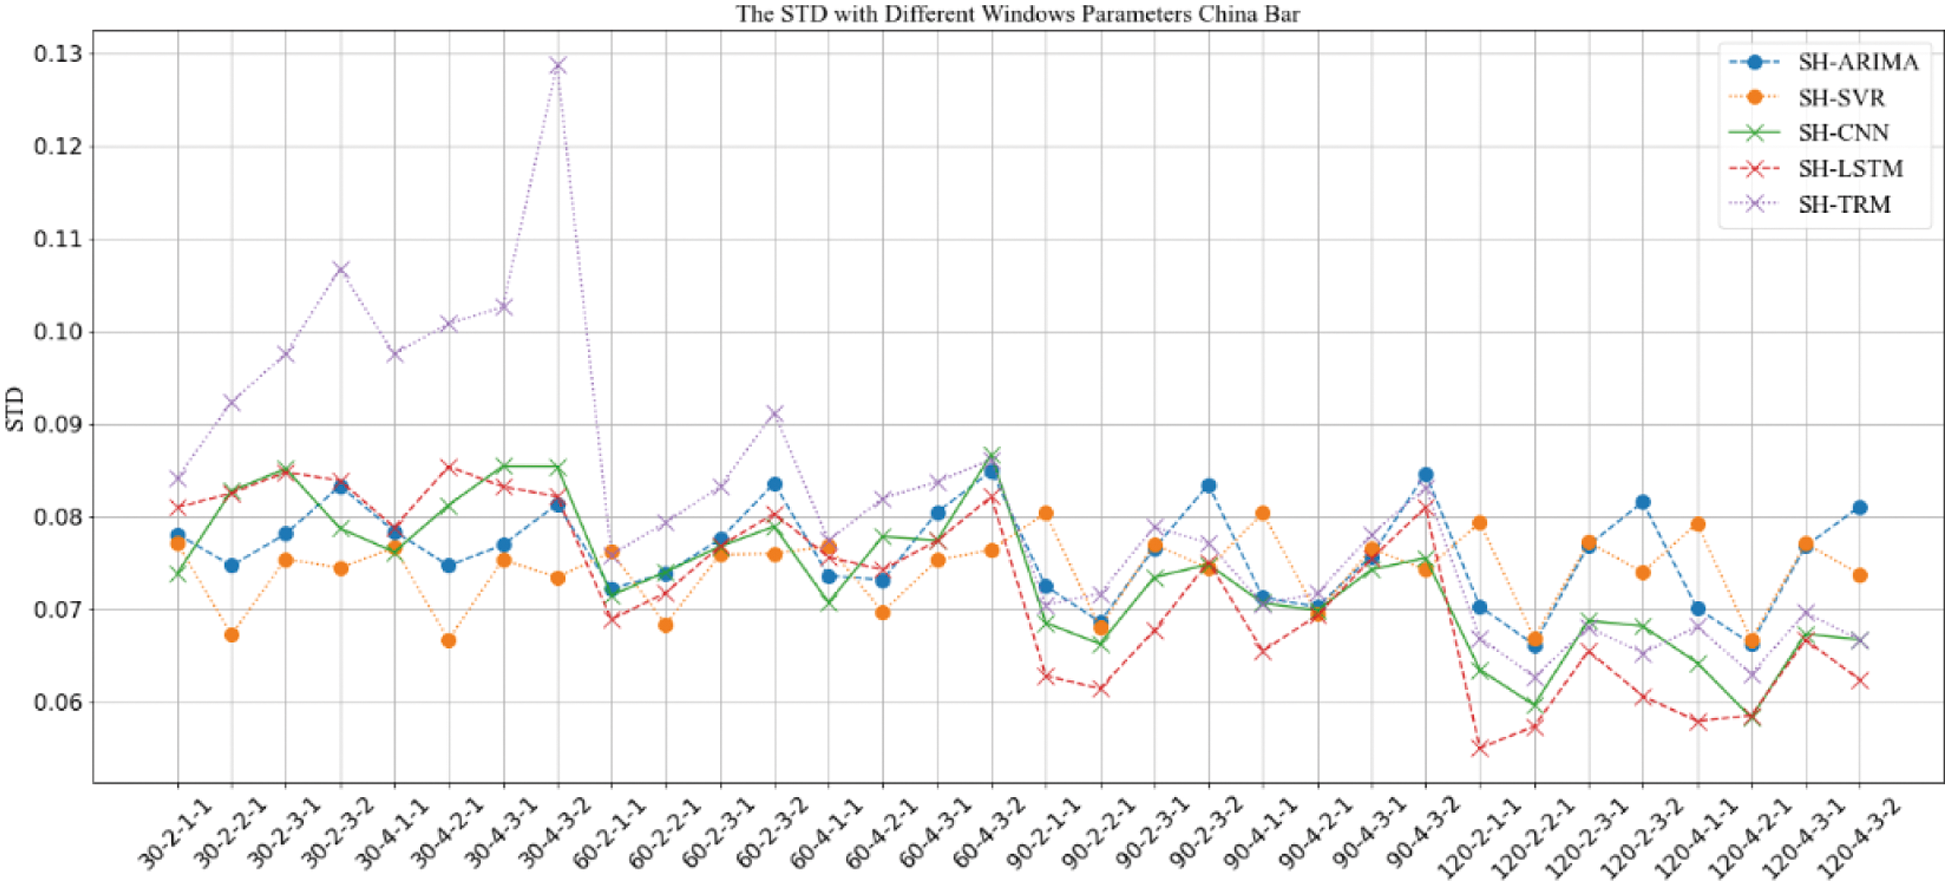
Figure 9: STD comparison of prediction results with “SH” strategy under different window parameter configurations for “China Bar”
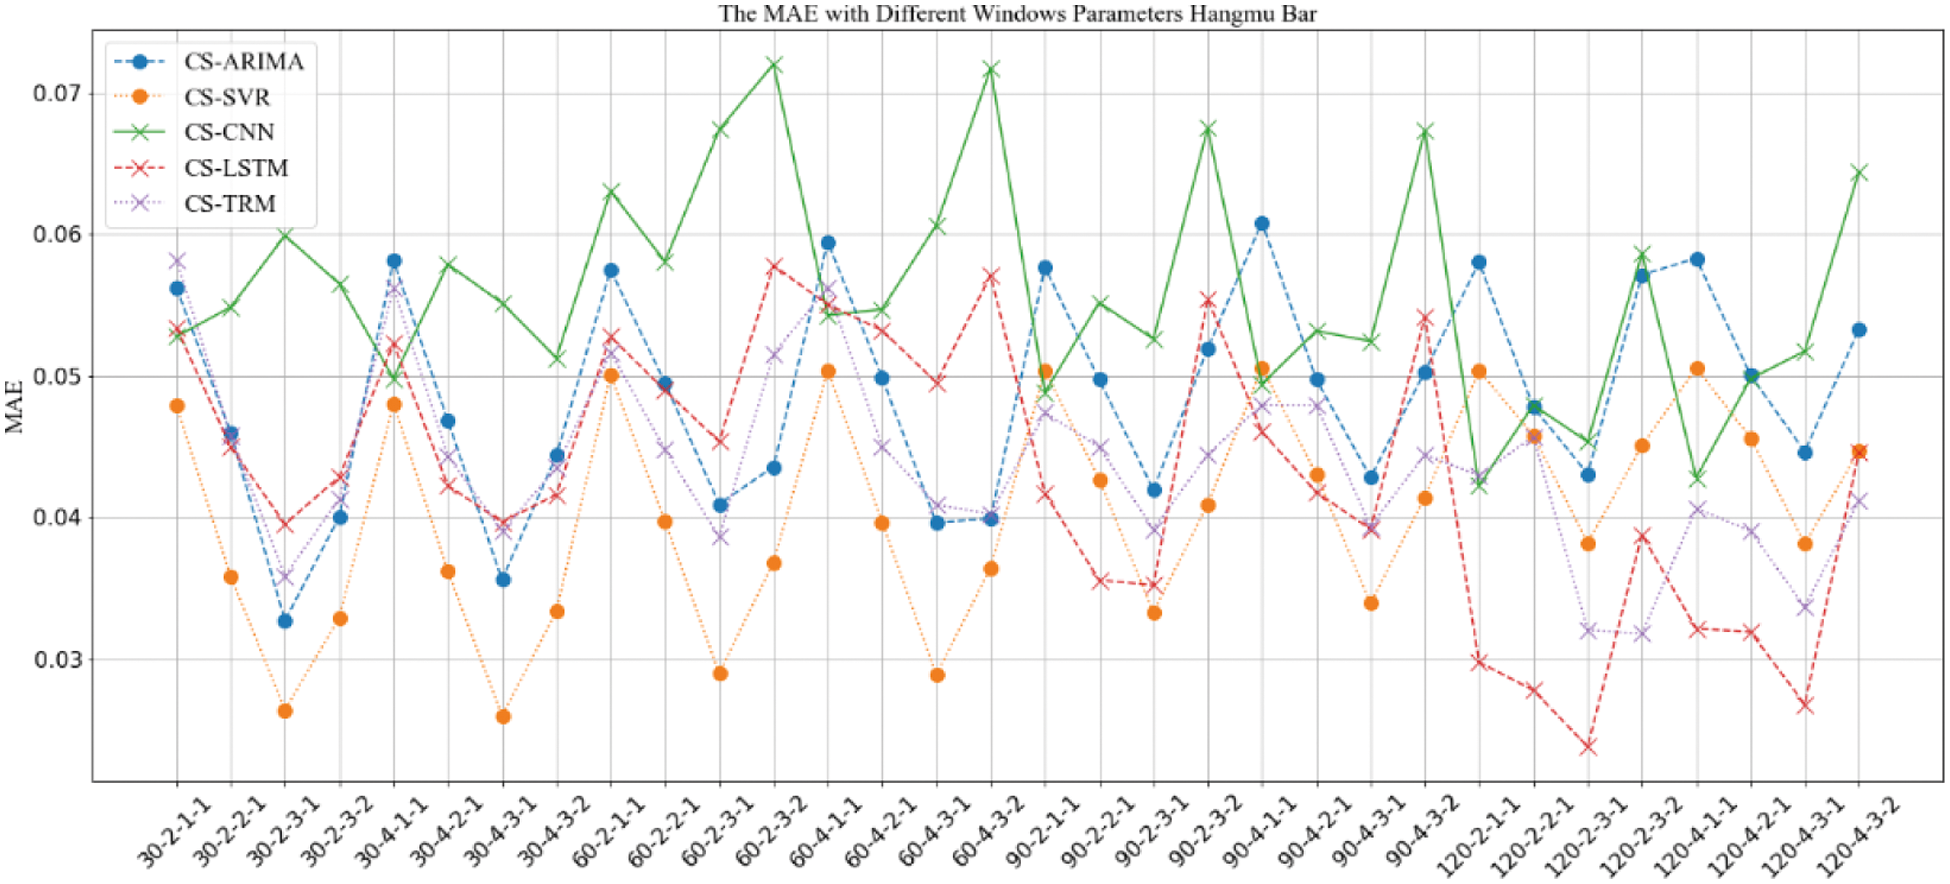
Figure 10: MAE comparison of prediction results with “CS” strategy under different window parameter configurations for “Aircraft Carrier Bar”
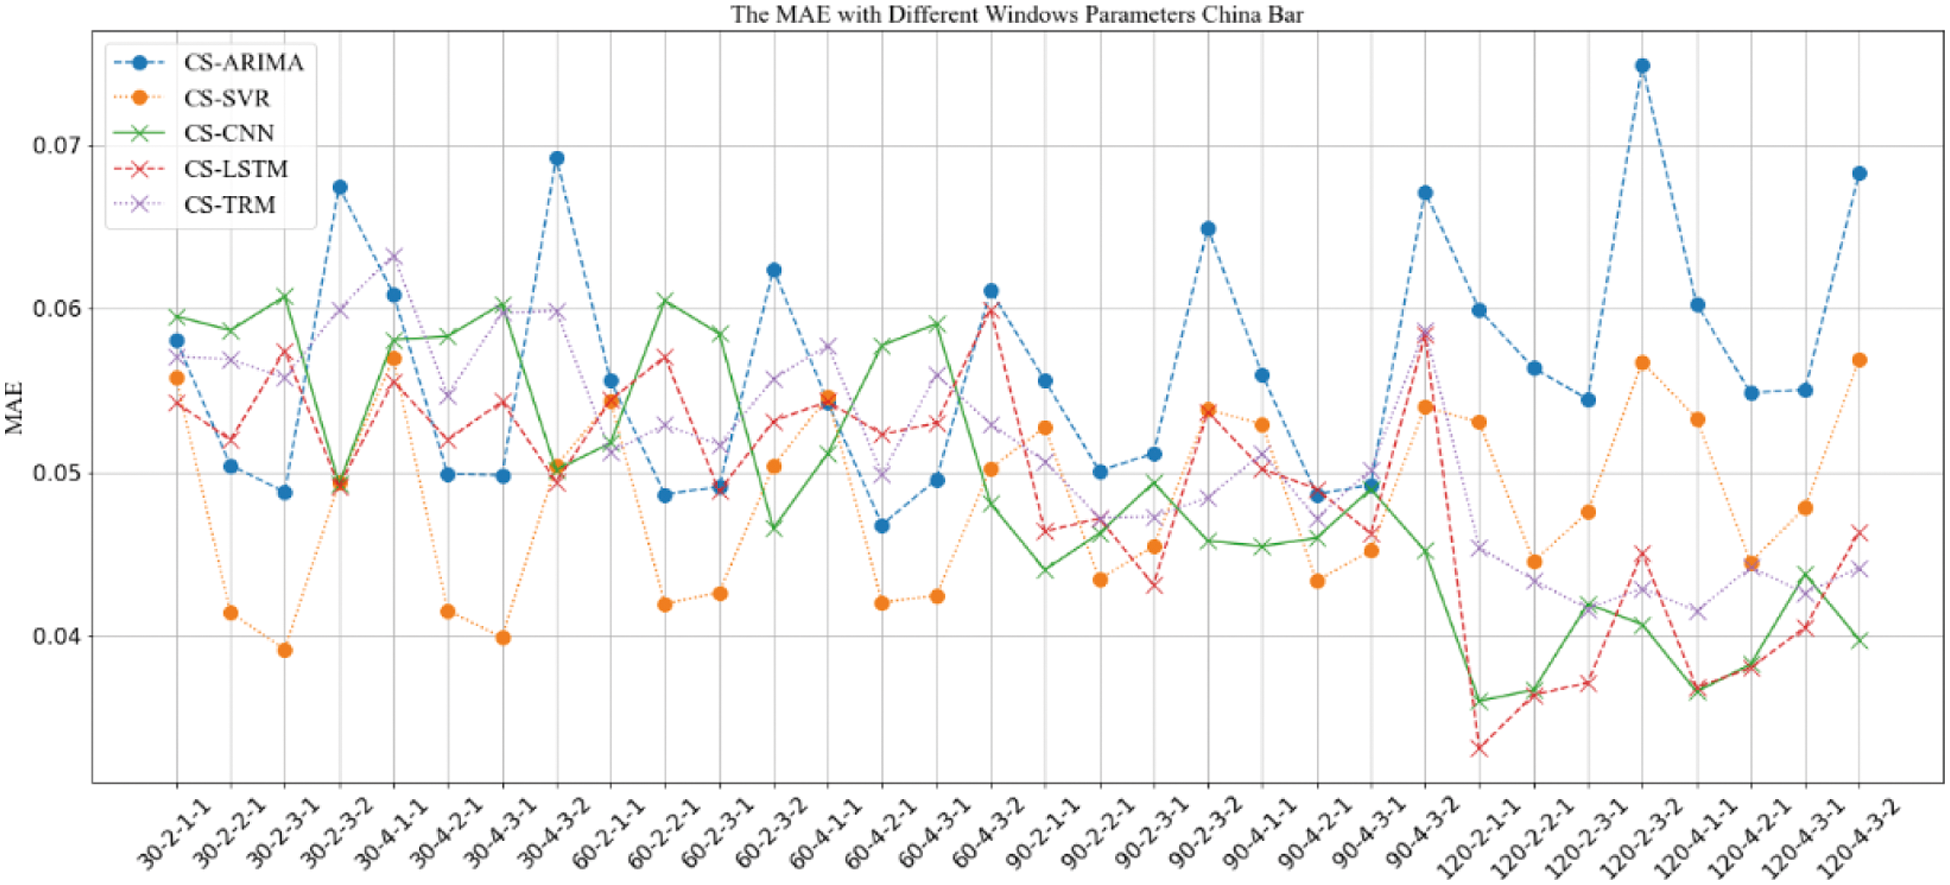
Figure 11: MAE comparison of prediction results with “CS” strategy under different window parameter configurations for “China Bar”
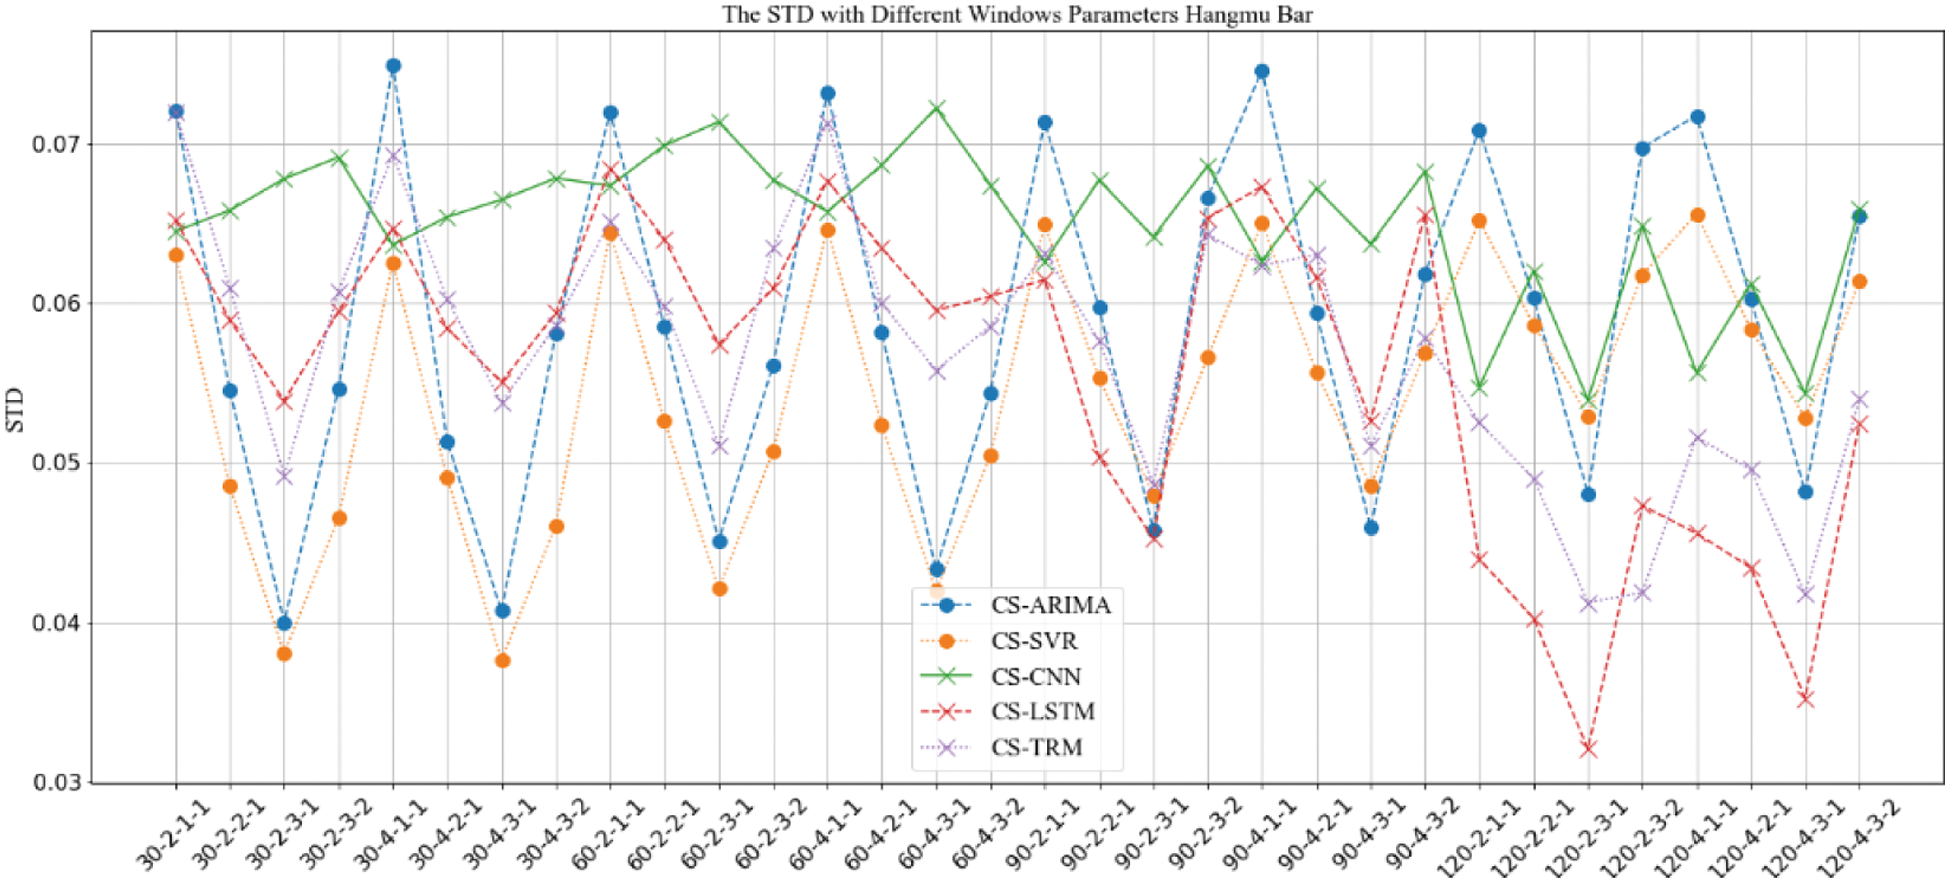
Figure 12: STD comparison of prediction results with “CS” strategy under different window parameter configurations for “Aircraft Carrier Bar”
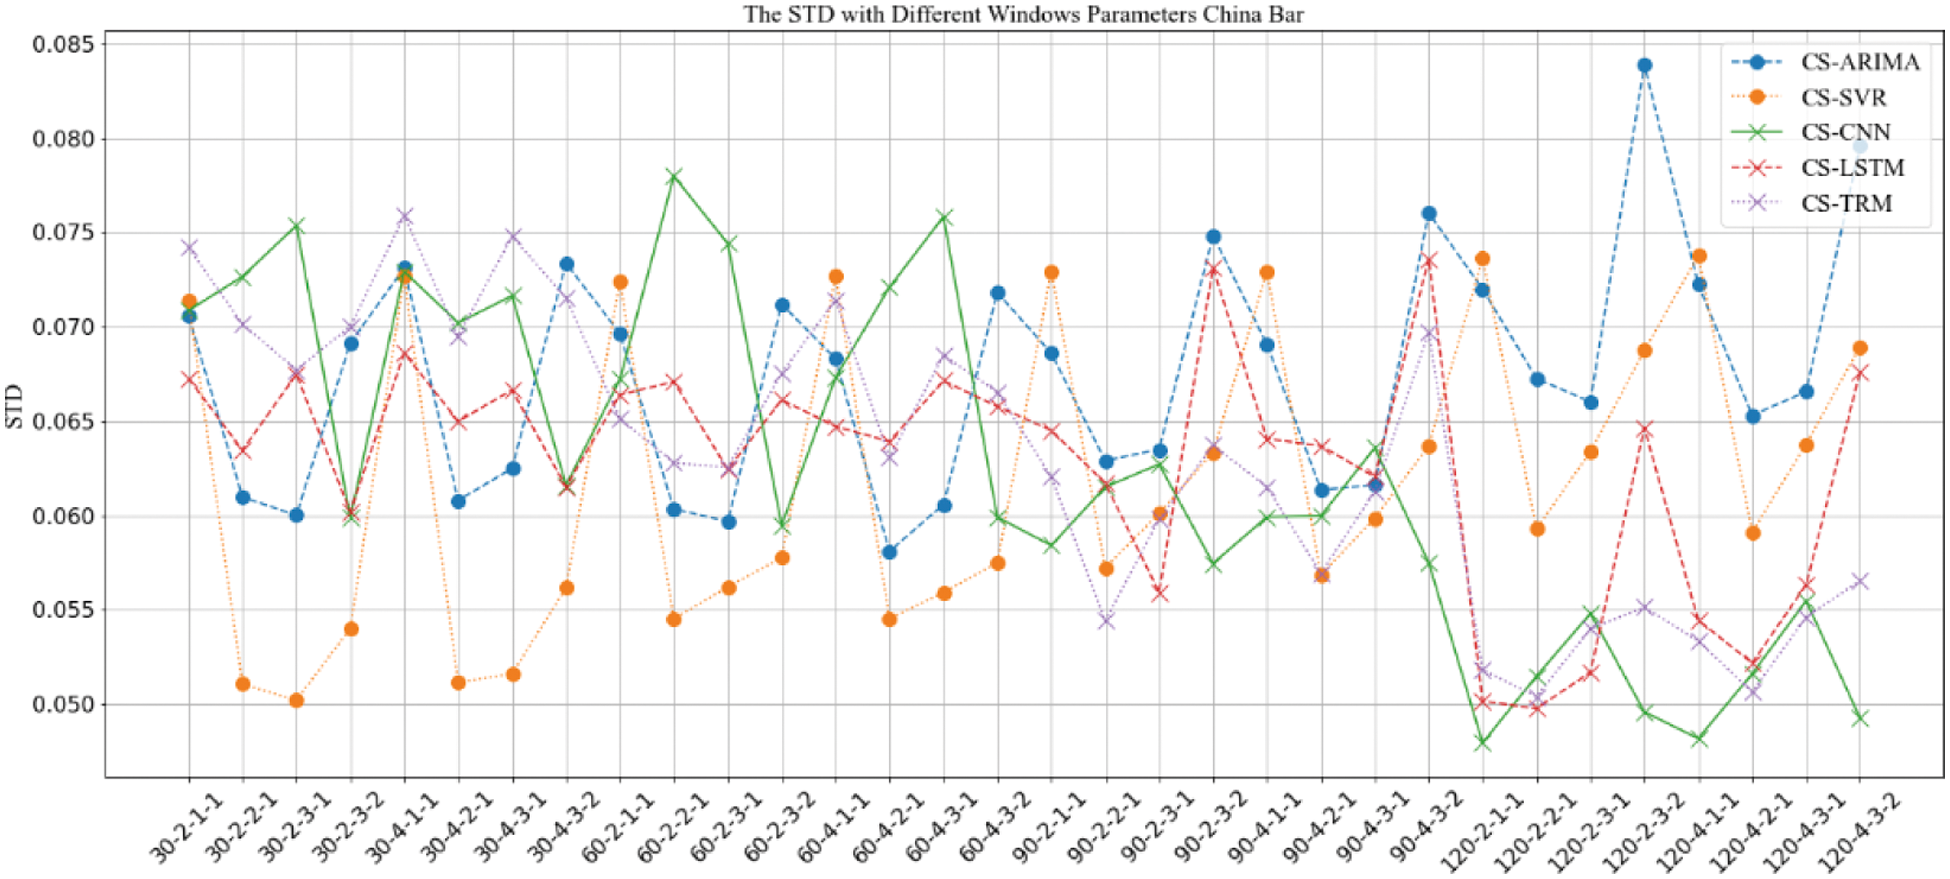
Figure 13: STD comparison of prediction results with “CS” strategy under different window parameter configurations for “China Bar”
The results in Figs. 6–13 show that, under different long-term and short-term window parameter configurations between “SH” and “CS” strategy, the relative changes in the prediction and analysis results of PoIs similarity have high similarities. Whether the “SH” strategy or the “CS” strategy is adopted, when the DLS, DSW, and DSS in the “DLW-DLS-DSW-DSS” are the same, the larger the DLW, the higher the accuracy of the prediction results will be. It could be seen in Fig. 5 that, the larger the DLW, the more training samples can be constructed in this case. Therefore, for the method in this paper, the size of the long-term window and the number of training samples may be an important factor that affects the prediction accuracy. In practical applications, longer window should be selected and as many training samples as possible should be constructed. For the same DLW, DSW, and DSS, when the DLS is different, there is little difference between the prediction results, which show that the sliding step size of the long-term window has little effect on the prediction accuracy.
Therefore, for the same DLW, the accuracy of the prediction result has a greater relationship with the short-term window size DSW and its sliding step DSS. From the comparison result, when the value of “DSW-DSS” is “2-1” or “3-1”, the accuracy of the prediction result is usually higher. In fact, compared with the other two values “1-1” or “3-2”, when the value is “2-1” or “3-1”, the dependence between adjacent short windows is stronger. It can better reflect the law of the time series of PoIs, which is more conducive to capture the law of change. Therefore, the prediction accuracy will be higher too.
When using the same strategy, it can be seen from comparison results between different prediction analysis algorithms that, for parameter configuration with better performance, when the long-term window size is 30, 60, the accuracy of traditional sequence analysis algorithms ARIMA and SVR will be better than deep learning models CNN, LSTM and TRM in most cases. SVR has the highest accuracy. When the size is 90, the performance of two types of algorithms is equivalent, and it is difficult to distinguish which algorithm is better. When the size is 120, the deep learning models CNN, LSTM, and TRM perform better in most cases. Among them, LSTM has the highest accuracy and is optimal under all parameter configurations. In addition, when the prediction algorithm and parameter configuration are the same, the algorithm based on “CS” strategy usually perform better than “SH” strategy, which indicates that the word representation method based on pre-training model is more effective in NLP tasks.
When analyzing the accuracy of the same algorithm in different bars, the prediction accuracy of “Aircraft Carrier Bar” is often higher than that of “China Bar”. According to introduction of the data set, the number of posts on “Aircraft Carrier Bar” is 59,062, which is much larger than “China Bar” with 22,528 posts. Then, for the same window size, the number of posts in “Aircraft Carrier Bar” will be larger than “China Bar”, which will be able to express PoIs more accurately and may be more conducive to prediction analysis. Therefore, in real applications, all posts should be used as possible as you can.
Based on above analysis, when dividing the long-term and short-term windows, the longer long-term window should be used as much as possible. And when sampling the short-term window, it should try to make the adjacent short-term windows have a strong dependence. At the same time, when the amount of data that can be constructed is large, algorithms based on deep learning models should be used for prediction analysis. If the amount of data that can be constructed is relatively limited, traditional sequence analysis algorithms should be used.
According to the analysis results of the previous section, under different strategies and different window parameter configurations, the comprehensive performances of different algorithms are quite different. By comparing the prediction performance of the similarity of PoIs in each short-term window and the real results, the fine-grained performance of the algorithm will be more directly analyzed, and the possible changes of the PoIs will also be inferred on this basis. This paper takes “Aircraft Carrier Bar” as an example, and select the parameter configuration with the highest prediction accuracy for analysis. Under the “CS” strategy, select the smaller long-term window parameter configuration “30-4-3-1” and the larger long-term window parameter configuration “120-2-3-1” to analyze its prediction results. Among them, the configuration “30-4-3-1” mainly shows the prediction results based on the traditional sequence analysis algorithm ARIMA and SVR, as shown in Fig. 14. The configuration “120-2-3-1” shows the prediction results based on deep learning models CNN, LSTM, and TRM, as shown in Fig. 15. The horizontal ordinate represents the date of the first day of each short-term window.
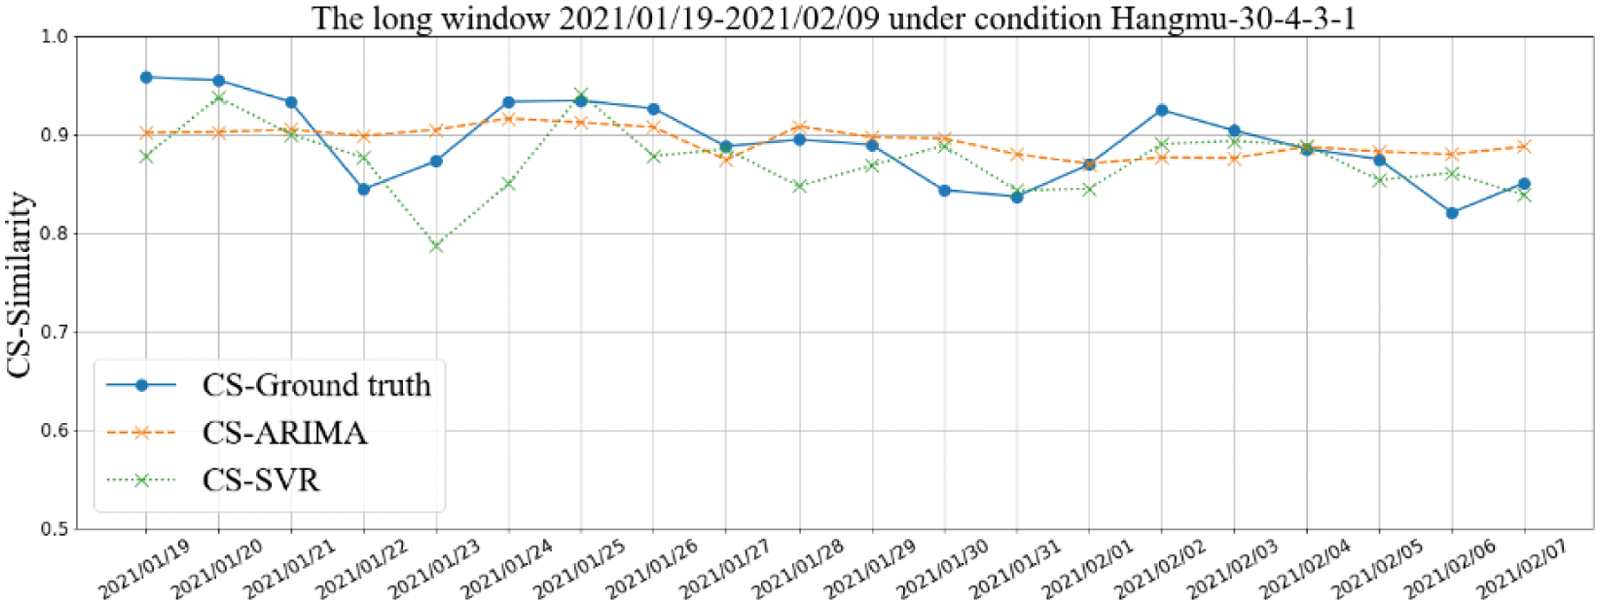
Figure 14: Comparison of prediction results under the window parameter configuration “30-4-3-1” for “Aircraft Carrier Bar”
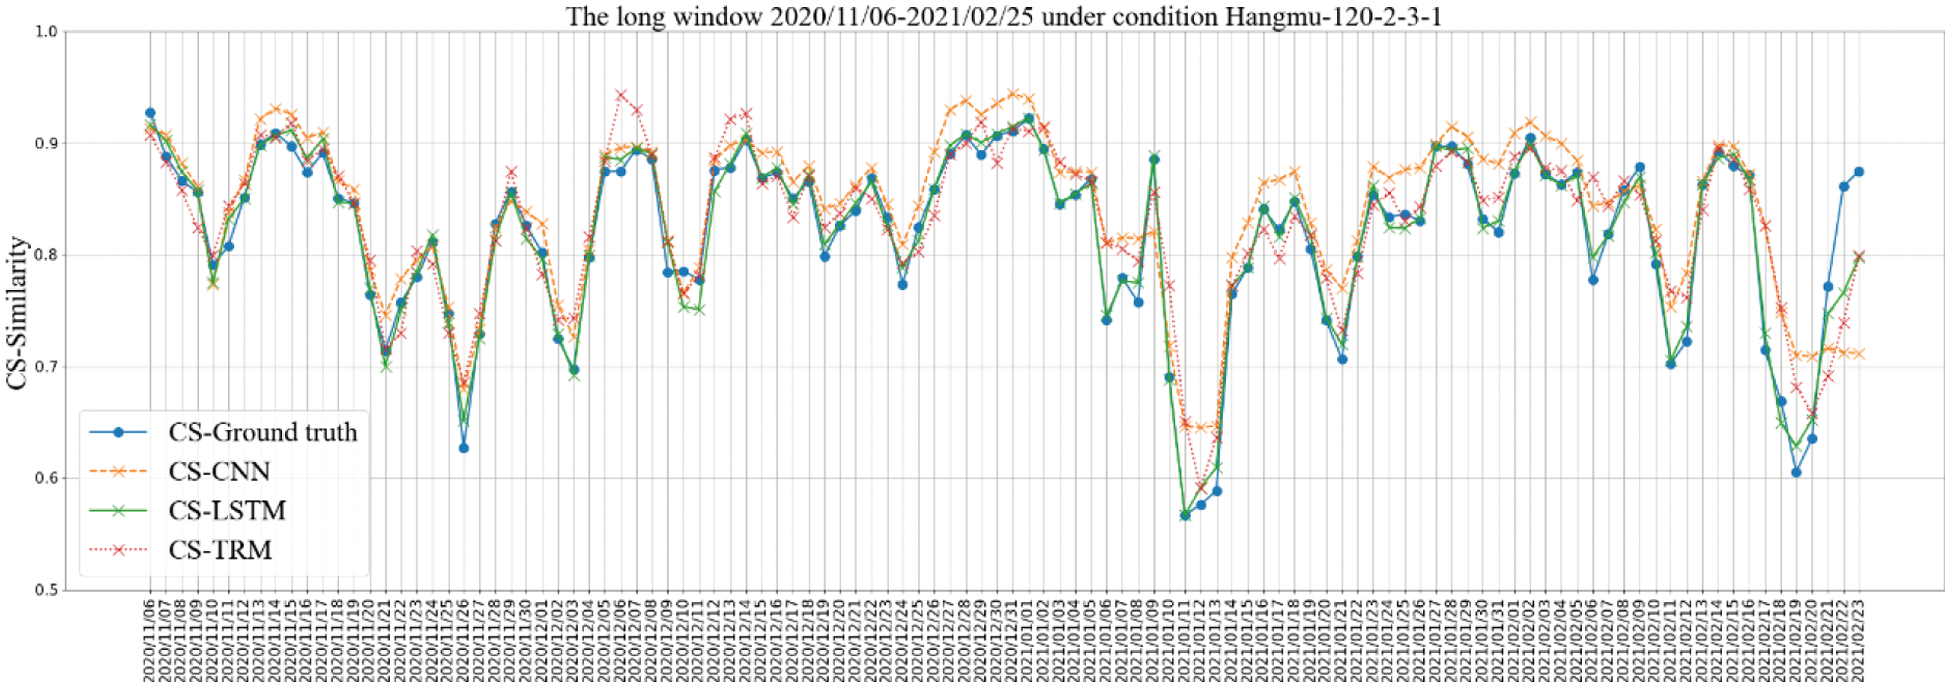
Figure 15: Comparison of prediction results under the window parameter configuration “120-2-3-1” for “Aircraft Carrier Bar”
It can be seen from Figs. 14 and 15 that, based on the proposed method, the change curve of PoIs similarity can be better fitted in both cases, and the result under configuration “120-2-3-1” is better. In online forums, the whole process from appearance to disappearance of a PoI may often be relatively long. In order to capture the complete variation law of PoIs, the window that are used to analyze the variation should be as longer as possible, which could provide more accurate decision-making basis in practical.
For the problem that the method selection of existing online forum PoI analysis is often blindness and difficult to fit the long-term variation law, this paper proposed a PoI variation prediction framework based on the similarity analysis of long-term and short-term windows. Then, a variety of PoI variation prediction and analysis methods are presented from two angles. We conduct series of experiments to compare and analyze the performance of each algorithm under different parameter configurations. We also analyze the variation law of Internet forum PoI. Based on the experiment results, we give the strategy to select prediction and analysis methods in different practical problem situations. The possible long-term PoI variation law is analyzed and pointed out. Although this paper makes some progress and has good reference value, it only considers and analyzes the possible PoI variations and does not predict what PoIs may appear. Therefore, for the estimation of specific PoI, researchers in relevant fields could further carry out more in-depth research and give strategies in more application scenarios.
2https://github.com/huggingface/transformers
Funding Statement: This work is funded in part by the Natural Science Foundation of Henan Province, China under grant No. 222300420590.
Conflicts of Interest: The authors declare that they have no conflicts of interest to report regarding the present study.
1. China Internet Network Information Center (CNNIC). The 48th statistical reports on China’s internet development. [Online]. Available https://cit.buct.edu.cn/2021/0925/c7951a157922/page.htm. 2021. [Google Scholar]
2. Z. Hu, X. Yu, J. Shi and L. Ye, “Abnormal event correlation and detection based on network big data analysis,” Computers, Materials & Continua, vol. 69, no. 1, pp. 695–711, 2021. [Google Scholar]
3. J. H. Kim, D. Nan, Y. Kim and M. H. Park, “Computing the user experience via big data analysis: A case of uber services,” Computers, Materials & Continua, vol. 67, no. 3, pp. 2819–2829, 2021. [Google Scholar]
4. K. Nallusamy and K. S. Easwarakumar, “Cgram: Enhanced algorithm for community detection in social networks,” Intelligent Automation & Soft Computing, vol. 31, no. 2, pp. 749–765, 2022. [Google Scholar]
5. G. Zhang, Y. Li, Y. Yuan, F. Xu, H. Cao et al., “Community value prediction in social E-commerce,” in Proc. 30th the Web Conf. (WWW), Ljubljana, Slovenia, pp. 2958–2967, 2021. [Google Scholar]
6. E. Stai, E. Milaiou, V. Karyotis and S. Papavassiliou, “Temporal dynamics of information diffusion in twitter: Modeling and experimentation,” IEEE Transactions on Computational Social Systems, vol. 5, no. 1, pp. 256–264, 2018. [Google Scholar]
7. F. S. Pereira, J. Gama, S. Amo and G. M. Oliveira, “On analyzing user preference dynamics with temporal social networks,” Machine Learning, vol. 107, no. 11, pp. 1745–1773, 2018. [Google Scholar]
8. H. M. Wandabwa, M. A. Naeem, F. Mirza and R. Pears, “Multi-interest semantic changes over time in short-text microblogs,” Knowledge-Based Systems, vol. 228, no. C, pp. 10724-1–10724-21, 2021. [Google Scholar]
9. K. Yu, W. Ding, H. Wang and X. Wu, “Bridging causal relevance and pattern discriminability: Mining emerging patterns from high-dimensional data,” IEEE Transactions on Knowledge and Data Engineering, vol. 25, no. 12, pp. 2721–2739, 2012. [Google Scholar]
10. K. Radinsky and P. N. Bennett, “Predicting content change on the web,” in Proc. 6th ACM Int. Conf. on Web Search and Data Mining (WSDM), Rome, Italy, pp. 415–424, 2013. [Google Scholar]
11. K. Radinsky, K. M. Svore, S. T. Dumais, M. Shokouhi, J. Teevan et al., “Behavioral dynamics on the web: Learning, modeling, and prediction,” ACM Transactions on Information Systems, vol. 31, no. 3, pp. 1–37, 2013. [Google Scholar]
12. B. Chang, H. Zhu, Y. Ge, E. Chen, H. Xiong et al., “Predicting the popularity of online serials with autoregressive models,” in Proc. 23rd ACM Int. Conf. on Information and Knowledge Management (CIKM), Shanghai, China, pp. 1339–1348, 2014. [Google Scholar]
13. T. Trzciński and P. Rokita, “Predicting popularity of online videos using support vector regression,” IEEE Transactions on Multimedia, vol. 19, no. 11, pp. 2561–2570, 2017. [Google Scholar]
14. B. Shulman, A. Sharma and D. Cosley, “Predictability of popularity: Gaps between prediction and understanding,” in Proc. 10th Int. AAAI Conf. on Web and Social Media (ICWSM), Cologne, Germany, pp. 348–357, 2016. [Google Scholar]
15. Q. Kong, W. Mao, G. Chen and D. Zeng, “Exploring trends and patterns of popularity stage evolution in social media,” IEEE Transactions on Systems, Man and Cybernetics: Systems, vol. 50, no. 10, pp. 3817–3827, 2020. [Google Scholar]
16. C. Chen and J. Ren, “Forum latent dirichlet allocation for user interest discovery,” Knowledge-Based Systems, vol. 126, no. C, pp. 1–7, 2017. [Google Scholar]
17. H. Yin, B. Cui, L. Chen, Z. Hu and X. Zhou, “Dynamic user modeling in social media systems,” ACM Transactions on Information Systems, vol. 33, no. 3, pp. 1–44, 2015. [Google Scholar]
18. M. Kim and K. Kim, “Recommender systems using SVD with social network information,” Journal of Intelligence and Information Systems, vol. 22, no. 4, pp. 1–18, 2016. [Google Scholar]
19. L. H. Son, “Dealing with the new user cold-start problem in recommender systems: A comparative review,” Information Systems, vol. 58, no. 5, pp. 87–104, 2016. [Google Scholar]
20. J. Chen, Y. Lu, F. Shang and Y. Wang, “A fuzzy matrix factor recommendation method with forgetting function and user features,” Applied Soft Computing Journal, vol. 100, no. 1, pp. 106910, 2021. [Google Scholar]
21. R. M. Matiur and N. Jibon, “Recent advances in deep learning: An overview,” arXiv, 2018. https://doi.org/10.13140/RG.2.2.24831.10403. [Google Scholar]
22. Y. Bengio, A. Courville and P. Vincent, “Representation learning: A review and new perspectives,” IEEE Transactions on Pattern Analysis and Machine Intelligence, vol. 35, no. 8, pp. 1798–1828, 2013. [Google Scholar]
23. G. Spadondesouza, S. Hong, B. Brandoli, S. Matwin, G. Spadon, “Pay attention to evolution: Time series forecasting with deep graph-evolution learning,” IEEE transactions on pattern analysis and machine intelligence, Early Access, 2021. https://doi.org/10.1109/TPAMI.2021.3076155. [Google Scholar]
24. Z. Zhang and S. Zhou, “Research on feature extraction method of social network text,” Journal of New Media, vol. 3, no. 2, pp. 73–80, 2021. [Google Scholar]
25. T. Mikolov, I. Sutskever, K. Chen, G. S. Corrado and J. Dean, “Distributed representations of words and phrases and their compositionality,” in Proc. 26th Int. Conf. on Neural Information Processing Systems (NIPS), Nevada, US, pp. 3111–3119, 2013. [Google Scholar]
26. S. Li, Z. Zhao, R. Hu, W. Li, T. Liu et al., “Analogical reasoning on Chinese morphological and semantic relations,” in Proc. 56th Annual Meeting of the Association for Computational Linguistics (ACL), Melbourne, Australia, pp. 138–143, 2018. [Google Scholar]
27. W. Fang, Y. P. Chen and Q. Y. Xue, “Survey on research of RNN-based spatio-temporal sequence prediction algorithms,” Journal on Big Data, vol. 3, no. 3, pp. 97–110, 2021. [Google Scholar]
 | This work is licensed under a Creative Commons Attribution 4.0 International License, which permits unrestricted use, distribution, and reproduction in any medium, provided the original work is properly cited. |