DOI:10.32604/cmc.2022.023150
| Computers, Materials & Continua DOI:10.32604/cmc.2022.023150 | |
| Article |
MRMR Based Feature Vector Design for Efficient Citrus Disease Detection
1Department of Electronics & Communication Engineering, Chandigarh University, Mohali, 140413, India
2Department of Computer Science, College of Computers and Information Technology, Taif University, Taif, 21944, Saudi Arabia
3Ronin Institute, Mont Clair, NJ, 07043, USA
4School of Electronics & Communication Engineering, Shri Mata Vaishno Devi University, Katra, 182320, India
*Corresponding Author: Sultan Aljahdali. Email: aljahdali@tu.edu.sa
Received: 29 August 2021; Accepted: 13 December 2021
Abstract: In recent times, the images and videos have emerged as one of the most important information source depicting the real time scenarios. Digital images nowadays serve as input for many applications and replacing the manual methods due to their capabilities of 3D scene representation in 2D plane. The capabilities of digital images along with utilization of machine learning methodologies are showing promising accuracies in many applications of prediction and pattern recognition. One of the application fields pertains to detection of diseases occurring in the plants, which are destroying the widespread fields. Traditionally the disease detection process was done by a domain expert using manual examination and laboratory tests. This is a tedious and time consuming process and does not suffice the accuracy levels. This creates a room for the research in developing automation based methods where the images captured through sensors and cameras will be used for detection of disease and control its spreading. The digital images captured from the field's forms the dataset which trains the machine learning models to predict the nature of the disease. The accuracy of these models is greatly affected by the amount of noise and ailments present in the input images, appropriate segmentation methodology, feature vector development and the choice of machine learning algorithm. To ensure the high rated performance of the designed system the research is moving in a direction to fine tune each and every stage separately considering their dependencies on subsequent stages. Therefore the most optimum solution can be obtained by considering the image processing methodologies for improving the quality of image and then applying statistical methods for feature extraction and selection. The training vector thus developed is capable of presenting the relationship between the feature values and the target class. In this article, a highly accurate system model for detecting the diseases occurring in citrus fruits using a hybrid feature development approach is proposed. The overall improvement in terms of accuracy is measured and depicted.
Keywords: Citrus diseases; classification; feature vector design; plant disease detection; redundancy reduction
1 Introduction to Process of Plants Disease Detection
From the beginning of human evolution the dependency of humans on agriculture and its products are persistent. The agricultural products serves to provide food and nutrition to the human race. They are even responsible for cleaning the environment and maintain the ecological balance. The agriculture plants are effected by number of diseases and these disease act as a source of reduction in yield. The main work in the direction of reduction in wastage of yield is detection of plant lesions and classifying the type of diseases. This is needed to be done in order to ensure economic growth [1]. As India is still in the developing stage and the facts shows that it stands at sixth position in terms of Gross Domestic Product (GDP) [2]. Indian economy depends upon agriculture. In total approximately 70% population is earning from agriculture either directly or indirectly. Indian GDP largely depends upon Agricultural products as it constitute 18% share in the total GDP [3]. Due to versatility in the environmental condition, India favors the cultivation of varied varieties of horticulture products. Horticulture being sub field of agriculture majorly focusses on fruits and vegetables. In recent times the production have increased by approximately 35% [4]. This have been possible due to deployment of modern methods of farming. The need to develop modern methods of agriculture is utmost priority in order to sustain large population and to cater their needs. As Indian agricultural production is an important part of export there is a need to maintain the quality of agricultural products so as it does not contaminate while reaching the end user [5]. The Indian scenario poses many challenges to the farmers, poor economic condition is being one of them. For selling their products farmers have to pass through the middleman and storage of products is an additional burden. In order to facilitate the farmers, these challenges must be addressed by deploying technological tools in the agriculture we require advanced technology in the agriculture field. The modern techniques include deployment of computer-vision based methods for monitoring and analyzing the agricultural fields remotely [6]. These computer vision based methods prove to be an effective tool in catering the needs of farmers and resolving the issues they are facing. In the last few decades, with the development of technology, the deployment of visual inspection systems have taken a boom. Particularly in the field of monitoring quality of products, these methods are particularly replacing manual efforts and the systems are turning out to be fully automated one [7]. Fig. 1 describes the evolution in the field of plant disease detection from traditional to technological based methods. Traditionally manual inspection was done in order to label the diseased plants. Other methods include testing the samples in laboratory and performing various indicator tests to find out disease in the plant.
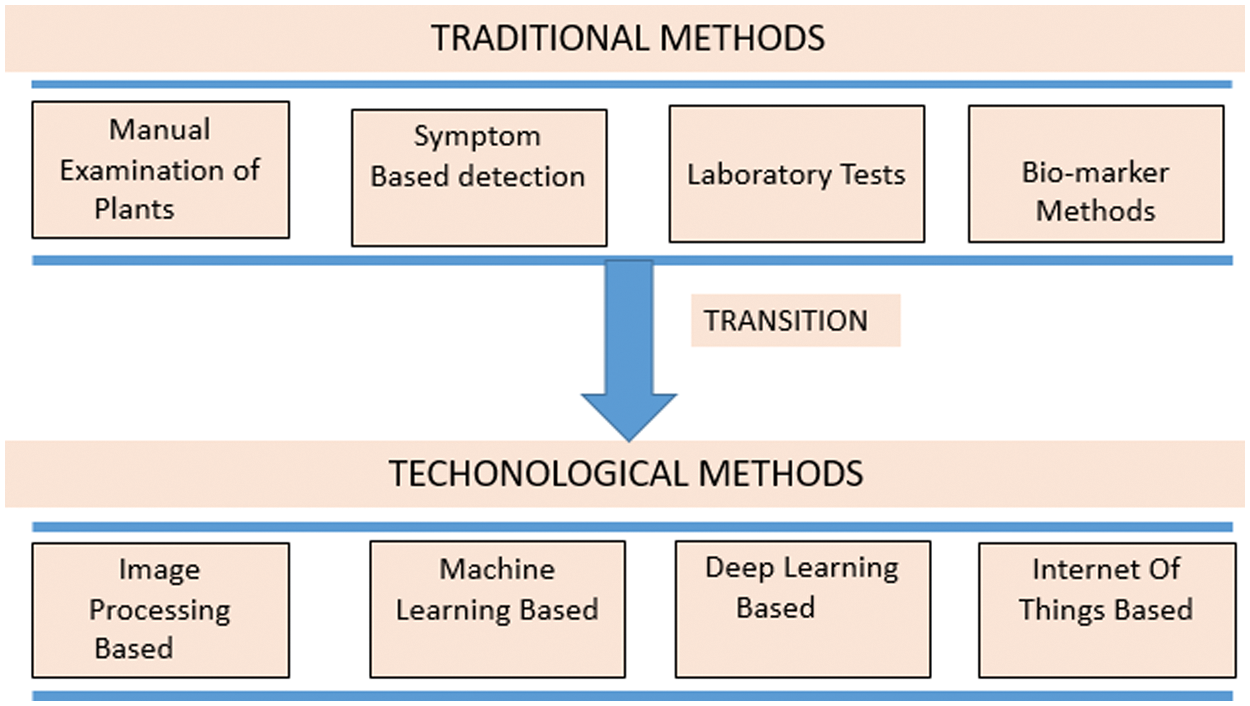
Figure 1: Evolution of methods of plant disease detection
The process of disease detection is a multistage interconnected process as shown in Fig. 2. In order to develop a highly efficient and accurate disease detection model, it is necessary to understand the each process carefully and precisely. The disease detection process consist of following stages-Image acquisition or dataset creation, Pre-processing, Lesion Segmentation, Feature extraction, Feature Selection, Classification. This automated process is capable in terms of detecting the disease accurately, so this have gained a lot of potential applications in replacement of traditional methods. Particularly in case of citrus plant diseases, a number of methods that can detect fruit and leaf lesions are developed and presented. General methods include edge based detection of lesion, watershed based segmentation of lesion, clustering for segmentation of lesion area, saliency based color map for segmentation, thresholding and masking based segmentation and many other similar approaches. The approach behind all these algorithms is identical as they focus on distinguishing lesion area from rest of the image. The sequential process of detection will be affected by the performance of each and every stage. The fine tuning and modifications have to be done at each and every stage in order to make the complete system efficient and accurate one. The preliminary processing of the image is done in order to identify and separating the different sections of plant as leave sub part, fruit sub part and stem. This can be accomplished simply by cropping the image and dividing into different sub images [8,9].
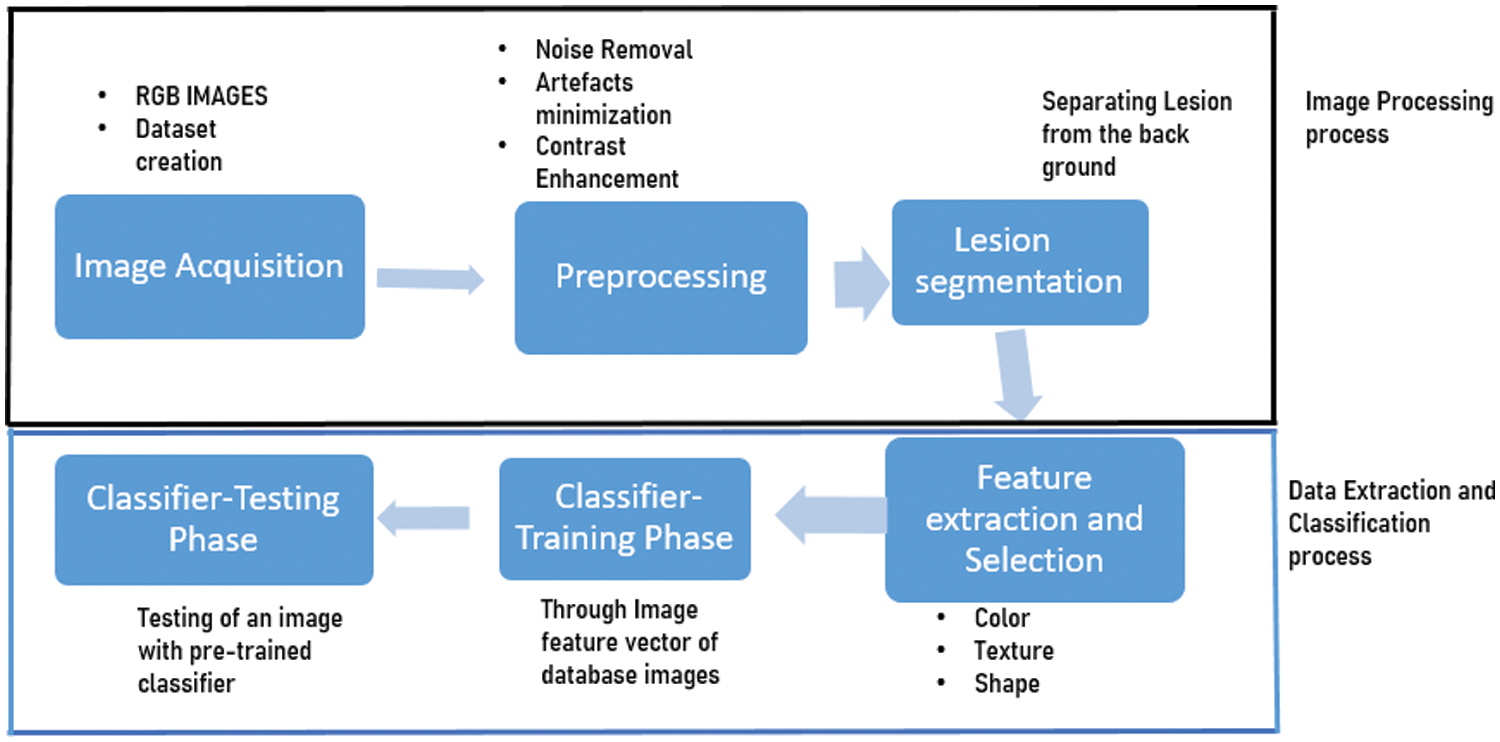
Figure 2: Schematic of plant disease detection using machine learning
Pre-Processing stage-The very first stage in the computer based method for disease detection is the pre-processing stage. The main goal of this stage is accomplishing contrast enhancement and noise removal from the input images. The acquisition or capturing devices have some kind of sensors inbuilt in them. Due to the inherent properties of sensors and other apparatus an amount of noise is added during acquisition. The presence of noise puts constraints on the subsequent stages and results in degraded performance of the segmentation stage and feature extraction [10]. The accuracy of highly appropriate segmentation algorithms are governed by the amount of noise present in the image. The main goals to be achieved by pre-processing stage are-Separation of fruit portion from noisy background, Highlighting the contrast of fruit with respect to background, Balancing the effect of variation in lightening conditions during image acquisition, Improving the low intensity points of images.
Segmentation stage-Segmentation of an image is an important phase for disease classification in plants. The main goal is to divide the image into sub sections. The division criteria will depend upon the type of application and image characteristics. The basic aim for segmentation is to extract Region of Interest (ROI). The segmentation start with initial pixel selected as seed and all other similar pixels are attached to the seed after verification of similarity criteria. Particularly for the application in disease detection of plants the segmentation plays an important role by separating the lesion disease area from the rest of the image. This will make the feature extraction more efficient. The separated disease part is base to achieve classification. The task for segmenting disease portion from the image is a challenging one. The challenges include change of color of disease, variation of color on different portions of fruit, problems due to different lighting exposure, variation in size of diseased area, multiple fruits in one image, scaling and origin variations, texture of lesion, processing time of segmentation algorithm [11].
Feature Extraction and Selection-Features of image are the metrics that provide information about the image content. These are generally the numerical values of different parameters obtained from the image intensity values. The process of calculating these numerical values is known as feature extraction. This is one of the most important stage of disease detection. For training phase of a classifiers all the features are merged together by some selection algorithm. This merged feature is known as feature vector or feature codebook. The feature extraction can be done for low level features or high level features. The choice of features totally depend upon the type of application. The low level features aims at finding out different shapes and boundaries in an image [12]. The examples of low level detection includes edge detection, saliency detection, key detection, saliency detection. Basically, the process of feature extraction is the detection and isolation of particular desired features from the image. This process aims at identifying and deriving the useful information from the image. The human eye can extract features and process the information through neurons [13]. But in case of computer vision algorithms they need to be trained beforehand in order to work them like human brain. Thus these features act as input to the computer vision systems. These features are statistically correlated which cannot be understood by humans as such [14,15]. For the development of plant disease detection systems, this feature extraction stage follows the segmentation stage.
Classification-Classifier is the machine learning algorithms that first learns through training and then responds to predict class label of the input being tested. From these attributes the machine learning algorithm develops the knowledge and ability to sense the class of the testing data. The once learned algorithm is considered as a trained model which will be used n number of times to predict the classes and solve the problem for which the training data was provided to the algorithm [16].
The design of proposed model is accomplished through optimizing the individual stages while targeting for highly efficient complete model on the whole.
(i) Design and Development of effective Pre-Processing stage
The proposed model is centred on a hybrid approach of spatial and morphological filtering. The spatial high boost filter will be employed to achieve image sharpening and noise removal and the morphological module will improvise the contrast and limit the noise. The spatial high boost filter is an excellent option to boost the edge information through high frequency components and also is good at preserving the minor details through low frequency components. The morphological filter is a suitable choice for contrast enhancement as it does not introduce any over-amplification to the input image. Based on the performance analysis of high boost and morphological filter we propose a hybrid model for pre-processing stage for citrus disease detection system. The development of the model is described as follows:
Step-1: Basic processing of the image: The images acquired in the fields or collected from the database requires basic processing based on Image operations. The images will be resized and a standard value will be maintained for all the images. Other than resizing image cropping will be applied in order to select the appropriate portion and removing the ambiguous details. The size of all the images will be set to 256 × 256.
Step-2: Spatial Filtering on R G B planes: The input images are decomposed into R G B individual planes to bring out more detailed information. These sub images are then subjected to high boost filtering to achieve sharpening and noise removal. All the operations are directly applied on the pixel values through a kernel element of a particular fashion supporting the conditions of second order derivative.
For implementing a high boost filter a filter mask is needed to be applied on the image. The mask is designed as follows:
1) Let Input Image be represented as A(m, n) with elements A(1, 1), A(1, 2)…A(3, 3)
2) A low pass filtered version of input image is generated by applying averaging mask and replacing the centre pixel with the average of neighbourhood. Let it be denoted by B(m, n).

Let the output image be denoted by Y. The output is computed through High boost filtering which can be obtained as
Take one centre pixel and put in Eq. (2):
From Eq. (1), put the value of B (2, 2) in Eq. (3).
Further resolve Eq. (4) to achieve weights for all 2D locations.
Develop the filter mask from Eq. (5)
The high boost filtering is applied to individual planes though the mask computed above and the filtered sub planes are concatenated back to the original RGB (Red Green Blue plane) form. Fig. 3 shows the spatial filtering module of the proposed model. The application of high boost filtering in individual planes is responsible for achieving overall sharpening at higher levels resulting in highlighted edge information. The combined spatial filtered output is highly sharp, noise is removed to some extent and the details in terms of low frequencies are preserved. The spatial filter have imparted the quality improvement to the image which further will be processed through the morphological filter.
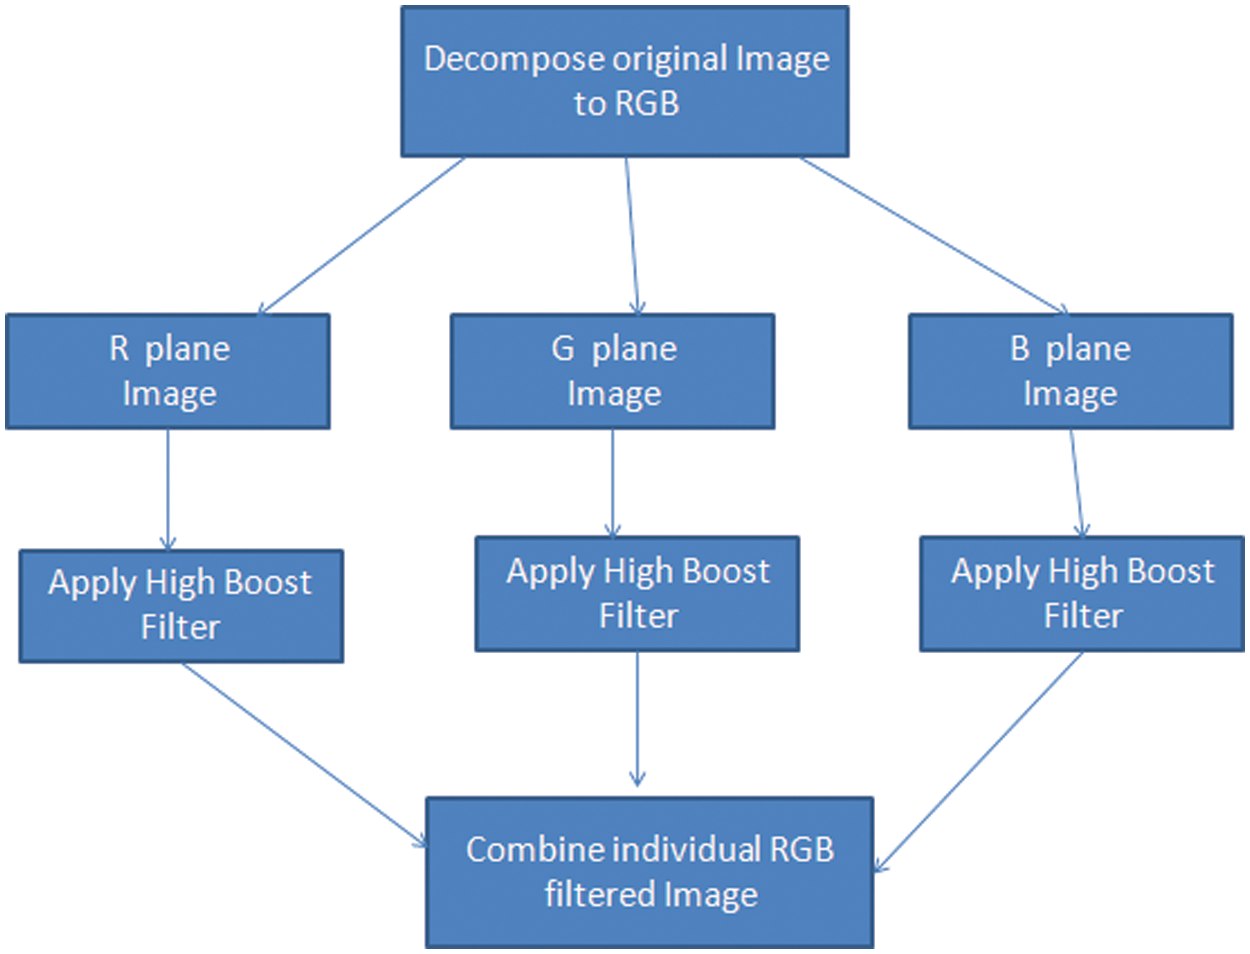
Figure 3: Spatial filter module
Step-3: Filtering through Morphology: The high boost filtered image Y (m, n) is then operated through Top-bottom hat filter for contrast enhancement and minimization of noise. The sharp noise peaks will be clipped off and the contrast is spreaded to achieve an equalised effect. A morphological filter is applied with the help of kernel function known as structuring element.
The morphology is implemented with elementary operation which are discussed as follows:
1) Through the process of erosion the removal of certain pixels is done depending upon characteristics of kernel K and is implemented as given in Eq. (7)
2) Through the process of dilation more pixels are added to the object boundaries depending upon characteristics of kernel K and is implemented as given in Eq. (8).
3) A composite operation known as Opening formed by combination of erosion in the initial stage followed by dilation keeping the kernel element same. The resultant effect is smoothing of contours and removal of peaks. The implementation is done as given in Eq. (9).
A composite operation known as Closing formed by combination of dilation in the initial stage followed by erosion keeping the kernel element same. The resultant effect is smoothing of contours and elimination of holes of small radii. The implementation is done as given in Eq. (10).
These elementary morphological operations are combined in different manners as per the requirements of application under consideration. For design of pre-processing stage two filters formed by combination of elementary morphological operations i.e., Top hat filter and Bottom hat filter is a suitable option as it can help improvement of contrast of dark images. The formation of morphological filter module is elaborated in Fig. 4. The top hatted version is computed by subtracting the resultant of opening operation between original image and kernel from the original image. This solves the problems relating to background illumination and perform enhancement of the bright objects with respect to a dark background. The bottom hatted version is a dual filter of top hat filtering. The filtered image is computed by subtracting the original image from the resultant obtained by performing closing of original image with kernel. This will result in highlighting the contrast of the image for efficient lesion segmentation. Moreover the sharp noise peaks are removed. Therefore a high quality image is obtained at the output.
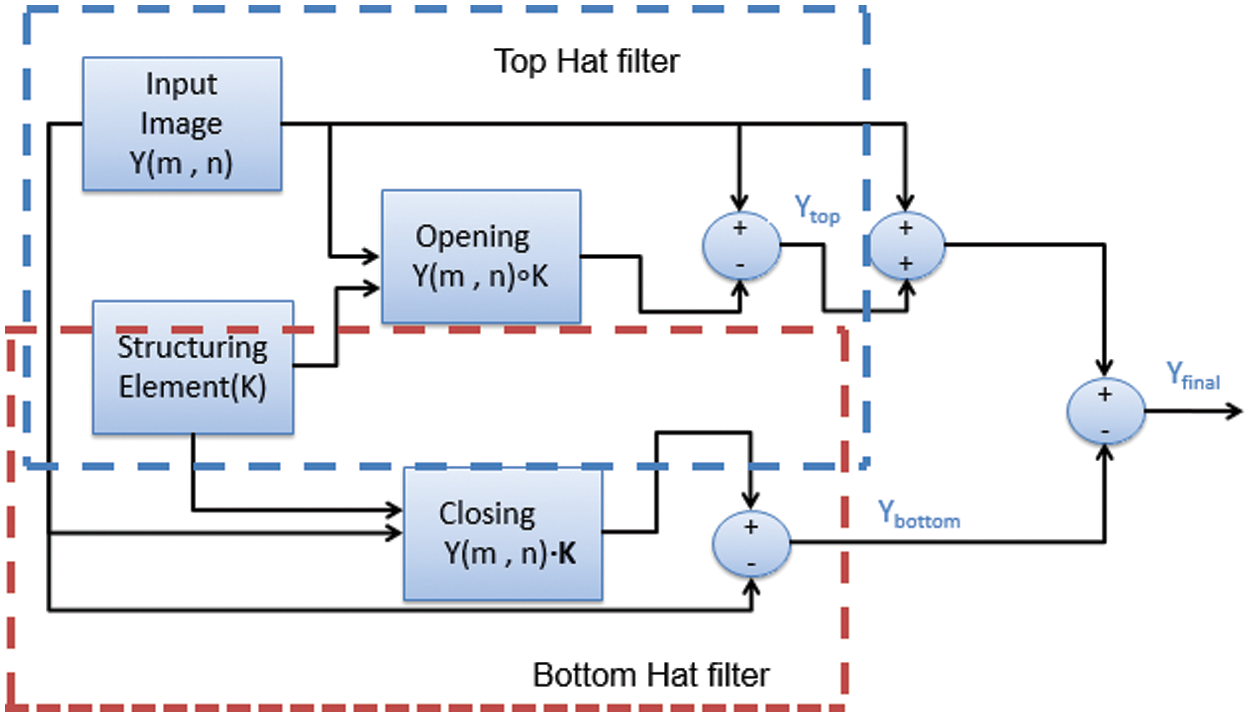
Figure 4: Morphological filter module
The Eqs. (11)–(13) represents the derivation of final resultant image using morphology.
(ii) Methodology for Lesion segmentation
The main goal of image segmentation is to extract the ROI containing the lesion area. In our work we have implemented conventional k-means clustering approach with modification to achieve better ROI. The limitations with conventional k-means clustering is that it cannot perform accurate ROI extraction in case of low contrast images. In order to rule out these limitations we propose a segmentation stage which is preceded by contrast enhancement and noise removal through efficient design of pre-processing stage. Fig. 5 shows the propose ROI extraction stage.
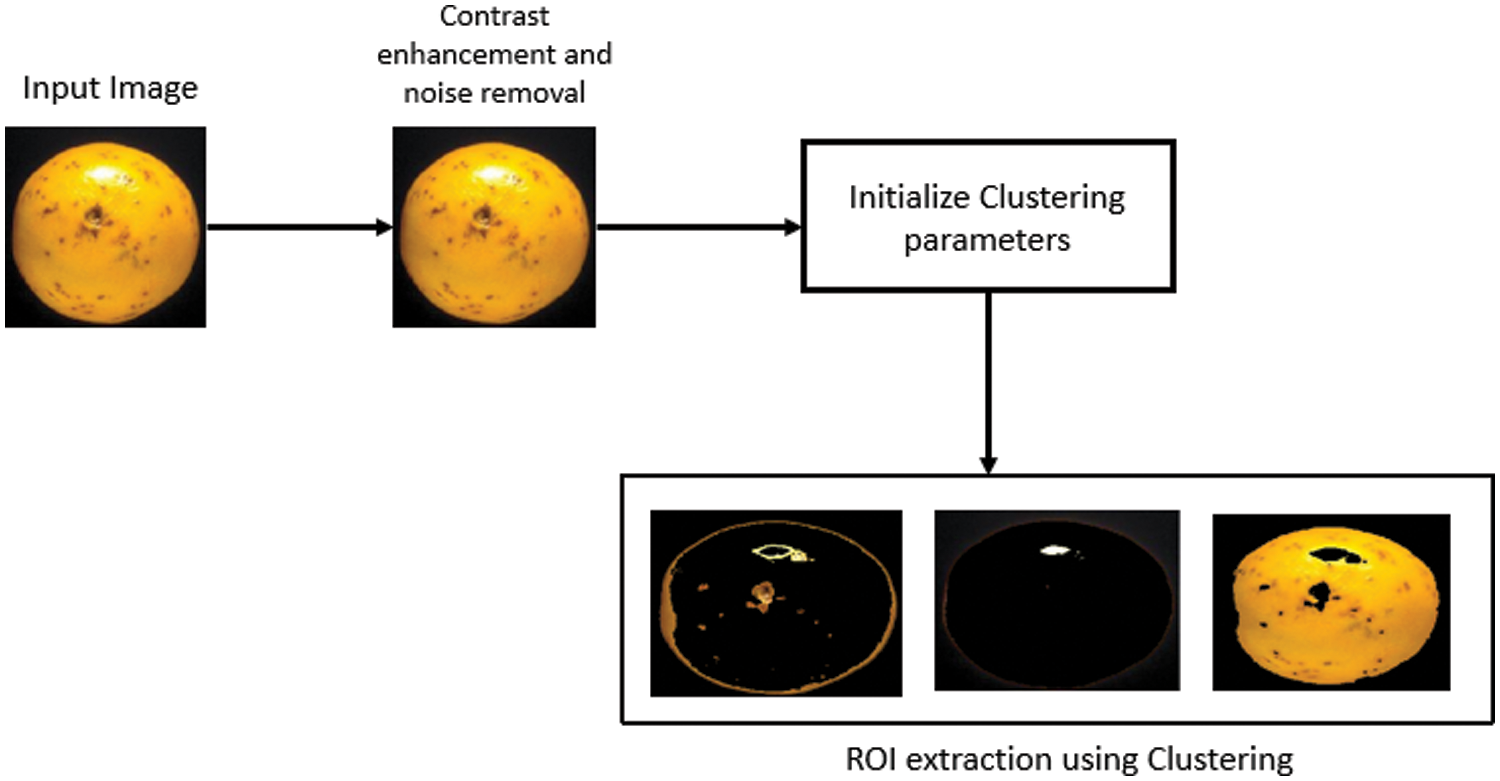
Figure 5: Proposed ROI extraction stage
For pre-processing stage we had used the combination of suitable spatial domain filter and morphological filter as discussed above. For extracting ROI we have taken number of clusters as three. So we will get three different clusters at the output and the particular cluster which is having most appropriate ROI will be selected and followed for feature extraction stage.
This approach will provide us two outputs in the form of images; First one being the enhanced image and second is the segmented cluster. Both of these images will act as input to the feature extraction stage and the corresponding features will be extracted from the images [17].
(iii) Feature Vector design
Image features are the statistical attributes of the image extracted by applying mathematical formulations. Feature extraction is an integral part of Pattern matching and computer vision fields. The extracted features are the attributes applied to the classifier to solve classification problems. This stage in design and development of system takes image as input and provides statistical properties as numerical values at the output. This is one of the major step in the design and development of disease detection system. The feature selection stage is one which accepts images as inputs and then extract the parameters which primitively describes the color, shape and texture of the image. The main goals of proposed methodology are described as following:
i. The feature vector must be capable of providing the detailed statistical characteristics of the lesion belonging to a particular disease.
ii. The feature vector must describe the relationship between the pixels belonging to the closed confined structure of the lesion.
iii. The features are selected in a manner to ensure minimum redundancy as the redundant information may drive the classification stage in negative performance. This will tackle overfititng problems in machine learning models.
iv. The feature vector must possess the information about the lesion and the background so that classifier can acquire the knowledge to make the decisions.
v. The relevance of the features need to be tested in order to reach the optimum performance.
vi. The development of handcrafted features must pass through a feature fusion methodology to obtain a best combination of the selected features.
vii. The minimum number of features with maximum relevance ensures reduction in training time of the classifier.
Color Feature Vector: The color is an integral property for description of images. The color values can be represented in different ways by representing an image in different color spaces. For developing color feature vector, we have converted the pre-processed image in different color planes like RGB, HIS (Hue Intensity and saturation) and L*a*b. For each individual planes we have extracted six features namely mean, standard deviation, variance, Skewness and kurtosis. Therefore for one color space since there are 3 sub images, this will make feature vector size for each color space equal to 18 and we are using 4 color planes so the final color feature vector will be of size 1 × 72 and is represented as f1.
Geometric Feature vector: The geometrical attributes of an image are the characteristics of the local lesion area. To utilize the geometry features in an optimum manner, we have extracted the geometry features from the segmented image containing ROI. Since the lesion spot size (diameter) varies from disease to disease so this will lay a strong foundation for classifier knowledge acquisition. The geometry features will statistically characterize the lesion spot and thereby gives a detailed description of lesion spot so as to make classifier learn about the patterns belonging to a particular disease. The size of constructed geometry feature vector is 1 × 11 and is represented by f2.
Texture Feature Vector: The texture of an image is a very powerful descriptor which provides the arrangement of color values in spatial domain. Texture is a direct descriptor of variation in intensity in the neighborhood of a pixel. While using this for disease detection, it plays a role in terms that the texture of lesion is distinct as compared to background and also the texture varies from disease to disease. Therefore texture can provide substantial information about the lesion to the classifier. We have extracted texture features using two approaches; the conventional Gray level co-occurrence matrix (GLCM) and Local binary patterns (LBP). The use of these LBP features will make the texture feature vector a competent knowledge source to this classifier. The LBP features returns 59 features for 1 image making the size of vector as 1 × 59. Also we have included 4 most relevant features returned by GLCM i.e., Contrast, Energy, Correlation and Homogeneity which will make the total size of texture feature vector as 1 × 63 and is represented by f3.
Hybrid Feature Vector: The finalized hybrid feature vector as shown in Fig. 6, we have constructed using simple serial feature fusion methodology as given in Eq. (14), while keeping the individual weights of the feature vectors as unity.
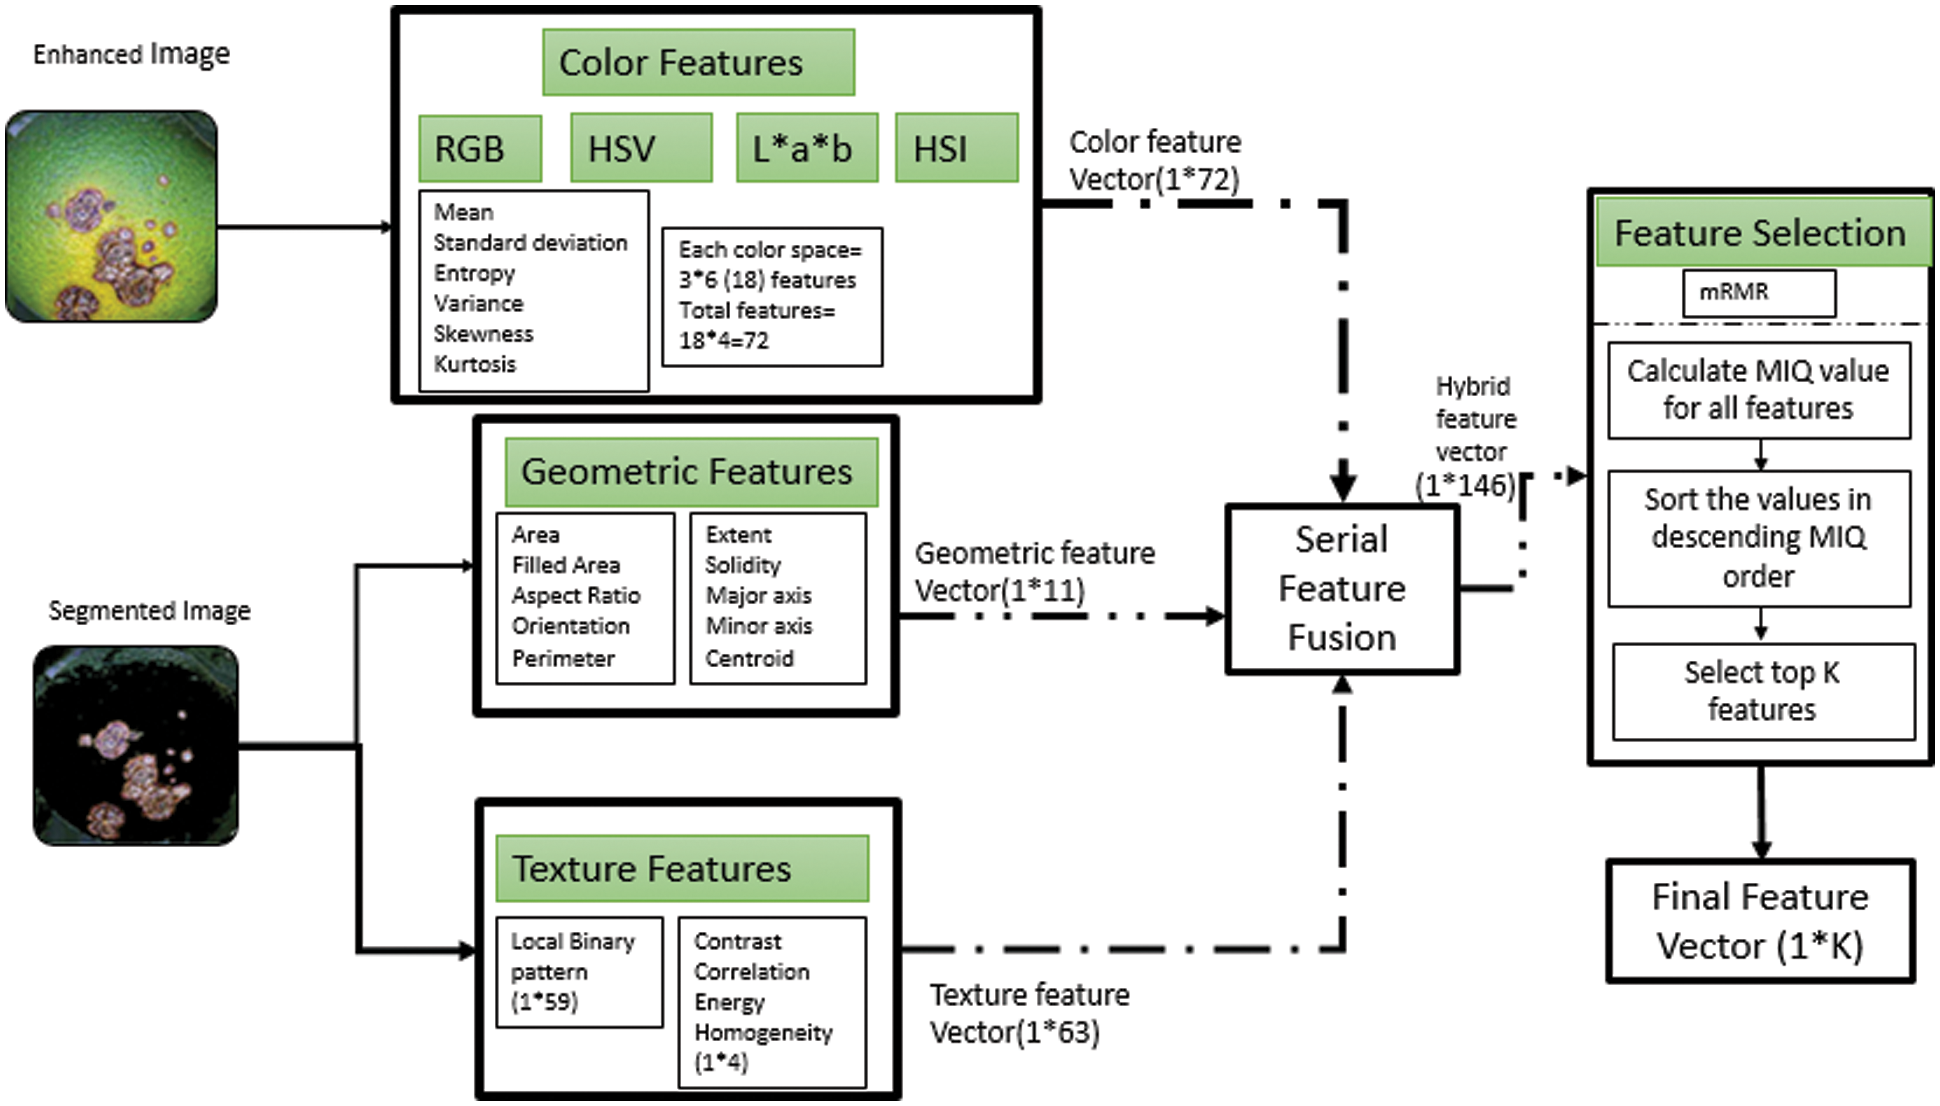
Figure 6: The proposed feature vector construction
As we have kept the individual weights as unity so Eq. (14) reduces to
Therefore as per Eq. (15) combining the individual feature vectors serially will result in a hybrid feature vector of size 1 * 146 and is represented by f.
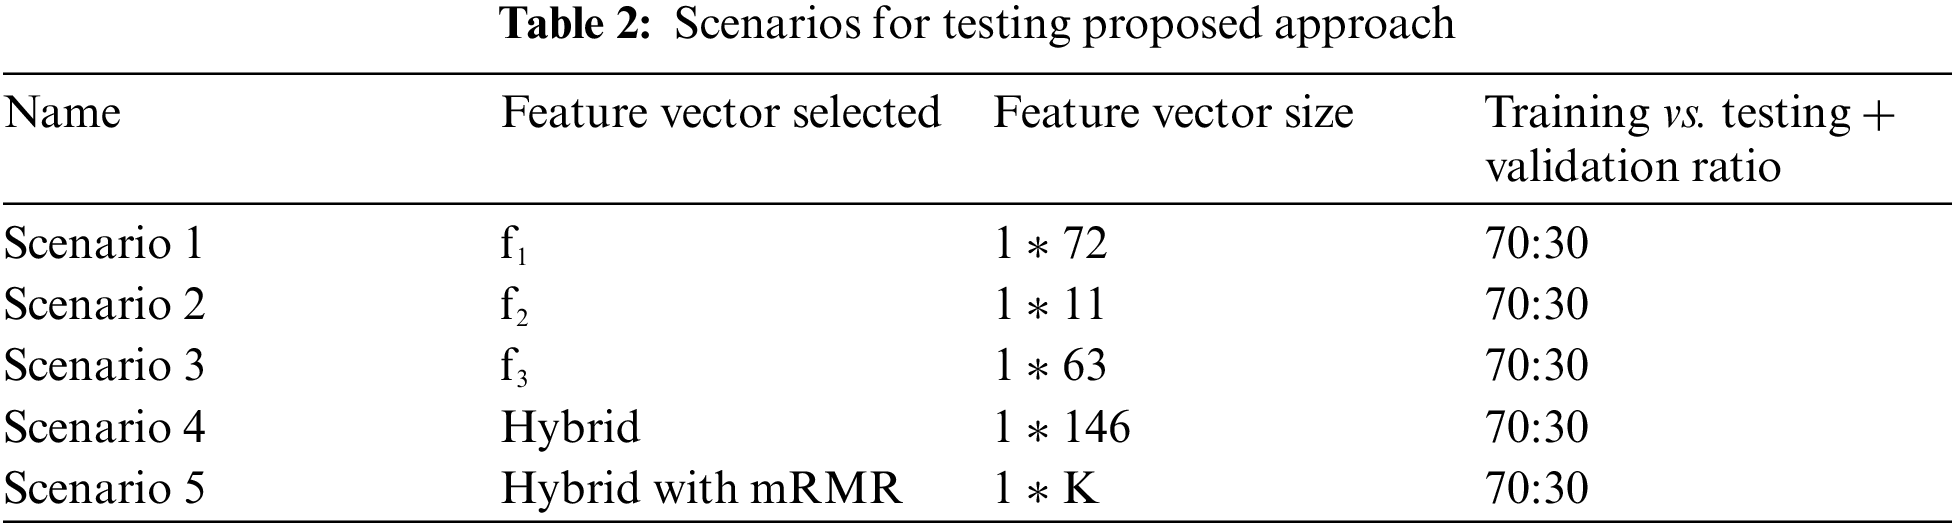
Feature Selection and optimization: In order to remove redundancy we have applied optimization in terms of feature selection and the finalized feature vector will be presented to the classifier for training purposes. In order to show the significance of hybrid feature approach we have developed the test setups which will pick either of the three vectors individually and then test the classifier. Secondly to demonstrate the importance of feature selection the test cases are drafted with different scenarios using selection methodologies. The methodology for feature selection we have applied is Minimum redundancy and maximum relevance algorithm [18].
This is filter based method for feature selection and specifically focus upon selecting the features which have more relevance to the target output and minimum correlation amongst them. Therefore it ensures maximum relevance with target class and minimum redundancy between the individual features. It generally filter out the similar features and ensure only an appropriate number of features is presented to the classifier. For obtaining maximum relevance features are statistically related to the target class and the features that have maximum association with the target class are selected. The selected features denoted by fi must have maximum mutual information with the target class ‘y’ i.e., MI (fi, y). The features are arranged in descending order of mutual information and top k features forms the selected feature vector K as given by Eq. (16).
To ensure minimum redundancy amongst the maximum relevance features the second step filtration is applied as per Eq. (17).
So the resultant will ensure that the selected features are mutually uncorrelated and strongly correlated to the target class. We can manually select the number of features we want to use as they are arranged in descending order of relevance. We can pick any number of features and form the final feature vector.
Steps for mRMR are:
1) Calculate the relevance of K with respect to target variable y in terms of mutual information using Eq. (18).
2) Calculate redundancy of K using Eq. (19).
|K| represents number of features in K vector.
3) The step 1 and 2 are repeated multiple times to compute the mutual information for all the feature space considering all the pairs of features possible in feature set K.
4) Compute Mutual information quotient (MIQ) for all the features by using the values computed in step 1 and 2 as given in Eq. (19).
5) Calculate MIQ for all the features and sort them in descending order.
6) Select the feature that is having highest MIQ and add it to the feature vector K.
7) Keep on adding the features on the basis of MIQ value and repeat till relevance is zero i.e., there is no association of feature with the target variable.
8) Select the top k features from the prepared feature vector K.
The feature vector thus formed will ensure the reduction in redundancy of the features and will improve the classification accuracy.
3 Experimental Results and Discussion
The proposed model as shown in Fig. 7 evaluation is done through stage by stage metric computation. We have used citrus disease dataset citrus disease image gallery [19]. The dataset i.e., citrus disease image gallery contains 1000 images of different diseases occurring in citrus fruits but we have selected five commonly occurring diseases namely anthracnose, greening, canker, scab, Melanose and black spot. The dataset records images of fruits as well as leaves with dimensions 100 × 150 at resolution of 96 dpi. A comparative evaluation of results with the existing state of the art techniques is also carried out. The objective evaluation of Pre-processing stage will be based on calculation of performance metrics MSE (Mean Squared Error), PSNR (Peak Signal to Noise ratio), SC (Structural Content), AD (Average Difference), MD (Maximum Difference), NAE (Normalized Absolute Error), NCC (Normalized Cross Correlation) [20].
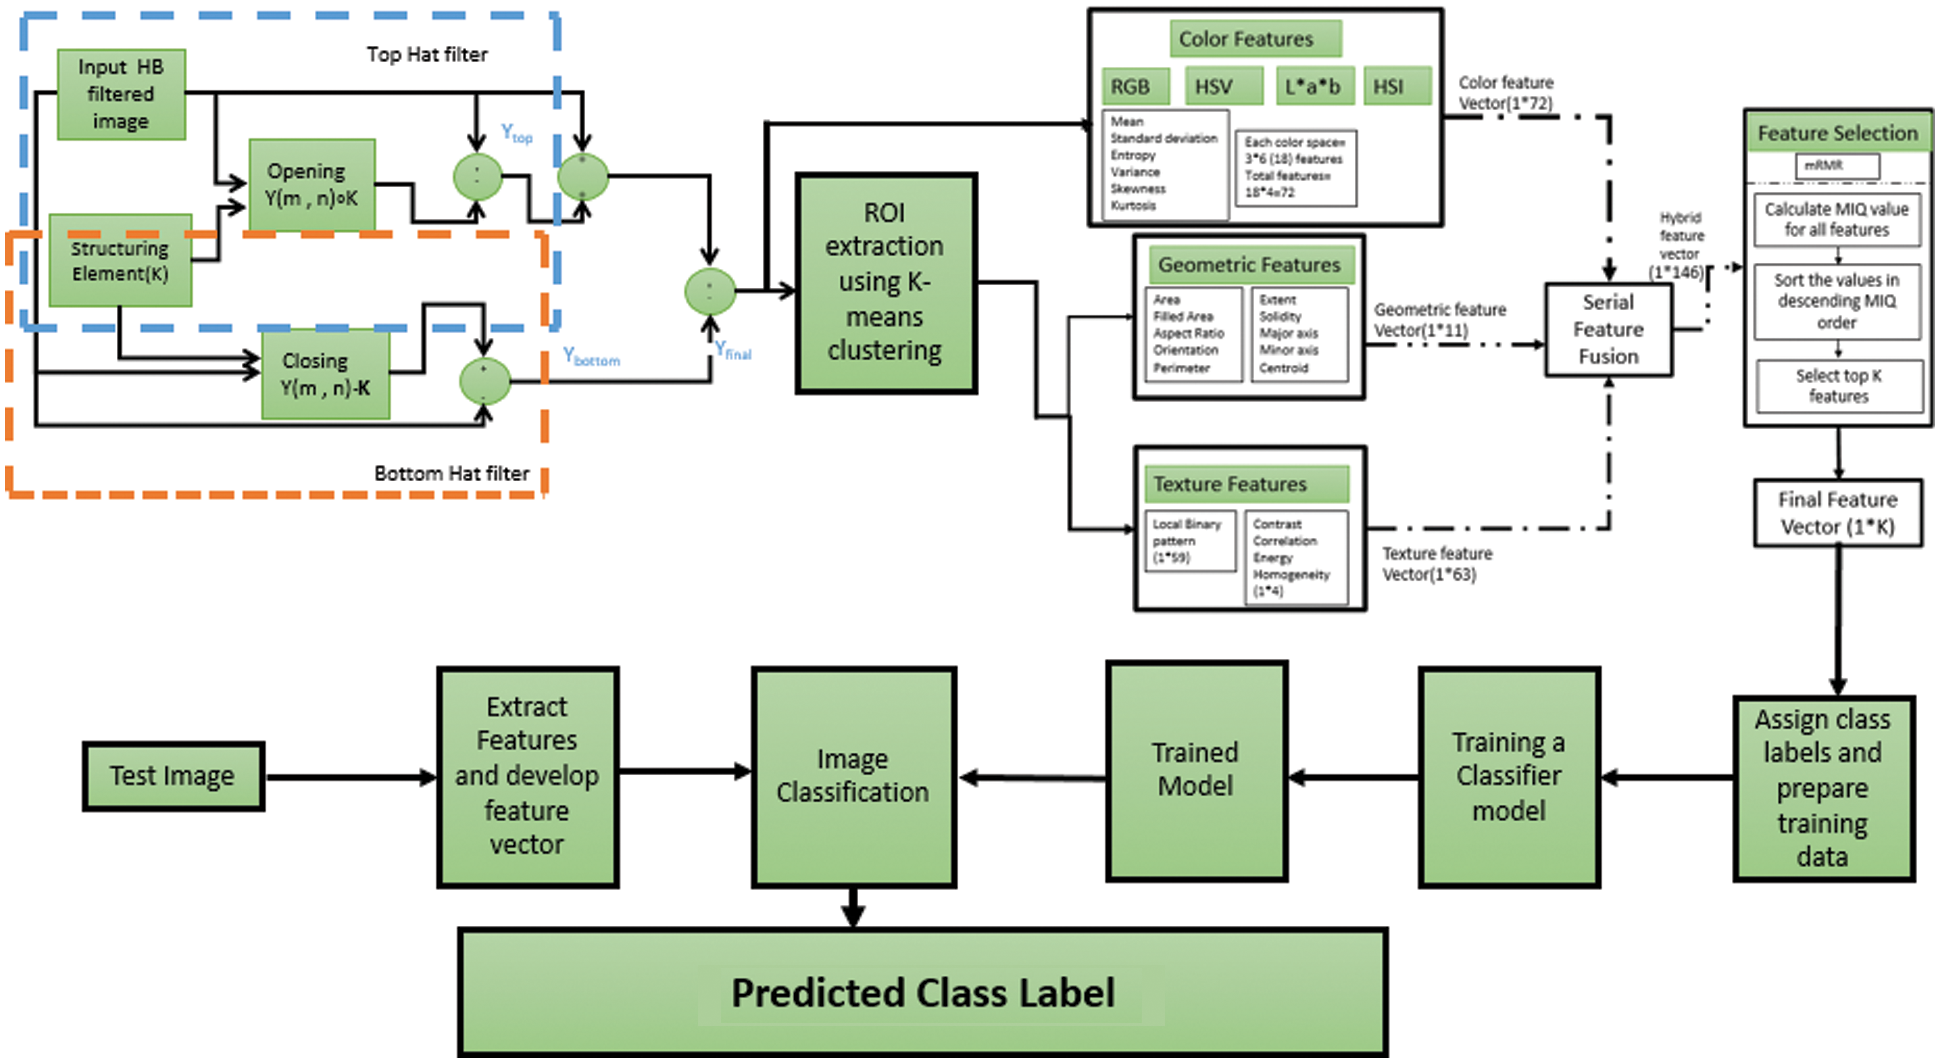
Figure 7: The proposed system model
Tab. 1 demonstrates the metric values for the proposed pre-processing stage. The image thus produced at the output of pre-processing stage which is going to be act as input for segmentation stage must have the objects that are distinctively sharpened for accurate and crisp region of interest extraction. Emphasizing particularly on disease detection, the bare minimum requirement is the lesion area must possess sharp edges.

Tab. 2 demonstrates the proposed approach testing scenarios. This is ensured by applying a high boost filter of appropriate filter mask. The resultant high boost filtered image possess sharp object boundaries and minimum amount of noise. Moving on further to achieve contrast improvement morphological filter is deployed for overall image quality improvement. The outcome of proposed algorithm shows considerable amount of improvement in the value of PSNR which is a direct indicator of overall quality improvement at minimum amount of noise.
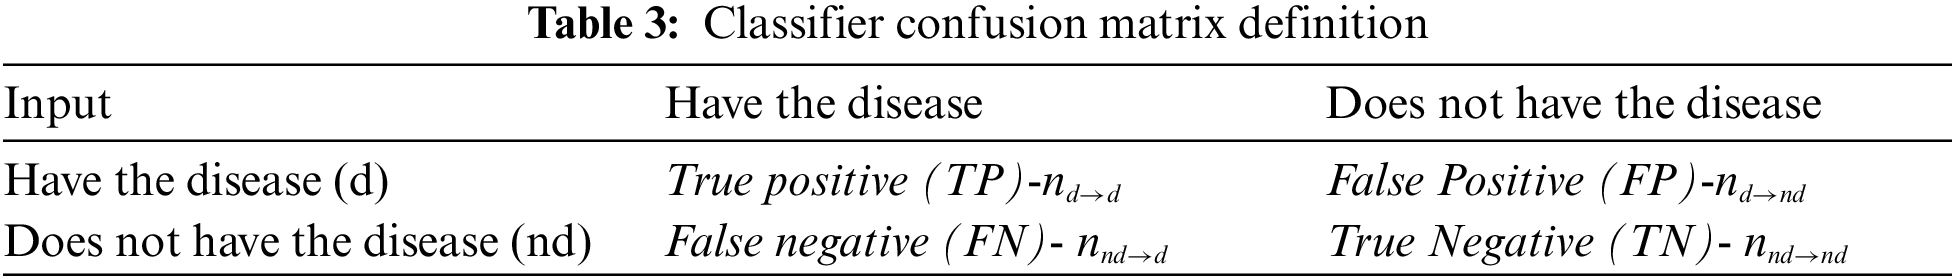
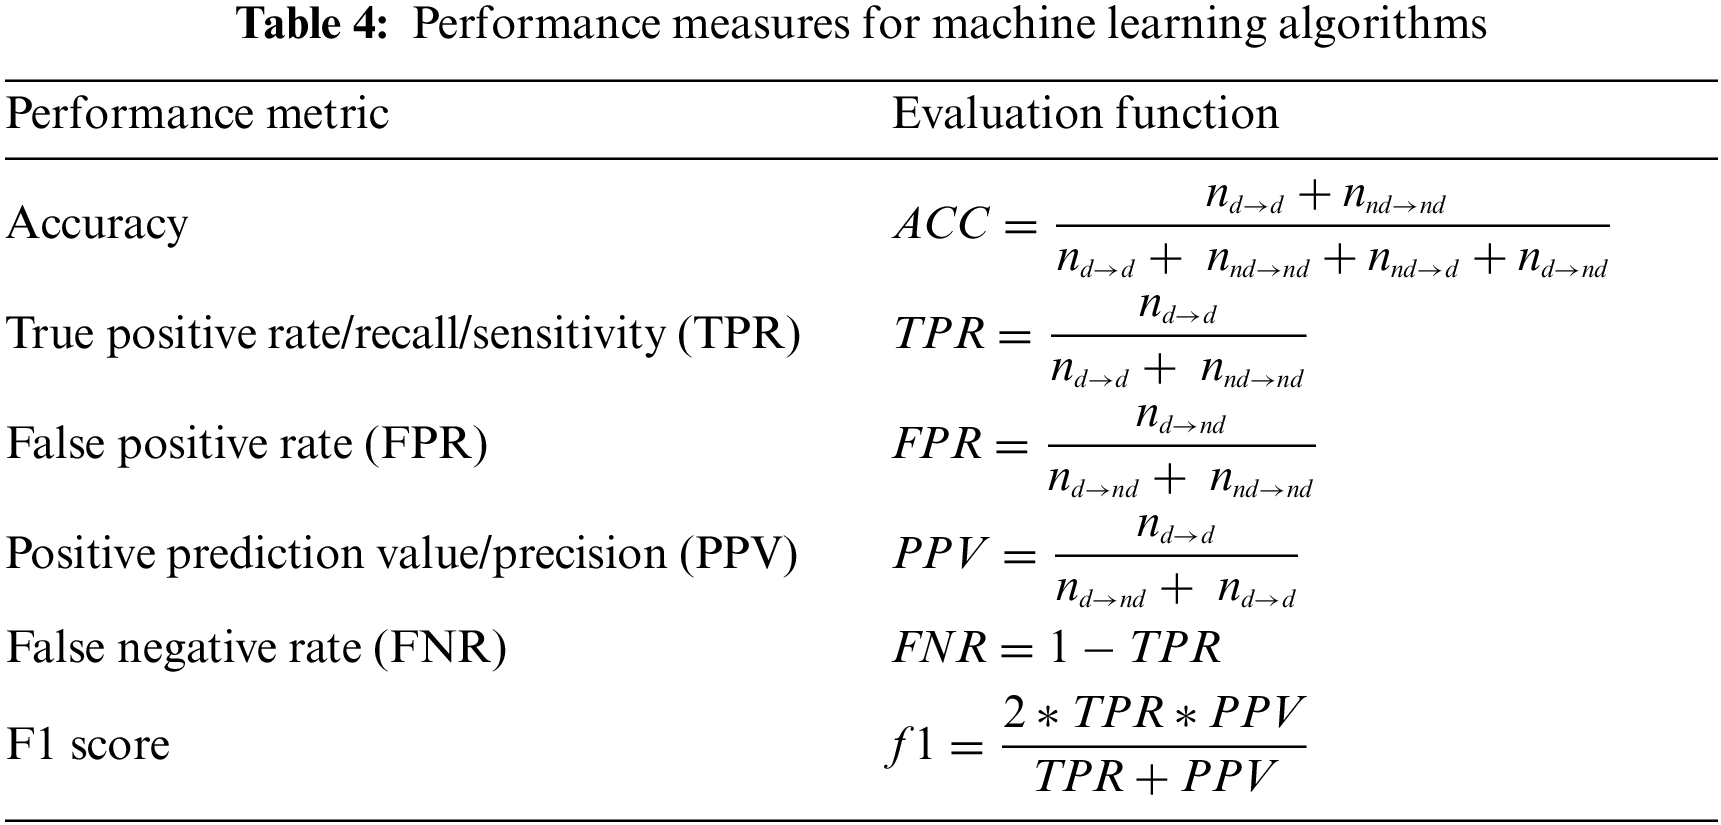
Tab. 3 defines the construction of the confusion matrix and the reference terminology nomenclature for performance metrics. The performance metrics we have used for the evaluation of the proposed methodology are listed in Tab. 4. The implementation of Feed Forward Neural Network (FFNN) in different scenarios is done by taking a 2 Layer network with sigmoidal function working in hidden layer and Softmax function in the output layer. The training method adopted is Scaled conjugate gradient back propagation with single hidden layer and number of neuron in hidden layer as ‘8’.
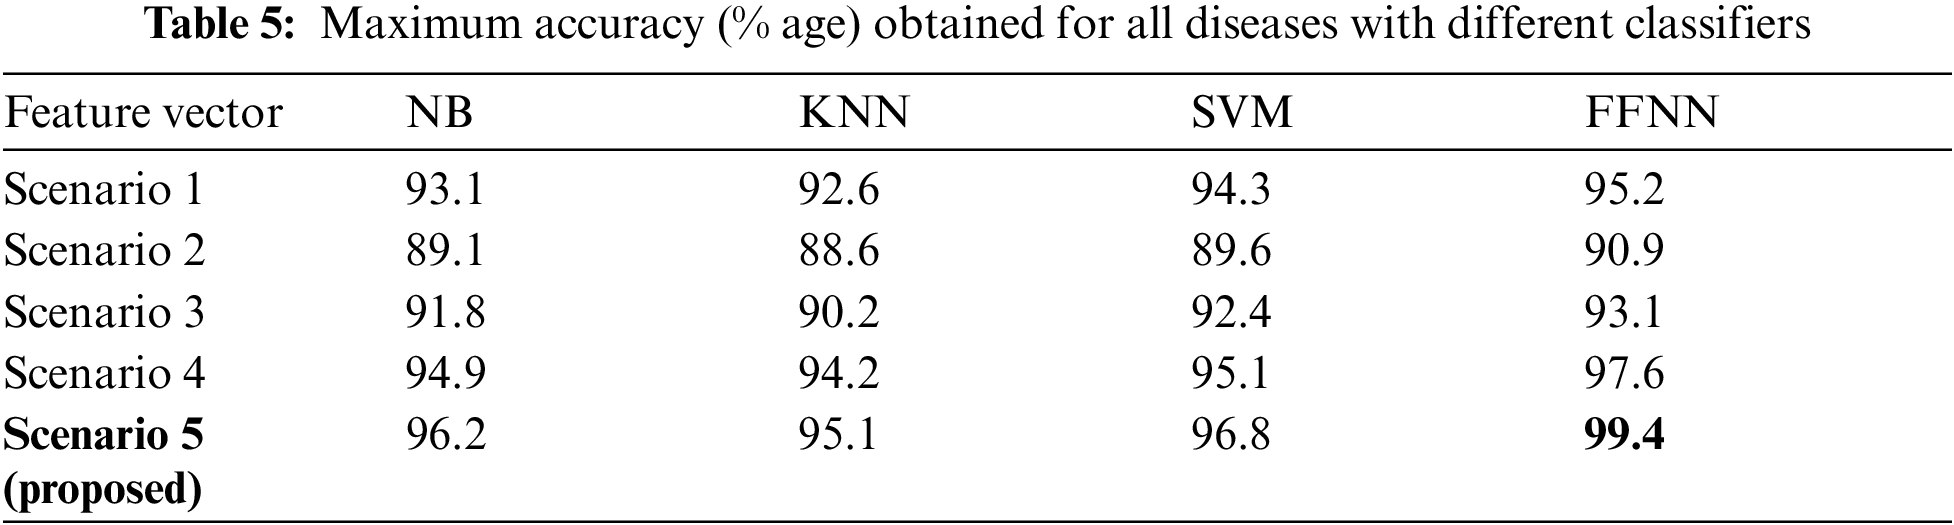
Tab. 5 is depicting the values of maximum accuracy obtained with different set of classifiers. By analyzing this table we can deduce that for this dataset FFNN is giving best results in all the variants of feature vector. So for further analysis we will be focusing only upon FFNN.
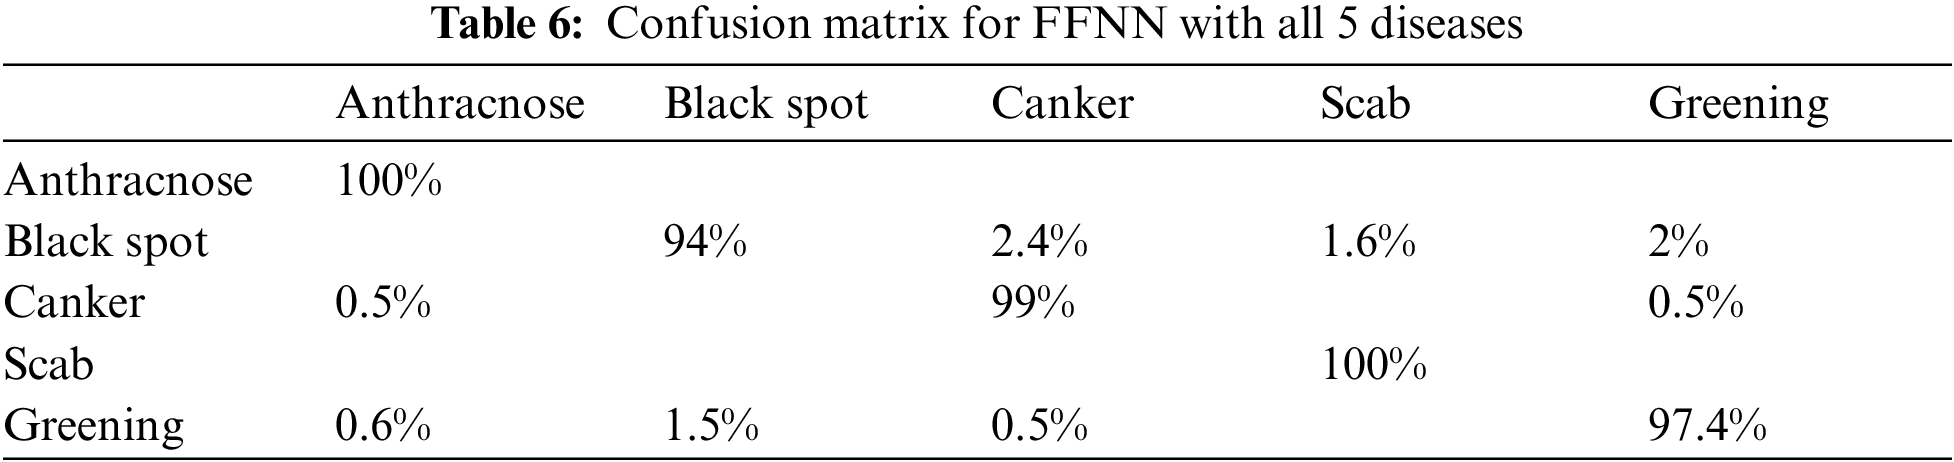
We have trained and tested the FFNN first by considering all 5 diseases together and then individually disease vs. healthy class. As evident from Tab. 6 in multi-class testing anthracnose and scab are having no instances of misclassification and in case of black spot the major misclassification is towards canker. With the greening disease the major confusion is with black spot. This is due to similar symptoms amongst the diseases.
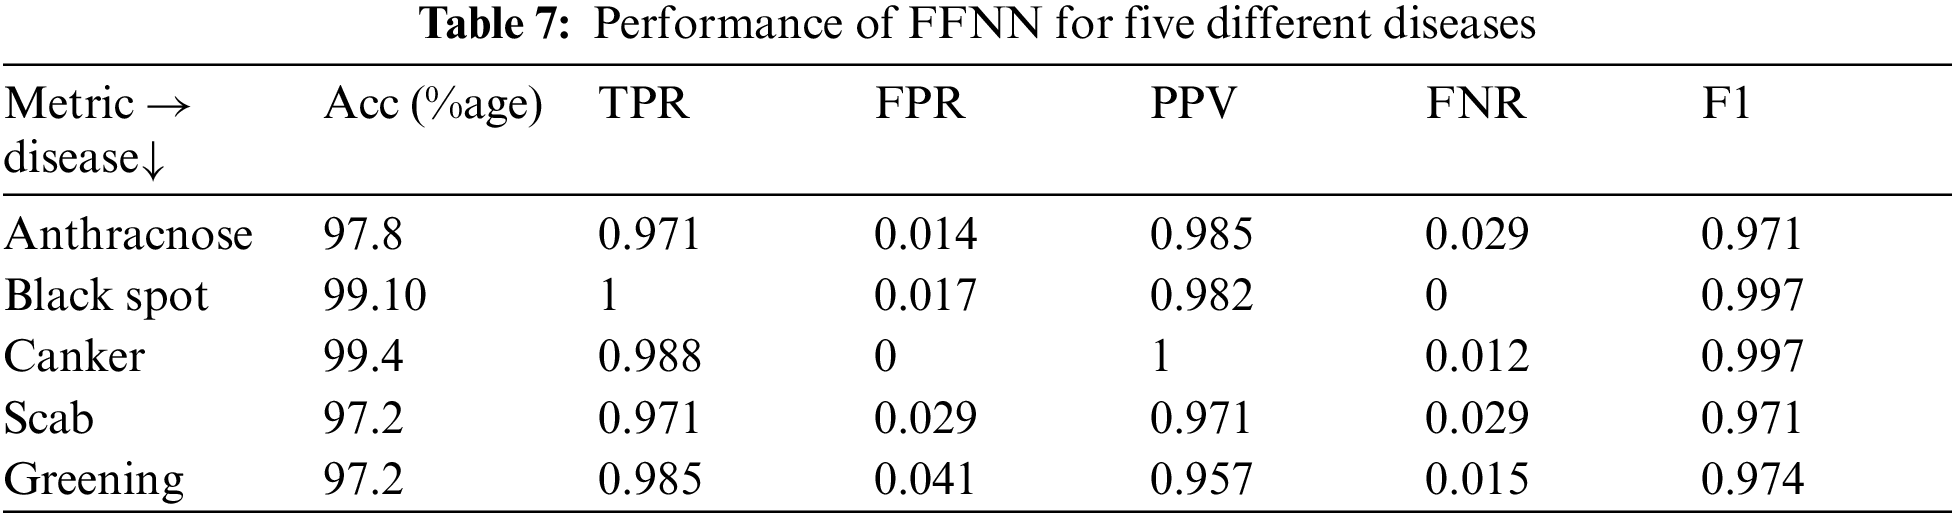
The performance for FFNN is shown in Tab. 7 with the values of different quality metrics for classification process. The best accuracy is obtained for citrus canker which is one of the most commonly occurring disease. The accuracy values with other diseases is considerably improved by deploying the proposed scheme for system design. The design of hybrid feature vector is first tested with different machine learning algorithms and afterwards the optimal classifier is implemented for different disease images from dataset.
4 Conclusion and Future Directions
The automated solutions are proposed by the number of researchers for early detection of the disease and the classification of the disease is gaining a lot of attention by the farmers as they require lesser human effort. In this work an approach based on the machine learning model for disease detection in citrus fruits using a hybrid feature descriptor is developed. After conducting an exhaustive literature survey, it has been found that the fine-tuning of input images in terms of noise removal and contrast improvement greatly drives the accuracy of the system. The pre-processing methodologies were lacking to improve the quality of the image and this resulted in poor segmentation and feature extraction stage. As noise tends to alter the pixel values, so a faithful feature vector cannot be constructed from the noise affected image. By deploying a contrast enhancement scheme in the pre-processing stage the accuracy of the traditional k-means clustering model is corrected and is used as a suitable model for ROI extraction. Therefore for the segmentation stage k-means clustering method is proven to be the most optimum choice. The individual feature vector comprising individual features are not giving promising results as compared to the obtained feature vector by hybridization (the proposed feature vector) of feature domains. Moreover, to reduce the classifier training time, the dimensionality and redundancy of the hybrid feature vector are optimized using the mRMR algorithm which ensures minimum redundancy and maximum relevance characteristics of the hybrid feature vector. The application of the feature reduction approach ensured the removal of redundancy in the feature vector and also ensuring the relevant statistical patterns of the data belonging to a different target disease class. The testing of four different classifiers is done using two different datasets and five different scenarios of the feature vector. The first level selection is based on choosing the appropriate feature scenario which resulted in a hybrid feature vector with reduced redundancy as an outperformer. In the second level selection, four machine learning models namely NB, KNN, SVM, and FFNN are compared and the results obtained is FFNN as a winner in terms of accuracy. Also, we have optimized the parameters of FFNN by making variations in the number of hidden layer neurons, training function type, and the best performance is achieved with ‘trainscg’ activation. Besides these the classification is carried out at two levels, firstly by considering binary classification i.e., diseased vs. non-diseased and secondly, by considering different diseases altogether for a multi-class detection of disease. The accuracy improvement achieved with this model varies with the disease and the range of improvement in the accuracy values w.r.t existing state-of-the-art approaches is 1%–2%. An overall accuracy with dataset 1 for canker disease obtained is 99.4%, for scab and greening disease is 97.2% and for anthracnose is 97.8%. The prominent system performance obtained using the proposed approach makes it a suitable methodology for early detection and classification of citrus diseases thereby reducing the economic losses.
Funding Statement: This work was supported by Taif University Researchers Supporting Project (TURSP) under number (TURSP-2020/73), Taif University, Taif, Saudi Arabia
Conflicts of Interest: The authors declare that they have no conflicts of interest to report regarding the present study.
1. V. S. Gutte and A. M. Gitte, “A survey on recognition of plant disease with help of algorithm,” International Journal of Engineering Science, vol. 6, no. 6, pp. 7100–7102, 2016. [Google Scholar]
2. The economic times. GDP data; 2018. [Online]. Available: https://economictimes.indiatimes.com/news/economy/indicators/view-being-the-worlds-6th-largest-economy-means-little-for-indias-future/articleshow/64966415.cms. [Google Scholar]
3. M. K. Tripathi and D. D. Maktedar, “A role of computer vision in fruits and vegetables among various horticulture products of agriculture fields: A survey,” Information Processing in Agriculture, vol. 7, no. 2, pp. 1–21, 2019. [Google Scholar]
4. Ministry of Finance, Press Information Bureau Government of india, The Economic Survey; 2018. [Online]. Available: https://pib.gov.in/Pressreleaseshare.aspx?PRID=1577045. [Google Scholar]
5. A. Kamilaris and F. X. Prenafeta, “Deep learning in agriculture: A survey,” Computers and Electronics in Agriculture, vol. 147, pp. 70–90, 2018. [Google Scholar]
6. J. Hemming and T. Rath, “PA—precision agriculture: Computer-vision-based weed identification under field conditions using controlled lighting,” Journal of Agricultural Engineering Research, vol. 78, no. 3, pp. 233–243, 2021. [Google Scholar]
7. J. F. S. Gomes and F. R. Leta, “Applications of computer vision techniques in the agriculture and food industry: A review,” European Food Research and Technology, vol. 235, no. 6 pp. 989–1000, 2012. [Google Scholar]
8. J. K. Patil and R. Kumar, “Advances in image processing for detection of plant diseases,” Journal of Advanced Bioinformatics Applications and Research, vol. 2, no. 2, pp. 135–141, 2011. [Google Scholar]
9. P. Chaudhary, A. K. Chaudhari, A. N. Cheeran and S. Godara, “Color transform based approach for disease spot detection on plant leaf,” International Journal of Computer Science and Telecommunications, vol. 3, no. 6, pp. 65–70, 2012. [Google Scholar]
10. R. C. Gonzalez, S. L. Eddins and R. E. Woods, “Filtering in the frequency domain,” in The Digital Image Processing Using MATLAB, 2nd ed., New Delhi, India: Tata Mc Graw Hill, pp. 118–138, 2010. [Google Scholar]
11. Z. Iqbal, M. Attique. M. Sharif, J. Hussain, M. Habib et al., “An automated detection and classification of citrus plant diseases using image processing techniques: A review,” Computers and Electronics in Agriculture, vol. 153, pp. 12–32, 2018. [Google Scholar]
12. S. Ramesh, R. Hebbar, M. Niveditha, R. Pooja, N. Shashank et al., “Plant disease detection using machine learning,” in Int. Conf. on Design Innovations for 3Cs Compute Communicate Control (ICDI3C), Bangalore, India, 2018, pp. 41–45. [Google Scholar]
13. M. Hassaballah, A. Abdelmgeid and H. Alshazly, “Image feature detectors and descriptors,” in Studies in Computational Intelligence, Cham: Springer International Publishing, vol. 630, 2016. [Online]. Available: https://link.springer.com/chapter/10.1007/978-3-319-28854-3_2. [Google Scholar]
14. H. Wang, S. M. Yoon, D. K. Han and H. Ko, “A feature descriptor based on the local patch clustering distribution for illumination-robust image matching,” Pattern Recognition Letters, vol. 94, pp. 46–54, 2017. [Google Scholar]
15. Z. Yuan and J. Zhang, “Feature extraction and image retrieval based on AlexNet,” in Eighth Int. Conf. on Digital Image Processing, vol. 10033, China, 2016. [Google Scholar]
16. D. K. Srivastava and L. Bhambu, “Data classification using support vector machine,” Journal of Theoretical and Applied Information Technology, vol. 12, no. 1, pp. 1–7, 2010. [Google Scholar]
17. R. Patil, S. Udgave, M. Supriya, D. Nemishte and M. Kasture, “Grape leaf disease detection using k-means clustering algorithm,” International Research Journal of Engineering and Technology (IRJET), vol. 3, no. 4, pp. 2330–2333, 2016. [Google Scholar]
18. C. Ding, and H. Peng, “Minimum redundancy feature selection from microarray gene expression data,” Journal of Bioinformatics and Computational Biology, vol. 3, no. 2, pp. 185–205, 2005. [Google Scholar]
19. The Citrus Disease Image Gallery, University of Florida, 2013. [Online]. Available: http://idtools.org/id/citrus/diseases/gallery.php. [Google Scholar]
20. B. Goyal, A. Dogra, S. Agrawal and B. S. Sohi, “Two-dimensional gray scale image denoising via morphological operations in NSST domain & bitonic filtering,” Future Generation Computer Systems, vol. 82, pp. 158–175, 2018. [Google Scholar]
 | This work is licensed under a Creative Commons Attribution 4.0 International License, which permits unrestricted use, distribution, and reproduction in any medium, provided the original work is properly cited. |