DOI:10.32604/cmc.2022.024698
| Computers, Materials & Continua DOI:10.32604/cmc.2022.024698 | |
| Article |
A Novel Deep Learning Based Healthcare Model for COVID-19 Pandemic Stress Analysis
1Computer Science and Engineering, Women Institute of Technology, Uttarakhand-248007, India
2Chitkara University Institute of Engineering and Technology, Chitkara University, Punjab, India
3Research and Innovation, Uttranchal University, Dehradun, Uttrakhand, 248007, India
4Department of Computer Science & IT, MJP Rohilkhand University, Bareilly, 236006, UP, India
5Computer Science and Engineering, Lovely Professional University, Punjab, 144411, India
6Higher Polytechnic School, Universidad Europea del Atlántico, 39011, Santander, Spain
7Faculty of Computing and Information Technology, King Abdulaziz University, 37848, Jeddah, Saudi Arabia
8Universidad Internacional Iberoamericana, Campeche, Mexico
9Universidade Internacional do Cuanza Bairro Kaluanda, EN 250, Cuito, Bié. Angola
*Corresponding Author: Divya Anand. Email: divyaanand.y@gmail.com
Received: 28 October 2021; Accepted: 14 January 2022
Abstract: Coronavirus (COVID-19) has impacted nearly every person across the globe either in terms of losses of life or as of lockdown. The current coronavirus (COVID-19) pandemic is a rare/special situation where people can express their feelings on Internet-based social networks. Social media is emerging as the biggest platform in recent years where people spend most of their time expressing themselves and their emotions. This research is based on gathering data from Twitter and analyzing the behavior of the people during the COVID-19 lockdown. The research is based on the logic expressed by people in this perspective and emotions for the suffering of COVID-19 and lockdown. In this research, we have used a Long Short-Term Memory (LSTM) network model with Convolutional Neural Network using Keras python deep-learning library to determine whether social media platform users are depressed in terms of positive, negative, or neutral emotional out bust based on their Twitter posts. The results showed that the model has 88.14% accuracy (representation of the correct prediction over the test dataset) after 10 epochs which most tweets showed had neutral polarity. The evaluation shows interesting results in positive (1), negative (–1), and neutral (0) emotions through different visualization.
Keywords: COVID-19; lockdown; stress analysis; depression analysis; sentiment analysis; social media; COVID-19 twitter dataset; coronavirus
Depression is a mental illness that is the leading cause of disability worldwide. Almost 264 million people of all age groups suffer from mental disorders as per the World Health Organization (WHO) data (CSSE at Johns Hopkins University (accessed April 4, 2020) [1,2]. Furthermore, the WHO has defined a human health issue as “health is a state of complete physical, mental and social well-being, not just illness or disability” [2]. COVID-19 pandemic has caused incredible distress and disruption in the life of people by affecting work, school, Family, economy, and emotional exercises among others. In the most pessimistic scenario, it can lead to suicide, which causes about 1 million deaths annually. In Latin America, there is a high rate of emotional well-being in the newborn and young population. Approximately 20% of the population requires intervention from the welfare administration; however, this number does not decrease due to the youth’s own problems covering and defining access to structures and lack of certainty. Depression is one of the states of mental illness that usually misses the repetitive discomfort and loss of enthusiasm for satisfaction in positive parts of life. This causes extreme cases of exhaustion, failure in everyday exercise, indicating a dynamic loss of personal satisfaction. The global pandemic coronavirus has made a similar impression since February 2020. This outbreak has caused a great impact on the economic situation, material welfare, and industry sector, etc., and has also largely affected the daily routine of the people worldwide. This has made a real impact on the mental state of people around the world which is a major outcome of this pandemic to study the impact on the mental state of people around the world. Among other possible systems of capturing human emotions, one is a stand-up substance which they post through web-based networking media sites such as Twitter, Instagram, and Facebook. Not surprisingly, online networking is at a high capacity with a bunch of data on coronaviruses that reflect the realities, fears, numbers, and general contemplations that overwhelm individuals’ psyches in today’s scenario of COVID-19. The main source of motivation of this study is an attempt to find out the origin of mental problems caused by people due to corona, which also helps in a new way to find out from the people their expression on Twitter. This research paper is an effort towards examining the current textual substance posted by individuals' views through web-based networked media specifically Twitter data. Two techniques of machine learning have been used to statistically interpret text messages posted on Twitter; First-word frequency analysis and secondary analysis of the state of depression categorized based on positive, negative, and neutral emotion. The main contributions of this research paper are as follows.
• The aim of this research is to select social networking platforms with a high volume of users used during the COVID-19 pandemic. As well as collecting data, clearing data, and extracting textual information from raw data that supports the analysis of users’ attitudes and sentiments during the lockdown.
• The next objective is to apply LSTM + CNN deep learning ensemble technology to classify COVID-19 based sentiment-based text features. Because the combination of LSTM + CNN layout features helps to improve classification.
• The aim of this work is to apply the ensemble technique to text information to understand whether users of social media platforms are depressed in the context of positive, negative and neutral emotions.
The paper is organized in such a way that Section 2 of the paper focuses on the work done on User Emotion Analysis based on users’ interactions on social media platforms. Section 3 covers the material and proposed methodological background along with detailed mathematical logical implementation. Section 4 covers a discussion of how to apply the build model to a cleaned text information dataset to train, validate, and test the model’s accuracy. The final Section 5 presents the conclusions and future directions of the proposed model.
Depression can be noticed by paying little attention to various parameters like age, gender, financial and educational status, etc., and can provide the necessary information regarding manifestations changes in the sentiments. Mendoza, L., perform their study for analyzing the depressive symptoms in schoolchildren aged 8 to 11 [3,4]. In their study, they found that depression is associated with factors like age, gender, grade, etc. In their study, they found that there is a need for more attention and investigation to change the sentiments of these children to overcome depression. De Choudhury uses two types of techniques for the collection of data from the online platform to identify depression using Twitter data [5]. They develop a probabilistic model to extract the sentiments from the posts on social media platforms. They characterize the level of depression using the social media depression index parameter. Coppersmith, G., focuses their research on sentiment analysis on post-traumatic stress disorder (PTSD) [6]. They proposed a novel method for obtaining a PTSD classifier for Twitter data. They analyze the difference in the use of language between PTSD and random individuals for formulating their results. Veientlena, S., focus their research on analyzing hypertension in rural areas. The data was collected using a door-to-door survey in the village [7].
This data is related to demographics and anthropometric measures. They use a binary logistic regression model for finding the potential hazard factor of hypertension. The study finds that the predicted risk factors for hypertension are level of education, occupation, and family history. Reece A. G., in their research, estimates the progression of depression in post-traumatic stress disorder over internet users by building a computational model [8]. In this research, the author gathered data from Twitter about the tragic story and subtleties of 204 people that includes 105 discouraged and 99 physical and mental health. Through the computational model, the author differentiated past prediction aspects that differentiate influence, etymological way, and the environment from predictive tweets (n = 279,951). The researcher processed with supervised learning algorithms with each of these highlighted features to assemble the model. Well-separated models were developed between users who posted positive content and those who had negative content. The models yield results in any case when the research on already published tweets was conducted before primary depression was analyzed. They replicated the predicted results with an autonomous example of clients destined for PTSD. The research proposed strategy is an information-based prediction method for the early detection of melancholy. The web-based networks model proposed using a lexicon-based methodology to break assumptions from comments posted through the media. The proposed approach focus on subjective information received from Facebook. The author’s essential focus was to sort the comments as positive, negative, or objective, which help in providing the right proportion of views from different priorities related to the posts. The proposed work also helps in securing social network sites, like Facebook.
The investigation of social networking associations and ideas/messages of individuals on various subjects have been considered and researched in the study. A large number of people regularly give their opinion on various topics through web-based network media such as Facebook, Twitter, Instagram, etc [9]. It has many applications in various research fields from sociology to business or on policy deciding. This research section presents the details of the data collection process and the analysis technique that was performed on the Twitter dataset from January 2020 to March 2020, during this time people expressed their views and has spoken about COVID-19 outbreaks in China as well in other countries.
According to the statista [10] (social media/e-commerce statistical analysis), Twitter (nowadays is one of the popular social media), in February 2020 it handles over 300+ million accounts. Twitter is a rich source to learn about people’s opinions and sentiment analysis [11]. Each tweet is important to determine the sentiment of the individual whether it represent positive, negative, or neutral emotion. The biggest challenge with Twitter posts is that each post has its own 140-character limit that causes people to use a phrase and short words that do not get into the part of normal language processing.
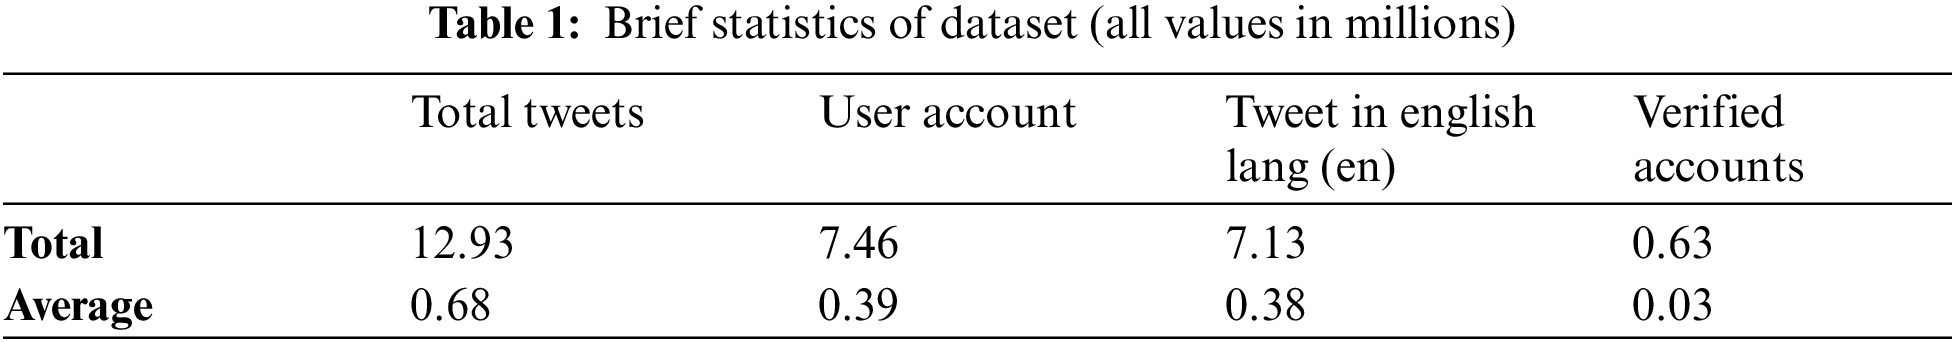
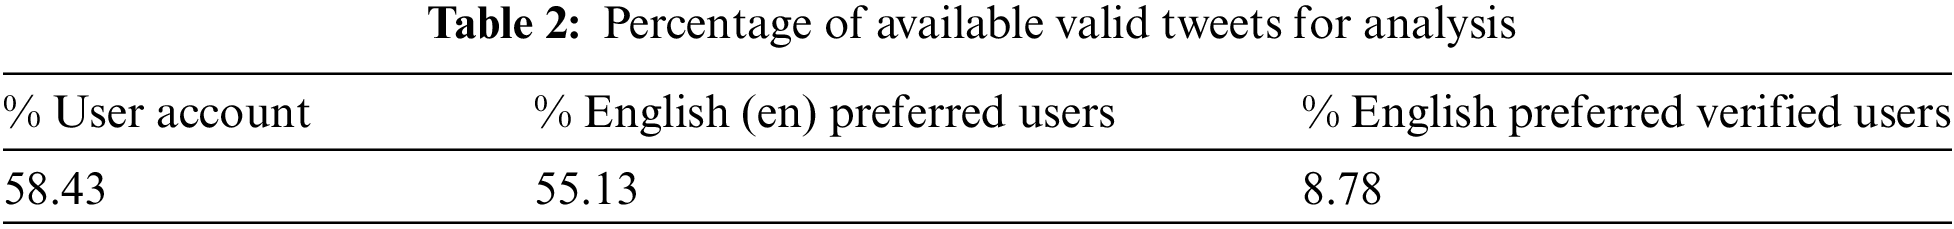
Recently Twitter has increased the text limits for each tweet to 280-characters, which would be highly helpful in analyzing the feelings of a tweet and determining its polarity. Recently [12] published a partially clean publicly accessible dataset about word frequency corresponding to twitter posts. The data source indicates that there were more than 4 million tweets a day, with an increase in coronavirus awareness from March 11th to March 30th, 2020. Brief statistics of the presented data used in Tabs. 1 and 2. The full dataset collected from kaggle [13] (accessed April 4, 2020) (publically available) that contains all twitter posted data worldwide with the hashtag’s keywords presented in Tab. 3. The data prominently captures the tweets in English, Spanish, French, and German, etc. languages between March 12th–30th, 2020. For this research we have considered English-language tweets have been considered which are posted on 10 alternate days.
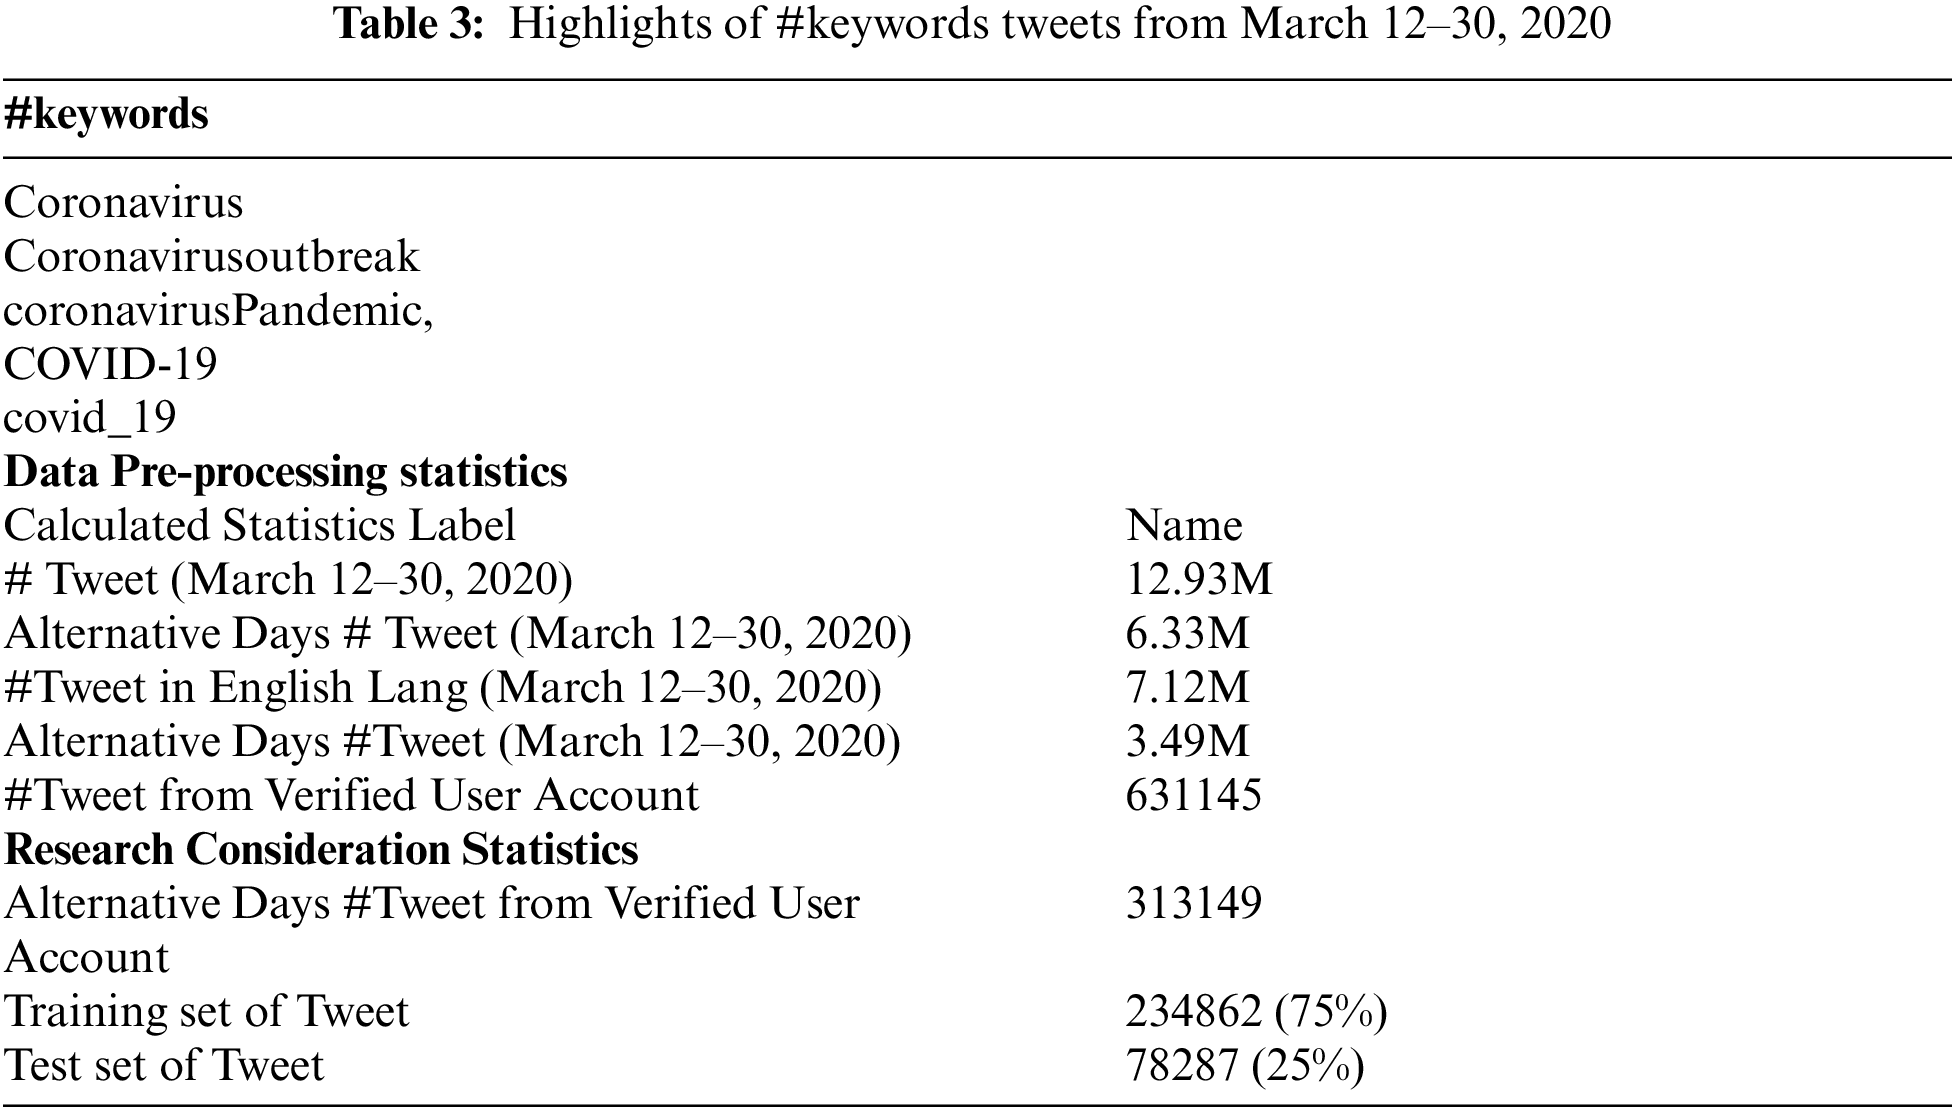
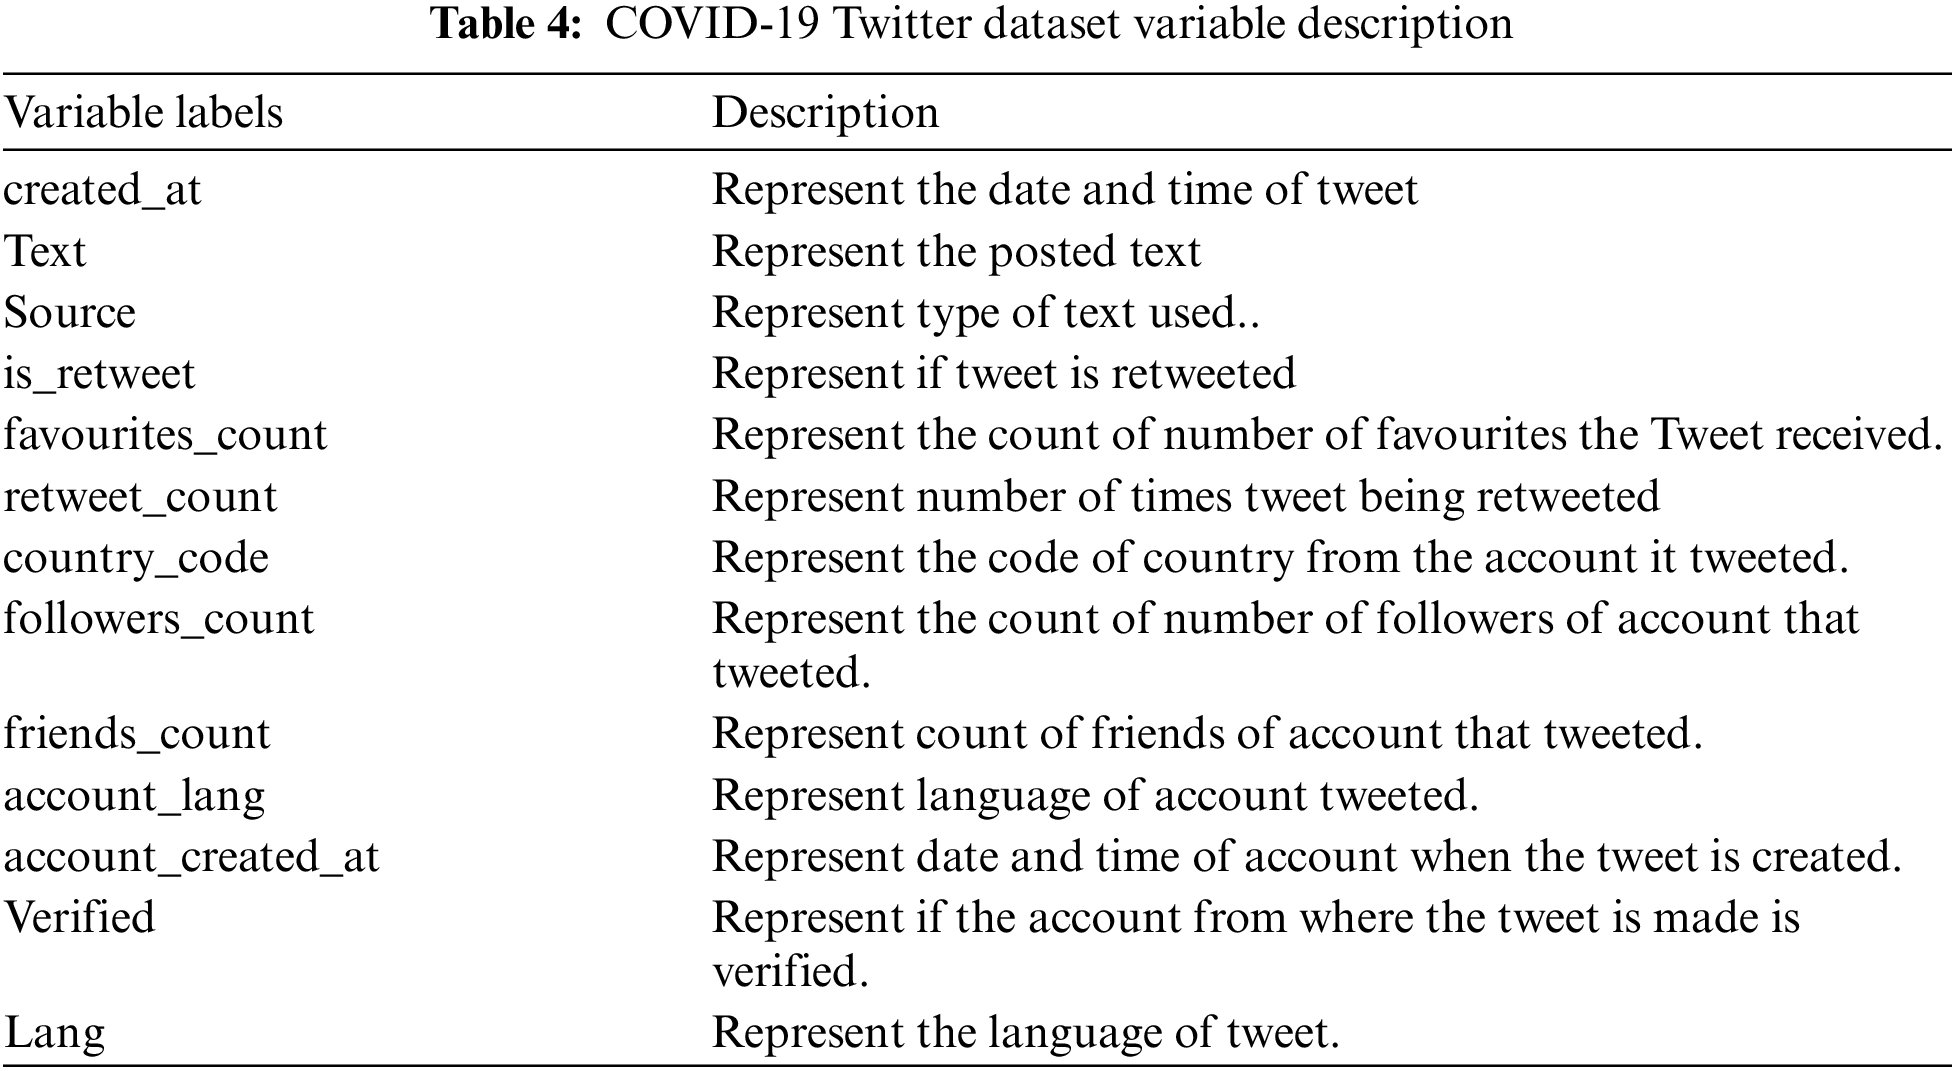
We had taken the dataset for our research from sum total of two different dataset where one dataset is a general word frequency corresponding to twitter posts whereas the other dataset is general twitter sentiment dataset obtained from Kaggle. The important variables used in dataset are described as below Tab. 4.
Text information from Twitter data was included in this research as a major source of information. The texts included were initially completely unstructured and messy. Data preprocessing provides a way for us to analyze, modify structural information, and put the information into a well-structured format so that the data can be adequately modeled when building a model (Tab. 5). Through the application of data preprocessing, we previously prepared the textual information extracted from the raw data into json format, which provides the corresponding form of the data to be processed with the model. The operations performed during this data preprocessing are summarized in two steps known as file conversion and data normalization.
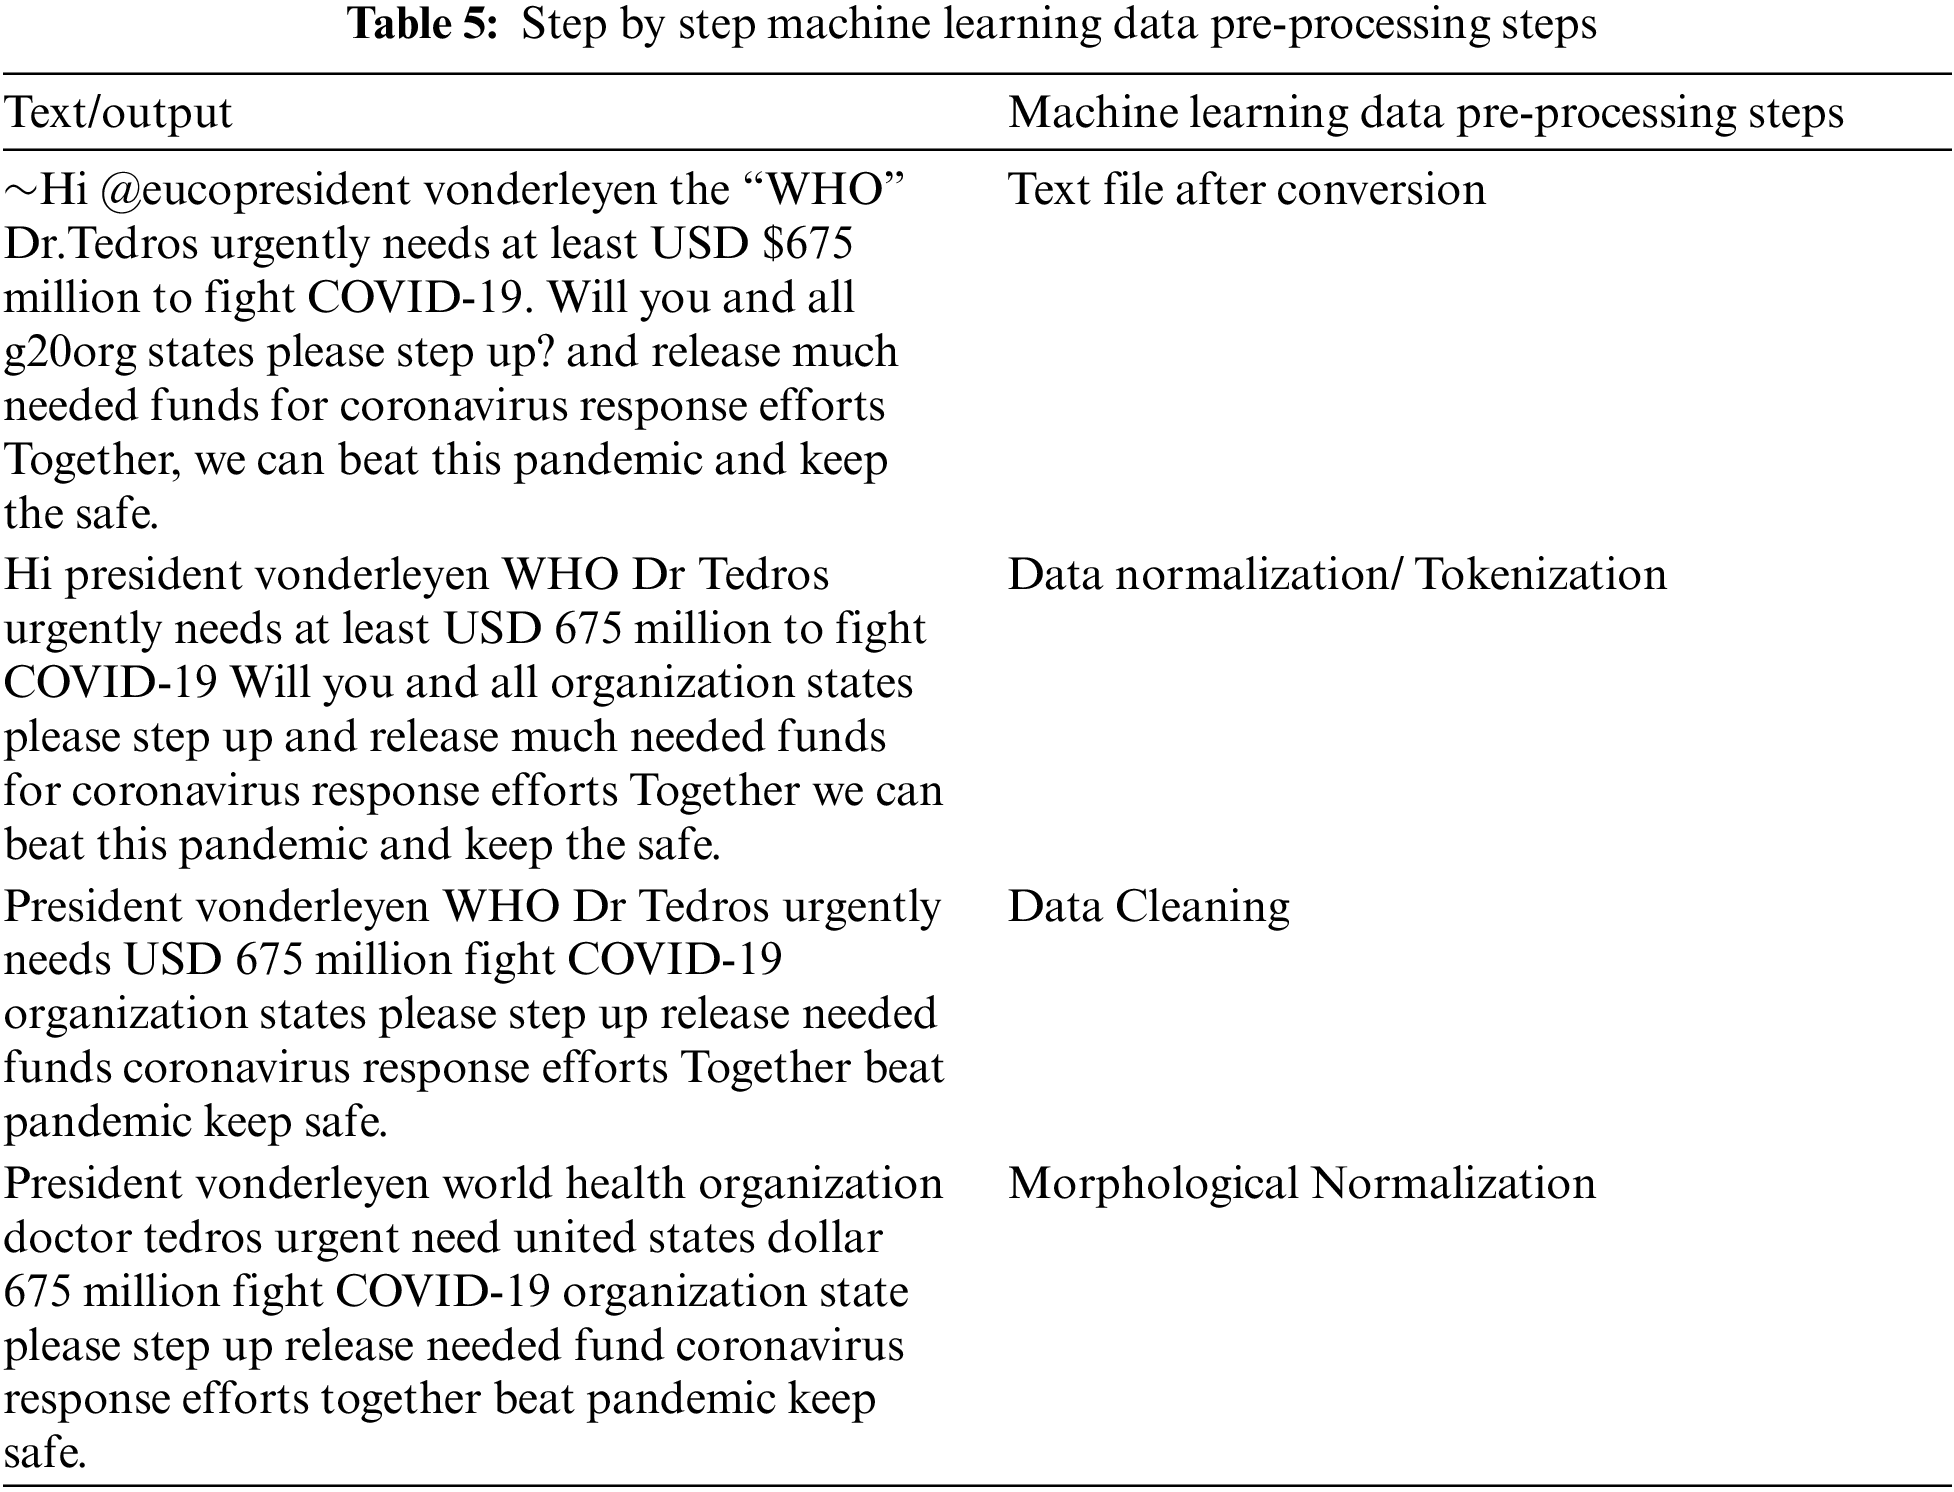
The formulated json data value of utf-8 encoding is converted into ASCII format during this file conversion phase. This format provides functionality to eliminate all Unicode exceptional symbols that are of no use during the sentiment analysis process. This newly modified form of data is now parsed, and keys are selected with only respect values, such as created_at, text, source, retweet_count, country_code, and lang. Finally, the values of this parsed data are saved as a comma-separated value (CSV) formatted documents for the examination purposes of the data.
During natural language processing, text information follows the inheritance nature of its creator randomness, which means that text information has random positions. Computer systems themselves are not so capable of dealing with text randomness. Therefore, data normalization tries to reduce the randomness existing in the text information during the data pre-processing phase. Data normalization helps to bring the text closer to a model predefined standard. Additionally, it helps to fetch the morpheme (root form of the word or tokens). A word consists of two components named morpheme and inflection (may be attached to a prefix or suffix of the word), for example, the word “antinationalist” is further subdivided as “anti + national + ist”, which it considers ‘anti’ and ‘ist’ as inflections, while ‘national’ considers as a morpheme. This step helps the model to reduce the amount of different information, thereby improving the efficiency of the model.
The raw dataset consists of a collection of characters and a quality declaration unit that supports composing statements. Tokenization is the process of cleaving these composed statements into pieces or smaller units, known as tokens. For example, tokens can contain words, characters, numbers, symbols, or n-grams. Unigram tokenization is one of the most common tokenization processes, also known as whitespace tokenization. With the use of unigram tokenization, the statement can be split down into different words that separate those words through a whitespace character, for example, the sentence, “Research on sentiment analysis” can be split into unigrams as ‘Research’, ‘on’, ‘sentiment’, ‘analysis’, etc. In social networking platforms, applications users omit certain characters/words together, for example, the expression, (‘u’ suggests ‘you’, and so forth). Commonly there are two types of tokens that have been used in the process of data normalization.
• Word Tokenization: The process of separating unusual space characters between words as a base is called word tokenization. Depending on the application, to quote New York, well-known antiquated words may be tokenized together. This process is continuously linked to a cyclic process called the eponymous element appreciation.
• Sentence Tokenization or Segmentation: Sentence segmentation is used to decide where the sentence begins and ends. Thereby giving the processing model a complete unit of words called a sentence. Along with word tokenization, segmentation of the sentences is vital for advance in content readiness. This is typically done based on pronunciation, for instance “#”, “.”, “,?”, “!” overall they will print the limits of the sentence.
The overhauled information from the past phases remembers data for ASCII with a lot of gibberish content as Unicode transformed on uncommon tweet labels that transformed into ASCII. Different kinds of images, for example, fight signs; complements, numerals, luxurious characters, and so forth were ousted. Subsequent to barring these properties, it was noticed that a few tweets had invalid credits, which were avoided. In like manner, during this advancement, the substance association was ousted much further and all words were decreased.
3.3.2.3 Text Conversion into Lowercase
Due to the different ASCII values, computer systems often treat all upper- and lower-case characters as different from their equivalents. Due to which there may be problems in understanding the words in the system. So, to overcome this issue we need to convert all text information into lowercase. For example, ‘COVID’, ‘covid’, and ‘Covid’ denote the same word information.
Variation in spelling can cause problems in the process of analyzing text because the system treats all the different spellings as separate words rather than referring to the same thing. Word substitution, therefore, provides a way to deal with this issue by choosing a single spelling and replacing another variant in the text information with that variant.
3.3.2.5 Part of Speech (POS) Tagging
POS tagging is used to provide precise settings to text information. Text is often referred to as volatile data. As a machine concern treating text information as a mere collection of characters does not make sense [14,15]. While understanding any sentence we can check the setting of that sentence that words or tokens are used in their orderly manner.
Consistently, there are several omnipresent words that, as per all clarifications, appear to be a little motivator for the guide inspiration driving the assessment of individual emotions, despite the fact that they increment the elements of the rundown of capacities, they are totally under Receiver Operation Characteristics (ROC) like are prohibited by Stop-word extraction measure [16,17]. When in doubt, there are two contemplations that drive this extraction.
• Irrelevance: This permits the model to break just those words that contain content. Stop-words are likewise called clear words, as they are by and large not vital, they are stunning in the assessment/visualization measure.
• Dimensions: Eliminating the stop-words likewise essentially permit lessening tokens in documents and, in this sense, diminishing the estimation of components.
Consequently, the specialists utilized the TM library where reference likewise various words to stop words, which are the most every now and again utilized words. Since the abrogation of all stop words would deliver the downturn test futile, all sure and negative words utilized recurrence will become ‘stop words. The stop word joined the specific circumstance and summation of the positive words picked that is the reason. The utilization of adventure just ensures the words are stopped and others are kept which as well can be used to test of misery.
3.3.2.7 Text Normalization through Morphological Technique
According to the rules of grammar, morphology is such a means of examining words, by which the full importance of words can be understood even if there is a minor important unit in the words. By this, an important relationship is discovered in the scattered words which are developed by the morpheme. As an example, ‘diseases’ contain two morphemes like ‘disease’ and ‘s’.
Two strategies are commonly used to completely standardize the conversion process of these words.
• Stemming: This strategy is usually very useful in word translation in which the important stem of each word is separated and used in place of its actual word by which a precise word is identified.
• Lemmatization: This is also a very important technique in word translation, in which the jargon of words commonly used in conversation is used to transform. In this technique, the stem of words that are usually hidden during conversation is tried to be exposed again through word expansion through their lexical basis.
3.3.2.8 Calculation behind Polarity Computation
Usually, each word of each sentence has its own significant contribution through which the positives and negatives of that sentence can be checked. Each word of the sentence is checked for positive, negative, and neutral through the polarity calculation of words [18]. This is followed by combining all the positive, negative, and neutral words to separate the arranged words. Finally, considering the positive, negative, and neutral words examined, the class of extremes is chosen by the algorithm, which helps to refer to the spirit of the sentence. Using this technique, natural language experts have conducted a variety of specialized prudence tests on tweets for various purposes, among which the results derived by Wang et al. [19] are highly appreciable that performed over a real-time sentiment analysis over the Twitter values on coronavirus. This paper shows a significant level of intensive exam calculation. As can be found in the algorithm, analysts have various techniques for connecting the Twitter API.
In this paper, during the examination, a convolutional neural network (CNN) along with long short-term memory (LSTM) model has been used as presented in Fig. 1. In the first phase, word vectors have been generated from a huge corpus using the word2vec toolbox available in the python environment. For all accepted text values, the regional CNN model used the sentences as the locale to separate and additionally distribute the given content into different regions. Once the vector of words continuously passes through a convolutional layer and a max-pooling layer, in each space, valued successful features have been extracted. Such features that are local (regional) are included sequentially and using LSTM to assemble the vector of text for forecasting.
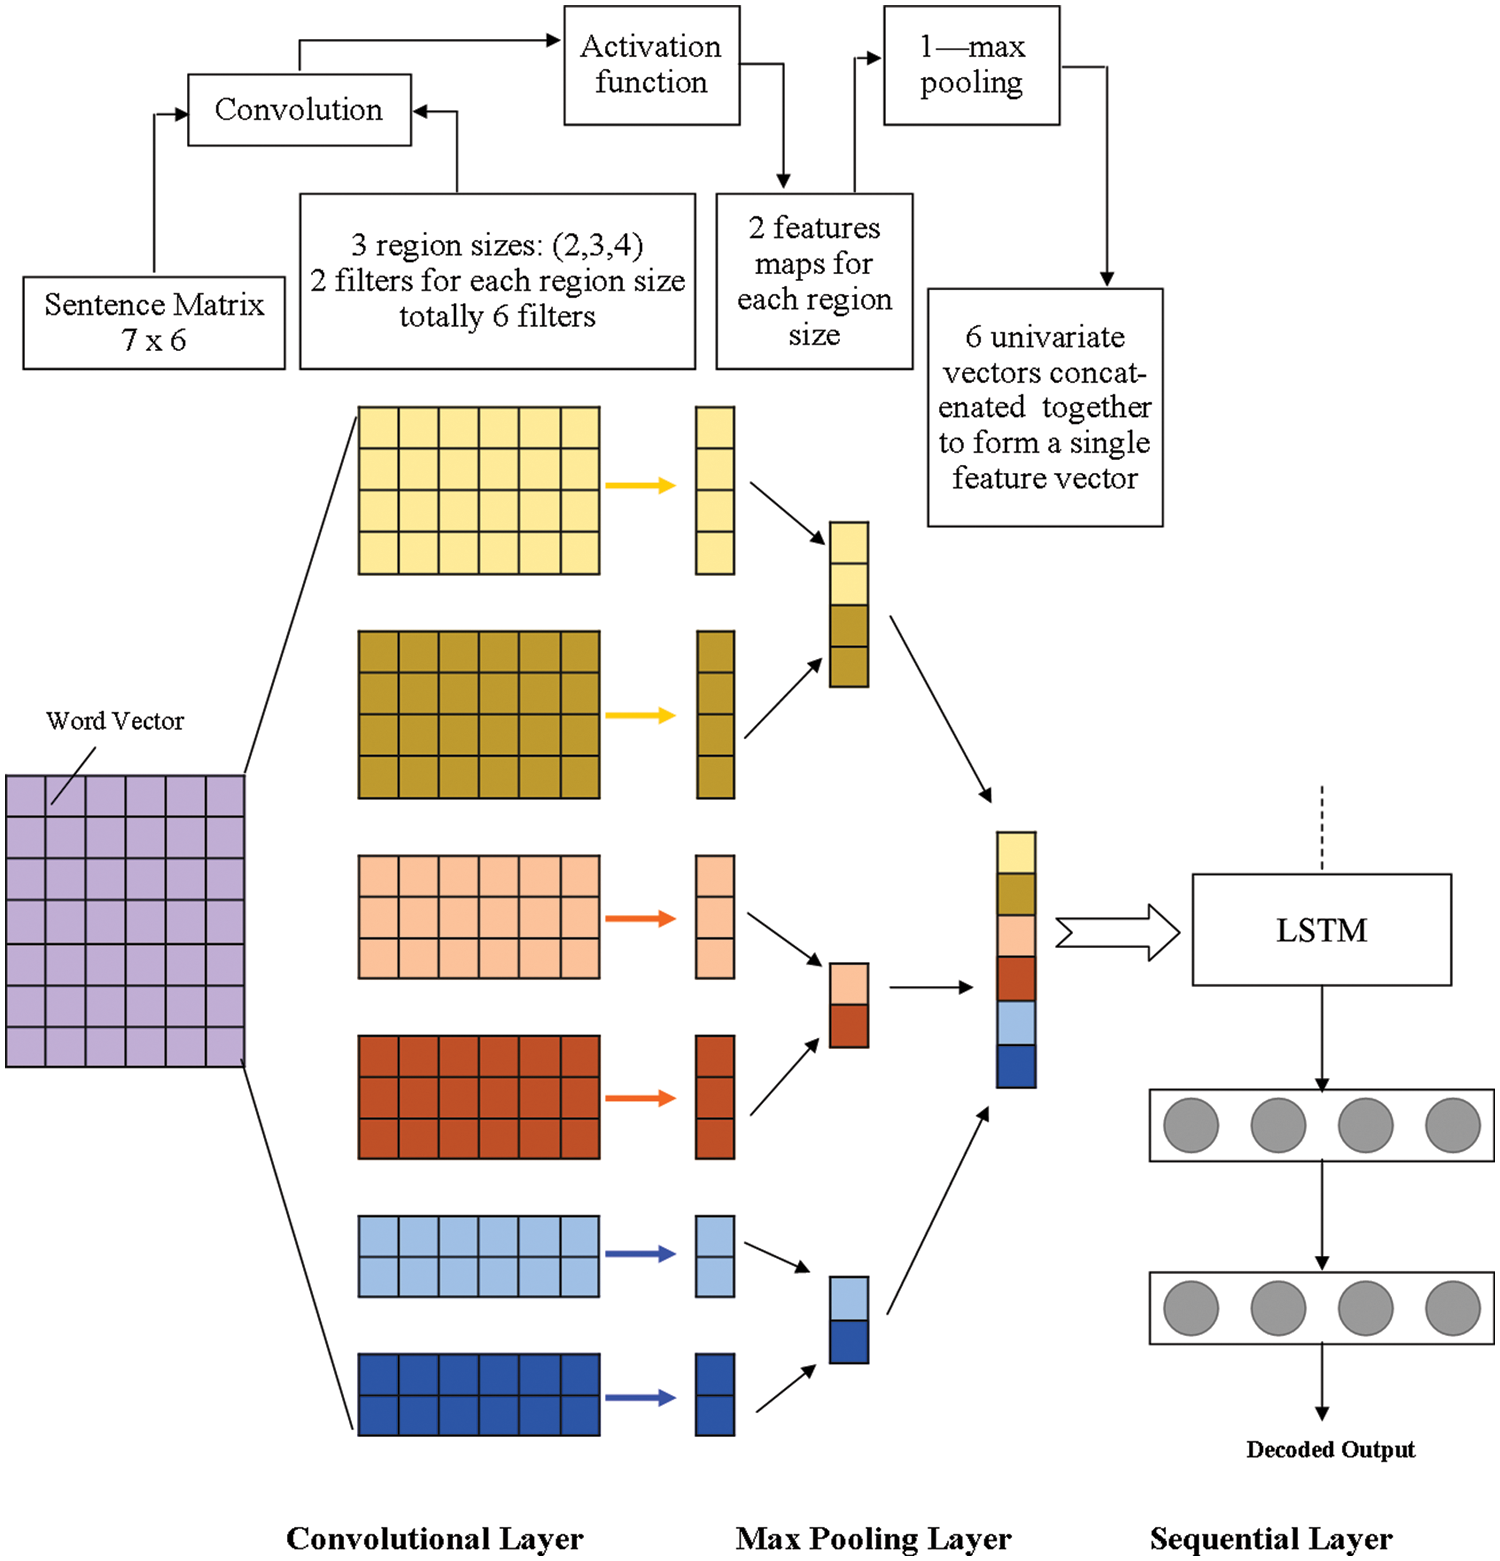
Figure 1: Working model architecture of CNN with LSTM
3.4.1 Convolutional Neural Network
It is a type of deep learning network, which is highly used for modeling the regularized version of multilayer perceptron. A fully connected networking model can be constructed through the use of a multilayer perceptron in which all neurons on a single layer are interconnected with all individual neurons in the next layers. CNN model uses the pattern of data in the form of progressive nature which is capable to solve the complex problem with high accuracy through the use of more unpredictable examples that is conceivable with the uses of different types of filters on the available input data values.
The process of sampling the data output that is computed by the convolutional layer into smaller subsamples is done in the max-pooling layer. The most widely recognized path is to perform pooling to apply maximum activity to the outcome of all individual filters. Two motivations for using the max-pooling layer here. To begin with, it minimizes the computation for the upper layers, by hitting the non-maximized properties. Second, it can eliminate the dependency of neighborhoods within different regions to have the most striking data. Then the found region vectors are carried over to the next sequential layer of the model.
To capture the significant distance dependencies in regions around the word, the sequential layer continuously coordinates with each vector of the region into a vector the text. The issue of slopes disappearing or erupting in RNN Bengio et al. [20], for synthesizing the vectors an LSTM model is presented to the sequential layer. After sequentially navigating the process through all regions of the LSTM memory cell, the last hidden phase of the sequential layer is viewed as the content delineation for expectation.
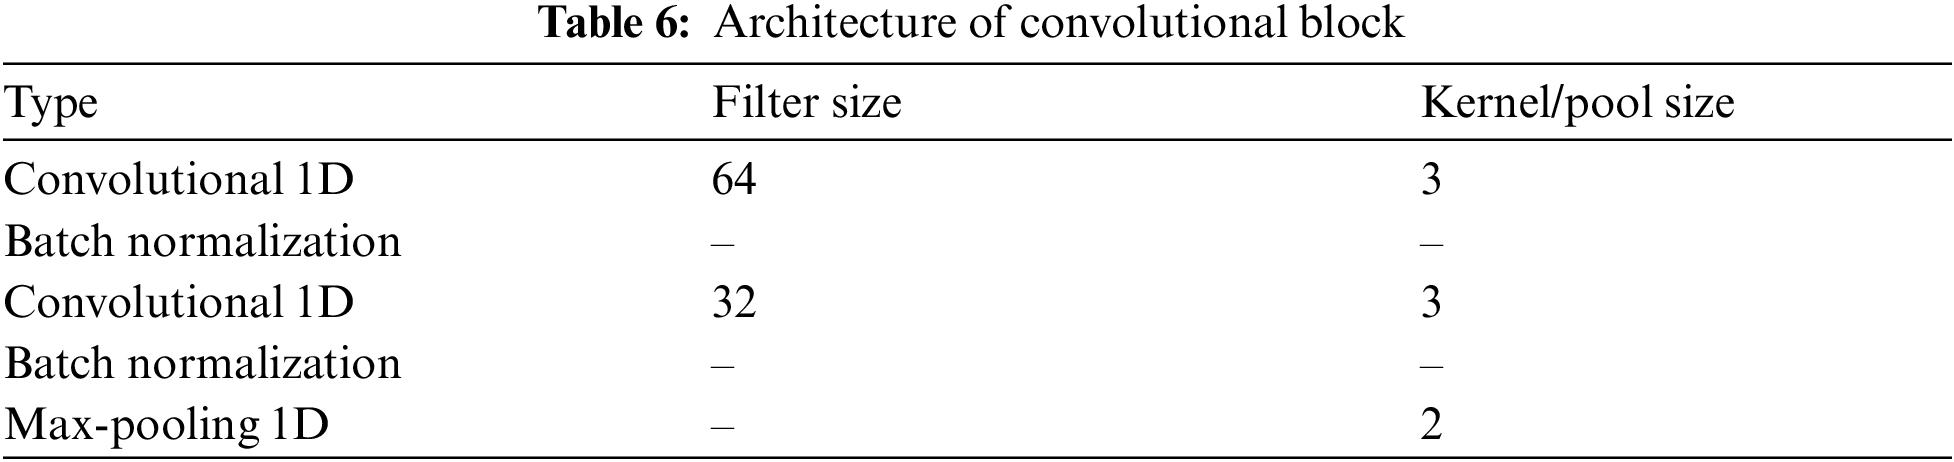
An ensemble technique has been used with CNNs and LSTMs that belong to a class of models consisting of a spatial and transient depth model. Moreover, the CNN+LSTM model is sufficiently suited to be applied to various computer vision tasks, with both sequential inputs and outputs. This ensemble model, as the name suggests, joins CNN layers to perform the extraction of the key information from the available data values and the LSTM layer used to perform the prediction and decision-making process over the CNN layer computed data (as shown in Tab. 6).
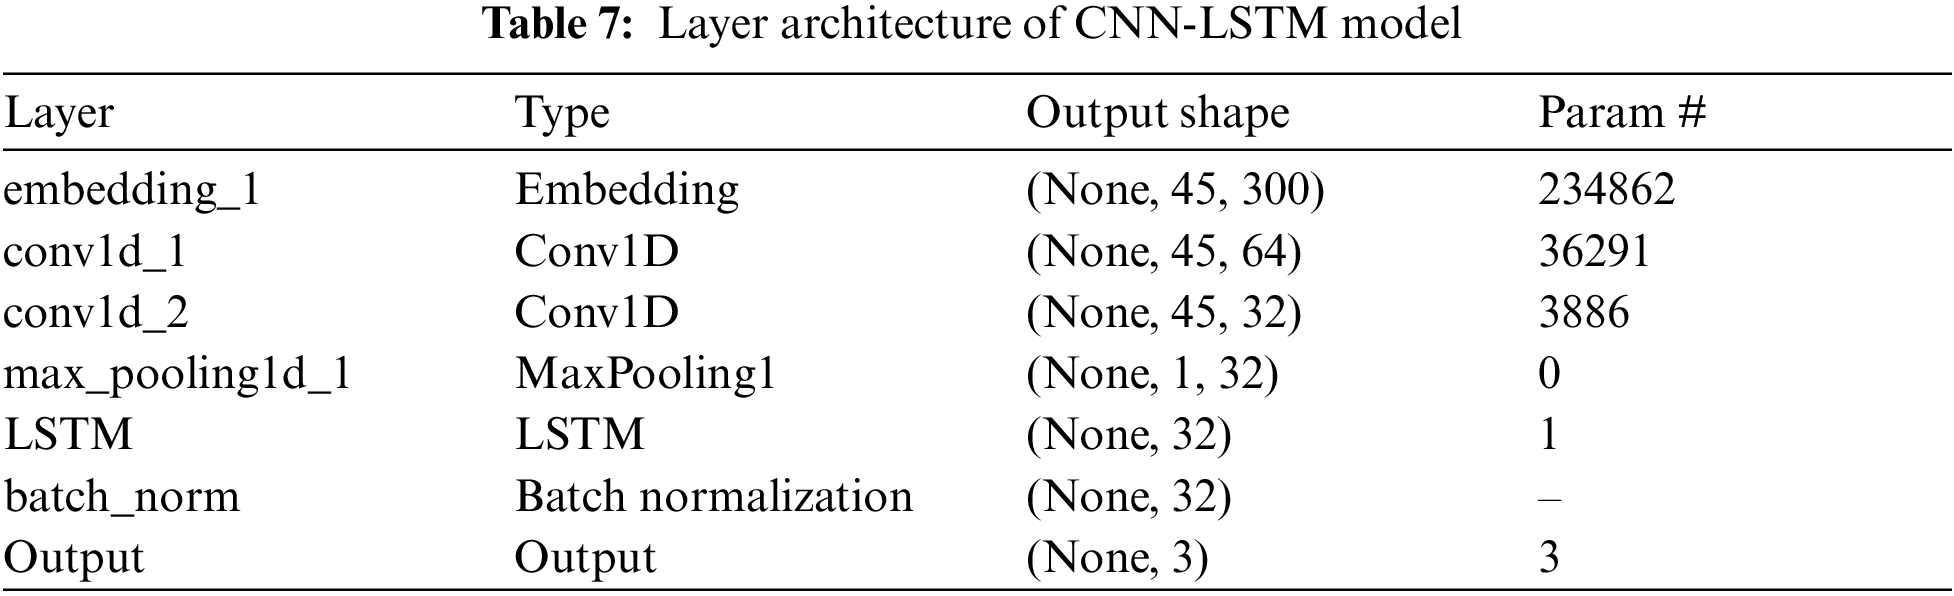
Function embedding is an embedding layer of the CNN model that is used to initialize random weights and that learns embedding from all words in the training dataset. The total vocabulary size in our dataset is 16,872, with an output dim of 300 and a maximum number of 45. As a result, we get a matrix of 45 × 300. In our CNN model, the CNN layer1D (Conv1D) defines a filter whose kernel size is 3. This is used to train 64 different features on the first layer of the network which helps to attain the output of the first neural network layer as a 45 × 64 neuron-sized matrix. This result will be fed into the second CNN layer as learning input.
To train at this level, we define 32 different filters. Like the Conv_1d layer, we get another output matrix of size 40 × 32 here. The maximum pooling layer is being used in the CNN network mostly for reducing the complexity of output and preventing data overfit as the maximum pooling layer used in our model takes a size of 3, which helps to create an output matrix of 1 × 32 neurons. After this, the fully connected layer with Rectified Linear Unit (ReLU) activation function is feed into the LSTM layer which helps to reduce the vector of height 32 to 1 for predicting sentiments as (“positive”, “negative”, “neutral”).
The model used in this approach uses Python 3.8 with Neural Network Library, Keras which provides API for structuring continuous model, where multiple layers of requests are involved for its execution. In our approach for model using of 1D Convolutional Neural Network (CNN) with a Long-Short term memory (LSTM) array model (layer architecture as shown in Tab. 7) is done whereas predefined Google Word2vec devices are used for creating insertion network. In this approach, a corpus of content is taken as information and the word vectors are distributed as the corresponding display. This insertion network is used in the main layer, which is known as the installation layer whereas the back layer is characteristic of the organization of 1D CNN, which uses the initiation function of the rectified reformed unit (relu), which will be used for natural language operations. The next two layers are used for a more complex representation of CNN 1D which sets the size of the cluster as 2 for maximum cluster and a drop of 0.2, as it has the potential to reduce the threshold or reduce the system over-fitting over the model. The following three layers are used to plan LSTM, accepting information measures as 300, due to the components of our predefined word2vec document. It also provides a dropout estimate of 0.2 to avoid over-fitting whereas the thick layer is used for connecting each contribution using particular weight to each display, and the use of a sigmoid enacted function. Thus, the 1D CNN techniques with the LSTM network model can be used for natural language processing to achieve high accuracy rate than traditional classifiers.
A word cloud technique was used to structure and visualize the available dataset as shown in Fig. 2. It is a technique utilized essentially for envisioning text information where the general sizes of the individual words are a sign of their recurrence and significance in the dataset. Considerable text-based information focuses can be featured to utilizing a word cloud. Word cloud applications can go from investigating information from interpersonal organization sites to essentially any reasonable dataset
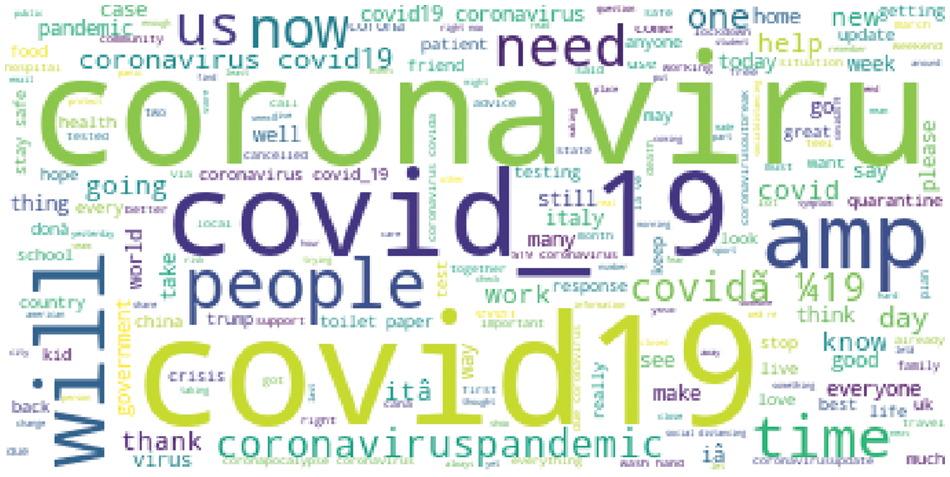
Figure 2: Word cloud for twitter data analysis on COVID-19
The word cloud presented in Fig. 2 focusing the Covid, COVID-19, government, emergency Home, work, school, food, life, stay safe, and so forth are utilized a great deal in the unsettling and spot burdensome tweets. Following the Twitter analysis on the Python environment, the generated graph in Fig. 3 showed reaction having neutral (48.15%), negative (29.27%) and positive (20.75%) emotions on COVID-19 on the Twitter account. After the word cloud analysis, users have started using “#COVID-19, #Coronavirus, #Coronavirusoutbreak, #coronavirusPandemic, etc.” most frequently. The other most frequently used words that represent the neutral emotions by the user includes work, home, school, food, country, life and so on, similarly the positive emotions by the user included hashtag and words like hope, good, best, safe, thank, friend, together, etc. On the other hand, pandemic, crisis, virus, back, need, help, coronavirus pandemics, patient and so on words were among the words used to represent the negative emotions of users. The world cloud graphical representation clearly visualizes a frequently used word with the size and intensity of the phenomena of the word.
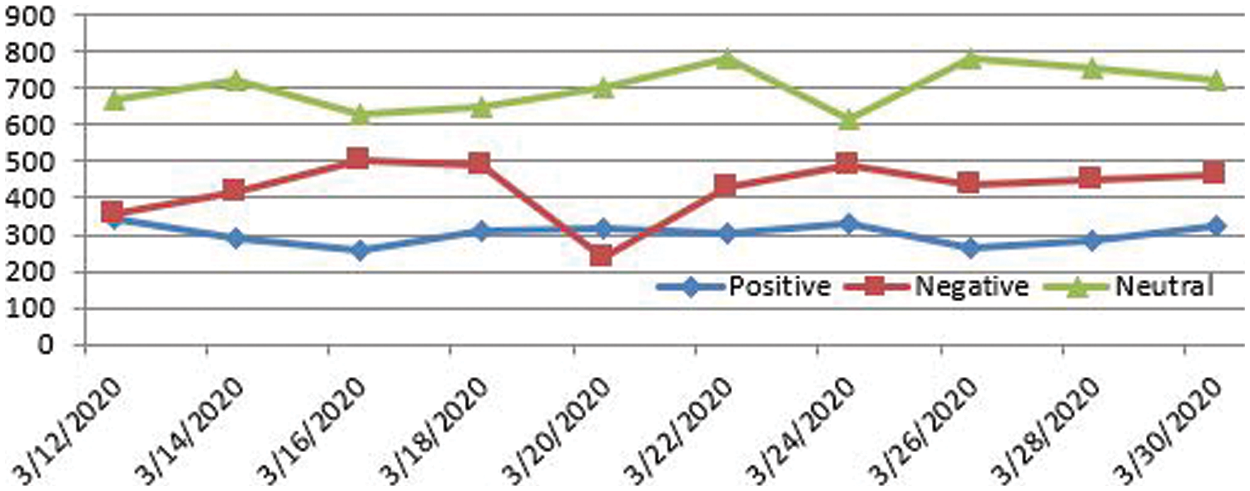
Figure 3: Alternative days sentiment analysis output for #COVID-19 keywords
4.1 Performance Metrics of Model
Quantities analysis of our CNN + LSTM model done with evaluates the confusion matrix as shown in Tab. 8 and Fig. 4 that classify the data into three categories of sentiment includes positive, negative, and neutrals tweet. The accuracy (Acc.), Precision value, Recall value and F1-score are calculated to evaluate the classification report of mental health analysis as presented in Tab. 9. The graph in Fig. 4 represents the precision, recall and F1-score over the text information collected from the dataset and further classified by the CNN and LSTM model into the various emotions. A precision measures of how often a user sentiment rated as correct, which supports that the neutral emotion (i.e.,
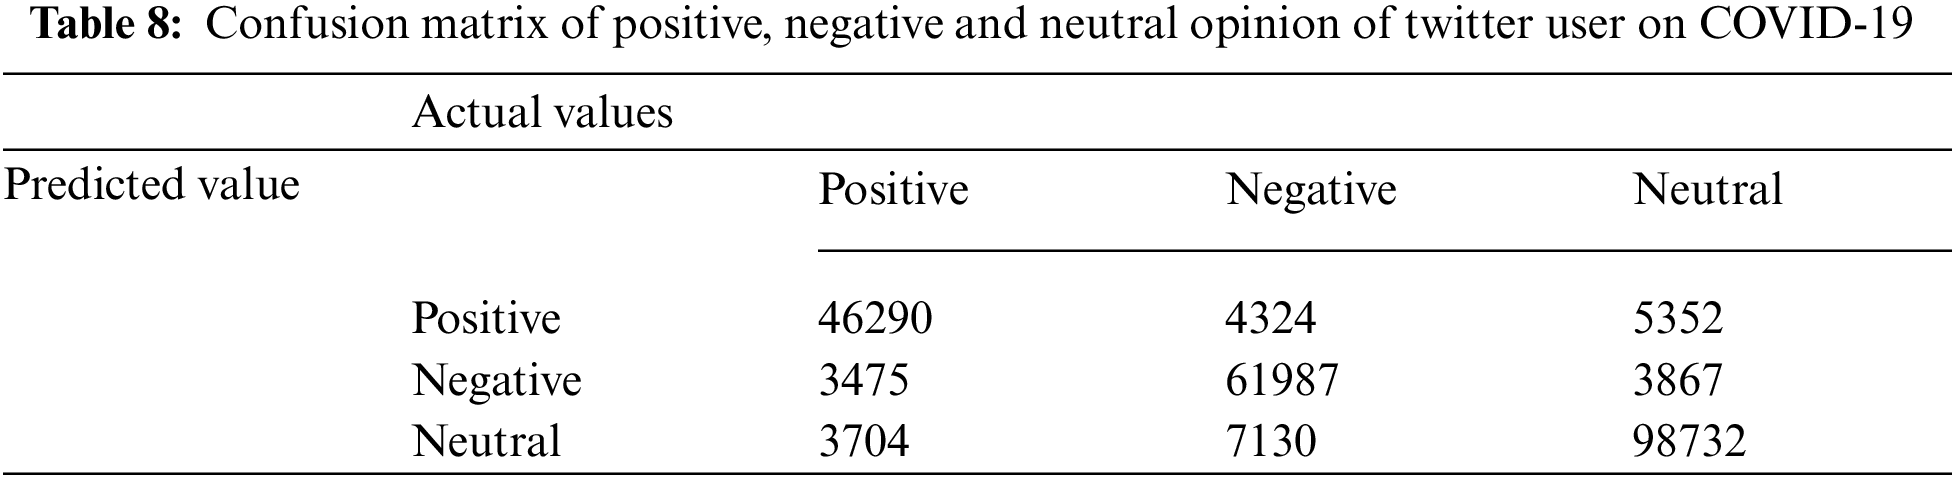
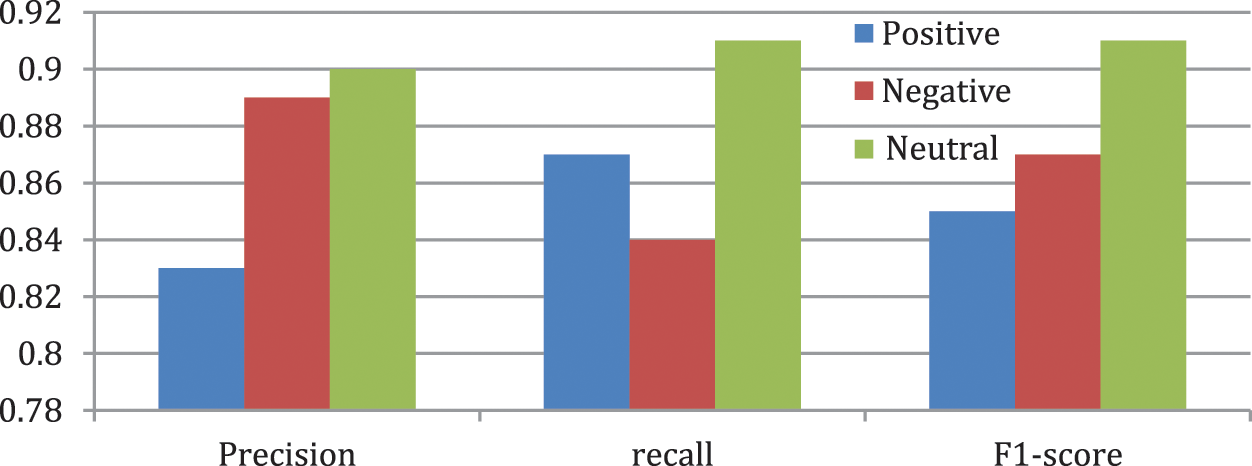
Figure 4: Graph representation of Positive, Negative and Neutral behavior of twitter users on COVID-19 opinion
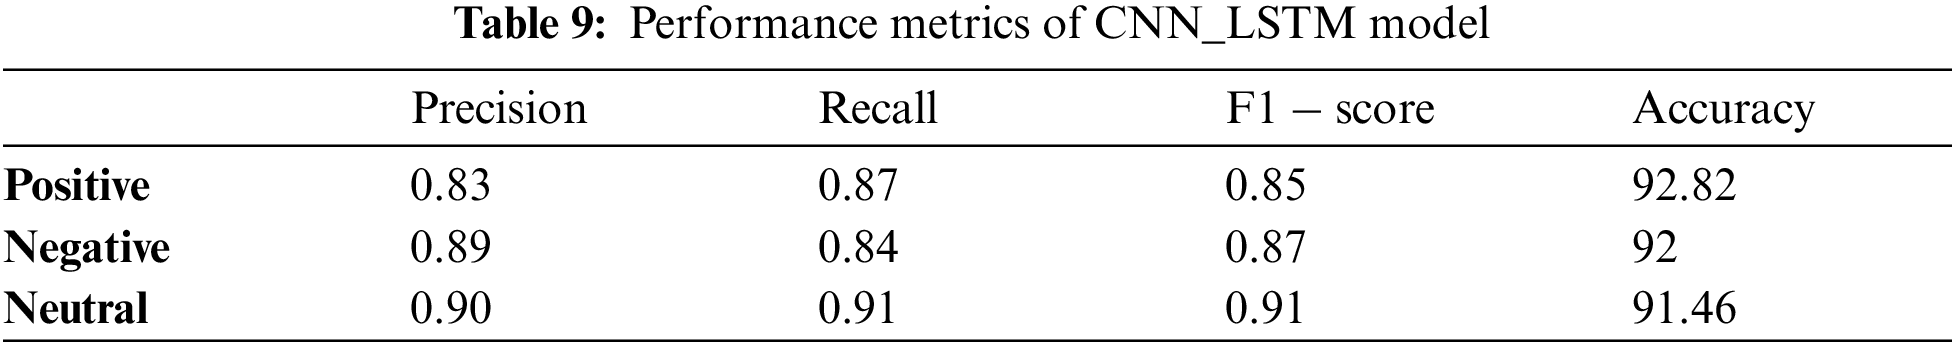
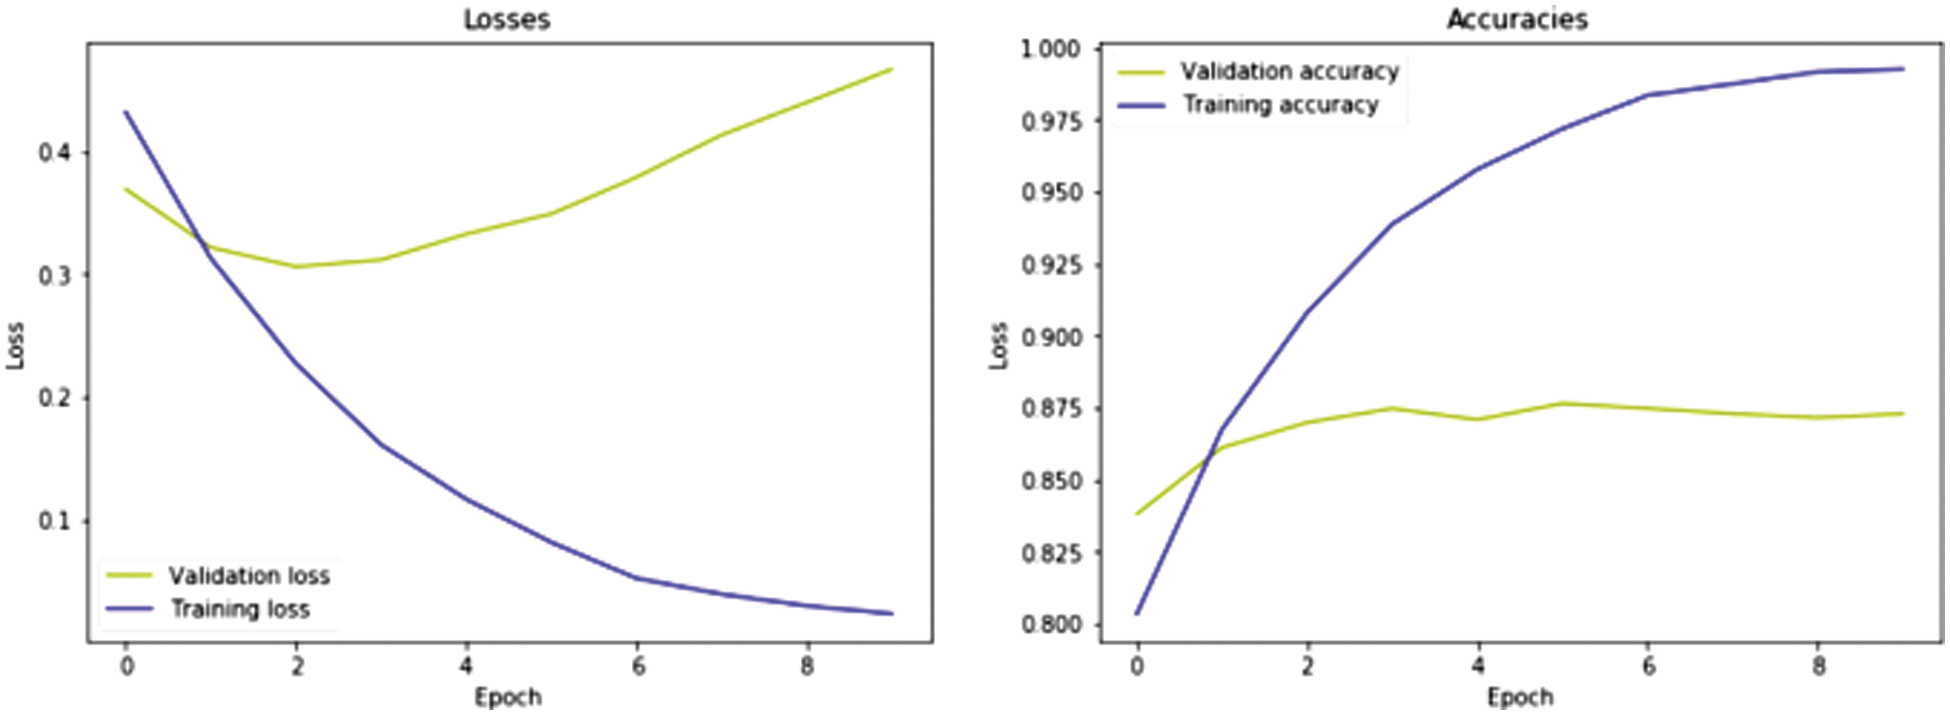
Figure 5: Model losses and accuracy rate after training with several epochs
The research is based on an analysis of opinions on outbreaks of COVID-19 by various users on web-based media (especially Twitter). Many countries around the world are facing a situation of lockdown to follow the core principle of social distance to fight against COVID-19. People are psychologically affected during this lockdown situation, including anxiety, fear, and depression. People spend hours every day on social networking platforms to keep themselves busy and share their thoughts, feelings, and reactions with others. Through this research, we have analyzed the mental health of people during lockdowns based on publicly available tweeter data that contain data from March 12 to March 31, 2020. It is felt that neutral feelings are quite high i.e.,
The data contains information on a large scale that is related to COVID-19 and hence it can be helpful to show several important directions for future work. Because the proportion of Twitter users in the United States is much higher than in other countries of the world like China, Japan, France, India, Italy, etc. Knowing the reaction of the people on social media, the government may pay attention to the needs of the people at the time of policymaking and deciding other various important decisive measures. There is also a large proportion of misinformation on social media, which is still a challenge to understand and filter for both governments as well as for the social media companies, which if achieved can help in controlling the misinformation and fake news circulation. On the other hand, because this epidemic is global, it is important to consider 34+ languages (e.g., Arabic (ar), Danish(da), German(de), Spanish(es), Persian(fa), etc.) and platforms as well. Through this information, a plan can be considered to control the epidemic by analyzing the sentiments about other emerging topics. Apart from studying the impact of public perception, the impact of the epidemic on the daily life of the people will be helpful to measure through work and with more appropriate study and tools.
Acknowledgement: This project was supported by the Deanship of Scientific Research (DSR), King Abdulaziz University, Jeddah, under Grant No. (D-209-830-1443). The authors, therefore, gratefully acknowledge DSR technical and financial support.
Funding Statement: This project was funded by the Deanship of Scientific Research (DSR), King Abdulaziz University, Jeddah, under Grant No. (D-209-830-1443). The authors, therefore, gratefully acknowledge DSR technical and financial support.
Conflicts of Interest: The authors declare that they have no conflicts of interest to report regarding the present study.
1. Johns Hopkins University, “Coronavirus COVID-19 global cases by the center for systems science and engineering,” 2020. [Online]. Available: https://coronavirus.jhu.edu/map.html (accessed September 10, 2021). [Google Scholar]
2. World Health Organization, “Coronavirus disease 2019 (COVID-19Depression,” 2021. [Online]. Available: https://www.who.int/news-room/fact-sheets/detail/depression (accessed September 13, 2021). [Google Scholar]
3. J. Fisher, M. C. D. Mello, V. Patel, A. Rahman, T. Tran et al., “Prevalence and determinants of common perinatal mental disorders in women in low-and lower-middle-income countries: A systematic review,” Bulletin of the World Health Organization, vol. 90, no. 2, pp. 139–149, 2012. [Google Scholar]
4. L. F. M. Mendoza, L. D. P. S. Peinado, L. A. D. Martínez and A. Campo-Arias, “Prevalencia de sintomatología depresiva en niños y niñas escolares de Bucaramanga,” Colombia, Revista Colombiana de Psiquiatría, vol. 33, no. 2, pp. 163–171, 2004. [Google Scholar]
5. M. De Choudhury, S. Counts and E. Horvitz, “Social media as a measurement tool of depression in populations,” in Proc. of the 5th annual ACM Web Science Conf., Paris, France, pp. 47–56, 2013. [Google Scholar]
6. G. Coppersmith, C. Harman and M. Dredze, “Measuring post traumatic stress disorder in Twitter,” in Eighth Int. AAAI Conf. on Weblogs and Social Media, Ann Arbor, Michigan USA, pp. 579–582, 2014. [Google Scholar]
7. J. Kishore, N. Gupta, C. Kohli and N. Kumar, “Prevalence of hypertension and determination of its risk factors in rural Delhi,” International Journal of Hypertension, vol. 2016, no. 8, pp. 7962595, 2016. [Google Scholar]
8. A. G. Reece, A. J. Reagan, K. L. M. Lix, P. S. Dodds, C. M. Danforth et al., “Forecasting the onset and course of mental illness with Twitter data,” Scientific Reports, vol. 7, no. 1, pp. 1–11, 2017. [Google Scholar]
9. A. Pak and P. Paroubek, “Twitter as a corpus for sentiment analysis and opinion mining,” In LREc, Malta, vol. 10, pp. 1320–1326, 2010. [Google Scholar]
10. Leading countries based on number of twitter users, https://www.statista.com/statistics/242606/number-of-active-twitter-users-in-selected-countries/ (accessed July 4, 2021). [Google Scholar]
11. I. Boguslavsky, “Semantic Descriptions for a text understanding system,” in Computational Linguistics and Intellectual Technologies, Papers from the Annual Int. Conf. Dialogue, Moscow, Russia, pp. 14–28, 2017. [Google Scholar]
12. J. M. Banda, R. Tekumalla, G. Wang, J. Yu, T. Liu et al., “A twitterdataset of 100+ million tweets related to COVID-19, March 2020,” This dataset will be updated bi-weekly at least with additional tweets, look at the github repo for these updates. https://github.com/thepanacealab/COVID-19_twitter. [Google Scholar]
13. kaggle, “Coronavirus-COVID-19-tweets,” kaggle, 2020. https://www.kaggle.com/smid80/coronavirus-COVID-19-tweets. [Google Scholar]
14. N. Chintalapudi, G. Battinen and F. Amenta, “Sentimental analysis of COVID-19 tweets using deep learning models,” Infectious Disease Reports, vol. 13, no. 2, pp. 329–339, 2021. [Google Scholar]
15. J. Samuel, G. G. Ali, M. Rahman and E. Esawi, “Covid-19 public sentiment insights and machine learning for tweets classification,” Information-an International Interdisciplinary Journal, vol. 11, no. 6, pp. 314, 2020. [Google Scholar]
16. S. Feng, H. Zhou and H. Dong, “Using deep neural network with small dataset to predict material defects,” Materials & Design, vol. 162, no. 4, pp. 300–310, 2019. [Google Scholar]
17. G. Xu, Y. Meng, X. Qiu, Z. Yu and X. Wu, “Sentiment analysis of comment texts based on BiLSTM,” IEEE Access, vol. 7, pp. 51522–51532, 2019. [Google Scholar]
18. S. S. Aljameel, D. A. Alabbad, N. A. Alzahrani, S. M. Alqarni and F. A. Alamoudi, “A sentiment analysis approach to predict an individual’s awareness of the precautionary procedures to prevent COVID-19 outbreaks in Saudi Arabia,” International Journal of Environmental Research and Public Health, vol. 18, no. 1, pp. 218, 2021. [Google Scholar]
19. H. Wang, D. Can, A. Kazemzadeh, F. Bar and S. Narayanan, “A system for real-time twitter sentiment analysis of 2012 us presidential election cycle,” in Proc. of the ACL, 2012 System Demonstrations, Jeju Island, Korea, pp. 115–120, 2012. [Google Scholar]
20. Y. Bengio, P. Simard and P. Frasconi, “Learning long-term dependencies with gradient descent is difficult,” IEEE Transactions on Neural Networks, vol. 5, no. 2, pp. 157–166, 1994. [Google Scholar]
 | This work is licensed under a Creative Commons Attribution 4.0 International License, which permits unrestricted use, distribution, and reproduction in any medium, provided the original work is properly cited. |