DOI:10.32604/cmc.2022.025577
| Computers, Materials & Continua DOI:10.32604/cmc.2022.025577 | |
| Article |
Intelligent Deep Transfer Learning Based Malaria Parasite Detection and Classification Model Using Biomedical Image
Department of Medical Equipment Technology, College of Applied Medical Sciences, Majmaah University, Al Majmaah, 11952, Saudi Arabia
*Corresponding Author: Mohamed Yacin Sikkandar. Email: m.sikkandar@mu.edu.sa
Received: 29 November 2021; Accepted: 09 February 2022
Abstract: Malaria is a severe disease caused by Plasmodium parasites, which can be detected through blood smear images. The early identification of the disease can effectively reduce the severity rate. Deep learning (DL) models can be widely employed to analyze biomedical images, thereby minimizing the misclassification rate. With this objective, this study developed an intelligent deep-transfer-learning-based malaria parasite detection and classification (IDTL-MPDC) model on blood smear images. The proposed IDTL-MPDC technique aims to effectively determine the presence of malarial parasites in blood smear images. In addition, the IDTL-MPDC technique derives median filtering (MF) as a pre-processing step. In addition, a residual neural network (Res2Net) model was employed for the extraction of feature vectors, and its hyperparameters were optimally adjusted using the differential evolution (DE) algorithm. The k-nearest neighbor (KNN) classifier was used to assign appropriate classes to the blood smear images. The optimal selection of Res2Net hyperparameters by the DE model helps achieve enhanced classification outcomes. A wide range of simulation analyses of the IDTL-MPDC technique are carried out using a benchmark dataset, and its performance seems to be highly accurate (95.86%), highly sensitive (95.82%), highly specific (95.98%), with a high F1 score (95.69%), and high precision (95.86%), and it has been proven to be better than the other existing methods.
Keywords: Computer-aided diagnosis; malaria parasites; biomedical images; blood smear images; deep learning
Malaria is a life-threatening disease caused by the Plasmodium parasite, and is a serious health concern worldwide. According to reports by the World Health Organization (WHO) in 2017, nearly 219 million cases of malaria occurred in 87 countries worldwide [1]. The WHO selected the Eastern Mediterranean, Western Pacific, Americas, and Southeast Asia as high-risk regions. Malaria is curable and can be prevented when appropriate measures and initiatives are effectively taken, which rely mainly on earlier diagnoses of the malaria parasite [2]. Various methods have been reported to detect malarial parasites in the blood, such as microscopic diagnosis, medical diagnosis [3], polymerase chain reaction (PCR), and rapid diagnostic test (RDT) [4].
Traditional diagnostic approaches such as PCR and other clinical diagnostic methods are dependent on experimental settings; eventually, the accuracy and efficiency depend significantly on the purely subjective knowledge of individuals. This limited knowledge is unable to reach remote locations where malaria could be predominant. Microscopic diagnosis and the RDT are effective malaria diagnostic technologies that make a large contribution to malaria control in the present scenario [5]. The RDT is a powerful diagnostic method that does not require any microscope or trained professionals and can offer diagnoses within 15 min. However, the RDT method has some limitations, including the inability to quantify parasite density, low sensitivity, susceptibility to damage by heat and humidity, high cost compared with light microscopy, and inability to differentiate between Plasmodium malariae, P. vivax, and P. ovale. These drawbacks can be overcome by the microscopic system and thus it is categorized as an efficient method to detect malarial parasites but requires the presence of a professional microscopist [6].
Microscopic inspection is considered a primary and typical technique for malaria diagnosis [7] to detect the occurrence of parasites from a blood drop in a thick blood smear. The investigation accuracy is based on an efficient technician examining and classifying the parasitized and uninfected blood cells found in the blood smear. Automated microscopic malaria parasite diagnosis could be a powerful diagnostic method that includes segmentation of cells and classification of infected cells and the acquisition of microscopic blood smear images [8]. It should be noted that the effective identification of malarial parasites and segmentation of blood cells could be utilized to carry out counting.
Conventional methods for malaria diagnosis are time consuming, might create incorrect reports because of human errors, and are not suitable for wide-ranging diagnosis. This motivated us to present an automated diagnosis of malaria using deep-learning (DL) algorithms. Various concepts exist towards the recognition of malaria parasites in microscopic images via a pre-trained variant of a convolutional neural network (CNN) [9,10]. Chakradeo et al. [11] introduced a visual geometry group (VGG)-based approach and compared it with previously presented methods for identifying diseased cells. It exceeds the accuracy of most previously presented methods in a range of metrics. Hence, it reduces the computational time and consumption of technical resources.
Fuhad et al. [12] presented an automatic CNN-based algorithm for malaria detection using microscopic blood smears. This involves different methods, such as data augmentation, knowledge distillation, and feature extraction. An autoencoder is categorized as a support vector machine (SVM) or k-nearest neighbor (KNN). CNN models execute the training process at three levels, autoencoder training, general training, and distillation training, to improve and optimize the inference performance and model accuracy.
Researchers have designed a traditional CNN method to distinguish between infected and healthy blood samples [13]. The proposed method contains fully connected (FC) layers and three convolutional layers. The neural network system proposed a cascade of numerous convolution layers having different filters existing in each layer that produces better accuracy according to the available resources. The method was implemented on various blood sample images to investigate its accuracy.
Li et al. [14] presented a DL method to detect malaria parasites at different levels from blood smears with deep transfer to a graph convolution network (DTGCN). This is the primary application of the graph convolution network (GCN) model for multistage malaria parasite detection in an image. Rahman et al. [15] converted a malaria parasite object recognition dataset to data classification, which makes it the prime malaria classification dataset, and estimated the performance of many advanced deep neural network (DNN) frameworks pre-trained on medical and normal images on this novel dataset. Researchers analyzed the effects of pre-processing and found that a custom architecture, VGG-16, and a residual neural network (ResNet) formed in an earlier study have been employed [16]. The pre-processing method was investigated, which includes comprehensive normalization and gray-world normalization.
In this study, we developed an intelligent deep transfer learning-based malaria parasite detection and classification (IDTL-MPDC) model using blood-smear images. In addition, the IDTL-MPDC technique derives median filtering (MF) as a pre-processing step. The Res2Net model was employed for the extraction of feature vectors, and its hyperparameters were optimally adjusted using the differential evolution (DE) algorithm. Furthermore, the KNN classifier was used to assign appropriate classes to the blood smear images. The optimal selection of Res2Net hyperparameters by the DE model helps achieve enhanced classification outcomes. A wide range of simulation analyses of the IDTL-MPDC technique were performed using a benchmark dataset.
In this study, a new IDTL-MPDC technique was developed to effectively determine the presence of malarial parasites using blood smear images. The IDTL-MPDC technique involves various sub-processes, namely, MF-based pre-processing, Res2Net-based feature extraction, DE-based hyperparameter optimization, and KNN-based classification.
2.1 Pre-processing Using the MF Technique
The major drawback of the blood smear image is the poor quality of the image owing to spot noise. Spot noise is a disadvantage because it affects single interpretation and recognition processes and undermines the image quality. Consequently, point refining is a major phase in the recognition, extraction, and analysis of healthcare images. In various effective approaches for removing noise from healthcare images, the MF technique is used because of its specificity, which has applications in healthcare image noise elimination [17]. The basic concept behind the median filter is to introduce an
where C signifies the neighborhood centered around the position
2.2 Feature Extraction Using the Res2Net Model
Next, the pre-processed blood smear image is passed to the Res2Net model to derive the feature vectors. The Res2Net block [18] is different from ResNet, which utilizes many sets of convolution functions and concepts of hierarchical influences in a single remaining block. It is distinct from the multi-scale feature removal techniques that use a layer-wise approach, as the Res2Net block removes multi-scale features at the granular level and improves the range of receptive domains of every convolution layer.
As illustrated in Fig. 1, an input is primarily referred to as a group of
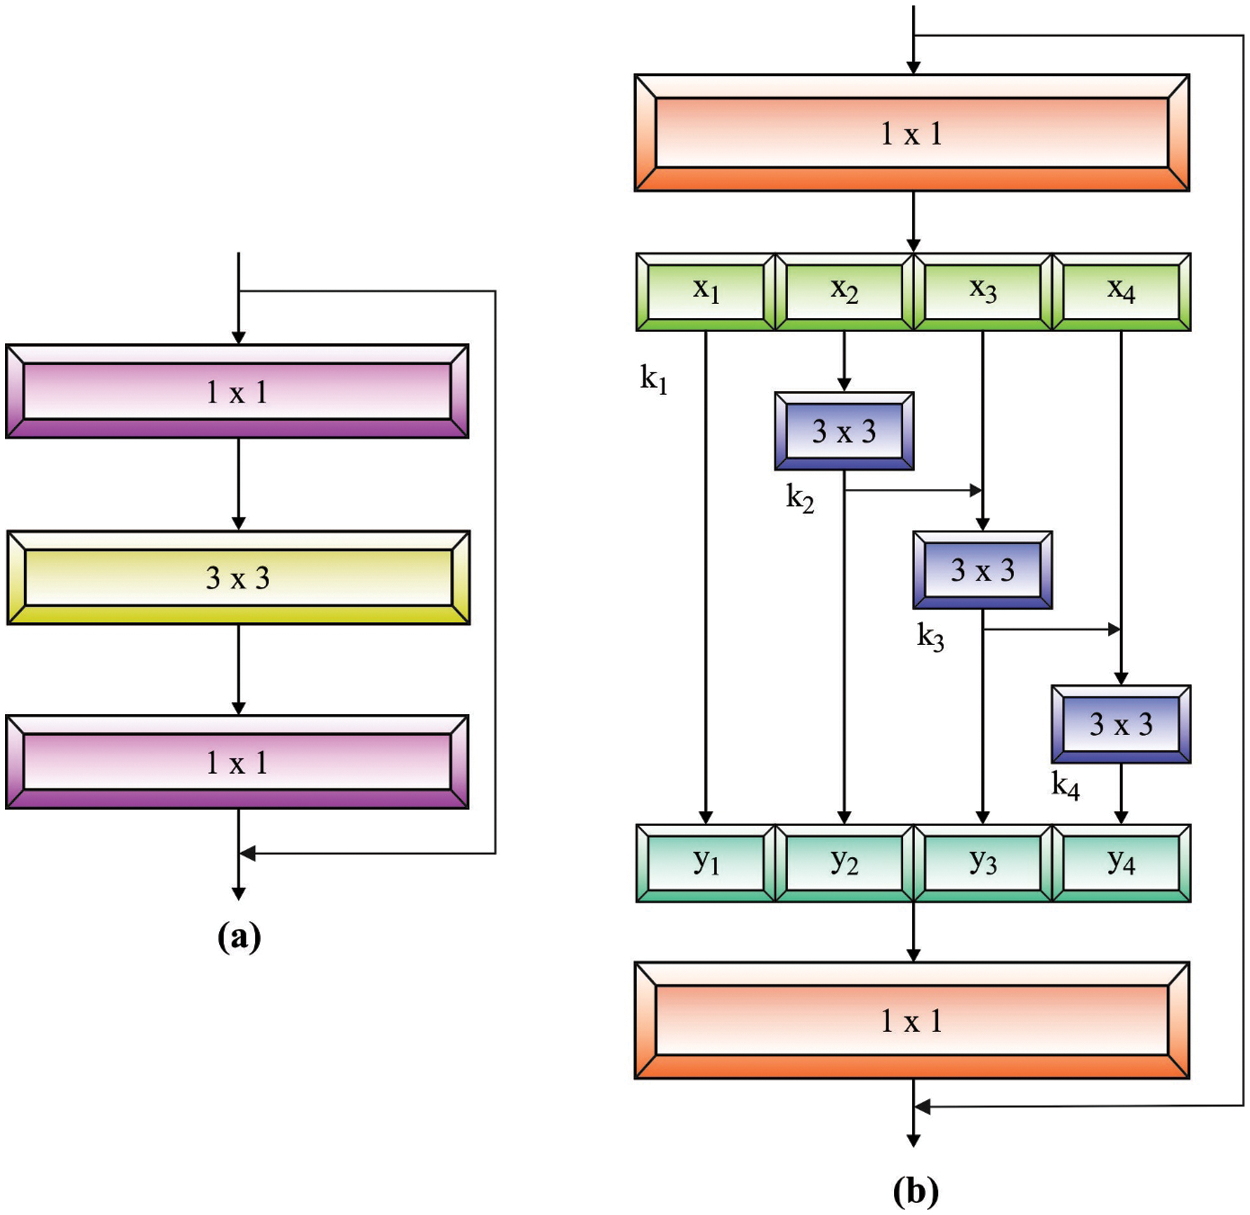
Figure 1: (a) ResNet Model (b) Res2Net Model
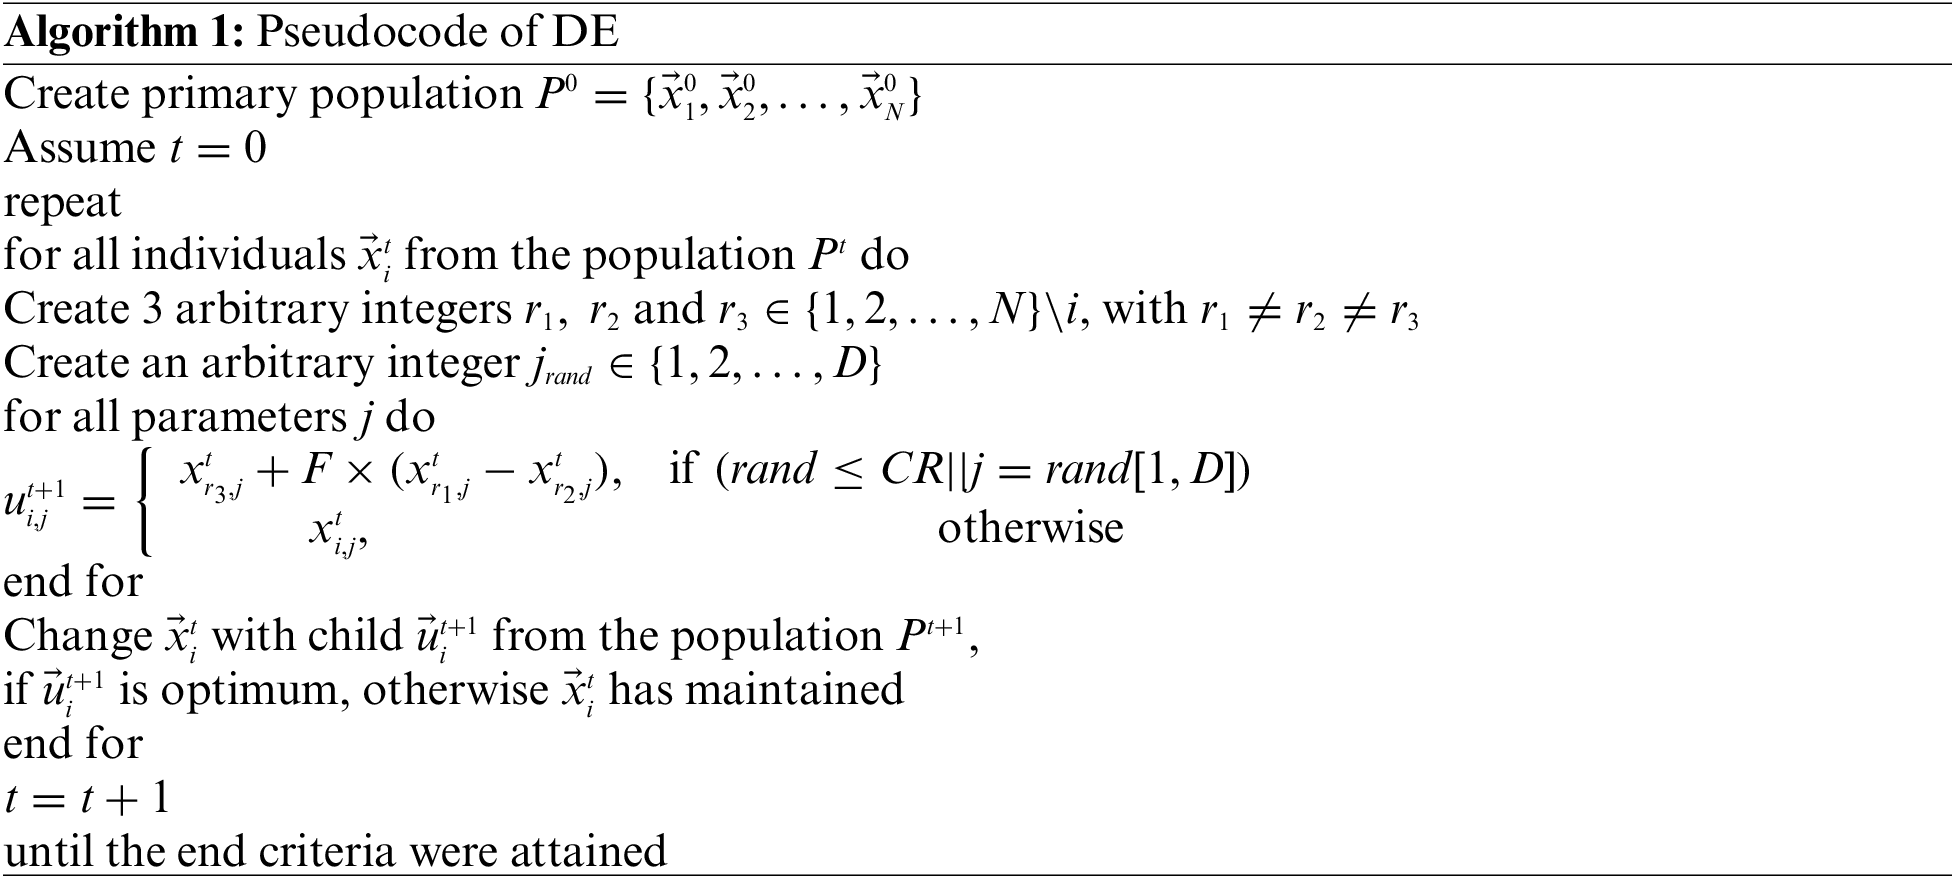
2.3 Hyperparameter Tuning Using the DE Technique
The DE technique can be utilized to optimally adjust the hyperparameters of the Res2Net model. The DE technique has primarily been established in [19]. The vital model after the DE technique is a process to create a testing parameter vector and more weight variance between two population vectors to the third one. As another evolutionary technique, the DE approach aims at developing a population of
where
Step 1: Initialize every individual arbitrarily (in bounds
Step 2: Mutation:
For
The optimum value of F defined in this study was equivalent to 0.5.
Step 3: Crossover:
Generate testing vector
for
end
Step 4: Selection:
for
end
Step 5: Increase the generation number
Because the generation cycle is repeated in Step 2, the maximum number of generation cycles is attained. The great minimal error fitness and its equivalent better vectors containing
2.4 Image Classification Using the KNN Technique
In the last stage, the KNN model receives the features as input and projects proper class labels. KNN is a simple machine learning (ML) technique. To define the classification of the testing data, KNN executes a test to check the amount of similarity among k trained data and documents to save a specific number of classified information [20]. As KNN categorizes instances, in this work, it would be benign and malicious code instances near the training space. The classification of unknown instances can be implemented by evaluating the distance between the unknown instances and training instances. As the instance is categorized according to the majority vote of neighbor, the most widespread neighbor is evaluated by a distance function. When k=1, the instance is allocated to the class of its adjacent neighbors. In n-dimensional space, distance between x and y can be attained by a distance function defined as follows:
To examine the malaria detection performance of the IDTL-MPDC technique, an experimental result analysis was performed on the open-access malaria dataset. It comprises 27558 cell images under two categories, parasitized and uninfected cells, with identical numbers of samples, as shown in Fig. 2.
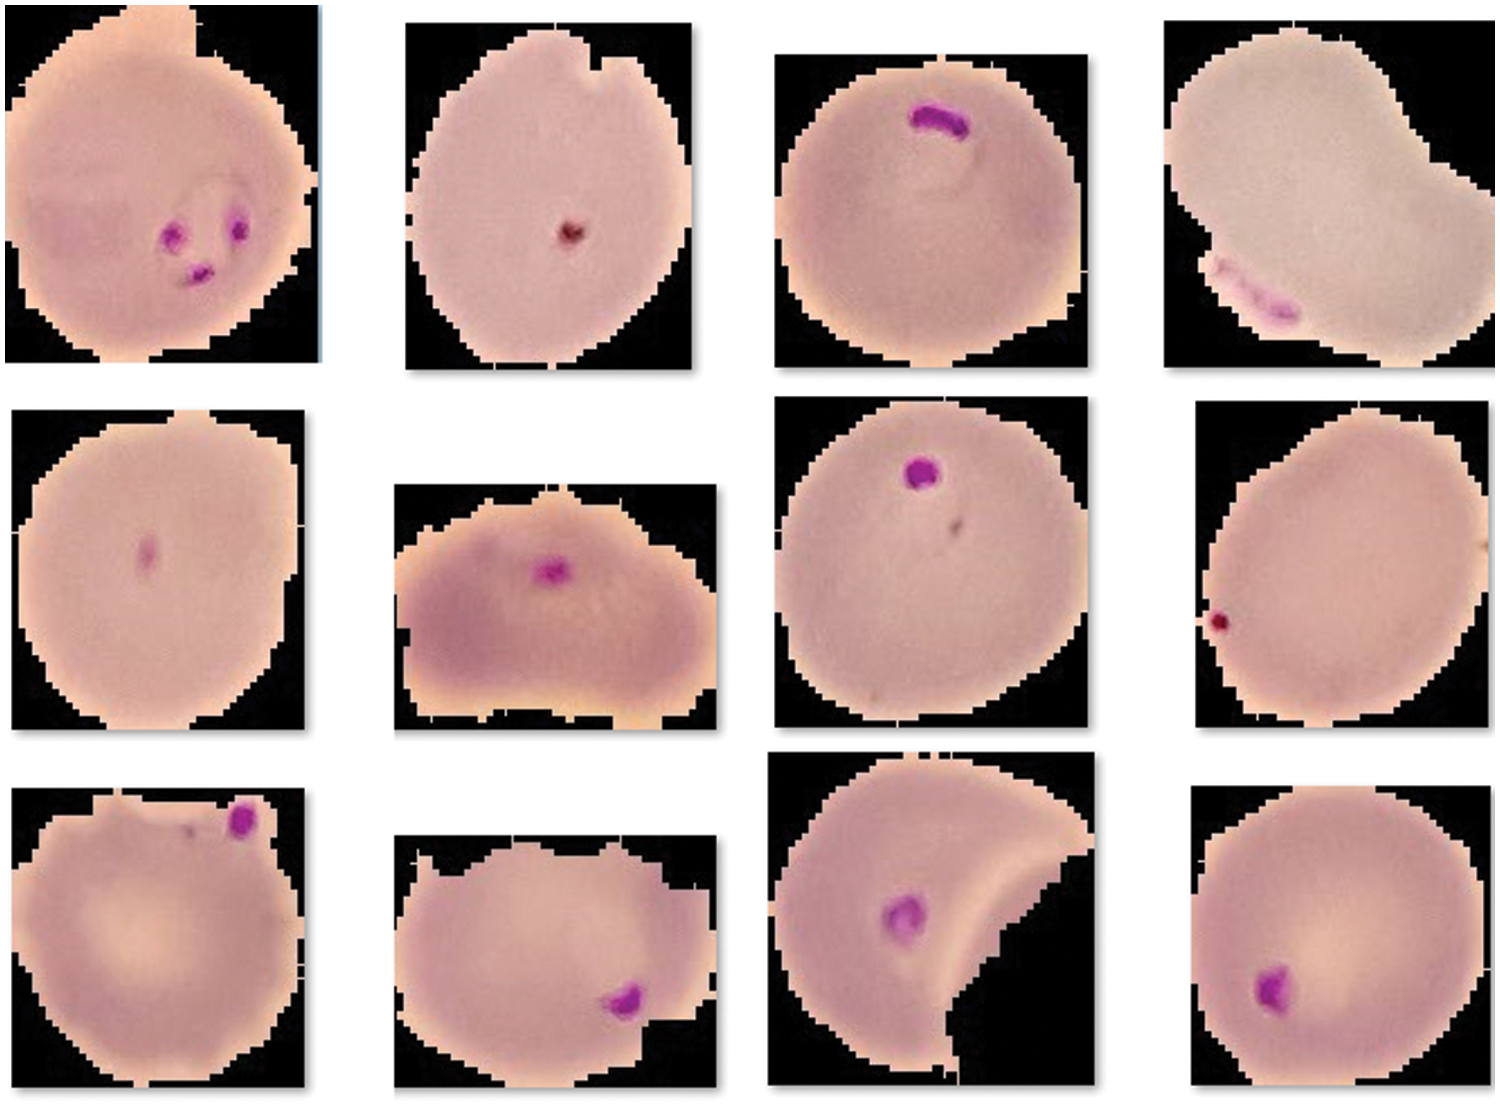
Figure 2: Sample images
Tab. 1 lists the overall malaria classification results of the IDTL-MPDC technique under varying epoch counts.
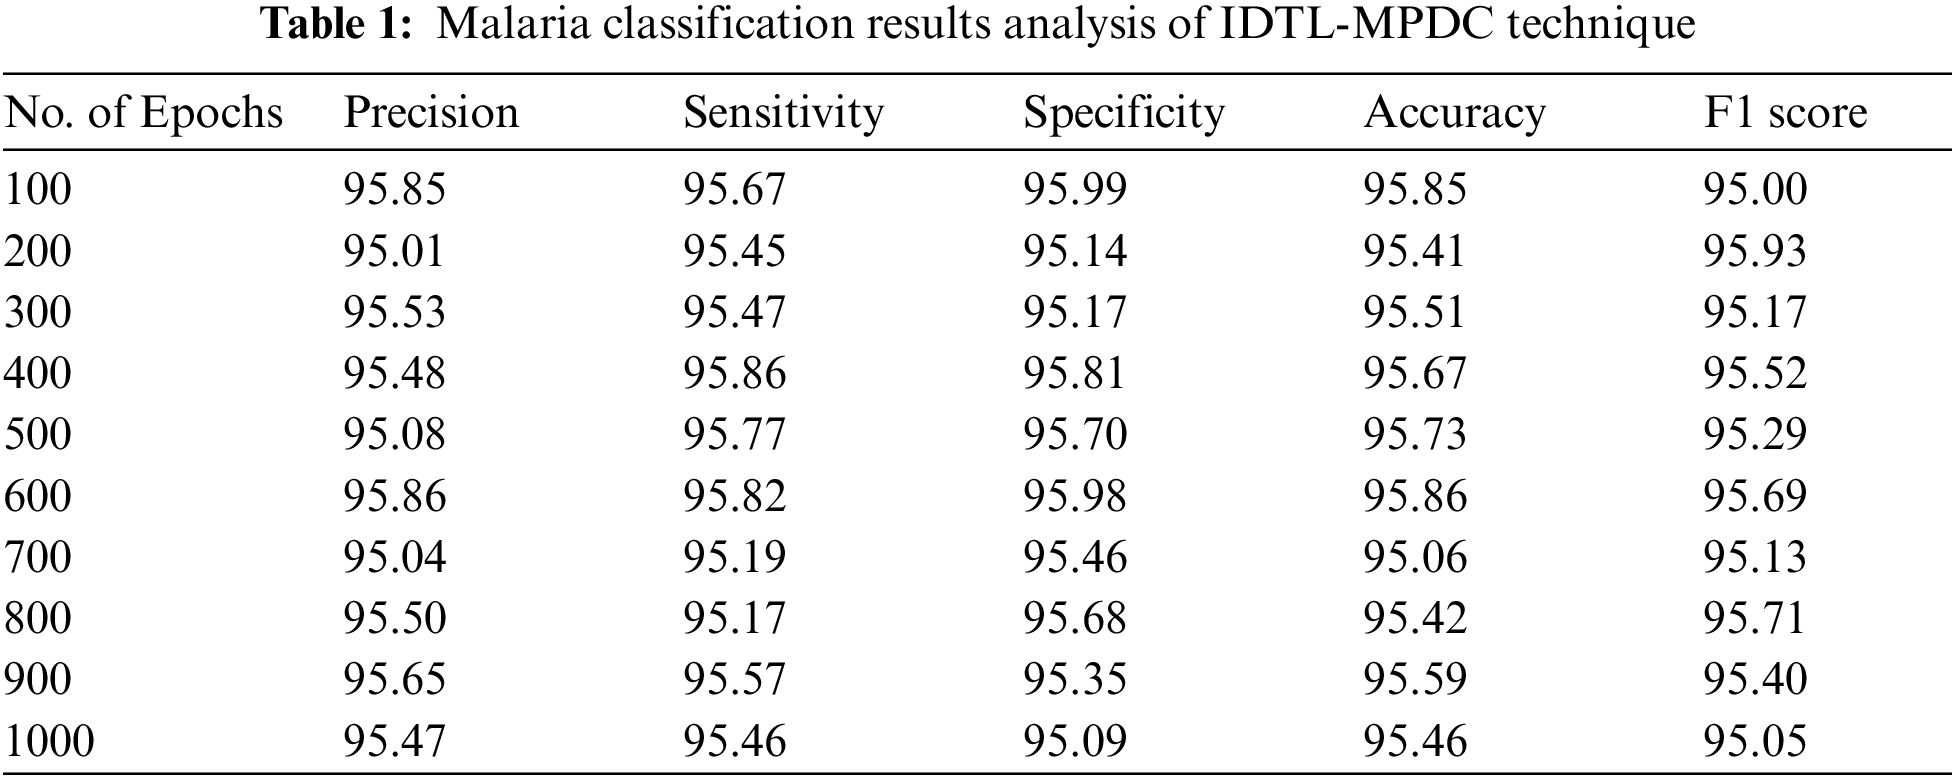
Fig. 3 presents a brief
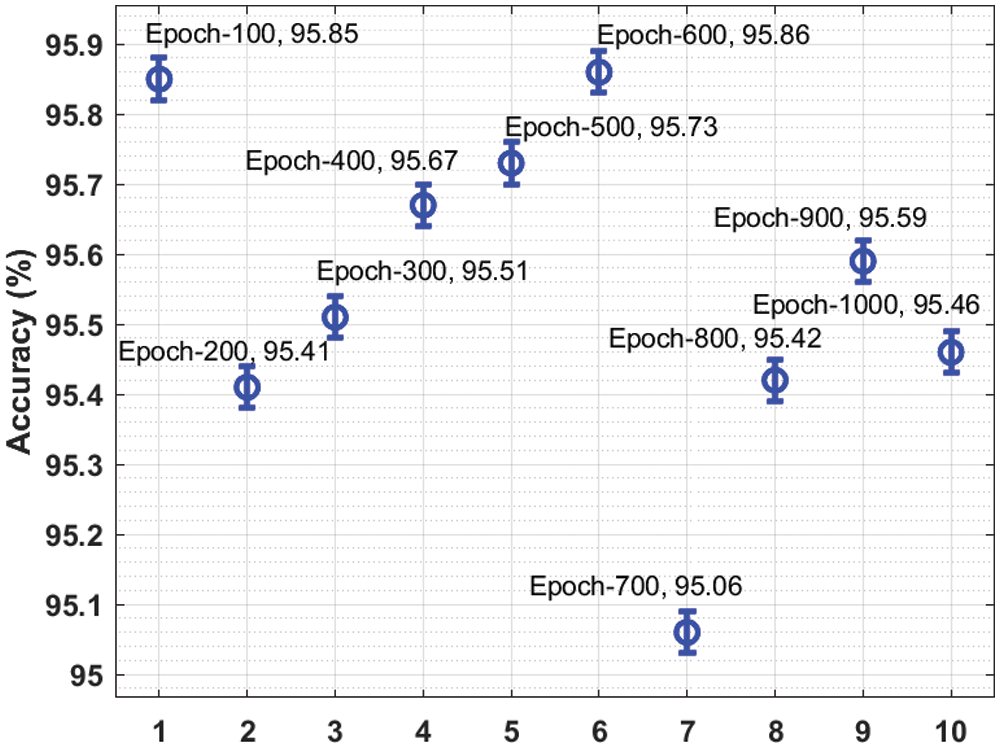
Figure 3: Result analysis of the IDTL-MPDC technique in terms of accuracy
A detailed
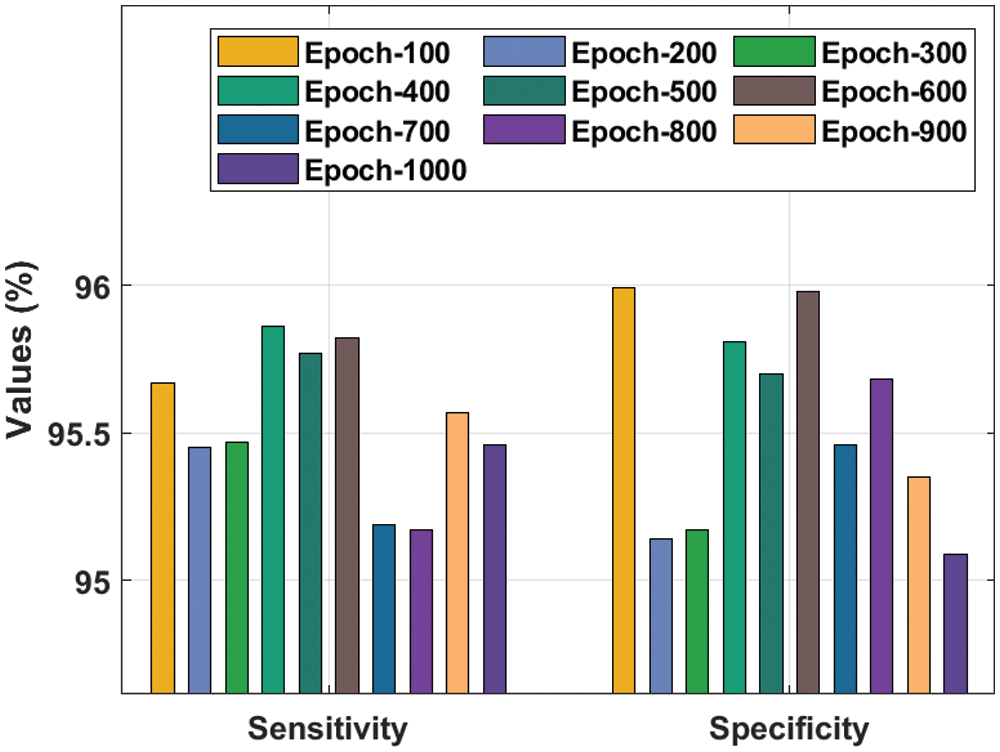
Figure 4: Result analysis of the IDTL-MPDC technique in terms of
A comprehensive
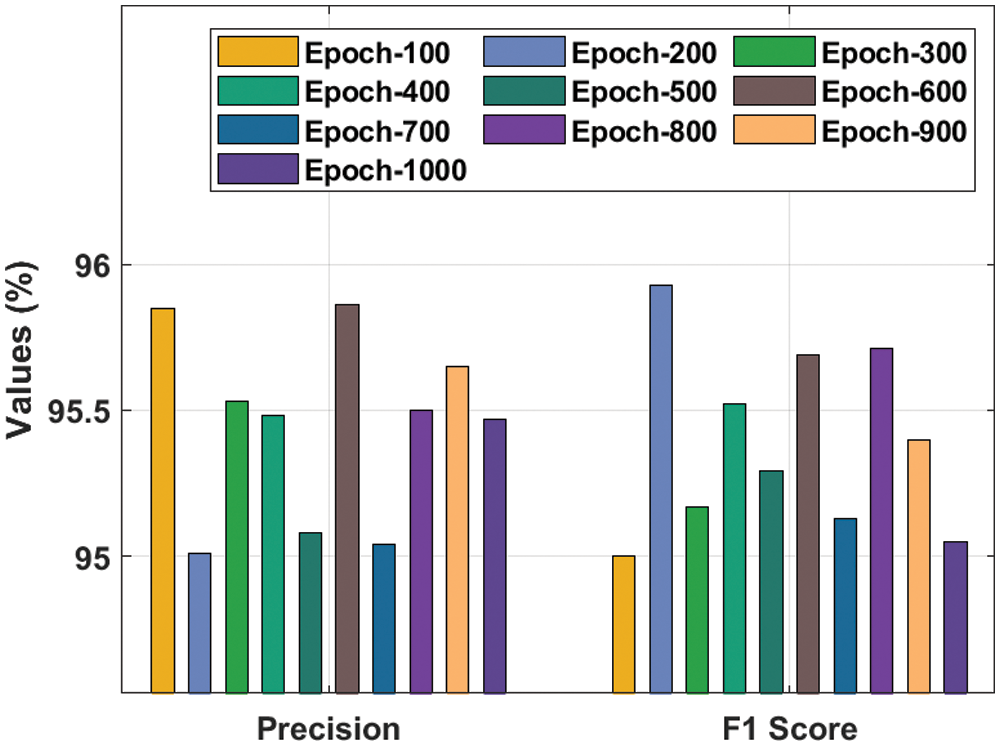
Figure 5: Result analysis of the IDTL-MPDC technique in terms of
Fig. 6 depicts the receiver operating characteristic (ROC) curve analysis of the use of the IDTL-MPDC technique on the test dataset. The figure states that the IDTL-MPDC technique has attained improved outcomes with the maximal ROC of 98.6290.
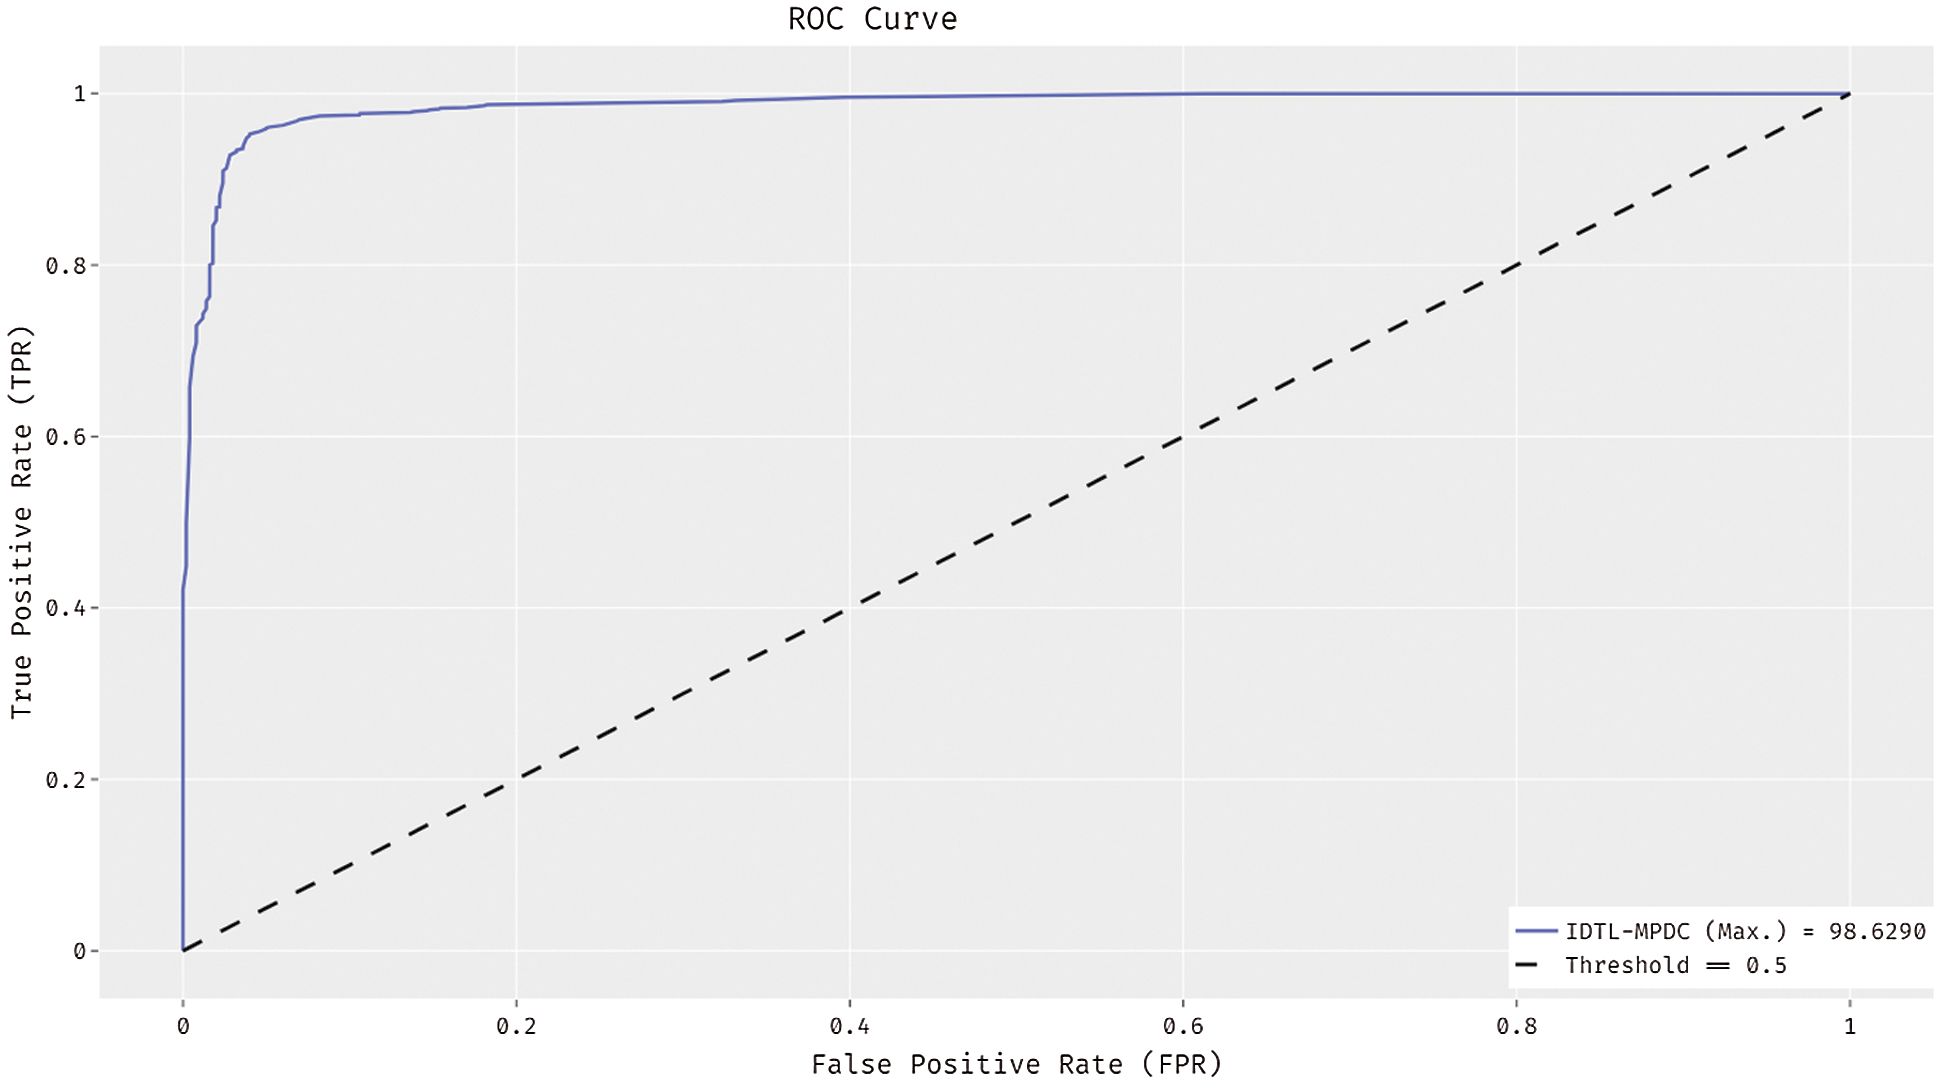
Figure 6: ROC analysis of IDTL-MPDC technique
Fig. 7 shows the ROC analysis of the IDTL-MPDC technique on the test dataset. The figure exposed that the IDTL-MPDC technique has reached an enhanced outcome with the minimum ROC of 97.9295.
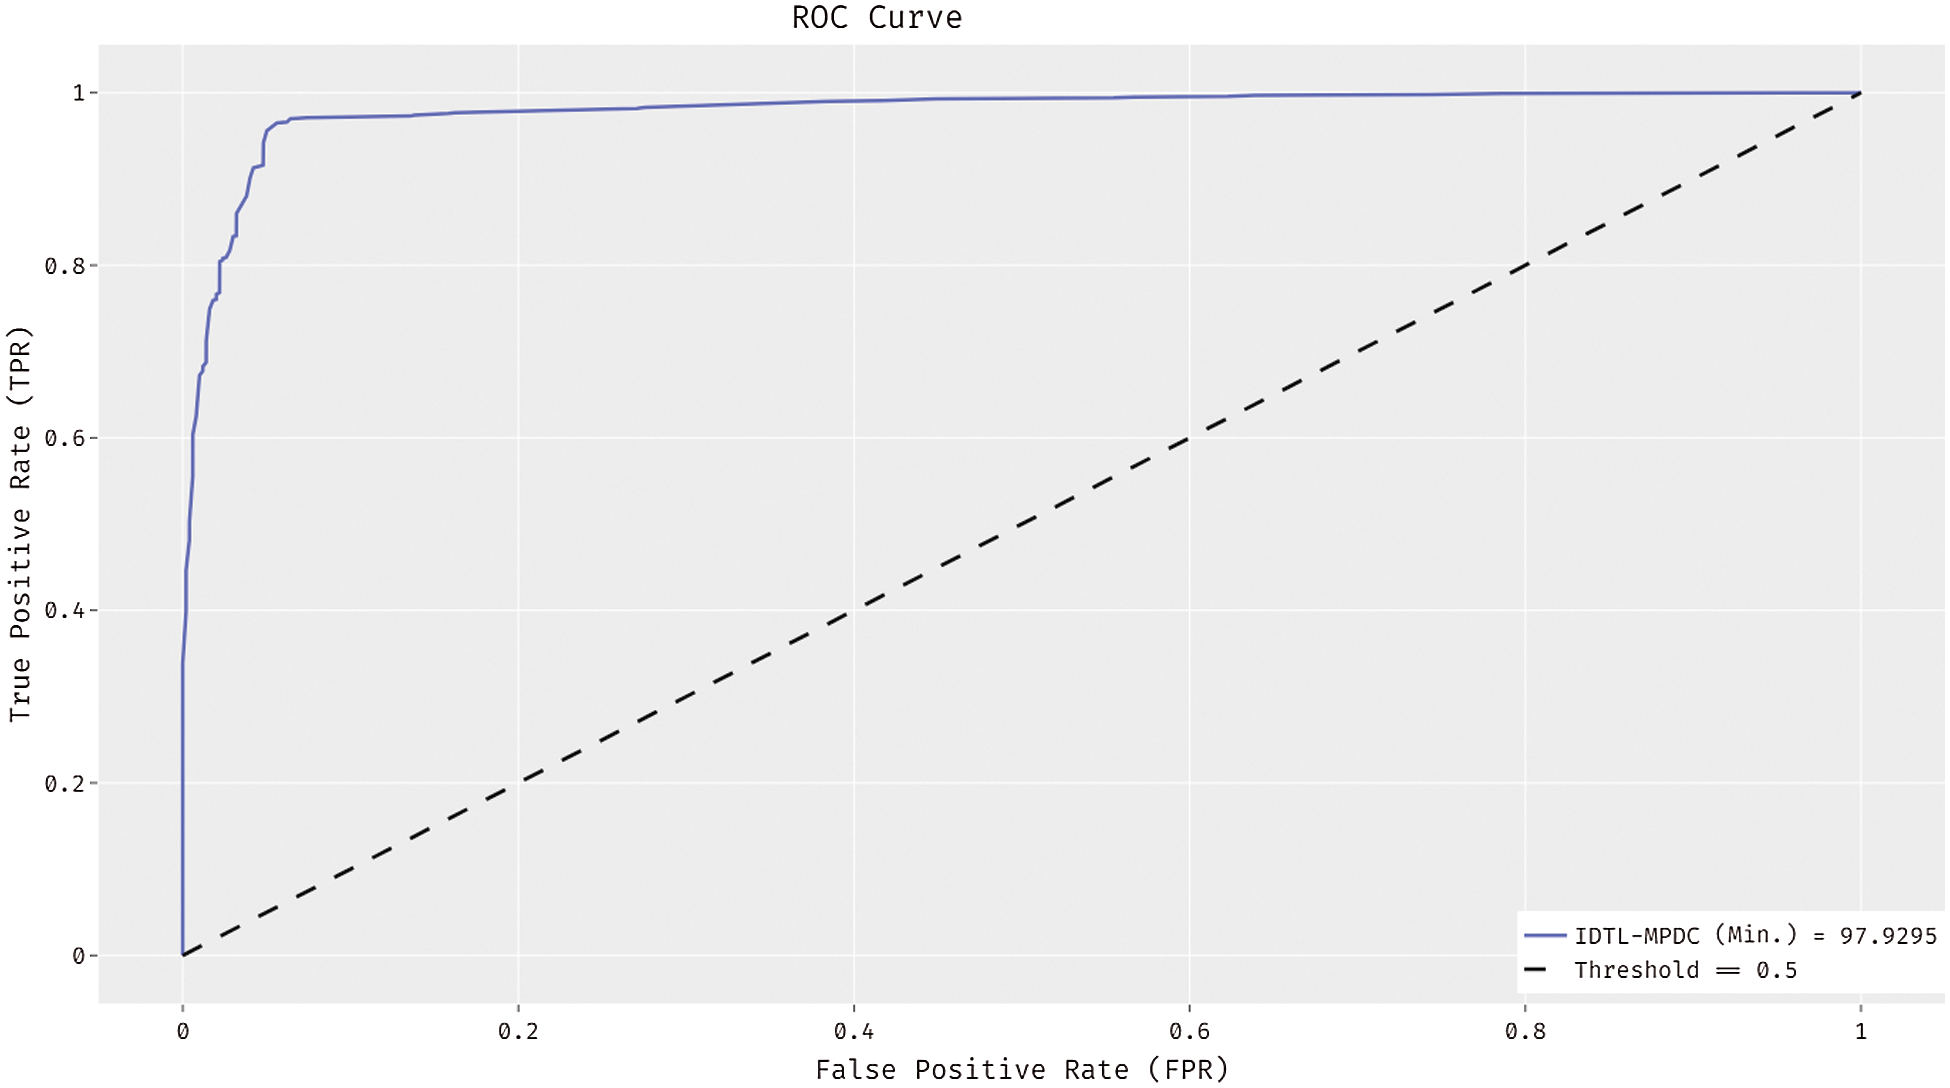
Figure 7: ROC analysis of IDTL-MPDC technique
Tab. 2 provides an extensive comparative analysis of the IDTL-MPDC technique with other recent methods [21]. Fig. 8 depicts the
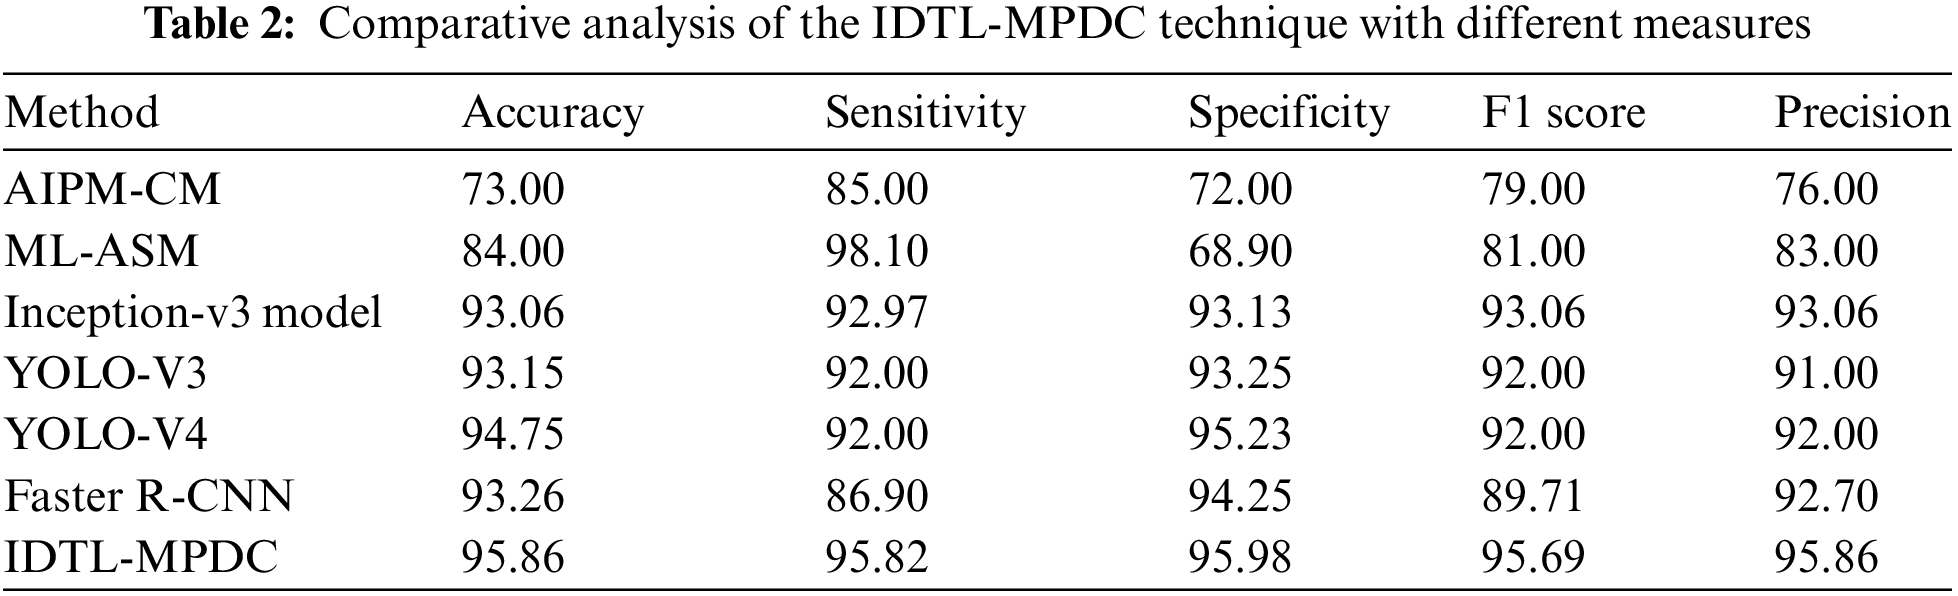
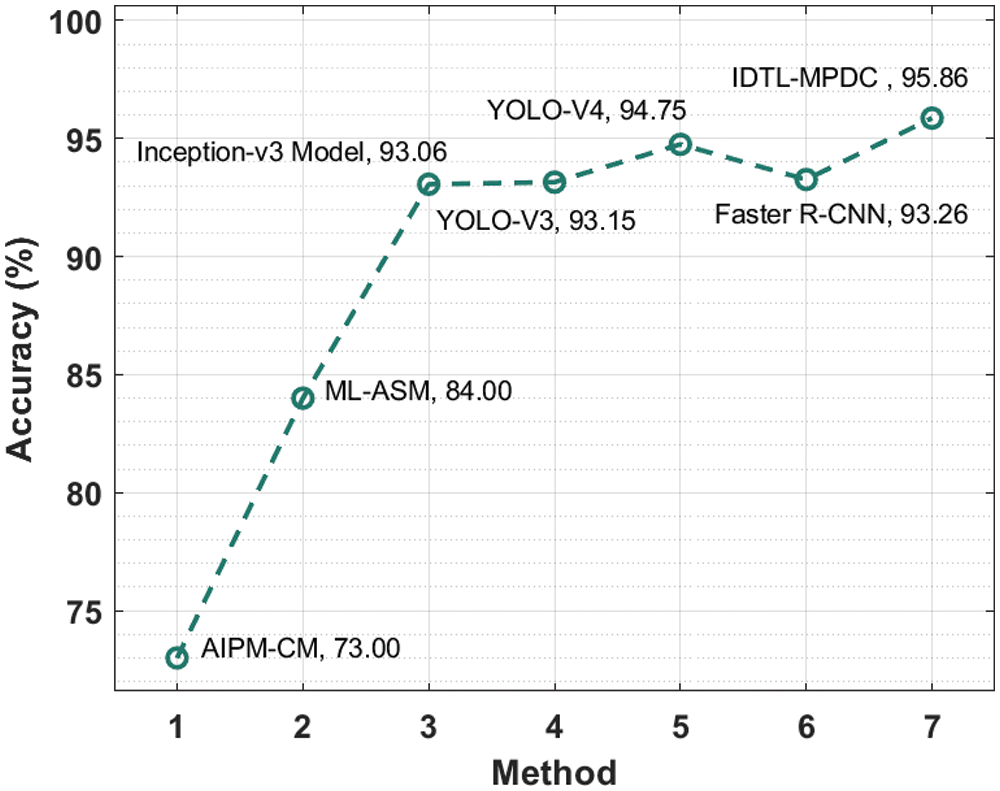
Figure 8:
Fig. 9 illustrates the
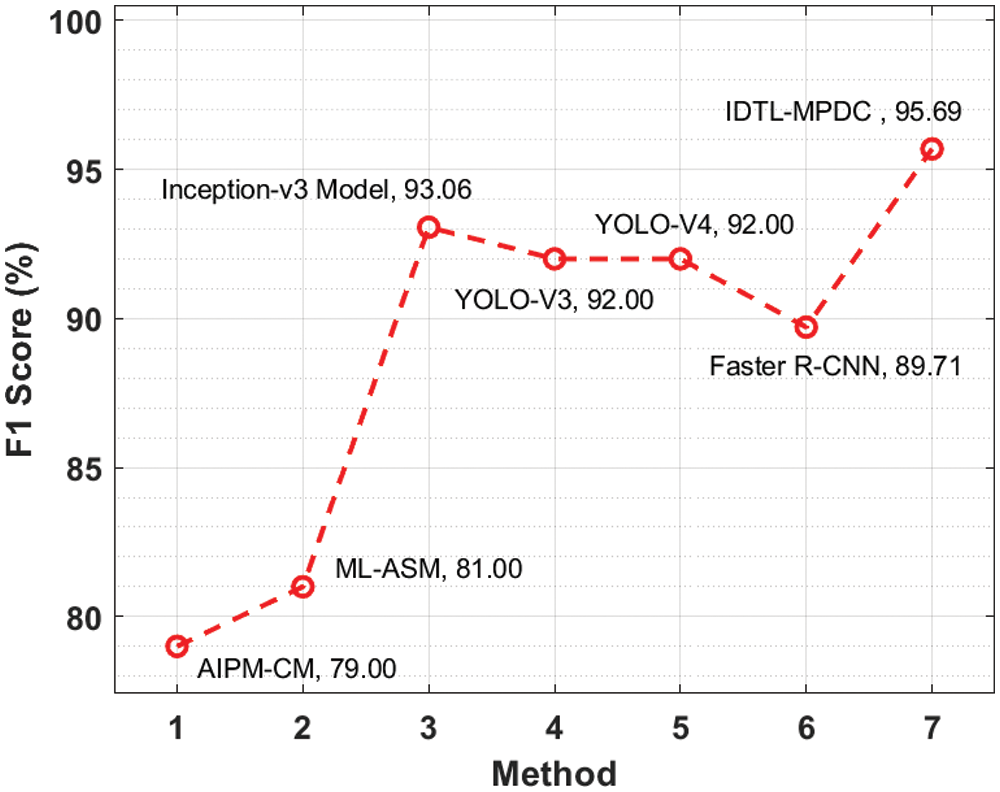
Figure 9:
Fig. 10 depicts the
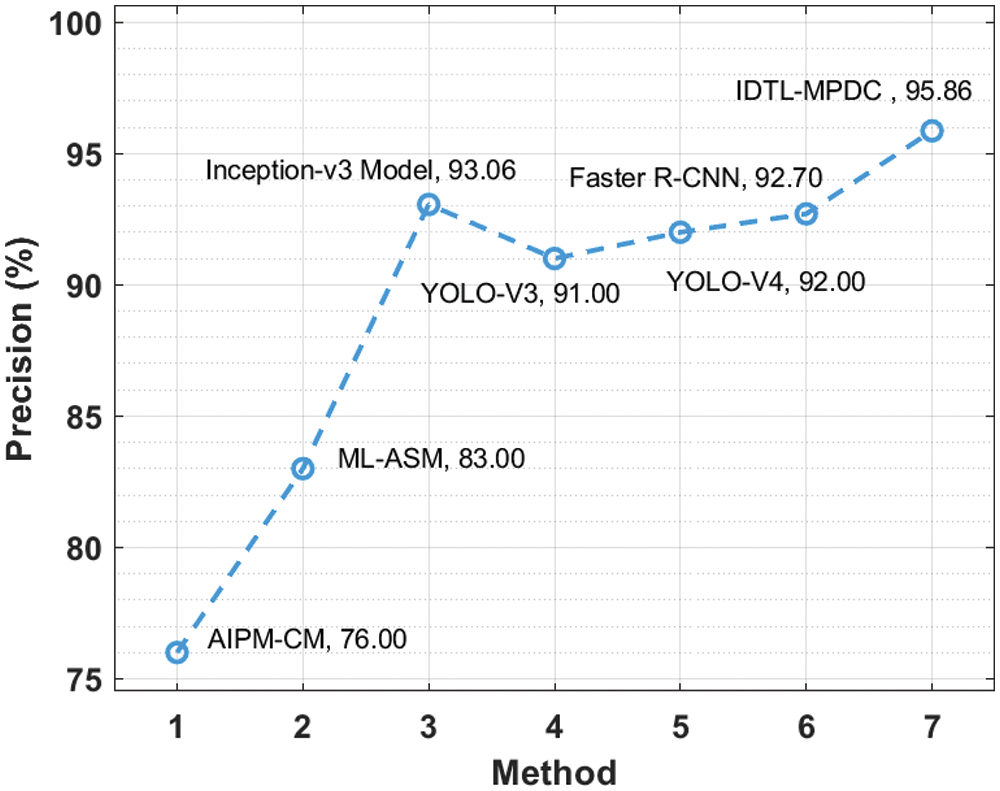
Figure 10:
In this study, a new IDTL-MPDC technique has been proposed to effectively determine the presence of malarial parasites in blood smear images. The IDTL-MPDC technique involves various sub-processes, namely, MF-based pre-processing, Res2Net-based feature extraction, DE-based hyperparameter optimization, and KNN-based classification. The optimal selection of Res2Net hyperparameters by the DE model helps achieve enhanced classification outcomes. A wide range of simulation analyses of the IDTL-MPDC technique have been carried out using a benchmark dataset, and the simulation results reported better outcomes than other related techniques. Therefore, the IDTL-MPDC technique can be utilized as a proficient tool for the detection and classification of malarial parasites. In the future, deep instance segmentation techniques should be included to improve the classification performance of the IDTL-MPDC technique.
Acknowledgement: The authors extend their appreciation to the Deanship of Scientific Research at Majmaah University for funding this study under project number R-2022-76.
Funding Statement: The authors received no specific funding for this study.
Conflicts of Interest: The authors declare that they have no conflicts of interest regarding this study.
1. Fact Sheet about Malaria. 2019. Available online: https://www.who.int/news-room/fact-sheets/detail/malaria. [Google Scholar]
2. I. M. Masanja, M. L. McMorrow, M. B. Maganga, D. Sumari, V. Udhayakumar et al., “Quality assurance of malaria rapid diagnostic tests used for routine patient care in rural Tanzania: Microscopy versus real-time polymerase chain reaction,” Malaria Journal, vol. 14, no. 1, pp. 85, 2015. [Google Scholar]
3. M. Poostchi, K. Silamut, R. J. Maude, S. Jaeger and G. Thoma, “Image analysis and machine learning for detecting malaria,” Translational Research, vol. 194, pp. 36–55, 2018. [Google Scholar]
4. E. I. Obeagu, C. Uo and E. Is, “Malaria rapid diagnostic test (RDTs),” Annals of Clinical & Laboratory Science, vol. 6, no. 4:275, pp. 1–3, 2018. [Google Scholar]
5. B. A. Mathison and B. S. Pritt, “Update on malaria diagnostics and test utilization,” Journal of Clinical Microbiology, vol. 55, no. 7, pp. 2009–2017, 2017. [Google Scholar]
6. S. Rajaraman, S. K. Antani, M. Poostchi, K. Silamut, M. A. Hossain et al., “Pre-trained convolutional neural networks as feature extractors toward improved malaria parasite detection in thin blood smear images,” PeerJ, vol. 6, pp. e4568, 2018. [Google Scholar]
7. J. A. Quinn, R. Nakasi, P. K. Mugagga, P. Byanyima, W. Lubega et al., “Deep convolutional neural networks for microscopy-based point of care diagnostics,” in Proc. of the Machine Learning for Healthcare Conf., Los Angeles, CA, vol. 56, pp. 271–281, 2016. [Google Scholar]
8. D. Yang, G. Subramanian, J. Duan, S. Gao, L. Bai et al., “A portable image-based cytometer for rapid malaria detection and quantification,” PLoS ONE, vol. 12, no. 6, pp. e0179161, 2017. [Google Scholar]
9. J. E. Arco, J. M. Górriz, J. Ramírez, I. Álvarez and C. G. Puntonet, “Digital image analysis for automatic enumeration of malaria parasites using morphological operations,” Expert Systems with Applications, vol. 42, no. 6, pp. 3041–3047, 2015. [Google Scholar]
10. D. Bibin, M. S. Nair and P. Punitha, “Malaria parasite detection from peripheral blood smear images using deep belief networks,” IEEE Access, vol. 5, pp. 9099–9108, 2017. [Google Scholar]
11. K. Chakradeo, M. Delves and S. Titarenko, “Malaria parasite detection using deep learning methods,” International Journal of Computer and Information Engineering, vol. 15, no. 2, pp. 175–182, 2021. [Google Scholar]
12. K. M. F. Fuhad, J. F. Tuba, M. R. A. Sarker, S. Momen, N. Mohammed et al., “Deep learning based automatic malaria parasite detection from blood smear and its smartphone based application,” Diagnostics, vol. 10, no. 5, pp. 329, 2020. [Google Scholar]
13. D. Shah, K. Kawale, M. Shah, S. Randive and R. Mapari, “Malaria parasite detection using deep learning: (Beneficial to humankind),” in 2020 4th Int. Conf. on Intelligent Computing and Control Systems (ICICCS), Madurai, India,pp. 984–988, 2020. [Google Scholar]
14. S. Li, Z. Du, X. Meng and Y. Zhang, “Multi-stage malaria parasite recognition by deep learning,” GigaScience, vol. 10, no. 6, pp. giab040, 2021. [Google Scholar]
15. A. Rahman, H. Zunair, T. R. Reme, M. S. Rahman and M. R. C. Mahdy, “A comparative analysis of deep learning architectures on high variation malaria parasite classification dataset,” Tissue and Cell, vol. 69, pp. 101473, 2021. [Google Scholar]
16. W. Swastika, G. M. Kristianti and R. B. Widodo, “Effective preprocessed thin blood smear images to improve malaria parasite detection using deep learning,” Journal of Physics: Conference Series, vol. 1869, no. 1, pp. 012092, 2021. [Google Scholar]
17. Z. Xu, F. R. Sheykhahmad, N. Ghadimi and N. Razmjooy, “Computer-aided diagnosis of skin cancer based on soft computing techniques,” Open Medicine, vol. 15, no. 1, pp. 860–871, 2020. [Google Scholar]
18. S. Gao, M. Cheng, K. Zhao, X. Zhang, M. Yang et al., “Res2net: A new multi-scale backbone architecture,” IEEE Transactions on Pattern Analysis and Machine Intelligence, vol. 43, no. 2, pp. 652–662, 2021. [Google Scholar]
19. S. K. Saha, S. P. Ghoshal, R. Kar and D. Mandal, “Cat swarm optimization algorithm for optimal linear phase fir filter design,” ISA Transactions, vol. 52, no. 6, pp. 781–794, 2013. [Google Scholar]
20. A. B. Hassanat, M. A. Abbadi, G. A. Altarawneh and A. A. Alhasanat, “Solving the problem of the K parameter in the KNN classifier using an ensemble learning approach,” International Journal of Computer Science and Information Security, vol. 12, no. 8, pp. 33–39, 2014. [Google Scholar]
21. A. Maqsood, M. S. Farid, M. H. Khan and M. Grzegorzek, “Deep malaria parasite detection in thin blood smear microscopic images,” Applied Sciences, vol. 11, no. 5, pp. 2284, 2021. [Google Scholar]
 | This work is licensed under a Creative Commons Attribution 4.0 International License, which permits unrestricted use, distribution, and reproduction in any medium, provided the original work is properly cited. |