DOI:10.32604/cmc.2022.025596
| Computers, Materials & Continua DOI:10.32604/cmc.2022.025596 | |
| Article |
Soft Computing Based Metaheuristic Algorithms for Resource Management in Edge Computing Environment
1Department of Information Systems, Faculty of Computing and Information Technology, King Abdulaziz University, Jeddah, Saudi Arabia
2Department of Computer Science and Engineering, Sejong University, Seoul, Korea
3School of Software, Soongsil University, Seoul, 06978, Korea
4Artificial Intelligence Education, Hankuk University of Foreign Studies, Dongdaemun-gu, Seoul, 02450, Korea
*Corresponding Author: Doo Ill Chul. Email: dic@hufs.ac.kr
Received: 29 November 2021; Accepted: 30 December 2021
Abstract: In recent times, internet of things (IoT) applications on the cloud might not be the effective solution for every IoT scenario, particularly for time sensitive applications. A significant alternative to use is edge computing that resolves the problem of requiring high bandwidth by end devices. Edge computing is considered a method of forwarding the processing and communication resources in the cloud towards the edge. One of the considerations of the edge computing environment is resource management that involves resource scheduling, load balancing, task scheduling, and quality of service (QoS) to accomplish improved performance. With this motivation, this paper presents new soft computing based metaheuristic algorithms for resource scheduling (RS) in the edge computing environment. The SCBMA-RS model involves the hybridization of the Group Teaching Optimization Algorithm (GTOA) with rat swarm optimizer (RSO) algorithm for optimal resource allocation. The goal of the SCBMA-RS model is to identify and allocate resources to every incoming user request in such a way, that the client's necessities are satisfied with the minimum number of possible resources and optimal energy consumption. The problem is formulated based on the availability of VMs, task characteristics, and queue dynamics. The integration of GTOA and RSO algorithms assist to improve the allocation of resources among VMs in the data center. For experimental validation, a comprehensive set of simulations were performed using the CloudSim tool. The experimental results showcased the superior performance of the SCBMA-RS model interms of different measures.
Keywords: Resource scheduling; edge computing; soft computing; fitness function; virtual machines
The Internet of Things (IoT) interlinks devices and Internet to perform useful communication among people and objects. The linking procedure usually comprises control, sensing, and actuating devices. In addition, this device conforms to an essential standard compliant transmission protocol. IoT could understand the goal of smart discovering, controlling, identifying, and following things in several diverse and effective manners [1]. Therefore, IoT becomes common in fields like transport, smart healthcare, industrial automation, retail, logistics, etc. Most IoT enabled applications are computationally intensive, like augmented reality (AR) and interactive gaming, and it is complex for the device itself to satisfy this task because of the power consideration and hardware limitations. Though the cloud server provides adequate computation assets, a huge number of traffics sent to the cloud will cause unpredictable delays and network congestion that fails to encounter the lower latency need and reduces the quality of experience (QoE). The developing Edge Computing (EC) technique faces the limitations of cloud computing (CC) [2]. Mobile edge computing (MEC) allows several IoT services and applications executed at the network edge rather than being sent to the remote cloud that decreases the response time and lessens the burden on backhaul connection. But, the storage, network resources, and computation of the edge server are constrained, and therefore, Resource Scheduling (RS) is significant to increase the QoE. In recent times, EC was broadly utilized for computationally intensive tasks of artificial intelligence (AI) in the real IoT platform [3]. As the edge nodes have the features of dynamic changes and resource constrained, it is important to implement a proper architecture to offload and schedule computation tasks in the edge. Besides, soft computing techniques can be widely employed to design RS techniques in EC environment. Fig. 1 shows the architecture of MEC [4].

Figure 1: Architecture of mobile edge computing
Reference [5] implement a genetic method and particle swarm optimization (PSO) based technique for solving assets distribution issue. But, the dependence among subtask wasn't deliberated in this work. Non dominated sorting genetic technique II has been adapted to understand multi objective optimization for reducing the energy consumption and execution time of EC devices. [6] was verified that resource allocation strategy is defined by computing task and the highest completion time of its instant predecessor. In [7], a smart collaborative automation (SCA) system is presented to enhance asset utilization. Reference [8] projected a technique that attained distribution decision through randomization and semidefinite relaxation, however, the transmission between sub tasks is neglected using this study. The researchers in [9] acquired dependency between sub tasks to account and presented a multistage greedy adjustment (MSGA) method for solving task distribution issues.
Reference [10] focuses on task offloading challenge for finding an optimum trade off among energy consumption and task completion latency. They projected a modified fast and elitist non dominated sorting genetic technique for solving offload issues. But, in this study, the task is deliberated to be undivided, that wastes the equivalent computing ability of EC server. Researchers in [11] made unexecuted task queues at MEC server and presented an online technique for allocating resources. [12] proposed a management and allocation resources technique for reducing the module difficulty of resource allocation technique. The researchers in [13] take the dependencies among task to account, and projected a deep reinforcement learning (DRL) method to create offload decision, the variance between tasks are neglected by this study. [14] adapt Non-dominated Sorting Genetic method II to reduce the allocating resource time of computing task and decrease the energy utilization of EC servers, however, this study didn't deliberate the dependency between tasks.
This paper designs a new soft computing based metaheuristic algorithms for resource scheduling (RS), called SCBMA-RS in the EC environment. The SCBMA-RS model involves the hybridization of the Group Teaching Optimization Algorithm (GTOA) with rat swarm optimizer (RSO) algorithm to optimally allocate the resources in EC. Besides, the SCBMA-RS model derives a fitness function to identify and allocate resources to every incoming user request in such a way, that the client's necessities are satisfied with the minimum number of possible resources and optimal energy consumption. In the SCBMA-RS method, the incorporation of the GTOA and RSO algorithms helps to improvise the allocation of resources among VMs inthe data center. A series of simulations were performed by the use of the CloudSim tool and the results are inspected interms of different performance measures.
Li et al. [15] proposed a user oriented improved ISCM in this study. Depending upon enhanced k means technique, the ISCM method resolves the issue that clustering outcome is sensitive to primary value and comprehends the reclustering, that creates the attained clustering outcomes more stable. Lastly, the EC RS system is attained depending upon clustering outcomes. Li et al. [16] proposed a hybrid computing architecture and implemented a smart RS approach to satisfy the real world need in smart manufacturing with the support of EC. Initially, a 4 layers computing model from the smart manufacturing platform is given for supporting the AI task function with the network perception. Later, a 2 phase's technique to schedule the computing resource in the edge layer is implemented depending upon threshold and greedy approaches using latency limitations.
Wang et al. [17] proposed an optimization approach to compute resource allocation of huge IoHT devices to consider privacy protection from cloud EC platforms. Initially, a 5G heterogeneous cloud EC network is created. As well, based on network conditions, the computing needs of devices are distributed to EC/local implementation. The communication, computing resource allocation, and delay of edge servers are modelled consequently. Lastly, a protection module for immediate messaging privacy data is implemented with the consideration of the threat of large scale privacy data leakage in IoHT. In Vimal et al. [18], the factor causing this delay are forecast with MEC resources and assess the efficiency from the neighboring client tool. The efficiency creates a cognitive agent module for assessing the communication network and resource allocation is determined for enhancing the QoS. The Reinforcement Learning technique MOACO method was employed for handling the precise resource allocation among the end user from the manner of making the cost map table creation and optimum allocation from MEC.
Zhang et al. [19] proposed 2 slow movement PSO methods for solving the resulting NP hard problem. Especially, they improve a position based mapping system to map particles to schedule solutions. For preventing the substantial modification in particle position, they additionally proposed a new particle upgrading approach to slow down particle movement, to examine higher quality solution in the guide of global optimal particle and personal optimal particle. Porkodi et al. [20] proposed a new fuzzy clustering with flower pollination method named FCM FPA as resource provision module for computing fog. Initially, the resource attributes are normalized and standardized. Finally, the proposed resource provision method depending upon optimized fuzzy clustering was developed.
Arani et al. [21] presented a task scheduling method depending upon moth flame optimization method for assigning optimum sets of tasks to fog node for meeting the fulfilment of QoS needs of CPS application in this manner that the overall execution time of task is minimalized. Sheng et al. [22] leverage DRL to resolve time scheduling (viz., task execution order) and resource allocation (viz. that VM the task is allocated to), consider the diversity of tasks and heterogeneity of accessible resource. The policy based REINFORCE method is presented to scheduling task problems, and an FCN is used for extracting features.
Li et al. [23] presented a RS technique for computing fog in this study. Initially, they normalize and standardize the resource attributes. Next, they integrate fuzzy clustering approaches with PSO for dividing the resource, and the scale of resource searching is decreased. Lastly, they proposed a novel RS method depending upon optimized fuzzy clustering. In Vimal et al. [24], the RL methods MOACO technique was employed to handle a precise resource allocation among the end user from the manner of making the cost mapping table creation and optimum allocation in MEC.
3 The Proposed Resource Management Technique
Fig. 2 shows the overall working process of SCBMA-RS model. The physical machine m in the cloud datacenter is denoted as the set of

Figure 2: Overall process of SCBMA-RS model
The group teaching optimization technique is developed on the basis of a group teaching module. In this method, the students, the knowledge of students, and subjects provided to the student, correspondingly, are denoted as fitness value, population, and decision variables. The 2 groups consist of student population, viz., average and outstanding groups. A single teacher is chosen for teaching 2 groups in the teaching stage. At the same time, the teacher would assume the difference of the learning capability of 2 groups hence creating distinct teaching strategies and group learning strategies for the student includes student interaction and self-learning. The 6 phases create the architecture of the GTO technique contains teacher allocation phase, initialization, student phase, teacher phase, termination, and reconstruct population. Beforehand the key optimization loop imitates, the value of maximal iterations amount
Whereas
The teacher Allocation Phase can be defined as follows.
Whereas
At the teacher Phase, the outstanding group can be determined using following equations.
Whereas

Figure 3: Flowchart of GTOA
Next, at the teacher Phase, the average group can be determined using following equations.
Whereas
Finally, the student phase can be defined as follows.
Whereas e and g indicates arbitrary amounts with the range of zero and one,
where
Rats are medium sized and long tailed rodents that are distinct based on their size and weight. It has 2 major species: Brown and Black rats. Generally, the female ones are called as does and the male ones are known as bucks. They are commonly socially intelligent in nature. Rats groom one another and include in several activities like chasing, jumping, boxing, and tumbling. They are territorial animal that lives in a set of females and males. Rat behaviors are highly aggressive in several instances that might lead to mortality of few animals. These behaviors are the major inspiration of this study when fighting and chasing prey. In this study, the fighting and chasing behaviors of rats are numerically modeled to implement RSO technique and execute optimization.
This section defines the rat behaviors viz., fighting & chasing. Later the presented RSO technique is summarized.
In general, rat is a social animal that chases the prey in groups by their social agonistic behavior. For defining this behavior numerically, they consider an optimum search agent (SA) implies the information regarding the place of the preys. The rest of the SAs could upgrades the places regarding an optimum SA reached until now [26]. The succeeding formulations are provided below.
Whereas
Here,
Thus, R and C denotes arbitrary amount among [0, 2] & [1, 5], correspondingly. The variables A and C are in charge for optimum exploitation and exploration on the iteration course.
The fighting procedure of rats using prey can be determined using the succeeding formula:
Whereas
The flowchart and steps (Fig. 4) of RSO algorithm are listed as follows:
i) Initiate the rat population
ii) Elect primary variables of RSO: A, C, and R.
iii) Here, estimate the fitness values of every SA.
iv) An optimum SA is identified from the given searching area.
v) Updating SA place SA by Eq. (16).
vi) Check either any SA surpasses the edge limits of search space and later alters it.
vii) Next, estimate the updated SA fitness values and updatee the vector
viii) Stop, if ending criteria is fulfilled. Or else, returns to Step 5.
ix) Display optimum solutions achieved so far.
3.3 Hybridization of GTOA and RSO for Resource Scheduling
In this study, an SCBMA-RS technique is utilized for scheduling resources in EC environment. The lower optimization accuracy and easier of falling to local optimal are the disadvantages in fruit fly optimization. The primary reason to develop the SCBMA-RS technique is to conquer the deficiencies of original GTOA optimization technique. The process of the projected method contains 2 phases. GTOA is utilized initial phase. The next phase incorporates RSO algorithm for updating the present location and solution to strengthen the problem of GTOA over early convergences, because of its exploitation and exploration capability. The suggested method enhances the optimization accuracy and convergence rate consequently.
Let

Figure 4: Flowchart of RSO
Let
The load of entire VMs can be represented using the following equations:
Here
Consider
Thus, the objective functions of load balancing (LB) module given by:
Whereas
Makespan in the EC determines the whole finishing time of tasks
The energy consumption is estimated as follows
The overall energy consumptions can be defined using Eq. (27):
Thus, the objective function is determined by
The cost of datacenter is estimated by Eq. (27)
where
The objective function for LB module is determined by
Eq. (31) denotes that the single task must be assigned to
In the response time is time required in the tasks enter the scheme and time of tasks are scheduled. It can be estimated by
Finally, the degree of imbalance can be derived as follows.
Whereas
In this presented method, the removed tasks are deliberated as fly that seeks for appropriate VM depending upon mufti objective functions. The fundamental limitations are follows including the load of the VM, afterward allocating the task shouldn't be higher compared to upper threshold value for selecting an appropriate VM to the removed task. When there is huge amount of VM is presented, then the deadline limitation is deliberated. The task deadline is essential to transfer the task from heavier load VM to lower load VM. When the deadline
This section validates the experimental analysis of the presented SCBMA-RS technique under diverse aspects. The results are examined interms of Average Task Satisfaction Degree (ATSD) and Task Successful Ratio (TSR) under varying task arriving rate (TAR) and population skewness (PS). The values of the ATSD and TSR should be higher for effective allocation of resources in EC environment.
Tab. 1 investigates the comparative outcomes analysis of the SCMBA-RS model interms of ATSD and TSR under different TAR. A brief ATSD analysis of the SCBMA-RS technique with other techniques under distinct TAR is provided in Fig. 5. The figure demonstrated that the SCBMA-RS technique has obtained better performance over the other methods with the maximum ATSD. For instance, with the TAR of 4, the SCBMA-RS model has gained an increased ATSD of 3.17 whereas the DRL, Greedy-FCFS, and Greedy-SJF models have obtained a decreased ATSD of 3.08, 1.30, and 1.70 respectively. Besides, with the TAR of 7, the SCBMA-RS model has accomplished improved performance with the ATSD of 2.23 whereas the DRL, Greedy-FCFS, and Greedy-SJF models have resulted in reduced performance with the ATSD of 2.07, 1.04, and 1.18 respectively.
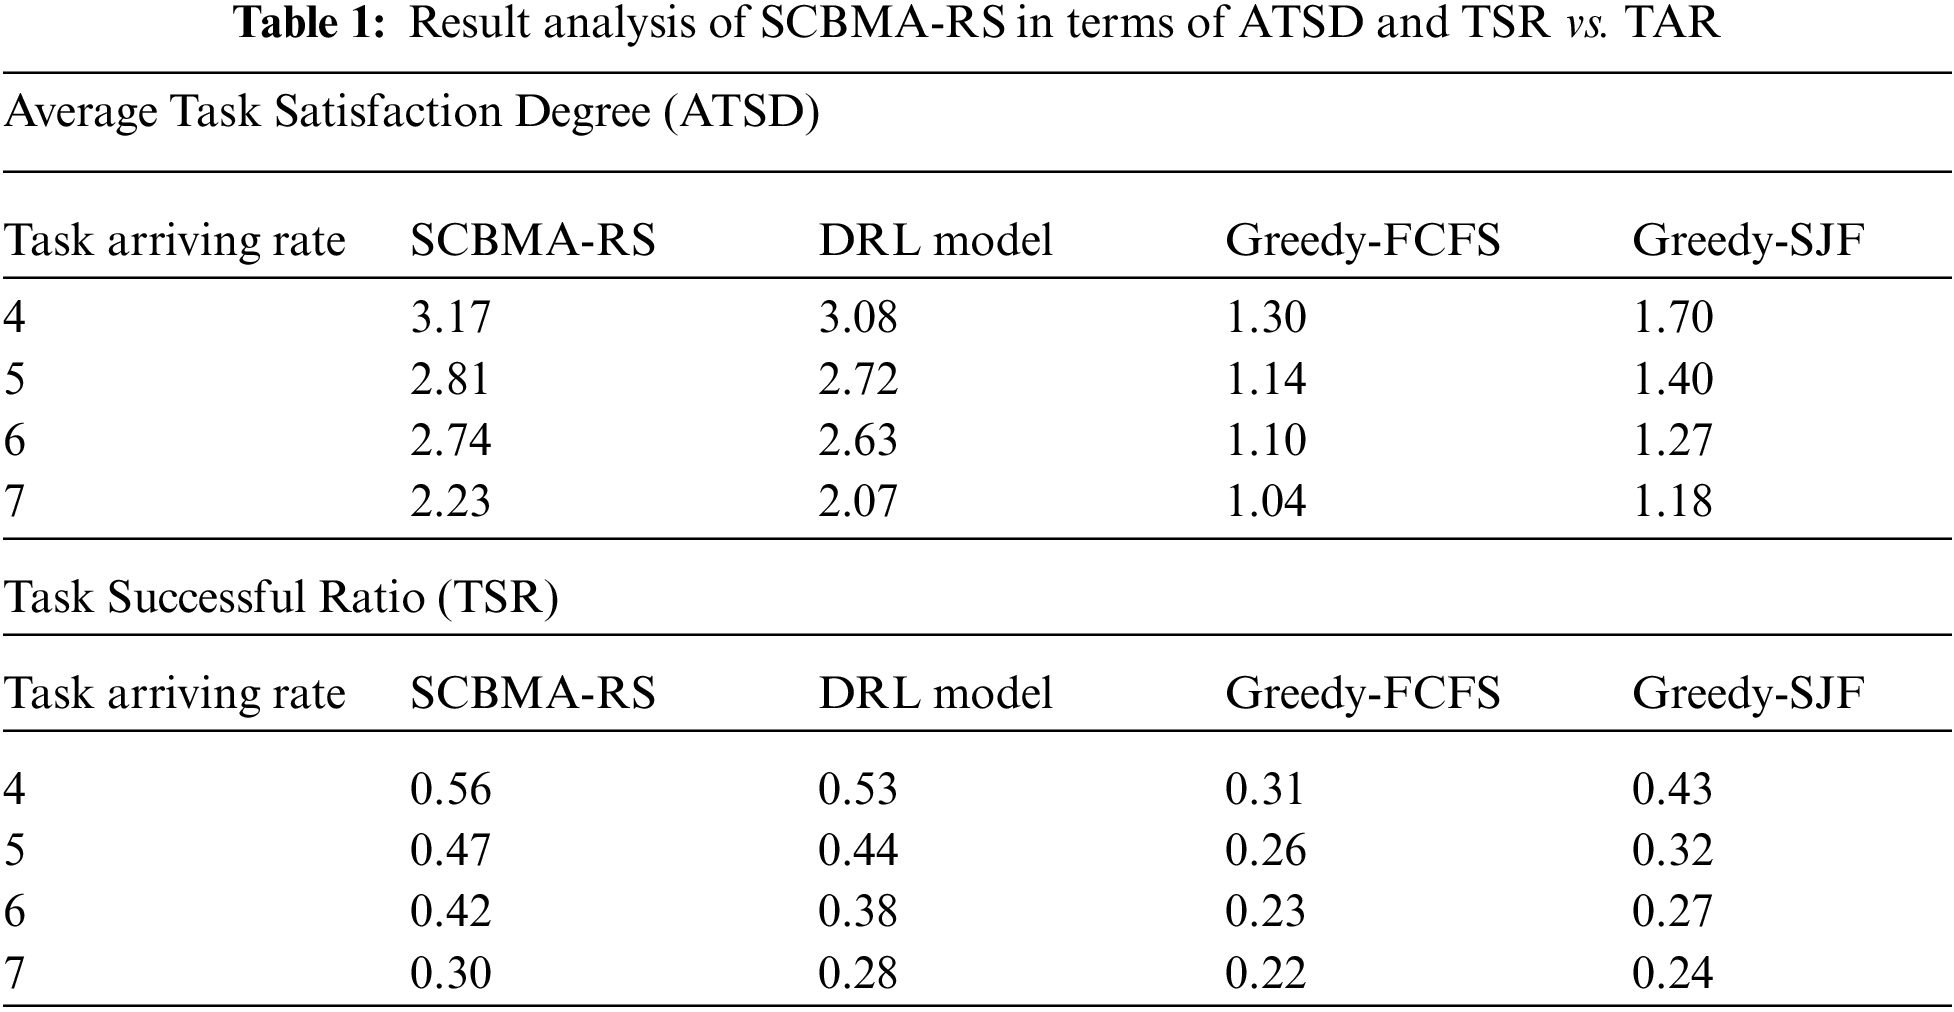

Figure 5: ATSD analysis of SCBMA-RS model in task arriving rate
A detailed TSR analysis of the SCBMA-RS method with other approaches under different TAR is given in Fig. 6. The figure showcased that the SCBMA-RS method has reached optimum performance over the other techniques with the maximal TSR. For instance, with the TAR of 4, the SCBMA-RS manner has gained an improved TSR of 0.56 whereas the DRL, Greedy-FCFS, and Greedy-SJF techniques have attained a lesser TSR of 0.53, 0.31, and 0.43 correspondingly.

Figure 6: TSR analysis of SCBMA-RS model in task arriving rate
Followed by, with the TAR of 7, the SCBMA-RS technique has accomplished higher performance with the TSR of 0.30 whereas the DRL, Greedy-FCFS, and Greedy-SJF algorithms have resulted in minimum performance with the TSR of 0.28, 0.22, and 0.24 correspondingly.
Tab. 2 examines the comparative outcomes analysis of the SCMBA-RS technique with respect to ATSD and TSR under distinct PS.
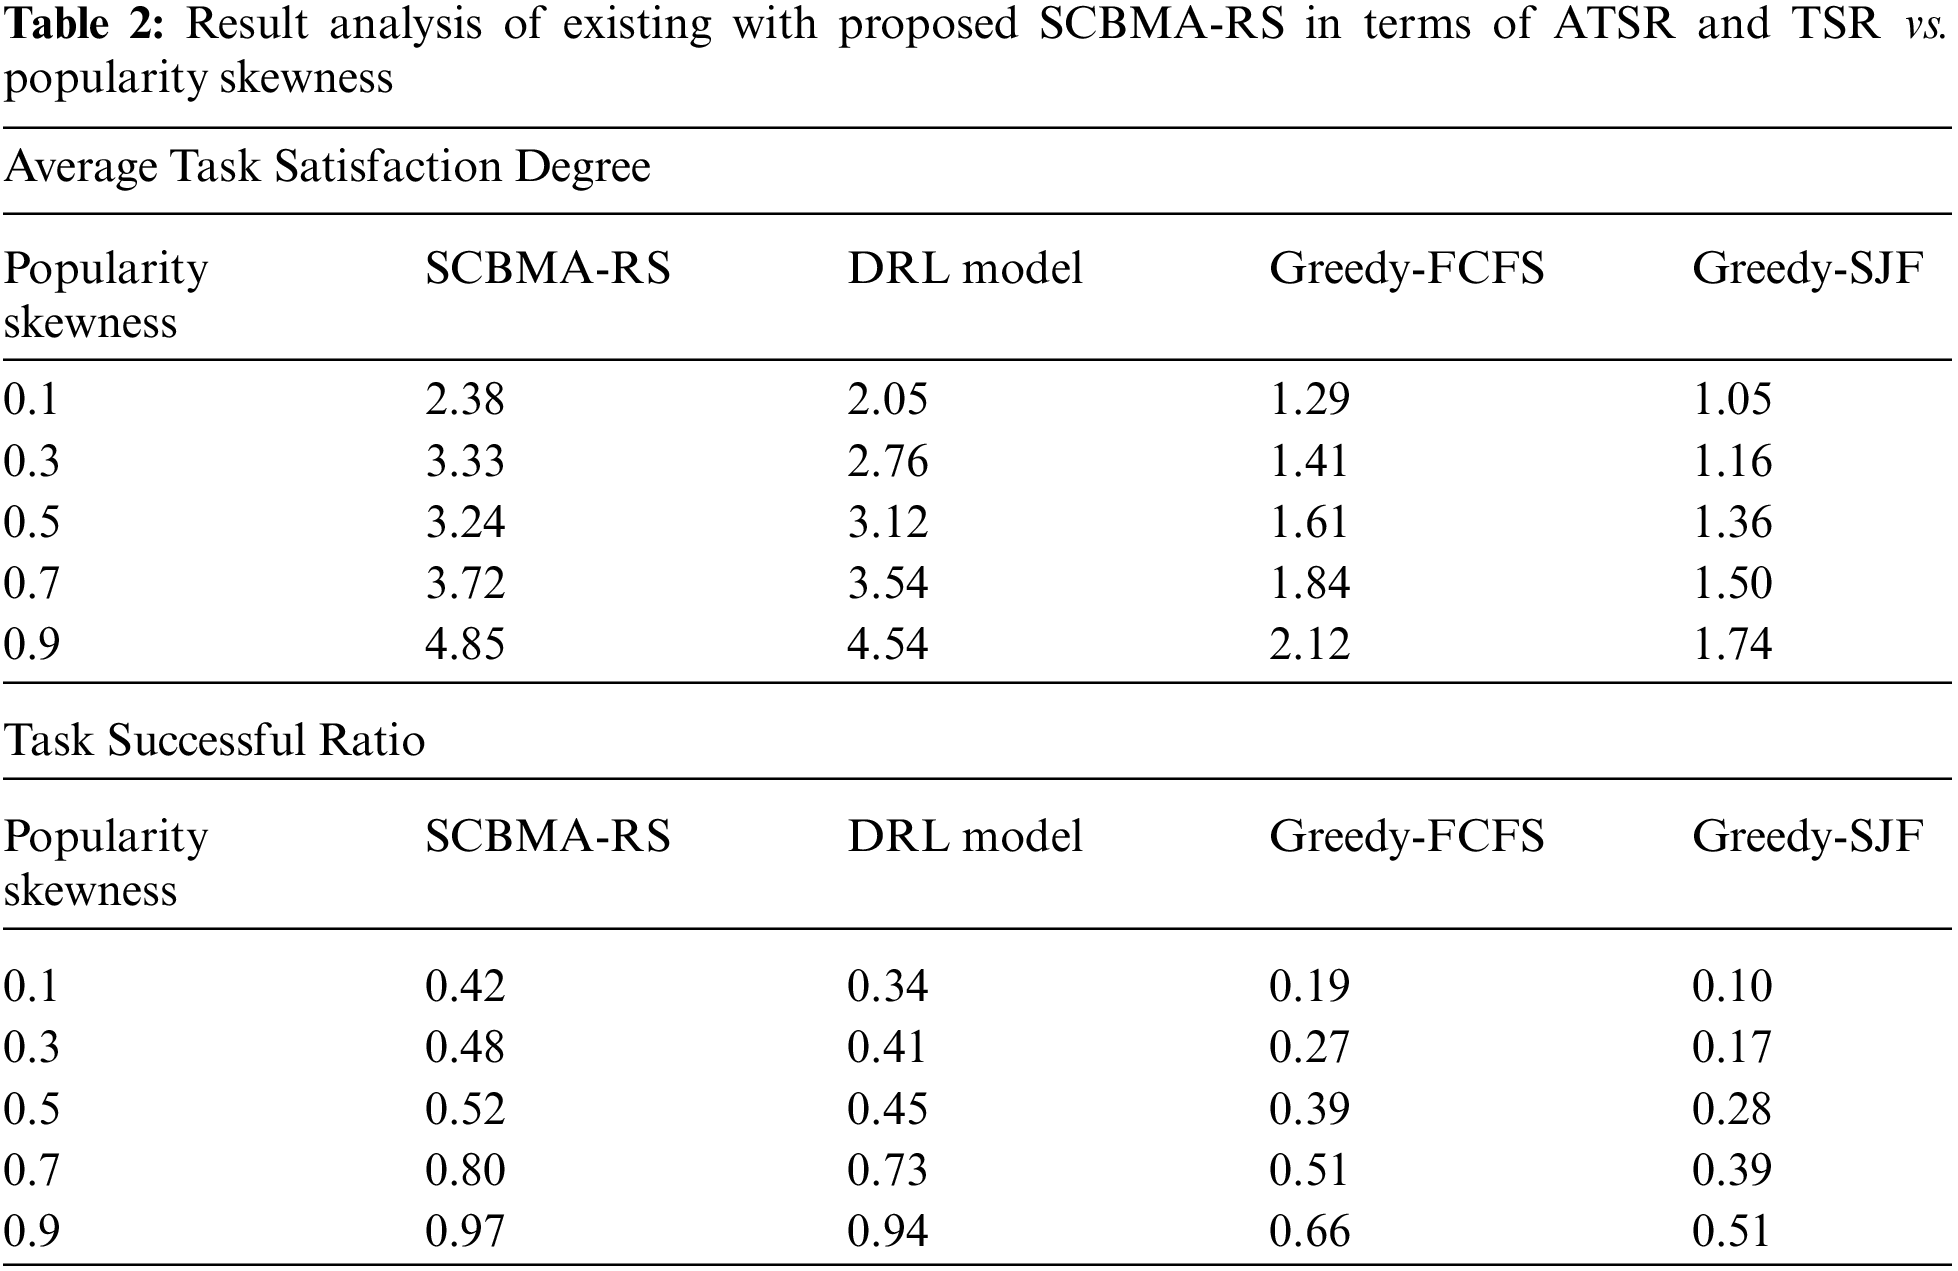
A examining ATSD analysis of the SCBMA-RS approach with other algorithms in different PS is provided in Fig. 7. The figure exhibited that the SCBMA-RS method has achieved optimal performance over the other approaches with the maximal ATSD. For sample, with the PS of 0.1, the SCBMA-RS method has attained a higher ATSD of 2.38 whereas the DRL, Greedy-FCFS, and Greedy-SJF models have achieved a decreased ATSD of 2.05, 1.29, and 1.05 correspondingly. Also, with the PS of 0.9, the SCBMA-RS method has accomplished maximum performance with the ATSD of 4.85 whereas the DRL, Greedy-FCFS, and Greedy-SJF methodologies have resulted in lesser performance with the ATSD of 4.54, 2.12, and 1.74 respectively.

Figure 7: ATSD analysis of SCBMA-RS model in popularity skewness
A brief TSR analysis of the SCBMA-RS method with other algorithms under different PS is given in Fig. 8. The figure outperformed that the SCBMA-RS approach has attained good performance over the other techniques with superior TSR. For instance, with the PS of 0.1, the SCBMA-RS manner has reached a maximal TSR of 0.42 whereas the DRL, Greedy-FCFS, and Greedy-SJF techniques have reached a lesser TSR of 0.34, 0.19, and 0.10 correspondingly. Moreover, with the PS of 0.9, the SCBMA-RS technique has accomplished higher performance with the TSR of 0.97 whereas the DRL, Greedy-FCFS, and Greedy-SJF algorithms have resulted in minimal performance with the TSR of 0.94, 0.66, and 0.51 correspondingly.

Figure 8: TSR analysis of SCBMA-RS model in popularity skewness
In order to further validate the improved performance of the SCBMA-RS model, another ATSD analysis is made under different number of VMs in Tab. 3 and Fig. 9. The resultant experimental results depicted that the SCBMA-RS technique has showcased better performance with the maximum ATSD under all VMs. For instance, under 2 VMs, a higher ATSD of 1.724 has been obtained by the SCBMA-RS technique whereas the DRL, Greedy-FCFS, and Greedy-SJF techniques have demonstrated a lower ATSD of 1.518, 0.907, and 0.975 respectively. Eventually, under 4 VMs, the SCBMA-RS technique has resulted in an improved ATSD of 5.091 whereas the DRL, Greedy-FCFS, and Greedy-SJF techniques have attained a reduced ATSD of 4.728, 1.996, and 2.231 respectively.
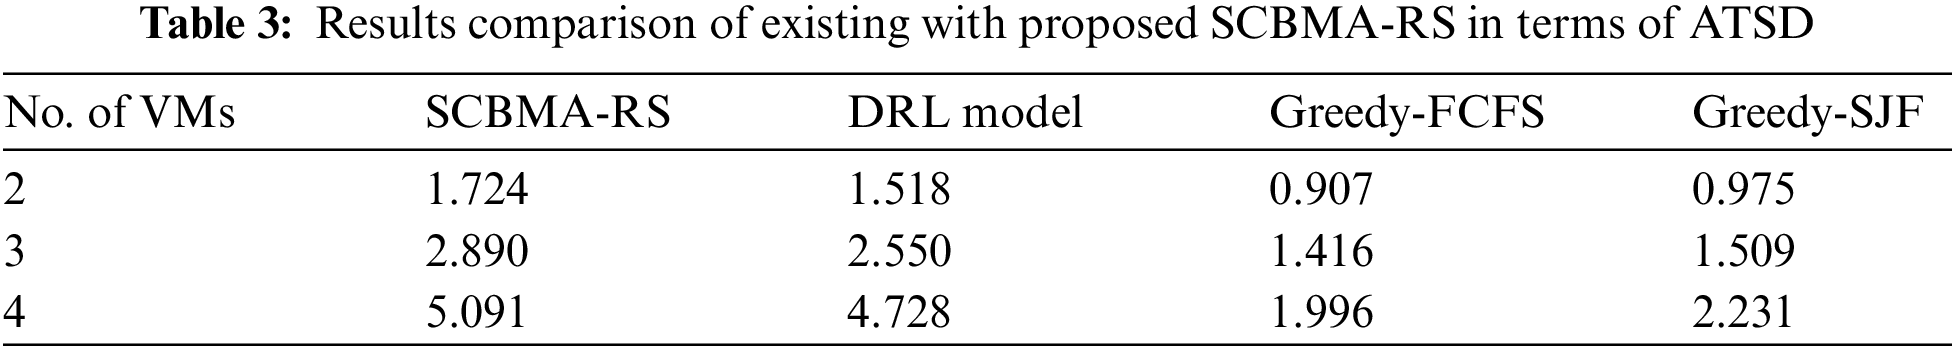

Figure 9: Result analysis of SCBMA-RS model interms of ATSD
To further validate the enhanced performance of the SCBMA-RS method, another TSR analysis is developed in distinct number of VMs in Tab. 4 and Fig. 10. The resultant experimental outcomes exhibited that the SCBMA-RS approach has outperformed optimum performance with the maximal TSR under all VMs. For sample, under 2 VMs, a superior TSR of 0.348 has been attained by the SCBMA-RS model whereas the DRL, Greedy-FCFS, and Greedy-SJF approaches have showcased a minimum TSR of 0.336, 0.172, and 0.174 correspondingly. Finally, under 4 VMs, the SCBMA-RS method has resulted in a higher TSR of 0.587 whereas the DRL, Greedy-FCFS, and Greedy-SJF methodologies have reached a lesser TSR of 0.569, 0.460, and 0.561 correspondingly.
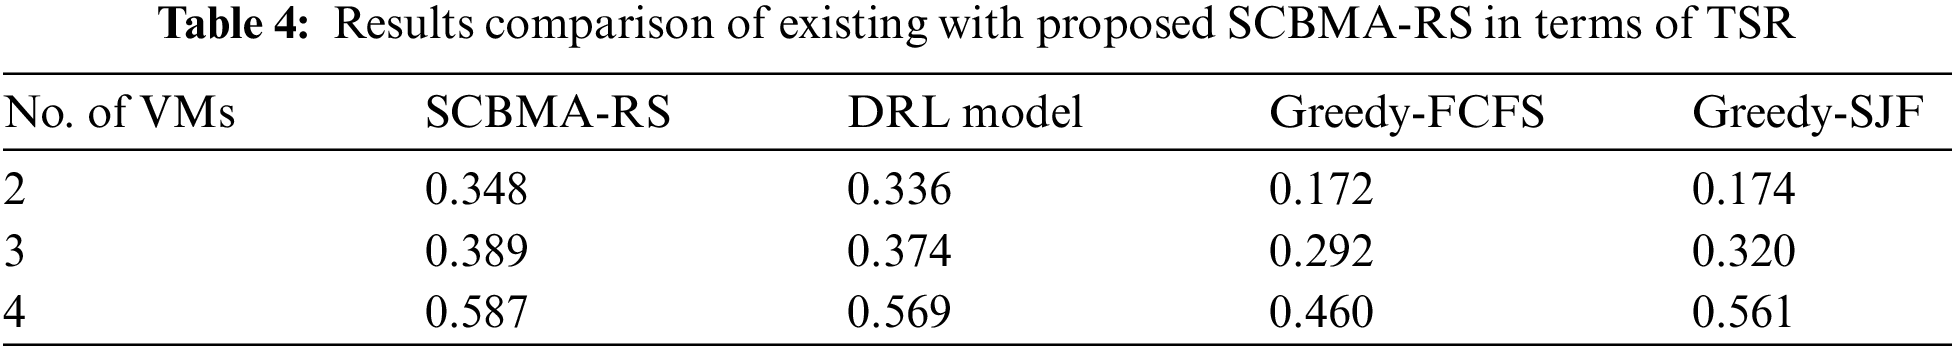

Figure 10: Result analysis of SCBMA-RS model interms of TSR
From the above mentioned tables and figures, it can be depicted that the proposed model is found to be an efficiency tool for scheduling resources from the EC environment.
This paper has developed an effective SCBMA-RS technique to effectively schedule resources in EC environment. The SCBMA-RS model derives a fitness function to identify and allocate resources to every incoming user request in such a way, that the client's necessities are satisfied with the minimum number of possible resources and optimal energy consumption. In the SCBMA-RS method, the incorporation of the GTOA and RSO algorithms helps to improvise the allocation of resources among VMs in the data center. A series of simulations were performed by the use of the CloudSim tool and the outcomes are inspected interms of distinct performance measures. The experimental results showcased the superior performance of the SCBMA-RS model interms of different measures. In future, the secure data transmission from the EC environment can be accomplished by the use of lightweight cryptographic techniques.
Funding Statement: This research was supported by Hankuk University of Foreign Studies Research Fund of 2021. Also, This research was supported by the MIST (Ministry of Science, ICT), Korea, under the National Program for Excellence in SW), supervised by the IITP (Institute of Information & communications Technology Planing & Evaluation) in 2021"(2019-0-01816).
Conflicts of Interest: The authors declare that they have no conflicts of interest to report regarding the present study.
1. J. Lin, W. Yu, N. Zhang, X. Yang, H. Zhang et al., “A survey on Internet of Things: Architecture, enabling technologies, security and privacy, and applications,” IEEE Internet Things Journal, vol. 4, no. 5, pp. 1125–1142, 2017. [Google Scholar]
2. N. Abbas, Y. Zhang, A. Taherkordi and T. Skeie, “Mobile edge computing: A survey,” IEEE Internet Things Journal, vol. 5, no. 1, pp. 450–465, 2018. [Google Scholar]
3. J. Yan, S. Bi and Y. J. A. Zhang, “Offloading and resource allocation with general task graph in mobile edge computing: A deep reinforcement learning approach,” IEEE Transactions on Wireless Communications, vol. 19, no. 8, pp. 5404–5419, 2020. [Google Scholar]
4. K. Peng, V. C. M. Leung, X. Xu, L. Zheng, J. Wang et al., “A survey on mobile edge computing: Focusing on service adoption and provision,” Wireless Communications and Mobile Computing, vol. 2018, pp. 1–16, 2018. [Google Scholar]
5. F. Guo, H. Zhang, H. Ji, X. Li and V. C. M. Leung, “An efficient computation offloading management scheme in the densely deployed small cell networks with mobile edge computing,” IEEE/ACM Transactions on Networking, vol. 26, no. 6, pp. 2651–2664, 2018. [Google Scholar]
6. S. Guo, J. Liu, Y. Yang, B. Xiao and Z. Li, “Energy-efficient dynamic computation offloading and cooperative task scheduling in mobile cloud computing,” IEEE Trans. on Mobile Computing, vol. 18, no. 2, pp. 319–333, 2019. [Google Scholar]
7. F. Song, Z. Ai, Y. Zhou, I. You, K. K. R. Choo et al., “Smart collaborative automation for receive buffer control in multipath industrial networks,” IEEE Transactions on Industrial Informatics, vol. 16, no. 2, pp. 1385–1394, 2020. [Google Scholar]
8. J. Du, L. Zhao, J. Feng and X. Chu, “Computation offloading and resource allocation in mixed fog/cloud computing systems with min-max fairness guarantee,” IEEE Transactions on Communications, vol. 66, no. 4, pp. 1594–1608, 2018. [Google Scholar]
9. Y. Sahni, J. Cao and L. Yang, “Data-aware task allocation for achieving low latency in collaborative edge computing,” IEEE Internet Things Journal, vol. 6, no. 2, pp. 3512–3524, 2019. [Google Scholar]
10. L. Cui, C. Xu, S. Yang, J. Z. Huang, J. Li et al., “Joint optimization of energy consumption and latency in mobile edge computing for Internet of Things,” IEEE Internet Things Journal, vol. 6, no. 3, pp. 4791–4803, 2019. [Google Scholar]
11. Z. Zhang, F. R. Yu, F. Fu, Q. Yan and Z. Wang, “Joint offloading and resource allocation in mobile edge computing systems: An actor-critic approach,” in 2018 IEEE Global Communications Conf. (GLOBECOM), Abu Dhabi, United Arab Emirates, pp. 1–6, 2018. [Google Scholar]
12. R. S. Pereira, D. D. Lieira, M. A. C. d. Silva, A. H. M. Pimenta, J. B. D. d. Costa et al., “RELIABLE: Resource allocation mechanism for 5g network using mobile edge computing,” Sensors, vol. 20, no. 19, pp. 5449, 2020. [Google Scholar]
13. Q. Qi, J. Wang, Z. Ma, H. Sun, Y. Cao et al., “Knowledge-driven service offloading decision for vehicular edge computing: A deep reinforcement learning approach,” IEEE Transactions on Vehicular Technology, vol. 68, no. 5, pp. 4192–4203, 2019. [Google Scholar]
14. X. Xu, Y. Li, T. Huang, Y. Xue, K. Peng et al., “An energy-aware computation offloading method for smart edge computing in wireless metropolitan area networks,” Journal of Network and Computer Applications, vol. 133, pp. 75–85, 2019. [Google Scholar]
15. G. Li, S. Xu, J. Wu and H. Ding, “Resource scheduling based on improved spectral clustering algorithm in edge computing,” Scientific Programming, vol. 2018, pp. 1–13, 2018. [Google Scholar]
16. X. Li, J. Wan, H. N. Dai, M. Imran, M. Xia et al., “A hybrid computing solution and resource scheduling strategy for edge computing in smart manufacturing,” IEEE Transactions on Industrial Informatics, vol. 15, no. 7, pp. 4225–4234, 2019. [Google Scholar]
17. J. Wang and L. Wang, “A computing resource allocation optimization strategy for massive internet of health things devices considering privacy protection in cloud edge computing environment,” Journal of Grid Computing, vol. 19, no. 2, pp. 17, 2021. [Google Scholar]
18. S. Vimal, M. Khari, N. Dey, R. G. Crespo and Y. H. Robinson, “Enhanced resource allocation in mobile edge computing using reinforcement learning based MOACO algorithm for IIOT,” Computer Communications, vol. 151, pp. 355–364, 2020. [Google Scholar]
19. Y. Zhang, Y. Liu, J. Zhou, J. Sun and K. Li, “Slow-movement particle swarm optimization algorithms for scheduling security-critical tasks in resource-limited mobile edge computing,” Future Generation Computer Systems, vol. 112, pp. 148–161, 2020. [Google Scholar]
20. V. Porkodi, A. R. Singh, A. R. W. Sait, K. Shankar, E. Yang et al., “Resource provisioning for cyber–physical–social system in cloud-fog-edge computing using optimal flower pollination algorithm,” IEEE Access, vol. 8, pp. 105311–105319, 2020. [Google Scholar]
21. M. G. Arani, A. Souri, F. Safara and M. Norouzi, “An efficient task scheduling approach using moth-flame optimization algorithm for cyber-physical system applications in fog computing,” Transactions on Emerging Telecommunications Technologies, vol. 31, no. 2, pp. 1–14, 2020. [Google Scholar]
22. S. Sheng, P. Chen, Z. Chen, L. Wu and Y. Yao, “Deep reinforcement learning-based task scheduling in iot edge computing,” Sensors, vol. 21, no. 5, pp. 1666, 2021. [Google Scholar]
23. G. Li, Y. Liu, J. Wu, D. Lin and S. Zhao, “Methods of resource scheduling based on optimized fuzzy clustering in fog computing,” Sensors, vol. 19, no. 9, pp. 2122, 2019. [Google Scholar]
24. S. Vimal, M. Khari, R. G. Crespo, L. Kalaivani, N. Dey et al., “Energy enhancement using multiobjective ant colony optimization with double Q learning algorithm for IoT based cognitive radio networks,” Computer Communications, vol. 154, pp. 481–490, 2020. [Google Scholar]
25. J. Cheng and H. Jin, “Structural reliability analysis using group teaching optimization algorithm,” in IOP Conference Series: Earth and Environmental Science, IOP Publishing, vol. 719, No. 2, pp. 1--8, 2021. [Google Scholar]
26. G. Dhiman, M. Garg, A. Nagar, V. Kumar and M. Dehghani, “A novel algorithm for global optimization: Rat swarm optimizer,” Journal of Ambient Intelligence and Humanized Computing, vol. 12, no. 8, pp. 8457–8482, 2021. [Google Scholar]
27. M. Lawanyashri, B. Balusamy and S. Subha, “Energy-aware hybrid fruitfly optimization for load balancing in cloud environments for EHR applications,” Informatics in Medicine Unlocked, vol. 8, pp. 42–50, 2017. [Google Scholar]
 | This work is licensed under a Creative Commons Attribution 4.0 International License, which permits unrestricted use, distribution, and reproduction in any medium, provided the original work is properly cited. |