DOI:10.32604/cmc.2022.025629
| Computers, Materials & Continua DOI:10.32604/cmc.2022.025629 | |
| Article |
A Novel Convolutional Neural Network Model for Malaria Cell Images Classification
1Faculty of Artificial Intelligence, Kafrelsheikh University, Kafrelsheikh, 33511, Egypt
2Department of Information Technology, Faculty of Computers and Information, Mansoura University, Mansoura, 35516, Egypt
3Department of Computer Science, Faculty of Computers and Information, Mansoura University, Mansoura, 35516, Egypt
*Corresponding Author: Esraa Hassan. Email: esraa.hassan@ai.kfs.edu.eg
Received: 30 November 2021; Accepted: 23 March 2022
Abstract: Infectious diseases are an imminent danger that faces human beings around the world. Malaria is considered a highly contagious disease. The diagnosis of various diseases, including malaria, was performed manually, but it required a lot of time and had some human errors. Therefore, there is a need to investigate an efficient and fast automatic diagnosis system. Deploying deep learning algorithms can provide a solution in which they can learn complex image patterns and have a rapid improvement in medical image analysis. This study proposed a Convolutional Neural Network (CNN) model to detect malaria automatically. A Malaria Convolutional Neural Network (MCNN) model is proposed in this work to classify the infected cases. MCNN focuses on detecting infected cells, which aids in the computation of parasitemia, or infection measures. The proposed model achieved 0.9929, 0.9848, 0.9859, 0.9924, 0.0152, 0.0141, 0.0071, 0.9890, 0.9894, and 0.9780 in terms of specificity, sensitivity, precision, accuracy, F1-score, and Matthews Correlation Coefficient, respectively. A comparison was carried out between the proposed model and some recent works in the literature. This comparison demonstrates that the proposed model outperforms the compared works in terms of evaluation metrics.
Keywords: Deep learning; malaria dataset; diagnostic medical approach
Malaria is a deadly infectious disease that is found in almost every region of the world. Plasmodium parasites cause it, and it spreads to humans through the bites of infected female mosquitoes, as investigated in Fig. 1 [1,2]. Manual malaria diagnostic microscopy is also very time-consuming in many of its phases, Instance-Aware Semantic Segmentation via Multi-Task Network Cascades. An automated method is needed to determine the variety of scenarios that have been previously realized to achieve a standard solution to manage such diseases. Currently, some work has been performed in the field of medical image processing to help detect this disease [3]. In general, a computer-assisted scheme can be used to rapidly diagnose and prognosticate the enrolled feature in order to obtain a suitable decision scheme [4,5]. It can obtain a standard benchmark of measurement to determine the degree of infection disease depending on convolutional neural networks (CNN), which can simulate the mechanism of the human brain [6,7]. Moreover, it can allow doctors to refine the precision of the early detection process, measure the strengthening of diagnosis, and decrease the risk control measurements, as well as reduce the treatment costs [8]. The Malaria Convolutional Neural Network (MCNN) model is capable of robust identification of malaria. It resolves many drawbacks of current diagnostic models [9,10]. MCNN is an accurate model in a time-saving way with transfer learning, instead of starting the learning process scratch to avoid starting from scratch. It simply depends on the pre-trained model with changes in the last layers to be compatible with malaria cell input images. Several literature searches suggested disparate diagnosis approaches for malaria cell imaging detection [11]. The parameters of the erythrocyte play a crucial role in the classification of infected erythrocytes [12,13]. Some of them have addressed the issue of erythrocyte analysis in the classification of infected cases, while others have discussed the challenges of malaria detection. In this paper, an MCNN model for the detection of infected red blood cells in thin smears based on microscope images, which are implemented using an effective method, is proposed. A Deep Learning (DL)-based MCNN architecture for two-dimensional images are the major pros of CNN model and the hierarchical structure of the applied learning layers, which are trained to match the features extracted from malaria cell images and indicate the model's ability to reduce the number of learned parameters using optimization algorithms [14–16].

Figure 1: The malaria infection by female mosquitoes
This proposed model can handle the sequence of streamlined image problems using segmentation and filtering algorithms with an automated characteristic to enhance the identification process of its architecture. Therefore, the accuracy of the identification process is enhanced by boosting the previously extracted features. The detection of infected cells is realized to assist the calculation process of parasitemia, which indicates the measure of infection. This paper is organized as follows: Section 2 introduces related works. Section 3 introduces the proposed work. Section 4 shows experimental results and their analysis. The conclusions were presented in Section 6.
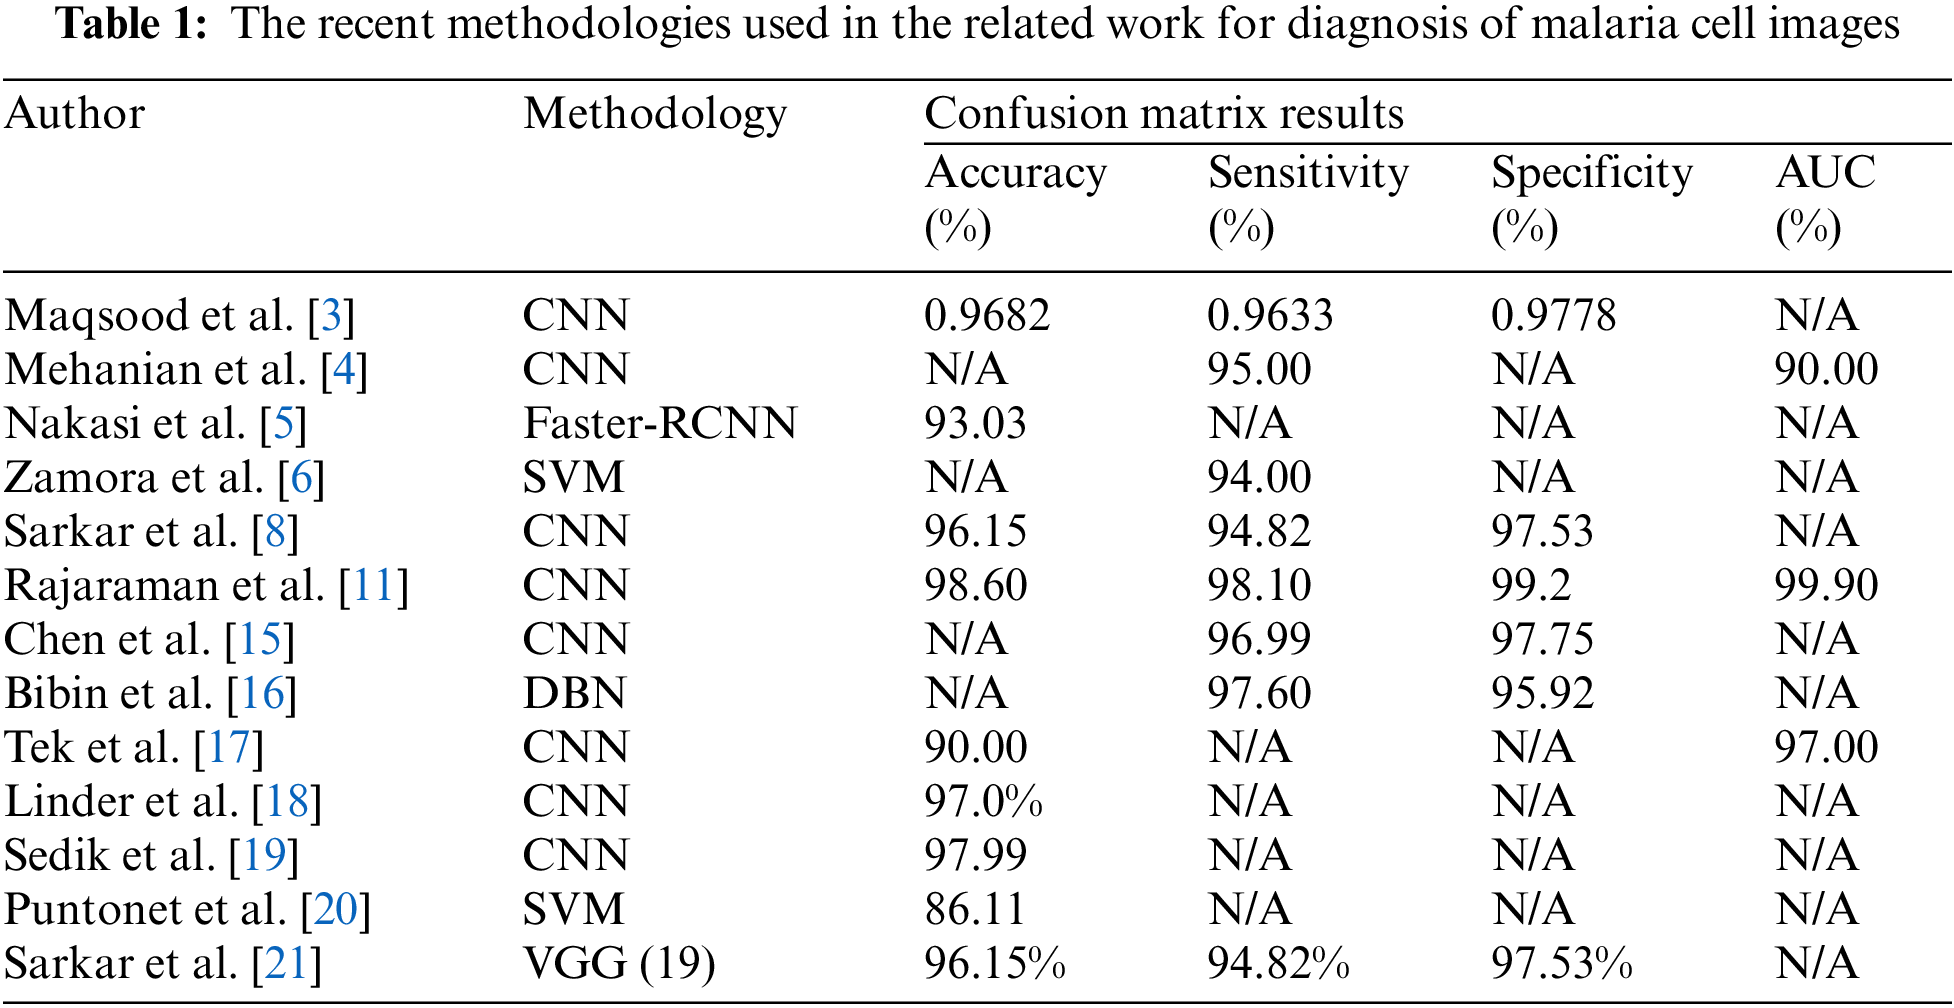
This section introduces the most recent efforts related to the proposed MCNN. Recently, many researchers have been working on different issues to solve the malaria diagnosis challenges shown in Tab. 1. Maqsood et al. [3] presented a CNN model by using image augmentation operations for the enhancement of features of red blood cells before the training phase. The results were executed on the malaria dataset and reached 96.82%. Mehanian et al. [4] proposed a model for automatic malarial parasite detection that uses the patient assessment and thumbnails to increase the trained model for single-cell image feature extraction and classification. A pre-trained ResNet50 model is used for diagnosis. Their work achieved a specificity of 96.8%, a sensitivity of 96.8%, and an F-score of 96.5% when applied to a small dataset. Nakasi et al. [5] suggested a model for the detection of infected animals and humans with malaria infection. The trained model has a mean average accuracy of over 94.1%, and Single-Shot Multi-Box Detector (SSD) was the faster of the R algorithms. Traditional machine learning methods, such as those proposed by [6], have been used to classify an automated blood cell that was used for the detection of blood smear images of malaria erythrocytes. This model achieved 94.0% sensitivity on 450 images. Tek et al. [17] proposed target detection models based on a traditional cell segmentation approach and the extraction of several single-cell features. The classification task is based on using a faster region-based CNN. They achieved 98.6% accuracy, 98.1 percent sensitivity, 99.2 percent precision, and a 95.7 percent F1-score. Linder et al. [18] presented a CNN model with sixteen layers of the parasite malarial. In this work, several images are utilized to train the model. This work achieved 97.0% accuracy in classifying blood cells as contaminated or uninfected. Sedik et al. [19] directly extracted and classified features from raw segmented patches of red blood smeared using DL algorithms. The accuracy and loss assessment metrics, as well as 5-fold cross-validation, were used to evaluate and pick the best performing architecture. Their best model achieved a precision of 97.77%. This work achieved an accuracy of 98.6%, 98.10% sensitivity, 99.20% precision, 90.00% Area Under Curve (AUC) and 95.70% F1-score. Conventional cell segmentation methods based on goal detection algorithms were presented by [20]. Sarkar et al. [21] describe a shallow CNN architecture for thin blood smear RBC slide pictures for malaria diagnosis that achieves the same classification accuracy as the VGG-16 and Resnet-50 models while reducing computational run time by an order of magnitude.
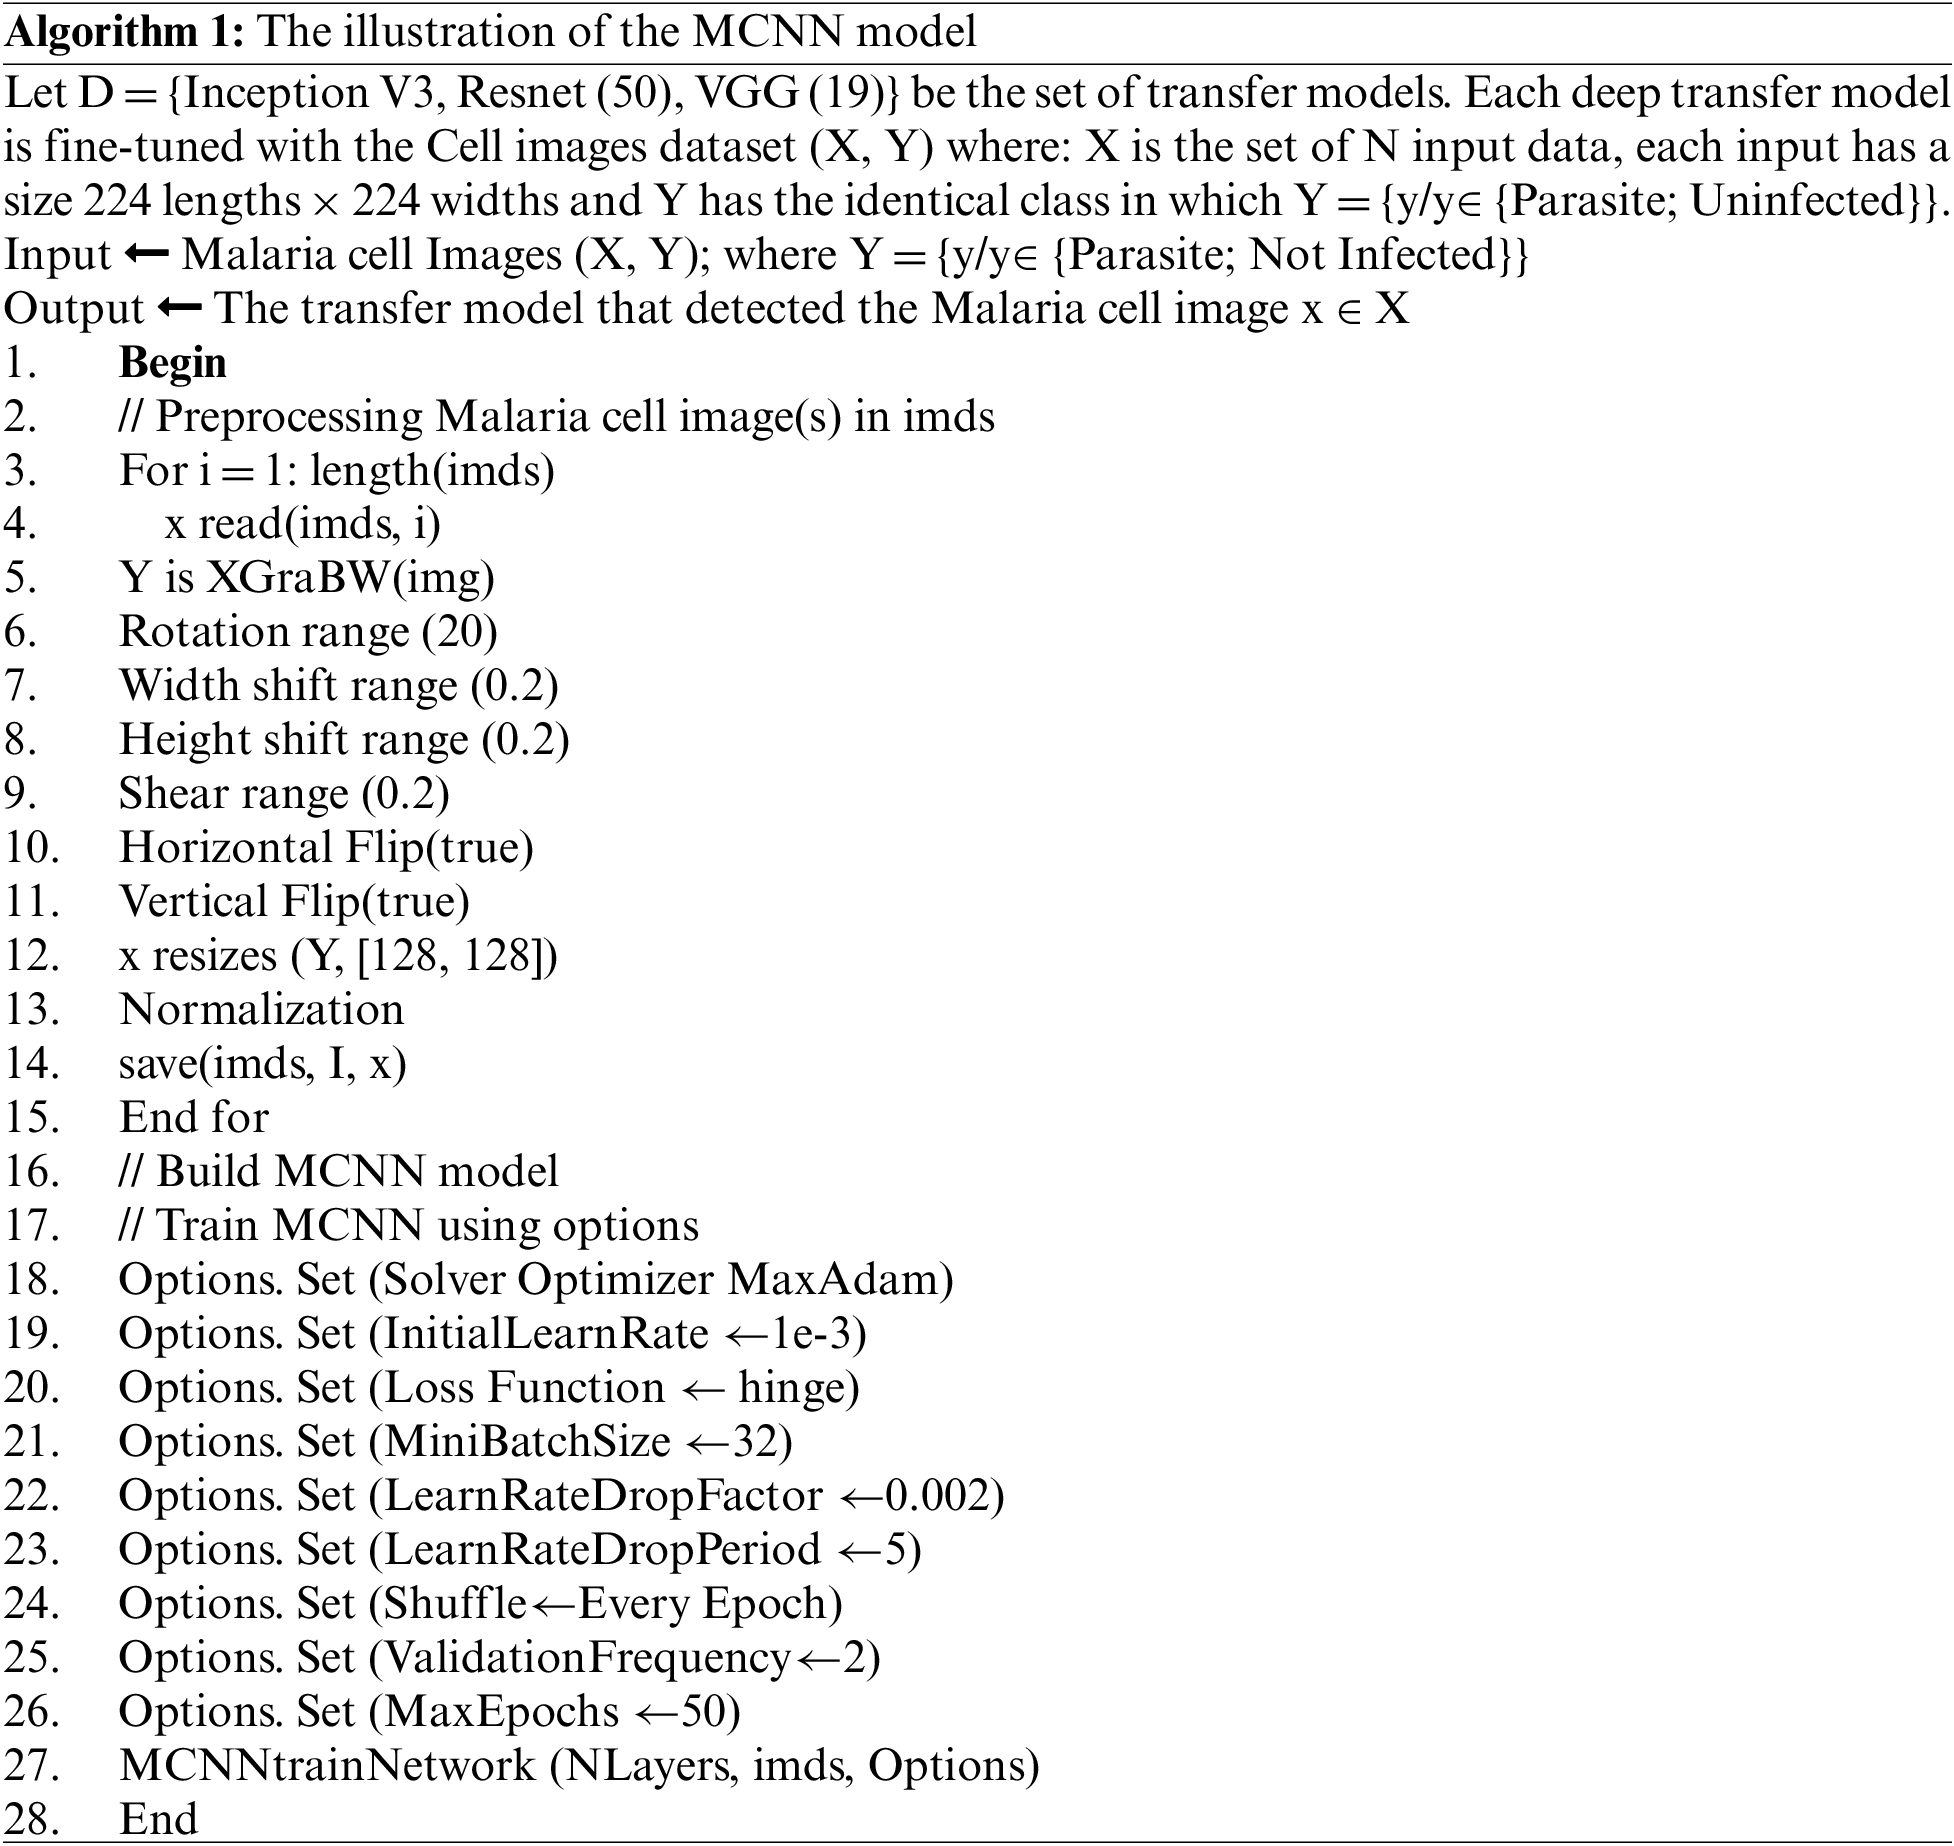
This paper relies on microscopy images to diagnose malaria cell images using a proposed MCNN model. Fig. 2 and Algorithm 1 depict the architecture of the MCNN model, which has four key steps: (i) Data preprocessing; (ii) pre-trained and fine-tuned model; (iii) Extraction of selected features; and (iv) Classification and loss function determination. Throughout the preprocessing stage, the input image is processed by using different steps, including localization, segmentation, and normalization. Afterward, the data is augmented in both the training and testing phases. The augmentation is essential for dealing with insufficient training data and allowing for a reduction in training time [22]. Feature extraction is used to choose the most powerful parameters [23], which yields a decrease in the complexity of the model. During the learning process, the classifier minimizes the error for each piece of training data. MCNN for cell image classification is based on the learning of transfer where Algorithm 1 describes the general steps for it. The structure of the proposed MCNN contains nine basic stages; the first stage is the utilization and importation of the required libraries including Keras and tensor flaws. The second stage is the loading of the benchmark databases based on the Image Net architecture and the third stage is the splitting of the enrolled data into three categories, which are training, testing, and validation.
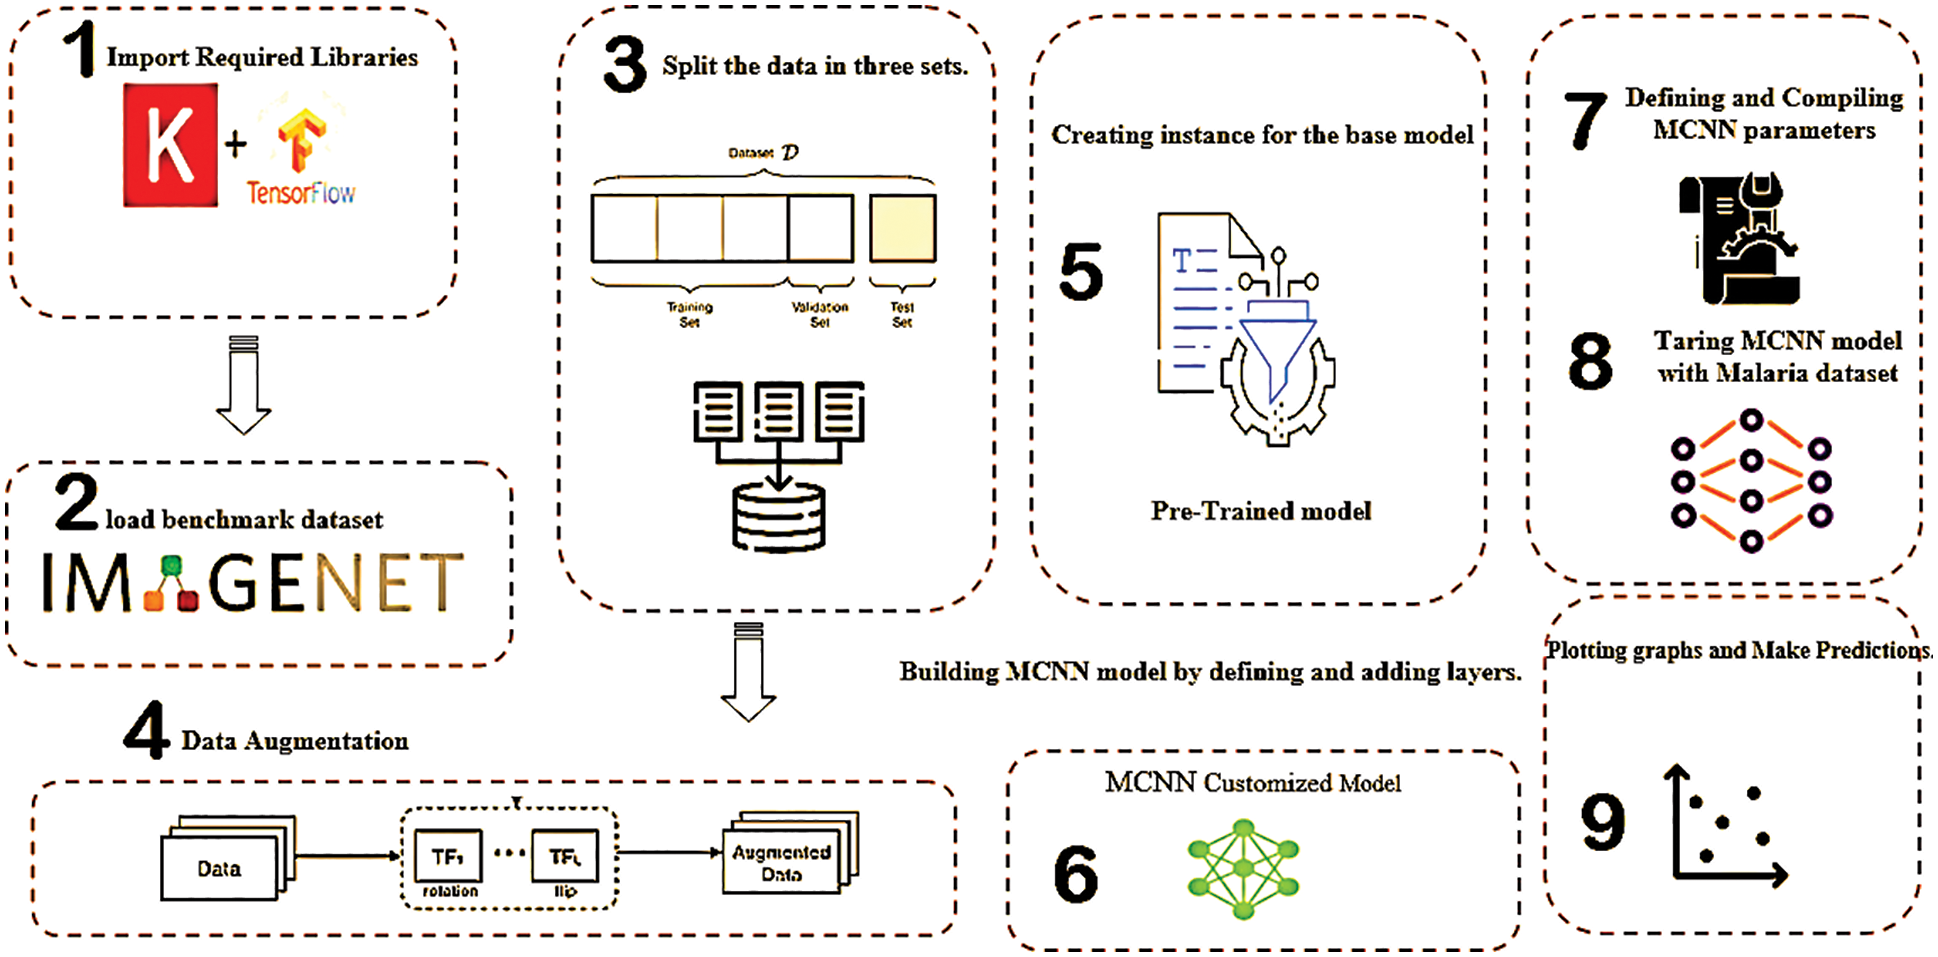
Figure 2: The main outlines of the proposed work
To ensure the reliability of the proposed MCNN using a large-scale database, the augmentation of the enrolled data is highly required. Therefore, using rotation and flipping based on the geometry augmentation process [x1, x2] is helpful to enlarge the enrolled data. In the fourth stage, data augmentation is performed before and after the data splitting. Afterward, in the sixth stage, customization based on the MCNN architecture is realized. To train the CNN model with the malaria dataset, defining and compiling MCNN is performed for the pre-trained model. Finally, in the ninth stage, plotting graphs and making predictions are achieved based on the trained, tested, and validated data. The following subsections describe the details of MCNN.
Data preprocessing is an essential step in preparing data for use in model training and testing by the transformation of training set data. The information gathered is then stored in a Comma Separated Values (CSV) excel file. The data is then analyzed to prepare it for use in the following phases. Data processing is divided into two stages: (i) Data Augmentation: It is used to enlarge the dataset based on certain changes, such as the rotation range of 20 degrees, the width shift range with a value of 0.2, the height shift range with a value of 0.2, and the shear range with a value of 0.2, and then applying the horizontal and vertical flipping. (ii) Data normalization: The process of converting non-numerical data to a standardized numeric representation. Fig. 3 shows the results of data preprocessing.
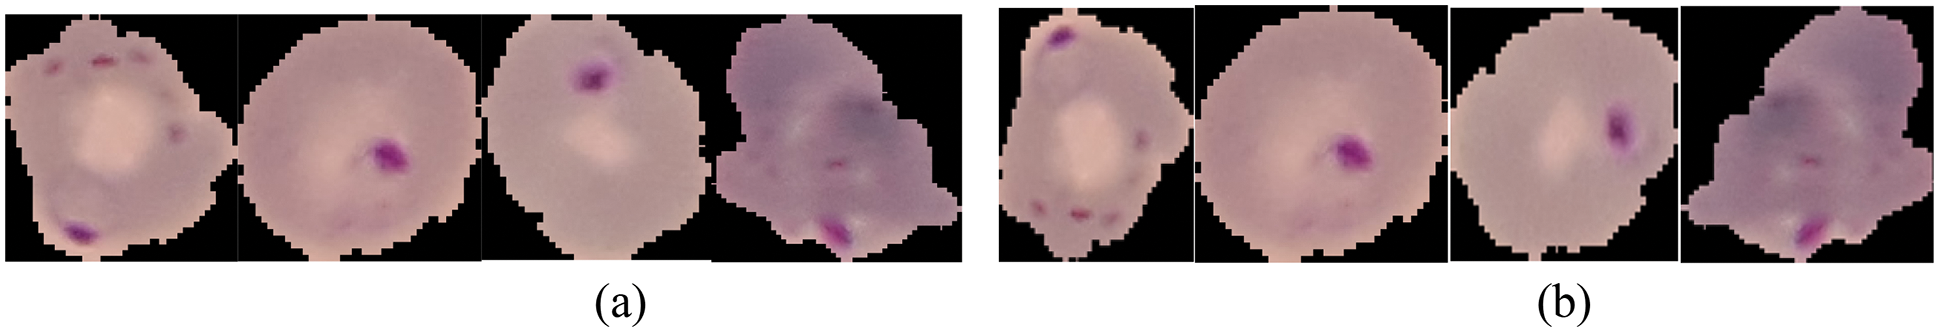
Figure 3: The data pre-processing includes: (a) Original images before Pre-processing, (b) Original images after Pre-processing
The proposed MCNN model uses a large amount of data that is already pre-trained and tunned. From this point, the model is learned based on a hierarchy coherent feature that is spatially static with rotationally, and translationally characteristic to generate the augmented data in relation to the features studied by CNN models. As a result, the MCNN model can serve as an ideal extractor for learning useful feature extraction from large images belonging to a variety of groups. Pre-trained models [24] that had been trained on a large number of images are used in the proposed model. Replacing final layers with new layers learn malaria dataset-specific features according to each pre-trained model [25,26].
A pre-trained model is a model created by benchmark datasets to solve a similar challenge. Instead of building a model from scratch to solve a similar problem, as a starting point, this study used the three commonly mentioned models that have been trained on other problems.
Furthermore, to remedy the lack of data and training time, the transfer learning technique was implemented using ImageNet data. Images are used as data, and Inception V3 is used to perform convolution, pooling, softmax, and completely connected layers. The dataset is split into different training modules when it comes to completion. Furthermore, applying the transfer learning approach is performed using the ImageNet dataset to solve the training time and data constraints [27].
3.2.2 Residual Neural Network (ResNet50)
The MCNN model was trained depending on the residual blocks to pass the data through the cross-layer. At this stage, it skips the link function to prevent the gradient from disappearing. ResNet50 is divided into five parts, each with its own convolution and identity block. It has over 23 million trainable parameters [9].
3.2.3 Visual Geometry Group (VGG16)
One of the strongest CNN vision models is VGG16. The most distinguishing characteristic of VGG16 is that, rather than having many hyper-parameter values, they concentrated on taking 33 filter convolution layers with a 1 stride and remaining the same padding with a max-pooling layer with a stride of 2 and a 22 filter. The maximum pooling in convolution layers is structured in the same way in the design. Finally, for production, this model has two Fully Connected Layers (FC) followed by a SoftMax. The number 16 in VGG16 refers to the fact that there are 16 layers of varying weights. With approximately 138 million parameters, this network is considered very large [28].
3.2.4 Visual Geometry Group (VGG19)
VGG (19) is a Deep Convolutional Neural Network (DCNN) that is widely used to recognize objects. It can be modified for other similar tasks in deep learning architecture [2]. The weights of this model are readily available in other systems, such as the Keras library.
At this stage, the input data with different sizes have been stored to create the augmented images. Based on the desired image size, the data is stored as input arguments for the activation function. The network creates a hierarchical structure out of the input images. When combining lower-level features with the higher-level ones in earlier layers, the deeper layers are created. At the network's end, the global pooling layer is enabled to obtain image features. The input characteristics are pooled across all spatial locations in the global pooling layer. FS is used to choose the most suitable features for detection and to reduce the sophistication of the detection model as well as the dimensionality of the input data. As a stand-alone program, the pre-trained model will extract features from cell images. In fact, an image's derived features could be a vector of pixels that the model uses to reflect the image's basic characteristics. These characteristics can then be used as inputs for a new model to be developed. To represent a given input, these layers may construct a complex collection of features. The pre-trained model can be used to extract characteristics from malaria cell images as a stand-alone program. Area feature extractors process of square image neighborhoods and the resulting feature vector is shown as the image's central pixel [29].
3.4 Classifier and Loss Function (CL)
The pre-trained model can be used to extract features from cell images. In fact, an image's derived features can be a vector of numbers that will be used by the model to represent the basic features in an image. In the creation of a new model, these characteristics will then be used as input [30]. To represent a given input image, these layers will have a complicated collection of features that can provide valuable input when training a new image recognition model or related computer vision tasks. Based on the discussion of this study, the image can be loaded and prepared for the model as demonstrated in the previous example. The current study loads the sample with the model output part of the classifier but delete the final output layer manually. This means that the latest output layer would be the second last entirely connected layer. The DCNN architecture learns a function through convolution, nonlinear activation, and pooling layers. CNN is used to identify parasites in Red Green Blue (RGB) representations of infected cells [31].
3.5 The Training Phase of the Proposed Model
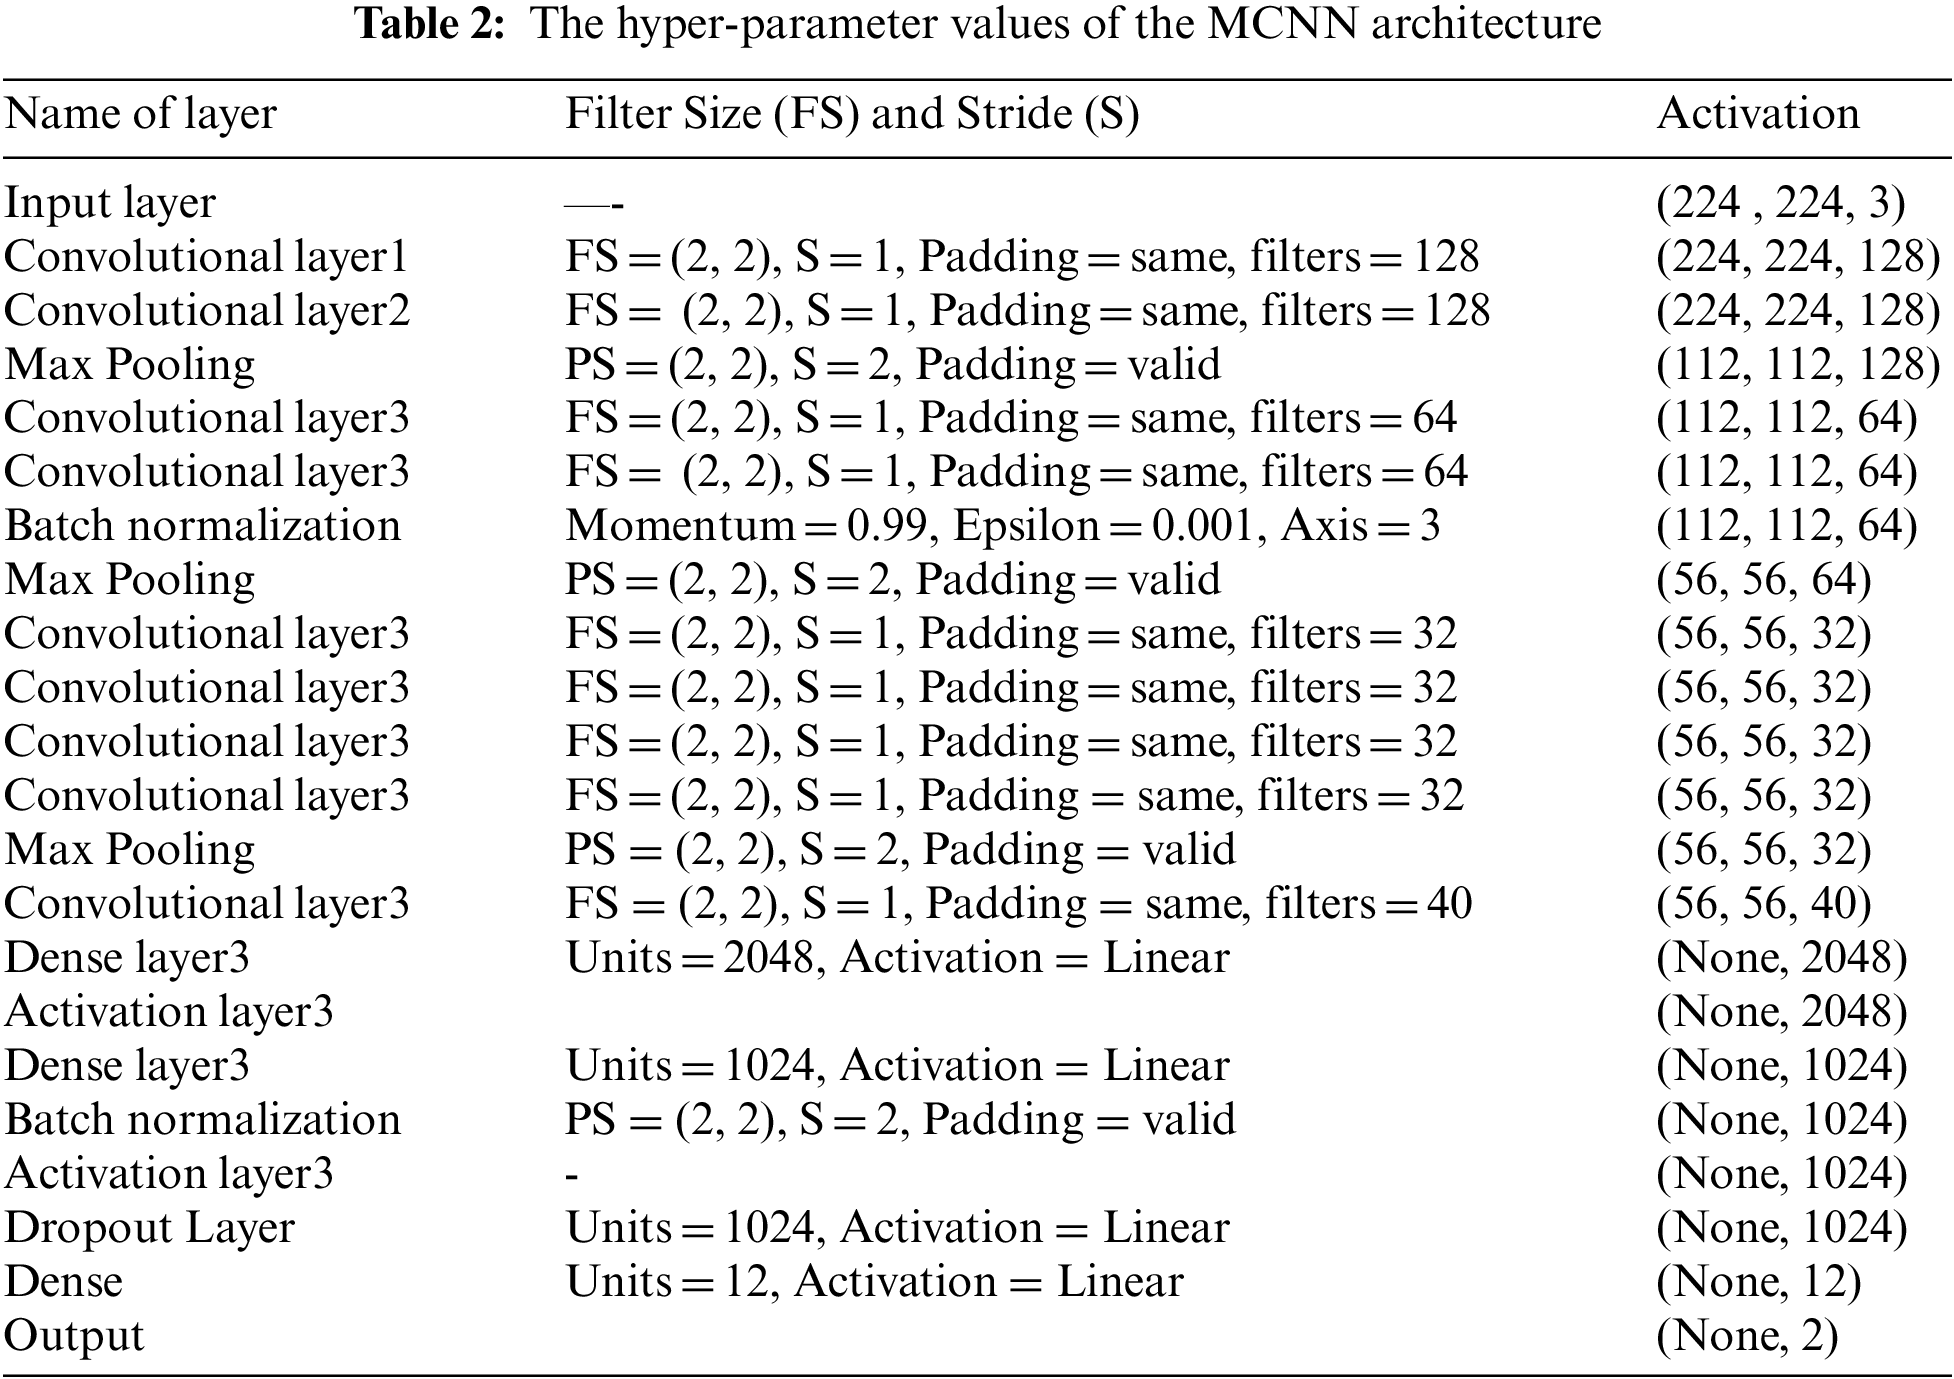
The MCNN main layers are shown in Tab. 2. The appropriate classifier must be substituted in order to handle the multi-dimensional purpose. Support Vector Machines (SVM) are supervised learning algorithms for classification. For each class, SVM creates a hyperplane in multi-dimensional space. The kernel function is used to transform the lower-dimensional data into a higher-dimensional space. This kernel feature converts a non-linear classification problem to a linear problem. It seeks the best hyperplane by maximizing the margin, which allows the mapped data to be separated in a linearly separable manner without the use of a complex curve. The main parts of the MCNN model are convolutional layers (Rectified Linear Unit (ReLU)) where features are extracted by the convolutional layer.
4 Implementation and Evaluation
In this section, the MCNN model is compared with different loss functions for detecting the appropriate one in malaria cell images for diagnosis.
4.1 Description of the Dataset
The collected malaria dataset created in Kaggle with 27,558 images, including parasite and uninfected images, is used in this work. Further, the MCNN architecture needs an accurate consideration of CNN with an input data format that is enhanced using preprocessing techniques and data augmentation as investigated in Tab. 2. In this work, the preprocessing stage includes:
(i) Data augmentation: it is used to increase the size of data by adding modified copies of already existing data. It helps reduce overfitting.
(ii) Image Rescaling: readjusting the values of each dimension of the data such that the final data vector is within the range [1, 1].
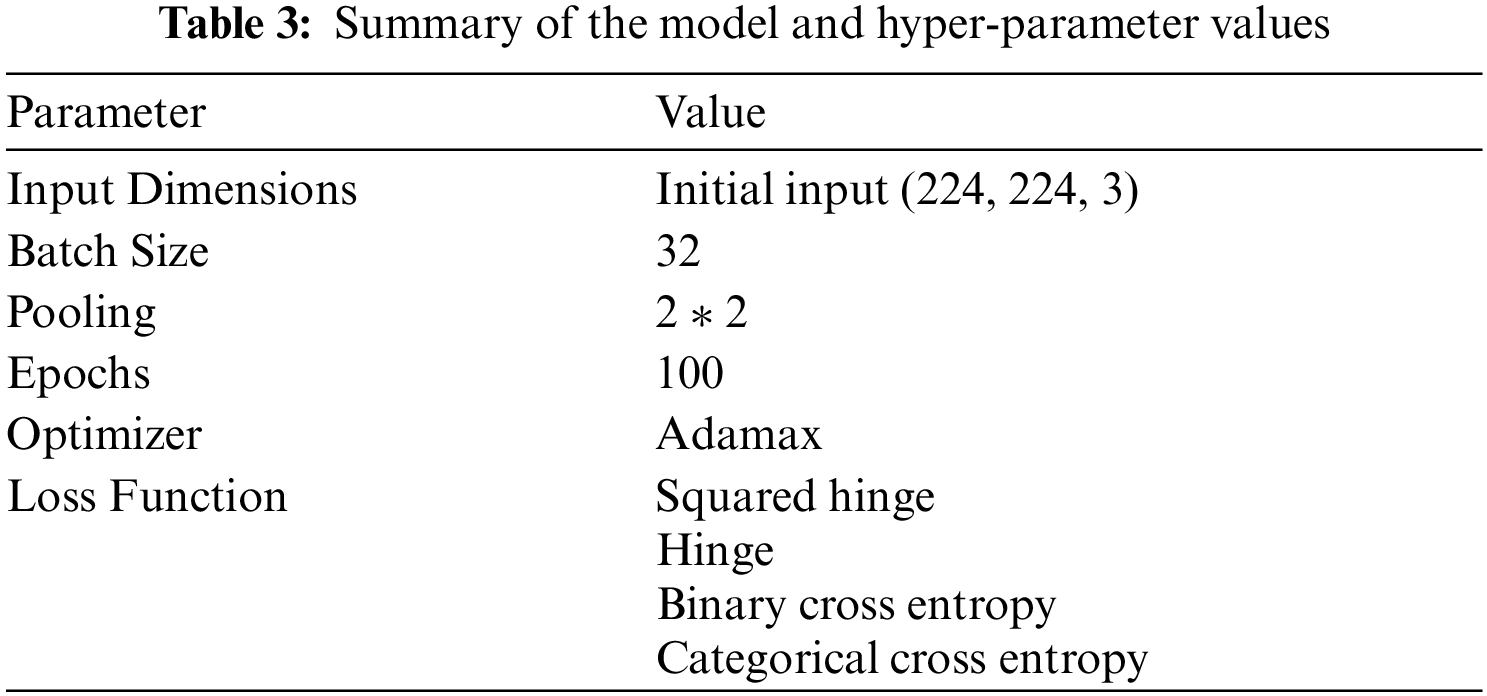
Experiments are implemented with a Core i7 processor and 8 GB of RAM. Python 3.6 is used to implement the code programmed with the Tensor Flow-Keras environment. The MCNN model used in the experiment stage is shown in Fig. 4. A total of 28 layers, including 8 convolution layers, 3 max-pooling layers, 4 thick layers, 2 batch normalization layers, 1 flattening layer, 1 40 percent dropout layer, and 1 totally connected layer, have been designed, as shown in Fig. 4. Where a 163 × 142 input image is resized to 224 × 224, a conv2D layer filter size of 2 × 2 is added, and the kernel size used for each convolution layer of 2 × 2 is included in the MaxPooling2D layer. The study chose max-pooling layers before the average pooling layer at an early stage, since it is intended for the problem of binary classification, where the hinge function is used to measure the error between the actual and expected output predicted. Because of the binary classification, the output is set to 2 classes (parasite and uninfected). To remove biases, an Adamax optimizer is used. The batch size is set to 32 samples and is continued for 50 epochs. The summary of the MCNN model hyper-parameter values is shown in Tab. 3.
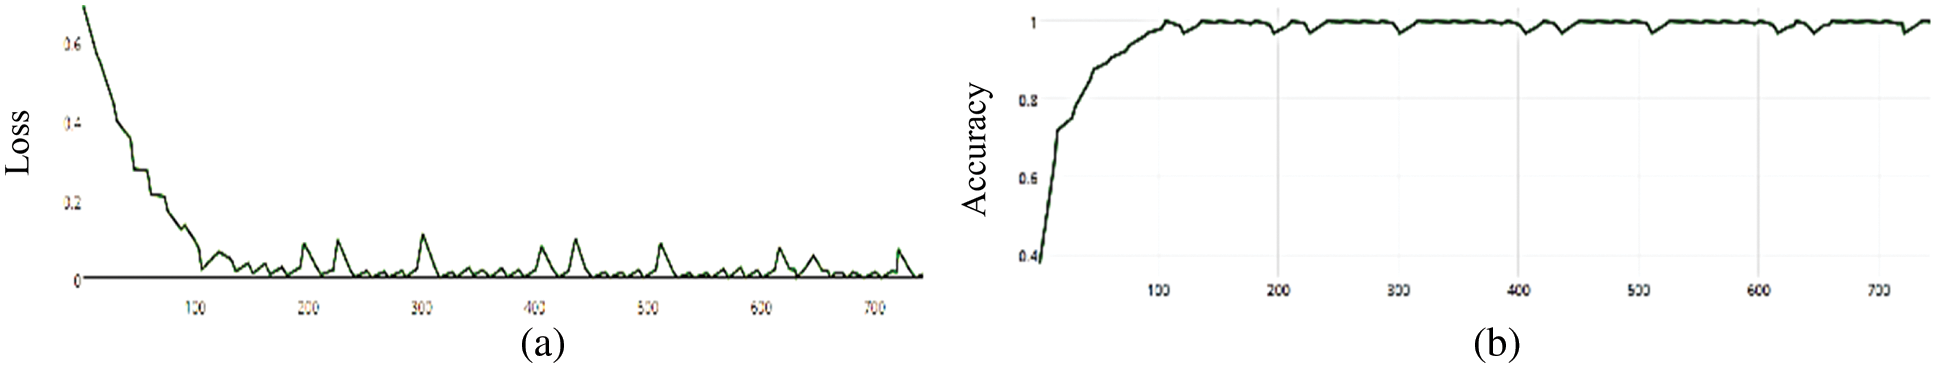
Figure 4: (a) MCNN model loss based on Inception(v3), (b) MCNN model accuracy based on Inception V3 with hinge loss function
Sensitivity and accuracy are the most used performance metrics, and they are used to verify the efficacy of pre-trained DCNN models with transfer learning. The consistency and precision of the terms are related to precise classification. The Sensitivity, Specificity, Precision, Negative Predictive Value (NPV), False Positive Rate (FPR), False Discovery Rate (FDR), False Negative Rate (FNR), Accuracy, F1-score, Matthews Correlation Coefficient (MCC) presented in Eqs. (1)–(8), (10), respectively [32].
where TP is the True Positive, TN is the True Negative FN, and FP are the false negative and positive, respectively.
In this section, the MCCN model is compared with inception (v3), Residual, and VGG (19) common neural network architectures by using images of malaria cell images. CNN models are difficult to train from scratch when faced with a huge dataset, which leads to a long number of training iterations and time spent experimenting to get the hyper-parameters just right. So, Transfer Learning (TL) is a good idea for keeping the early layers of a pre-trained network and re-training the latter layers for a computer vision application. In this paper, a comparison of three different pre-trained models (Inception-v3, Resnet (50), and VGG (19)) were compared with several common loss functions using the Adamax optimizer and the need to choose a loss function when configuring the MCNN model. Loss function plays a role in the model training phase. Loss functions is applied in training MCNN model to choose the appropriate one for the predictive model. MCNN model is trained using an optimization process that requires a loss function to calculate the model error.
This function is used for image classification. It is convex and has no loss making it ideal for data classification. It is computed as:
where y should be the output of the classifier's decision function. There are two output classes (parasitized and uninfected) for malaria diagnosis. The output for uninfected images will be 0 and 1, which is the inverse of the previous output.
4.4.2 Hinge Loss Function Squared
It is a loss function for binary classification problems with a “maximum margin”. It is in conjunction with the last layer's tanh () activation function. Mathematically, it is defined as:
where
The loss is calculated by averaging the class-wise mistakes and measuring how far away from the true value the forecast is for each of the classes. This function is used in binary classification tasks. It is computed as:
The loss is equal to the average of the categorical cross entropy loss on many two-category tasks.
4.4.4 Categorical Cross Entropy
Its purpose is to calculate the difference between two probability distributions. This function is used for a multi-class classification task that uses categorical cross-entropy together with the softmax activation function. It is computed as:
The MCNN model makes a comparison between Inception V3 and the other mentioned pre-trained models that focus on image salient sections. The classifiers do not make much of a difference until the end of the training phase when precision is approaching saturation, so add Adam Optimizer and Batch Standard to the Auxiliary Classifiers to improve the network. Four common loss functions (Hinge, squared Hinge, binary cross entropy, categorical cross entropy) are used for malaria cell image classification. The average accuracy as shown in Figs. 4–7 shows the results of different loss functions and accuracy.
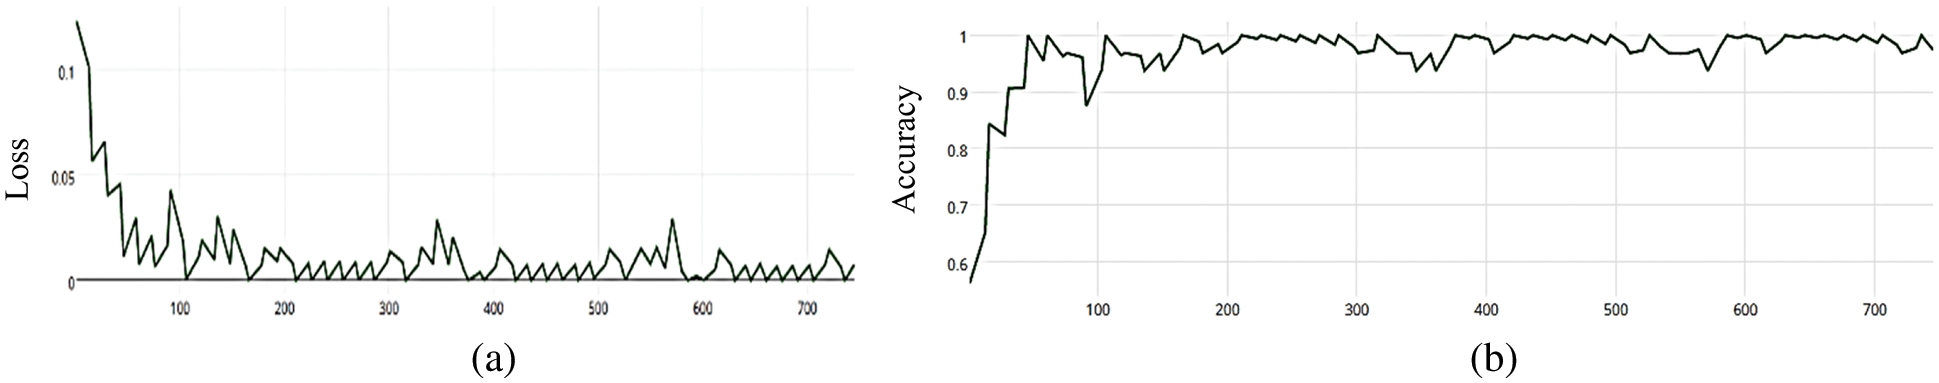
Figure 5: (a) MCNN model loss based on Inception(v3), (b) MCNN model accuracy based on Inception V3 with squared-hinge loss function
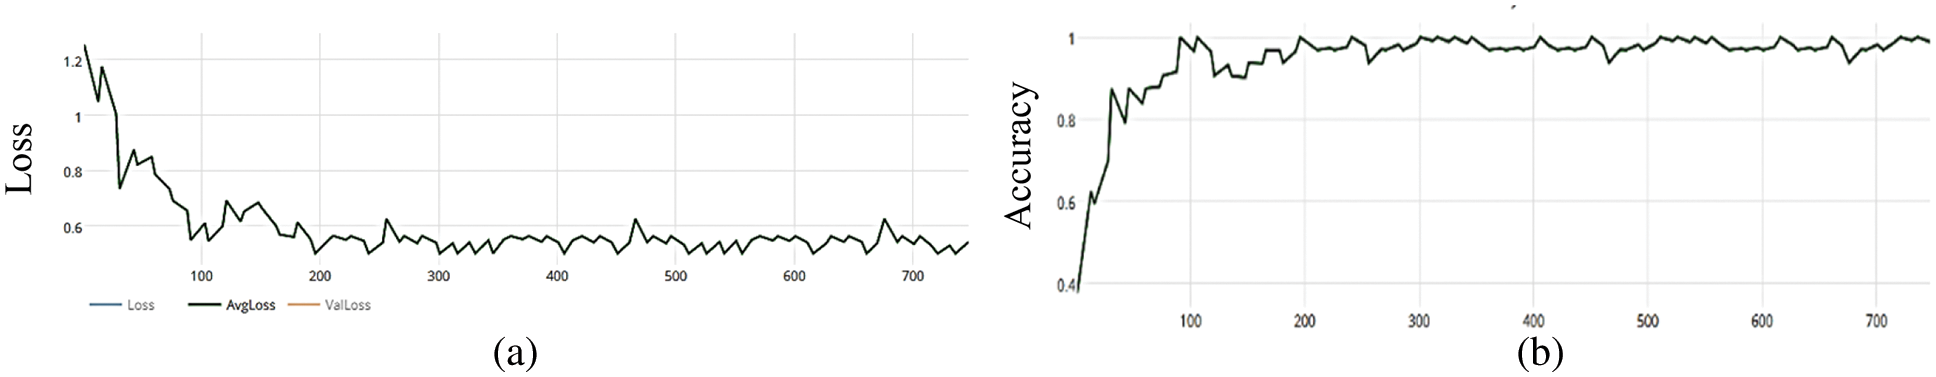
Figure 6: (a) MCNN model loss based on Inception(v3), (b) MCNN model accuracy based on Inception V3 with binary cross entropy
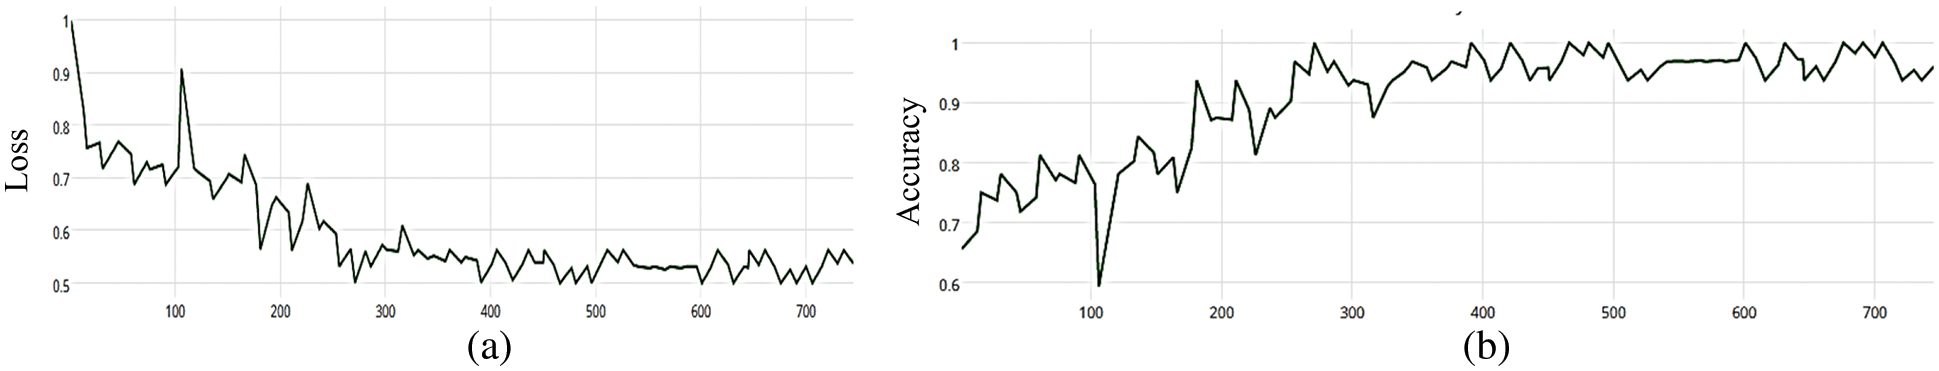
Figure 7: (a) MCNN model loss based on Inception(v3), (b) MCNN model accuracy based on Inception V3 with categorical cross entropy
4.4.6 Residual Neural Network (ResNet50)
The MCNN model is based on the ResNet50 pre-trained model and RGB color mode, with 50 epochs. The average accuracy as shown in Figs. 8–11 shows the results of loss and accuracy.
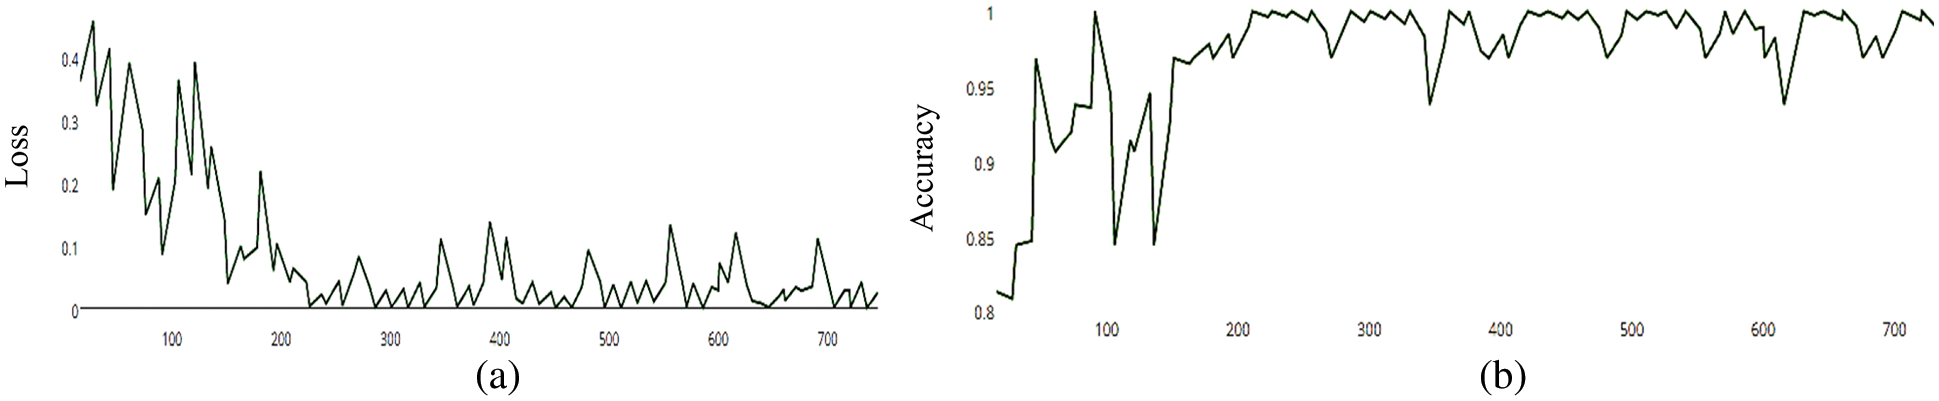
Figure 8: (a) MCNN model loss based on Resnet (50), (b) MCNN model accuracy based on Resnet (50) with Hinge loss function
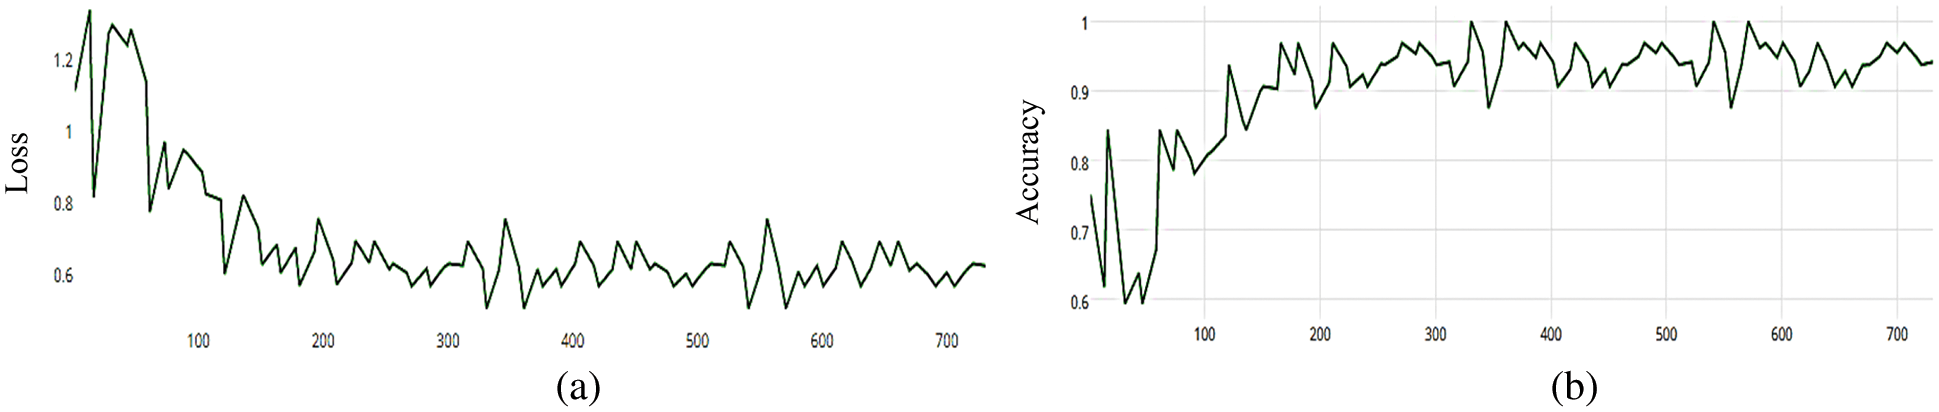
Figure 9: (a) MCNN model loss based on Resnet (50), (b) MCNN model accuracy based on Resnet (50) with squared-hinge loss function
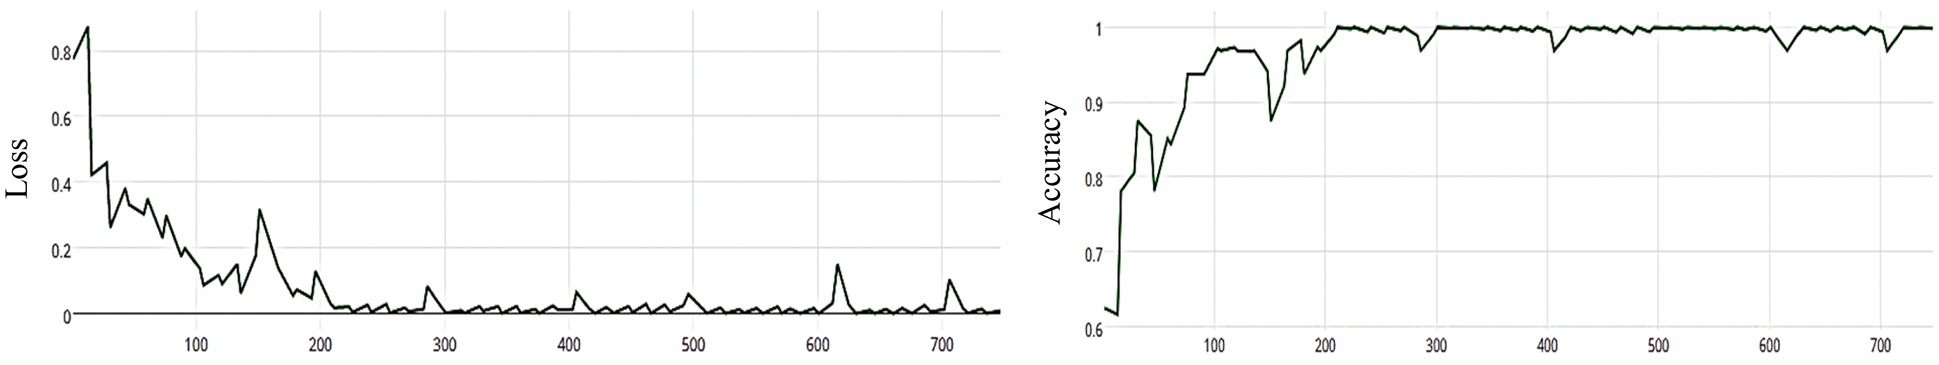
Figure 10: (a) MCNN model loss based on ResNet(50), (b) MCNN model accuracy based on ResNet(50) with binary cross entropy
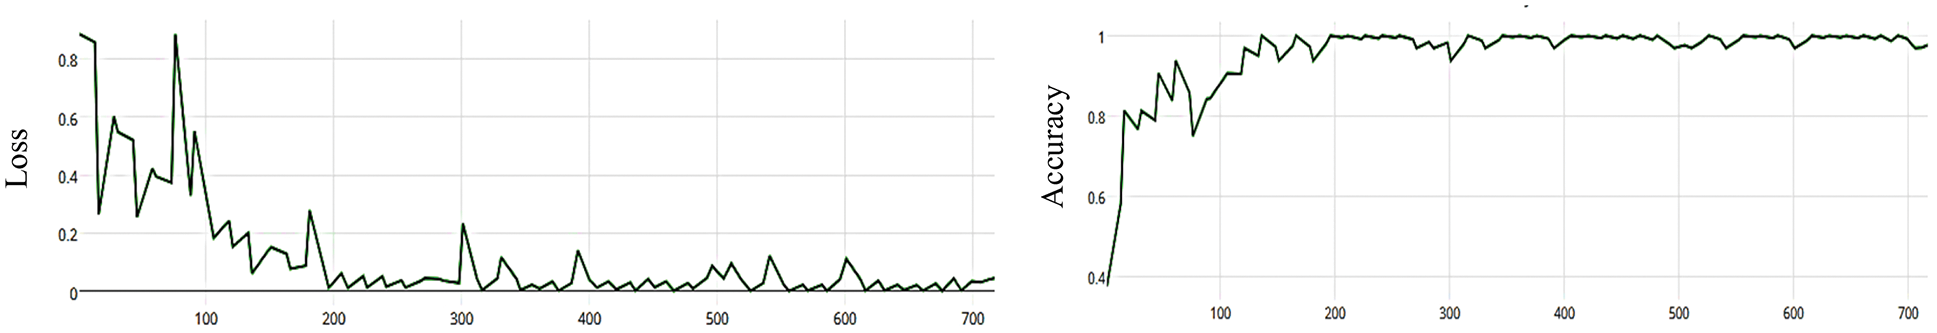
Figure 11: (a) The average loss of MCNN model depends on ResNet (50), (b) accuracy of MCNN model depends on ResNet (50) with categorical cross entropy
4.4.7 VGG19 (Visual Geometry Group)
VGG (19) focuses on smaller window sizes and strides; the overall architecture is described above. Accuracy, precision, recall, and F-score are used to determine the model's best output using VGG19. The confusion matrix of this experiment is shown in Fig. 12. After training the MCNN model depending on VGG (19) with 50 epochs, the average accuracy is shown in Figs. 13–16 for different loss functions.
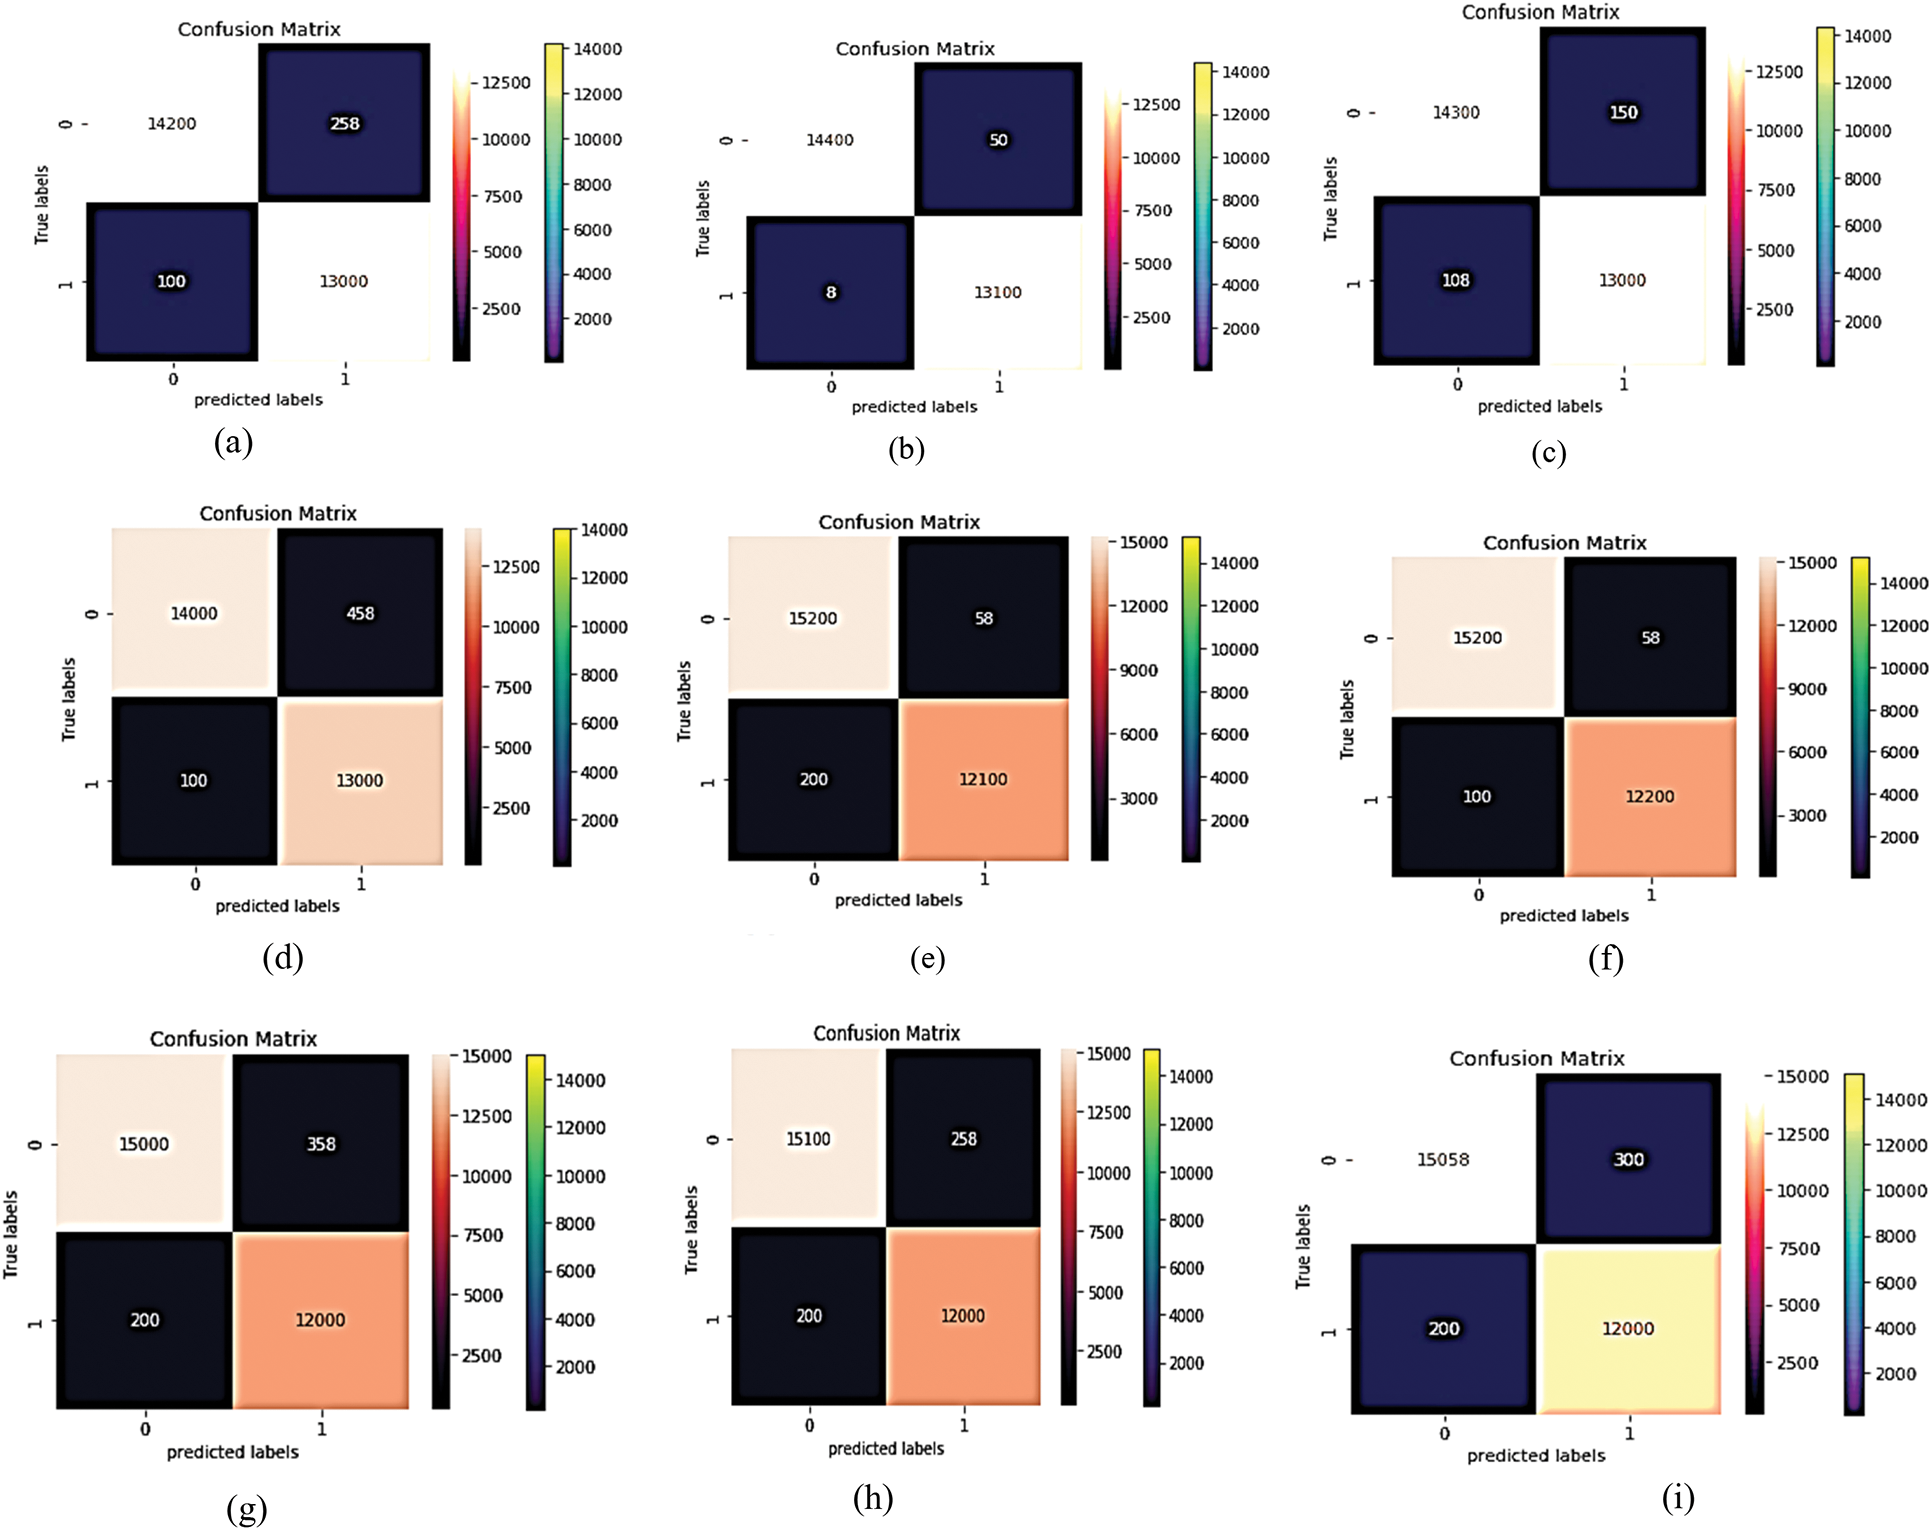
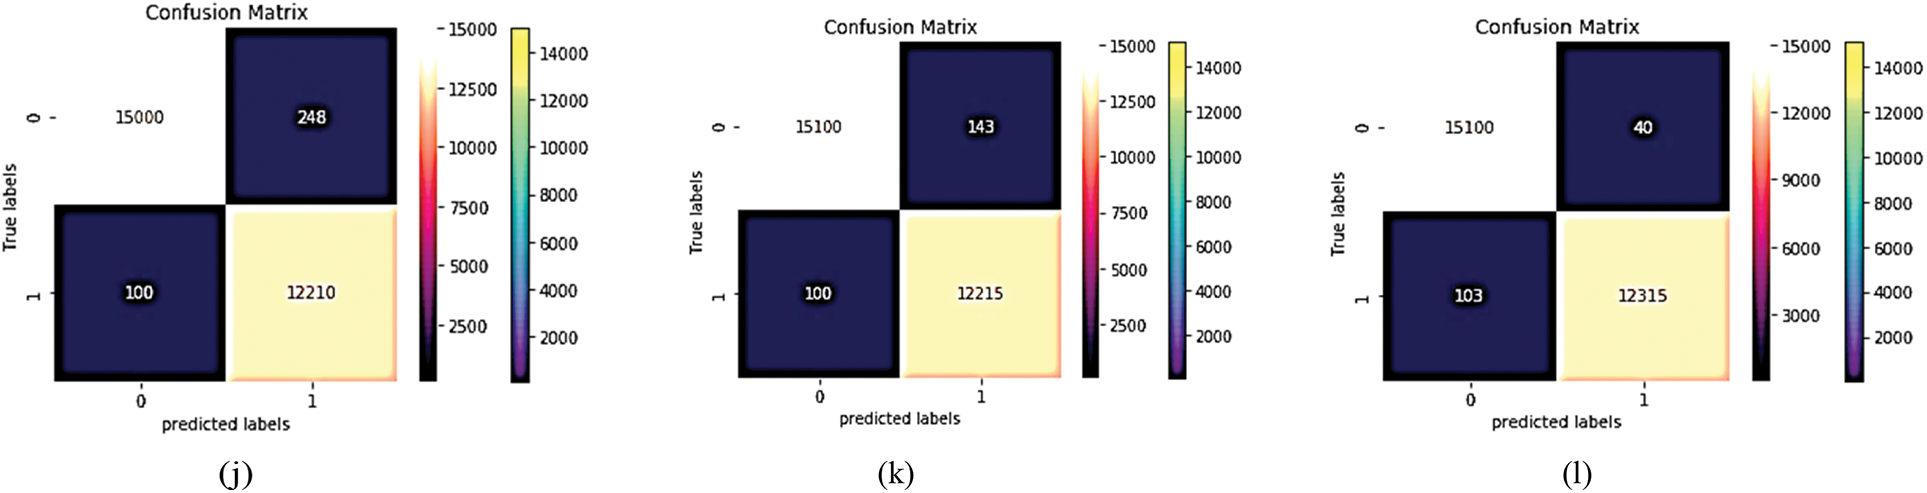
Figure 12: The proposed MCNN model is compared with four common pre-trained models that depend on four loss functions (Hinge loss function confusion matrix, squared Hinge loss function confusion matrix, binary cross entropy loss function confusion matrix, and categorical cross entropy). The first four (a–d) for Inception V3's confusion matrix. The next four (e–h) for the confusion matrix of Resnet (50) and the next four (i–l) for the confusion matrix of VGG (19)
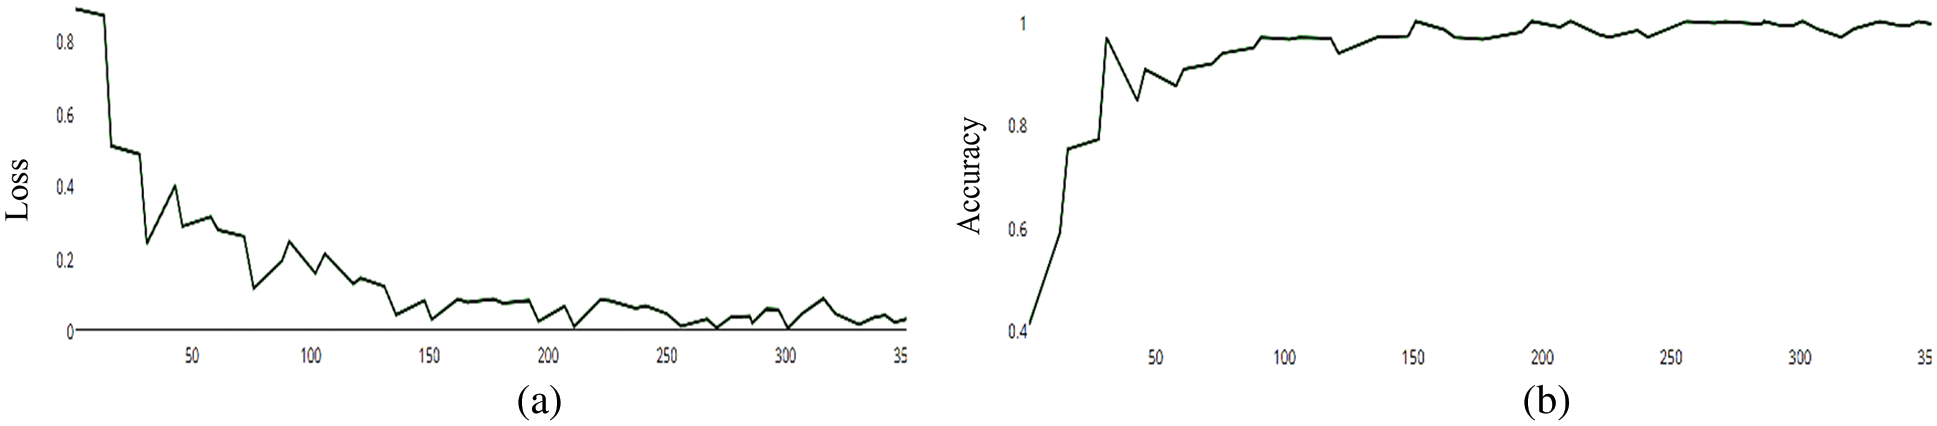
Figure 13: (a) MCNN model loss based on VGG (19), (b) MCNN model accuracy based on VGG (19) squared-hinge loss function
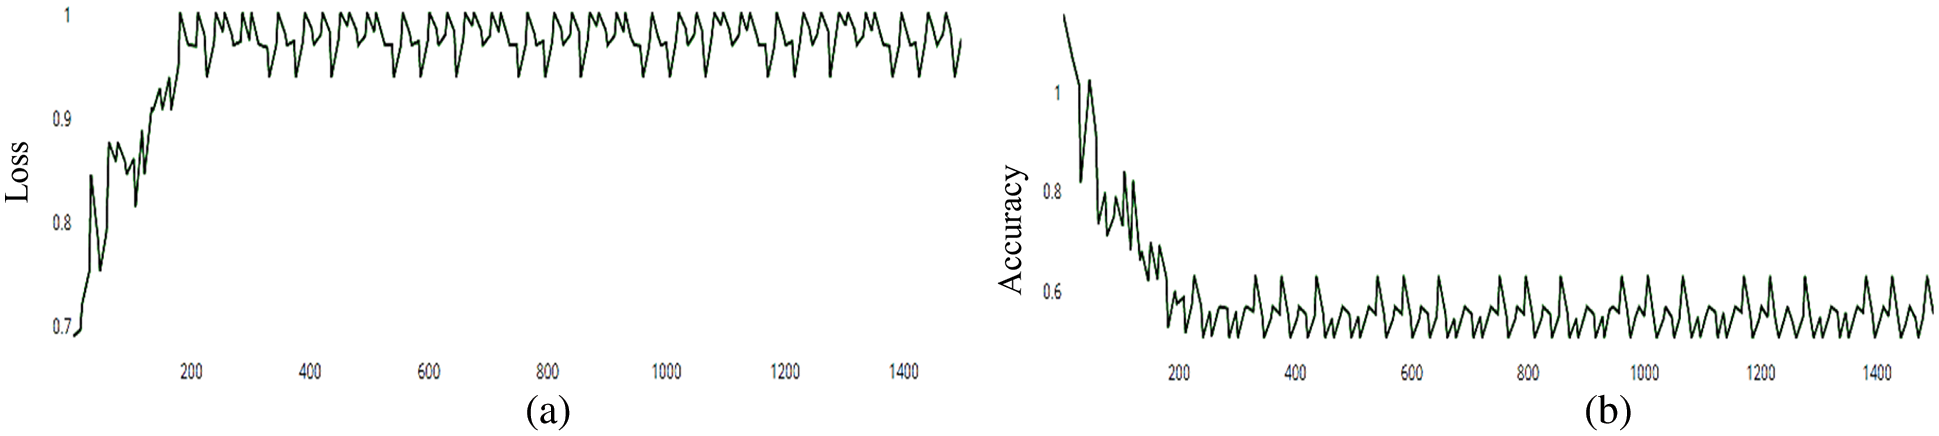
Figure 14: (a) MCNN model accuracy based on VGG (19), (b) MCNN model Loss based on VGG (19) squared-hinge loss function
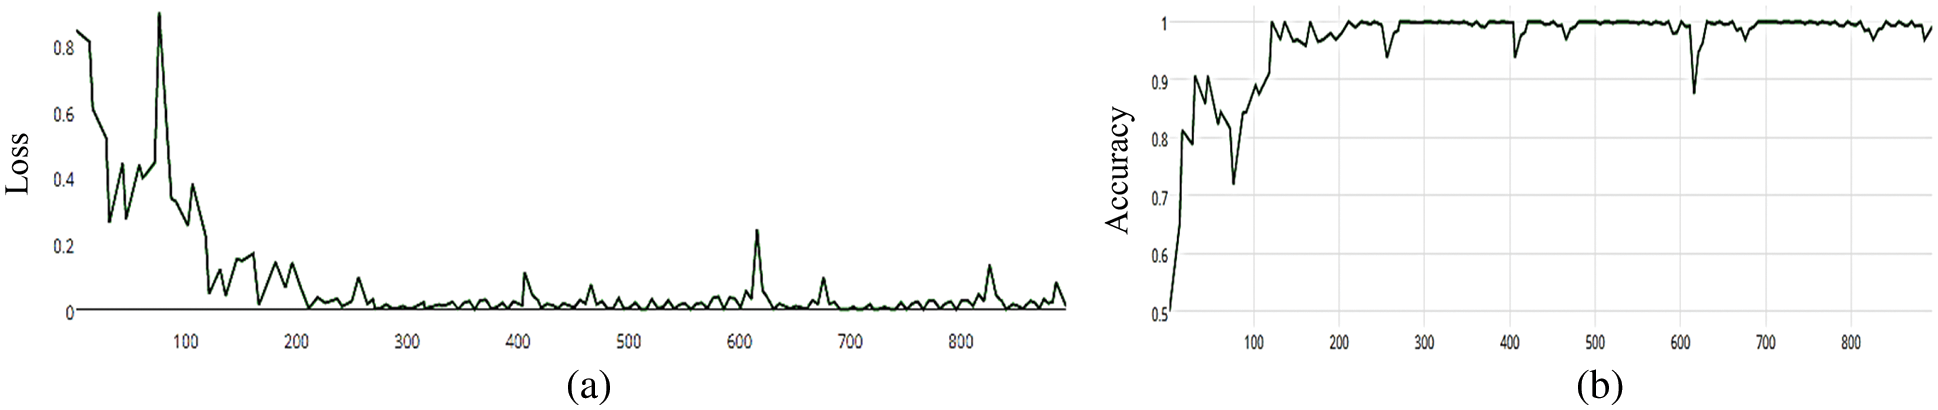
Figure 15: (a) MCNN model loss based on VGG (19), (b) MCNN model accuracy based on VGG (19) with binary cross entropy
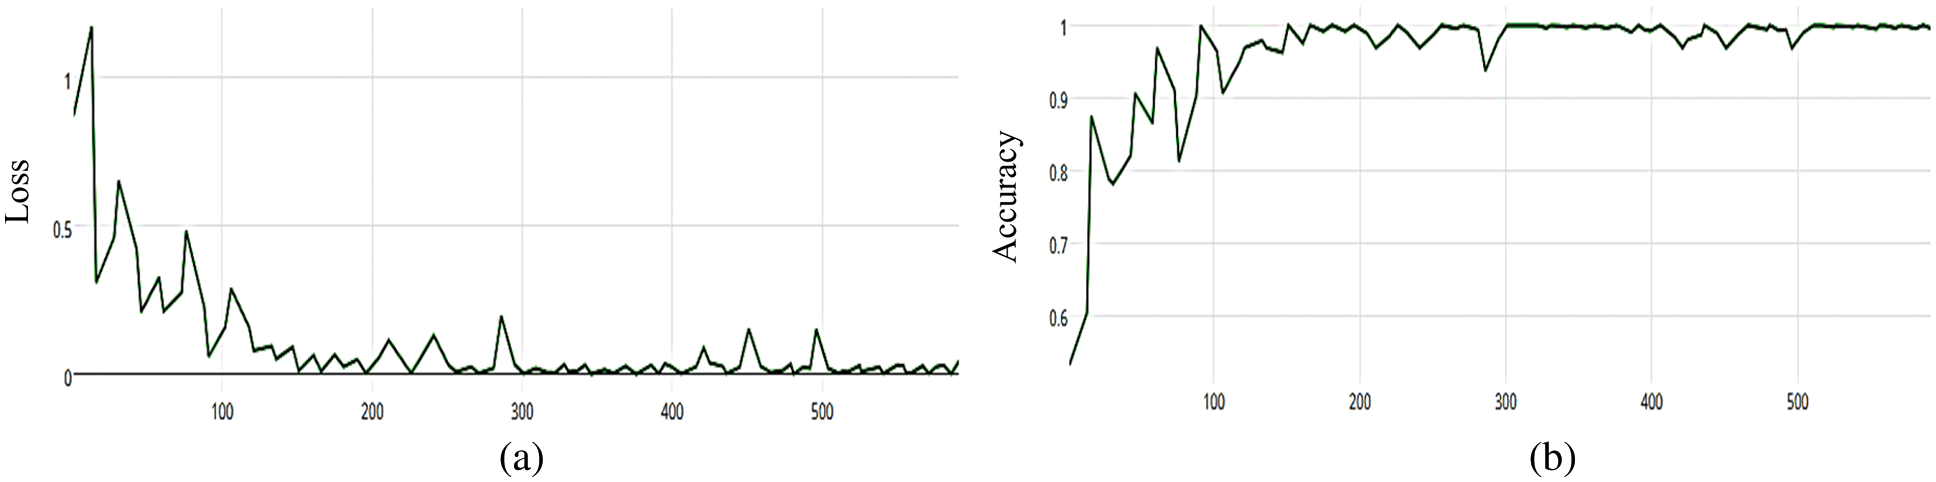
Figure 16: (a) MCNN model loss based on VGG (19), (b) MCNN model accuracy based on VGG (19) with categorical cross entropy
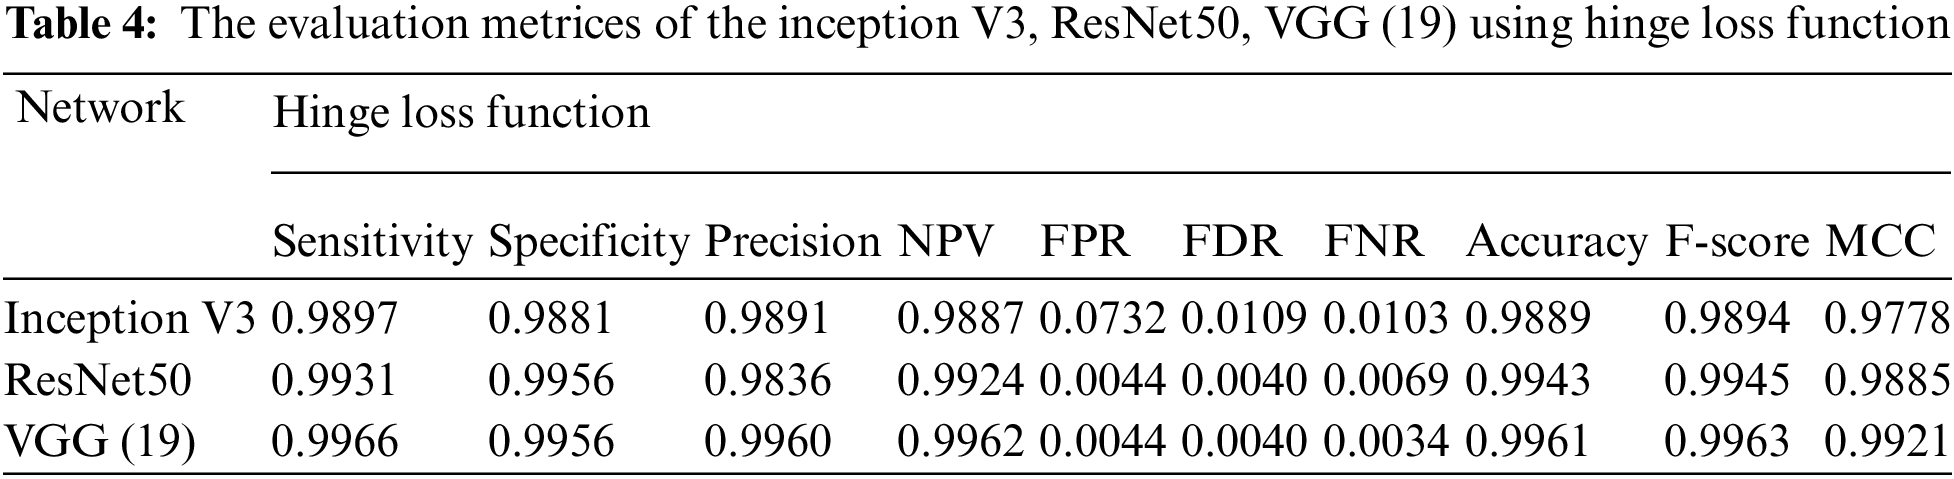
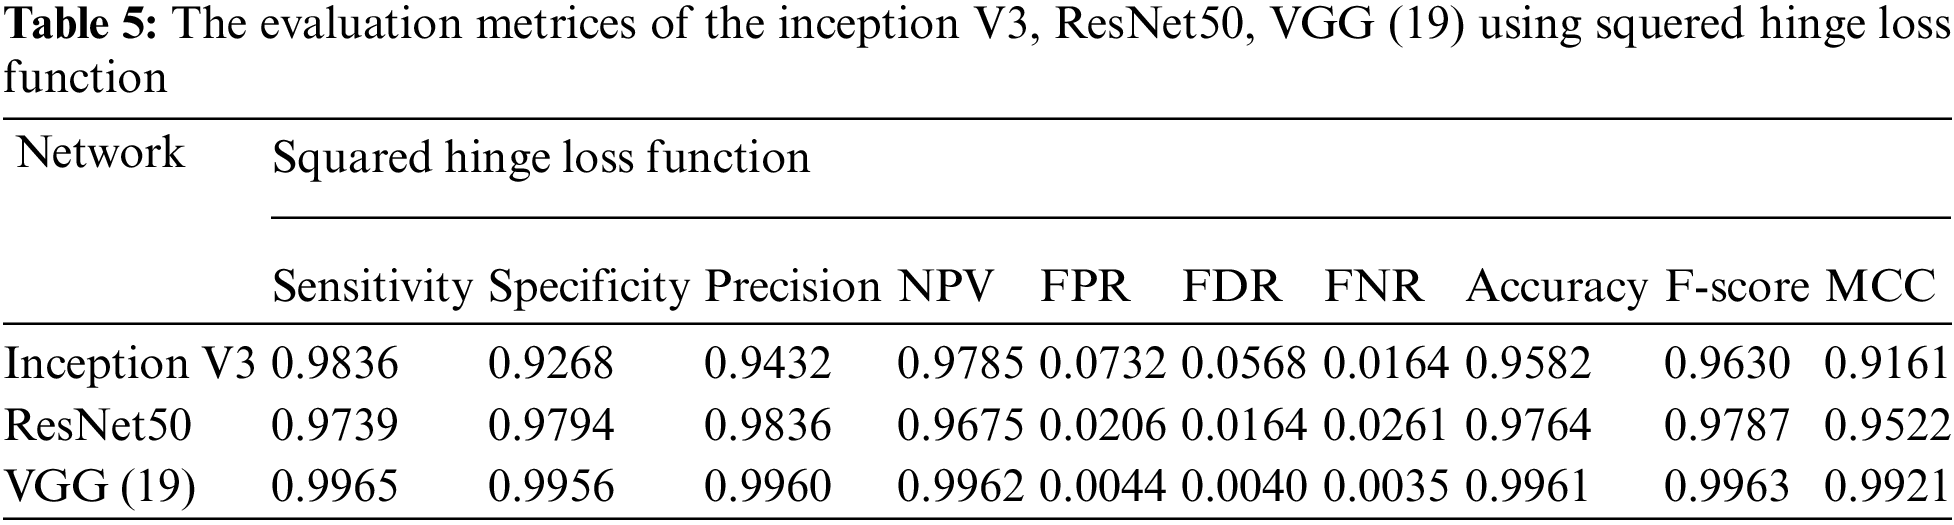
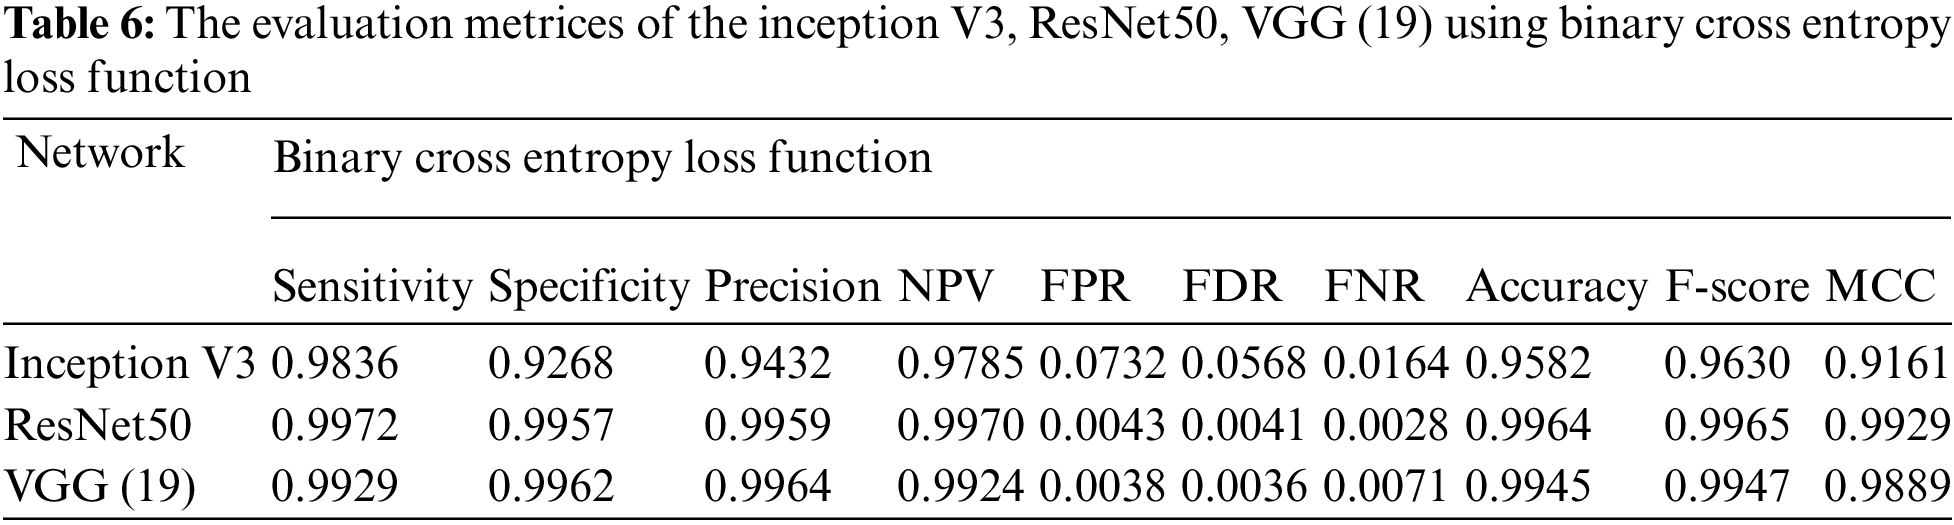
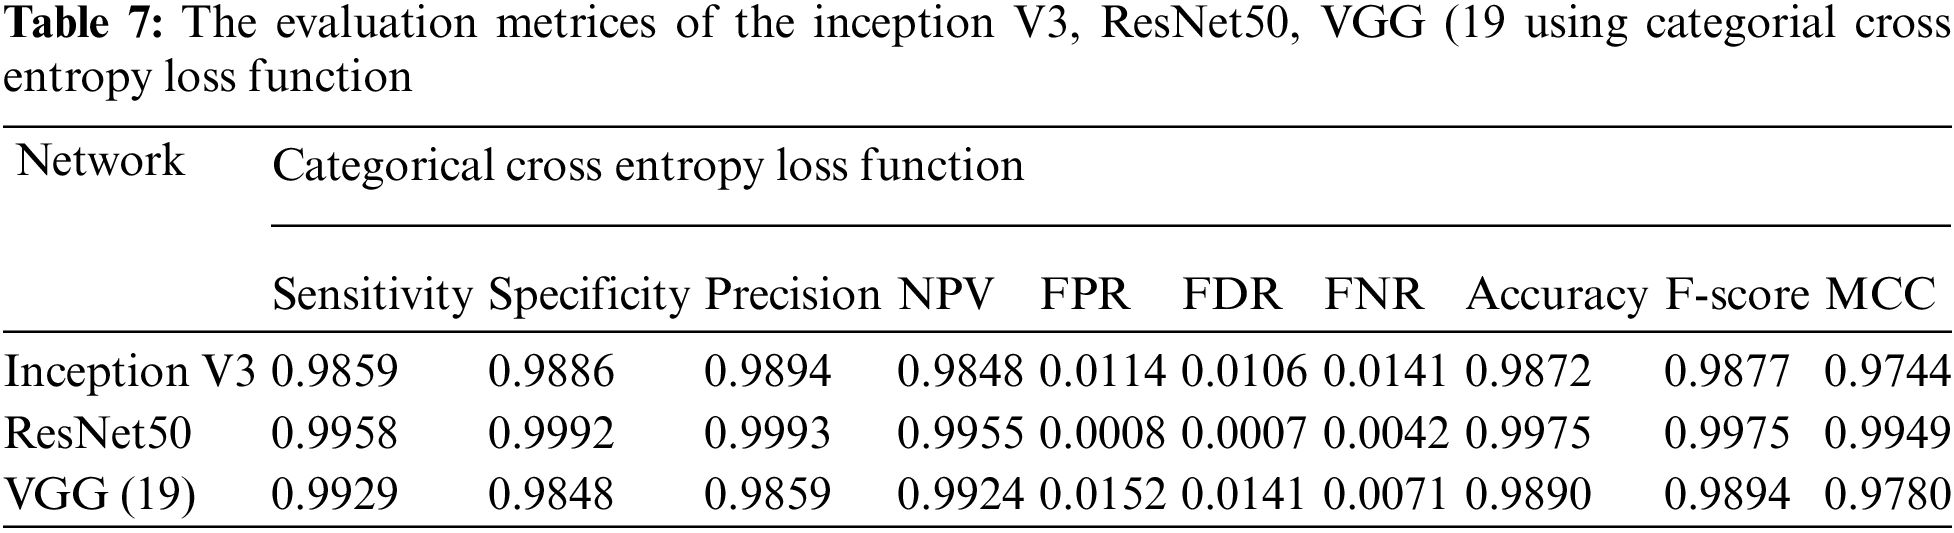
Essentially, the MCNN model is based on a transfer learning idea. Therefore, In the (Tabs. 4–7), we stated a comparison between every pre-trained model (Inception v3, Resnet (50), VGG (16), VGG (19)) individually with one from the loss function that is dependent on the metrics performance metrics Eqs. (1)–(10) and the values of confusion matrixes (Fig. 12). Tab. 4 represents the hinge loss function with all pre-trained models. Tab. 5 presents the squared hinge loss function with all the pre-trained models that were mentioned above and is dependent on the metrics performance metrics equations. Tab. 6 presents the Binary Cross-Entropy Loss Function with all the pre-trained models. Tab. 7 presents the Binary Cross Entropy Loss Function with all the pre-trained models that significantly improve the classification rates.
To build a new deep learning model with accurate accuracy, many labelled images are needed. In this paper, the MCNN proposed model uses transfer learning in three different ways to pre-trained models to classify malaria cell images. This study proposed an efficient model for extracting and classifying features from images. The results are compared with different loss functions (Hinge, squared Hinge, binary cross-entropy, categorical cross-entropy) that had been shown to be effective on the total performance of the model. The weights are fine-tuned, and the dataset is augmented by a few techniques mentioned above to overcome the problem of overfitting. The performance of the proposed method is tested using malaria using GPU. The proposed model achieved 0.9929, 0.9848, 0.9859, 0.9924, 0.0152, 0.0141, 0.0071, 0.9890, 0.9894, and 0.9780 in terms of specificity, sensitivity, precision, accuracy, F1-score, and Matthews Correlation Coefficient (MCC), respectively. In future work, the proposed method can be used to segment the color patches of infected malaria cell images and detect them. Building a mobile CNN model for helping the doctors in diagnosing.
Data Availability: A data availability is found in https://www.kaggle.com/mariaren/covid19-healthy-diet-dataset.
Funding Statement: This research received no specific grant from any funding agency in the public, commercial, or not-for-profit sectors.
Conflicts of Interest: The authors declare that they have no conflicts of interest to report regarding the present study.
1. F. Cen and G. Wang, “Boosting occluded image classification via subspace decomposition-based estimation of deep features,” IEEE Transactions on Cybernetics, vol. 50, no. 7, pp. 3409–3422, 2020. [Google Scholar]
2. J. S. Chima, A. Shah, K. Shah and R. Ramesh, “Malaria cell image classification using deep learning,” International Journal of Recent Technology and Engineering, vol. 8, no. 6, pp. 5553–5559, 2020. [Google Scholar]
3. A. Maqsood, M. S. Farid, M. H. Khan and M. Grzegorzek, “Deep malaria parasite detection in thin blood smear microscopic images,” Applied Sciences, vol. 11, no. 5, pp. 1–19, 2021. [Google Scholar]
4. C. Mehanian, M. Jaiswal, C. Delahunt, C. Thompson, M. Horning et al., “Computer-aided malaria diagnosis and quantitation using convolutional neural networks,” in IEEE Int. Conf. on Computer Vision ICCV 2017, Venice, Italy, vol. 2018-Janua, pp. 116–125, 2017. [Google Scholar]
5. R. Nakasi, E. Mwebaze, A. Zawedde, J. Tusubira, B. Akera et al., “A new approach for microscopic diagnosis of malaria parasites in thick blood smears using pre-trained deep learning models,” SN Applied Sciences, vol. 2, no. 7, pp. 1–7, 2020. [Google Scholar]
6. A. Zamora, M. Bean and C. Vilor, “Unsupervised online clustering and detection algorithms for malaria diagnosis using crowdsourced data,” Pattern Recognition, vol. 86, pp. 209–223, 2019. [Google Scholar]
7. A. Vijayalakshmi and B. Rajesh Kanna, “Deep learning approach to detect malaria from microscopic images,” Multimedia Tools and Applications, vol. 79, no. 21–22, pp. 15297–15317, 2020. [Google Scholar]
8. A. Sarkar, J. Vandenhirtz, J. Nagy, D. Bacsa and M. Riley, “Identification of images of COVID-19 from chest x-rays using deep learning: Comparing cognex visionpro deep learning 1.0tm software with open-source convolutional neural networks,” SN Applied Sciences, vol. 2, no. 3, pp. 1–18, 2021. [Google Scholar]
9. M. Umer, S. Sadiq, M. Ahmad, S. Ullah, G. S. Choi et al., “A novel stacked CNN for malarial parasite detection in thin blood smear images,” IEEE Access, vol. 8, pp. 93782–93792, 2020. [Google Scholar]
10. S. M. Mazalan, N. H. Mahmood and M. A. A. Razak, “Automated red blood cell counting in peripheral blood smear image using circular hough transform,” in Int. Conf. on Artificial Intelligence, Modelling and Simulation, Kota Kinabalu, Malaysia, vol. 1, pp. 320–324, 2014. [Google Scholar]
11. S. Rajaraman, S. Antani, M. Poostchi, K. Silamut, M. Hossain et al., “Pre-trained convolutional neural networks as feature extractors for improved malaria parasite detection in thin blood smear images,” PeerJ, vol. 2018, no. 4, pp. 1–17, 2018. [Google Scholar]
12. S. Minaee, R. Kafieh, M. Sonka, S. Yazdani and G. Jamalipour, “Deep-COVID: Predicting COVID-19 from chest X-ray images using deep transfer learning,” Medical Image Analysis, vol. 65, pp. 1–9, 2021. [Google Scholar]
13. D. K. Das, M. Ghosh, M. Pal, A. K. Maiti and C. Chakraborty, “Machine learning approach for automated screening of malaria parasite using light microscopic images,” Micron, vol. 45, no. 1, pp. 97–106, 2013. [Google Scholar]
14. H. Burdick, C. Lam, S. Mataraso, A. Siefkas, G. Braden et al., “Prediction of respiratory decompensation in Covid-19 patients using machine learning: The READY trial,” Computers in Biology and Medicine, vol. 124, pp. 103949, 2020. [Google Scholar]
15. Y. Chen, L. Zhu, P. Ghamisi, X. Jia, G. Li et al., “Hyperspectral image classification using gabor filtering and convolutional neural network,” IEEE Geoscience and Remote Sensing Letters, vol. 14, no. 12, pp. 2355–2359, 2017. [Google Scholar]
16. D. Bibin, M. S. Nair and P. Punitha, “Malaria parasite detection from peripheral blood smear images using deep belief networks,” IEEE Access, vol. 5, pp. 9099–9108, 2017. [Google Scholar]
17. F. B. Tek, A. G. Dempster and I. Kale, “Parasite detection and identification for automated thin blood film malaria diagnosis,” Computer Vision and Image Understanding, vol. 114, no. 1, pp. 21–32, 2010. [Google Scholar]
18. N. Linder, R. Turkki, M. Walliander, A. Mrtensson, V. Diwan et al., “A malaria diagnostic tool based on computer vision screening and visualization of plasmodium falciparum candidate areas in digitized blood smears,” PLoS One, vol. 9, no. 8, pp. 1–12, 2014. [Google Scholar]
19. A. Sedik, A. Iliyasu, B. Rahiem, M. Samea, A. Rahiem et al., “Deploying machine and deep learning models for efficient data-augmented detection of COVID-19 infections,” Viruses, vol. 12, no. 7, pp. 1–29, 2020. [Google Scholar]
20. C. G. Puntonet, J. E. Arco, J. M. Górriz, J. Ramrez, I. lvarez et al., “Digital image analysis for automatic enumeration of malaria parasites using morphological operations,” Expert Systems with Applications, vol. 42, no. 6, pp. 3041–3047, 2015. [Google Scholar]
21. S. Sarkar, R. Sharma and K. Shah, “Malaria detection from RBC images using shallow convolutional neural networks,” ArXiv Preprint ArXiv:2010.11521, 2020. [Google Scholar]
22. T. T. Nguyen, “Artificial intelligence in the battle against coronavirus (covid-19A survey and future research directions,” ArXiv Preprint Arxiv: 2008.07343v3, 2020. [Google Scholar]
23. Y. Song, S. Zheng, L. Li, X. Zhang, X. Zhang et al., “Deep learning enables accurate diagnosis of novel coronavirus (covid-19) using CT images,” IEEE/ACM Transactions on Computational Biology and Bioinformatics, vol. 18, no. 6, pp. 2775–2780, 2020. [Google Scholar]
24. S. Elmuogy, N. A. Hikal and E. Hassan, “An efficient technique for CT scan image classification of COVID-19,” Journal of Intelligent & Fuzzy Systems, vol. 40, no. 3, pp. 5225–5238, 2021. [Google Scholar]
25. K. M. Hosny, M. A. Kassem and M. M. Foaud, “Skin cancer classification using deep learning and transfer learning,” in Proc. of the 9th Cairo Int. Biomedical Engineering Conf. (CIBEC 2018), Cairo, Egypt, pp. 90–93, 2019. [Google Scholar]
26. N. El-Rashidy, S. El-Sappagh, S. M. R. Islam, H. M. El-Bakry and S. Abdelrazek, “End-to-end deep learning framework for coronavirus (covid-19) detection and monitoring,” Electronics, vol. 9, no. 9, pp. 1439, 2020. [Google Scholar]
27. Y. Li, H. Qi, J. Dai, X. Ji and Y. Wei, “Fully convolutional instance-aware semantic segmentation,” in 30th IEEE Conf. on Computer Vision and Pattern Recognition, CVPR 2017, Honolulu, HI, USA, vol. 2017-Janua, pp. 4438–4446, 2017. [Google Scholar]
28. O. M. Elzeki, M. Abd Elfattah, H. Salem, A. E. Hassanien and M. Y. Shams, “A novel perceptual two layer image fusion using deep learning for imbalanced COVID-19 dataset,” PeerJ Computer Science, vol. 7, pp. 1–35, 2021. [Google Scholar]
29. H. Gunraj, L. Wang, and A.Wong “Covidnet-ct: A tailored deep convolutional neural network design for detection of covid-19 cases from chest ct images,” Frontiers in Medicine, vol. 7, pp. 1–11, 2020. [Google Scholar]
30. E. Hassan, M. Y. Shams, N. A. Hikal and S. Elmougy, “Plant seedlings classification using transfer,” in Int. Conf. on Electronic Engineering (ICEEM), Menouf, Egypt, no. July, pp. 1–4, 2021. [Google Scholar]
31. H. Zhang, J. Zhang, H. Zhang, Y. D. Nan and Y. Zhao, “Automated detection and quantification of COVID-19 pneumonia: Ct imaging analysis by a deep learning-based software,” European Journal of Nuclear Medicine and Molecular Imaging, vol. 47, no. 11, pp. 2525–2532, 2020. [Google Scholar]
32. S. Sarhan, A. Nasr and M. Y. Shams, “Multipose face recognition-based combined adaptive deep learning vector quantization,” Computational Intelligence and Neuroscience, vol. 2020, pp. 1–11, 2020. [Google Scholar]
 | This work is licensed under a Creative Commons Attribution 4.0 International License, which permits unrestricted use, distribution, and reproduction in any medium, provided the original work is properly cited. |