DOI:10.32604/cmc.2022.025840
| Computers, Materials & Continua DOI:10.32604/cmc.2022.025840 | |
| Article |
Non-Invasive Early Diagnosis of Obstructive Lung Diseases Leveraging Machine Learning Algorithms
1Department of Electrical Engineering, Riphah International University, Islamabad, 44000, Pakistan
2Security Engineering Lab, Prince Sultan University, Riyadh, 12435, Saudi Arabia
3RIADI Laboratory, National School of Computer Science, University of Manouba, Manouba, 2010, Tunisia
4Peoples’ Friendship University of Russia (RUDN University), Moscow, 117198, Russia
*Corresponding Author: Mujeeb Ur Rehman. Email: Mujeeb.rehman@riphah.edu.pk
Received: 07 December 2021; Accepted: 18 March 2022
Abstract: Lungs are a vital human body organ, and different Obstructive Lung Diseases (OLD) such as asthma, bronchitis, or lung cancer are caused by shortcomings within the lungs. Therefore, early diagnosis of OLD is crucial for such patients suffering from OLD since, after early diagnosis, breathing exercises and medical precautions can effectively improve their health state. A secure non-invasive early diagnosis of OLD is a primordial need, and in this context, digital image processing supported by Artificial Intelligence (AI) techniques is reliable and widely used in the medical field, especially for improving early disease diagnosis. Hence, this article presents an AI-based non-invasive and secured diagnosis for OLD using physiological and iris features. This research work implements different machine-learning-based techniques which classify various subjects, which are healthy and effective patients. The iris features include gray-level run-length matrix-based features, gray-level co-occurrence matrix, and statistical features. These features are extracted from iris images. Additionally, ten different classifiers and voting techniques, including hard and soft voting, are implemented and tested, and their performances are evaluated using several parameters, which are precision, accuracy, specificity, F-score, and sensitivity. Based on the statistical analysis, it is concluded that the proposed approach offers promising techniques for the non-invasive early diagnosis of OLD with an accuracy of 97.6%.
Keywords: Obstructive lung disease; non-invasive diagnosis; machine learning; physiological features; voting techniques
Early diagnosis of the disease is vital in medical science as prompt preventive and medical intervention can avert severe harm to human organs. In this regard, Computer-Aided Diagnosis (CAD)/ Complementary and Alternative Medicine (CAM) is appearing to be substantial as CAD/CAM techniques supported by Artificial Intelligence (AI) have provided robust, reliable, indispensable, and accurate applications for disease diagnosis. Haaris et al. found the usage of CAM technique for disease diagnosis 52% and 38% of the general population in Australia and USA, respectively [1].
CAM's iridology is a growing diagnostic tool that makes use of the textures, structures, colors, features, and other relevant elements of the iris to assess the overall health and well-being of patients. Sujitha et al. [2] exhibited an iridology chart in which they associated 80–90 zones of the iris with the organs of the human body. According to iridology, minute data contained within the iris may be used to accurately assess the health status of many vital organs of the human body, including the eyes.
The anatomical characteristics of the iris reflect the health status, circulatory framework, and beneficial adjustment of organs citation. Othman et al. [3] presented a clinical assessment that took into account the geometrical characteristics of the iris. The roundness of the collarette margins and the roundness of the pupils are two of these characteristics. The outcome revealed that the diagnosis was entirely accurate within the confines of the disease. With the use of wavelet characteristics and the adaptive neuro-fuzzy inference system, Ma et al. [4] devised a kidney disease detection method that relied mainly on the iris. The results revealed that each kidney disease was correctly diagnosed at 95% and 84%, respectively. For the estimation of cholesterol in blood vessels, Hussein et al. [5] developed an iris-based approach, which was later confirmed by others. Bansal et al. and colleagues have developed an iris-based diabetes diagnostic gadget that can detect the presence of diabetes. The suggested model is built on wavelet characteristics, and machine learning techniques, notably a Support Vector Machine (SVM), are utilized to construct it. Additionally, the number of machine learning models for the diagnosis of diabetes that have been suggested in recent years has increased significantly [6–11].
Physiological functions and features have proven an overall excellent performance in disease diagnosis analysis. These features and techniques can provide a suitable accuracy to the machine learning model to diagnose the various diseases [12,13], and outcomes have anticipated significant responses withinside the analysis and diagnosis of OLD. A complete evaluation of the importance and overall implementation of computational strategies to forecast diabetes is proposed by Dwivedi.
Similarly, fertility was also presented for the diagnosis of heart disease, and the proposed model incorporated physiological features. Analysis of work established the significance of physiological features, and results emphasized that physiological features can play a vital role in the early diagnosis of lung disease. The idea was further established by the work presented by Shafique et al. [14]. The proposed work monitored the physiological features to diagnose Chronic Obstructive Pulmonary Disease (COPD). Another work was presented by Dwivedi [15] and showed that lung Magnetic Resonance Imaging (MRI) is a potential diagnostic tool for COPD.
A machine learning-based model for diagnosing chronic obstructive pulmonary disease was presented by Tama et al. [16]. The model acquired data features from saliva samples of healthy subjects and patients. Despite all of the benefits provided by the previously mentioned related works, a limited number of researches have been published on lung disorders’ diagnosis using iris and physiological features separately. Further, both iris and physiological features have never been incorporated in CAM-based diagnostic mechanisms for OLD.
In this article, an AI-based non-invasive diagnosis of OLD is presented. Iris and physiological features from the primary dataset of 529 subjects were collected, categorized, and labelled as either healthy subjects or subjects with OLD. First, to get the iris features, Infrared Radiation (IR) images were captured using an IR sensor, and then the Region of Interest (RoI) was cropped using Digital Image Processing (DIP) techniques as specified by the iridology chart. Gray-Level Run-Length (GLRL) matrix-based features, Gray-Level Co-occurrence Matrix (GLCM) [17–20], and statistical features were extracted from the RoI of both the left and right eye of the subjects. Overall, 112 features-based Feature Vectors (FV), including the iris and physiological features, were considered for the study. Student's t-test and Principal Component Analysis (PCA) were used for feature selection. Further, the presented work incorporated ten different classifiers, and comparative analysis has been provided on all ten classifiers’ performance.
The remainder of the paper is organized as follows. Section 2 details the proposed methodology for non-invasive initial diagnosis of OLD using AI techniques. The experimental setup and results are reported and analyzed in Section 3. Finally, the conclusions and future work are presented in Section 4.
The proposed model incorporated ten different state-of-the-art machine learning techniques and integrated both iris and physiological features. The proposed non-invasive model for OLD diagnosis complements the conventional diagnostics tools/mechanisms and enables medical practitioners to diagnose the OLD with better accuracy and reliability. An overview of the proposed methodology is shown in Fig. 1, and each block has been described in details in the following subsections.
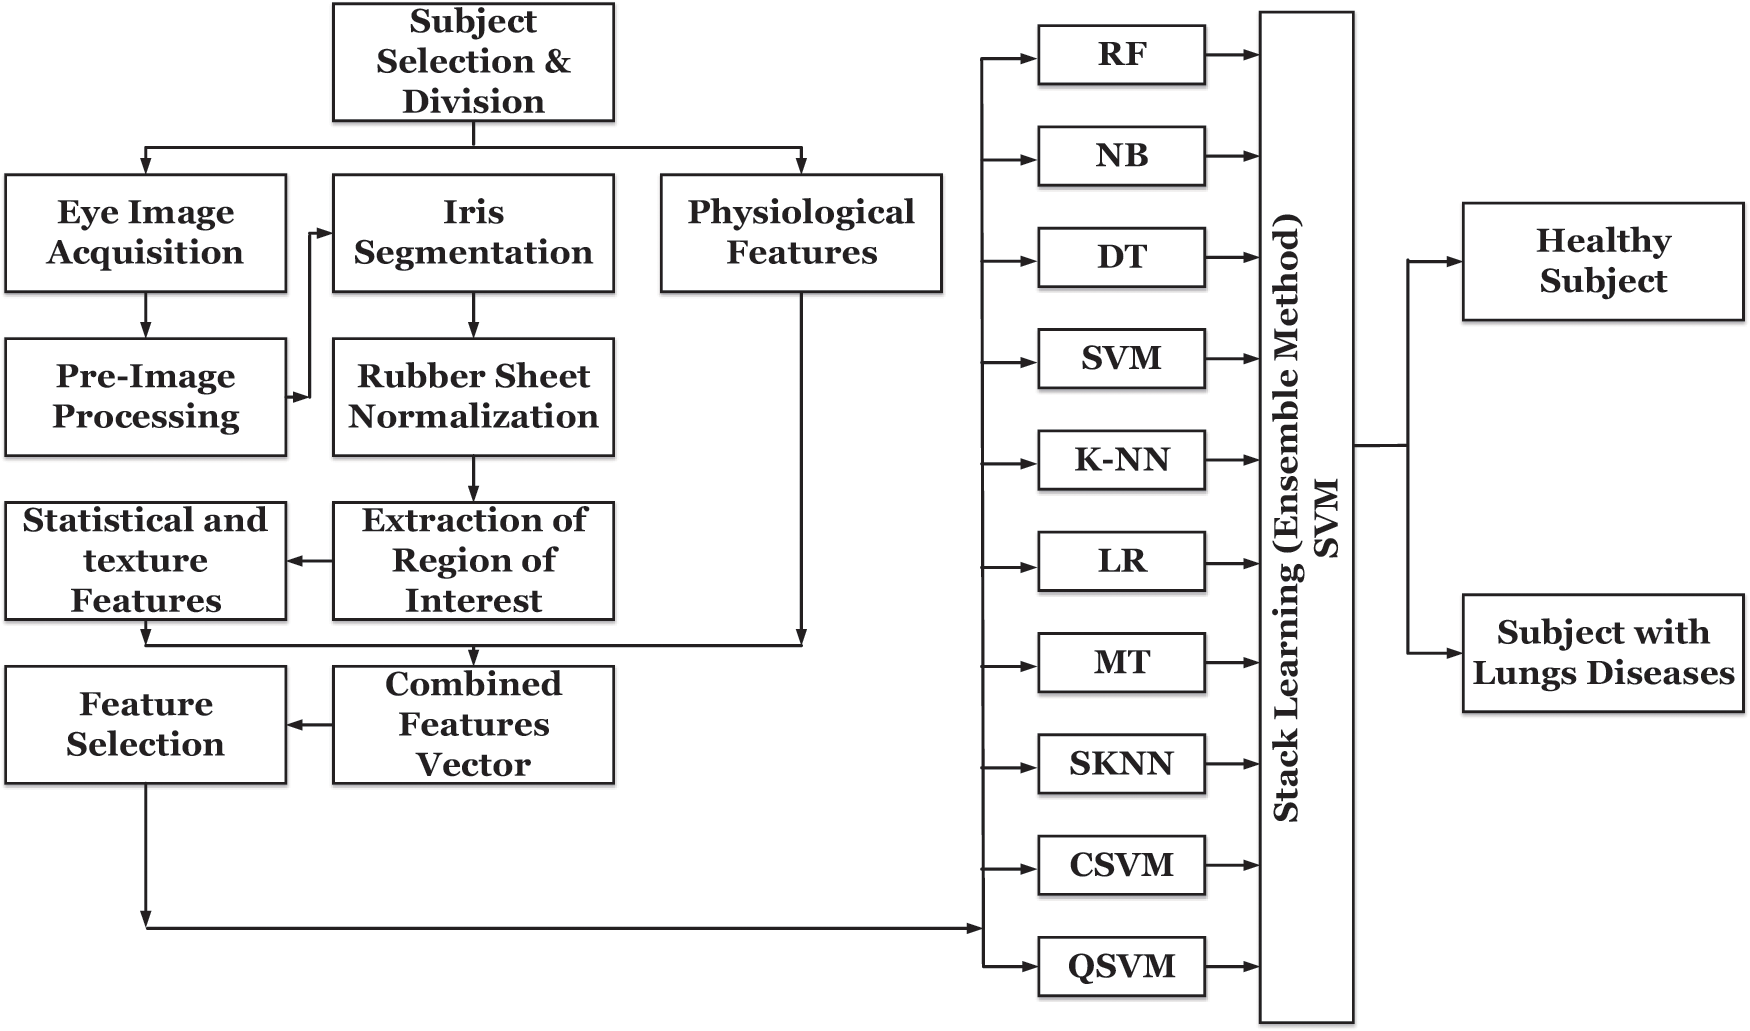
Figure 1: AI-based methodology for non-invasive initial diagnosis of obstructive lung diseases
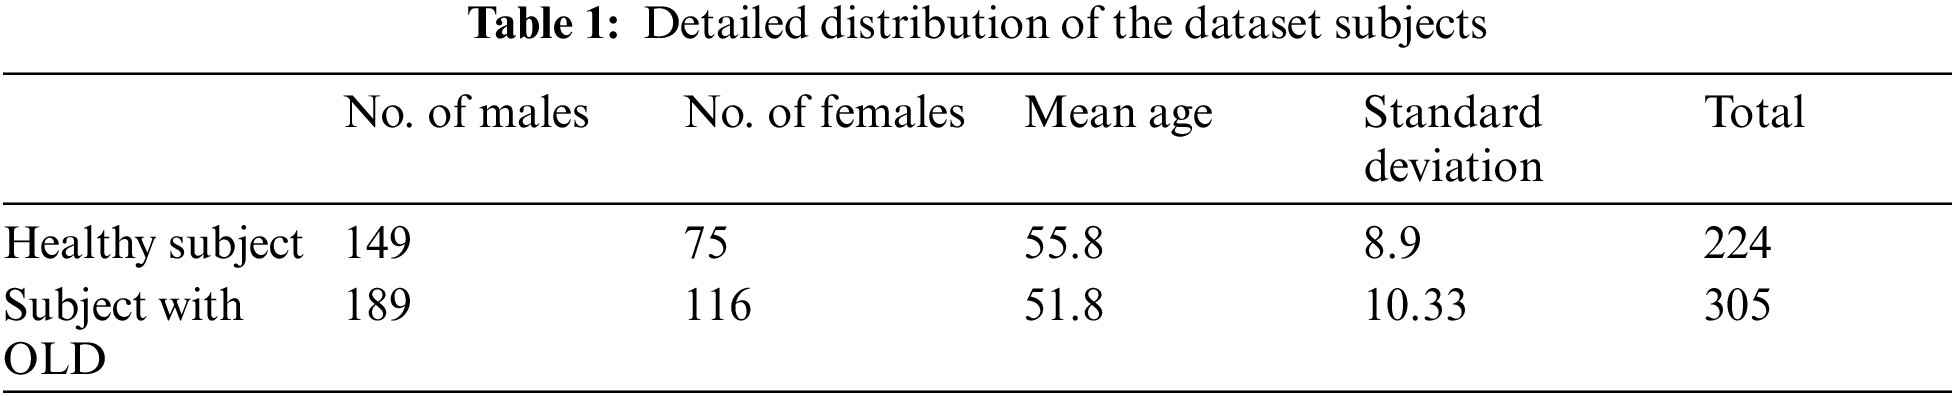
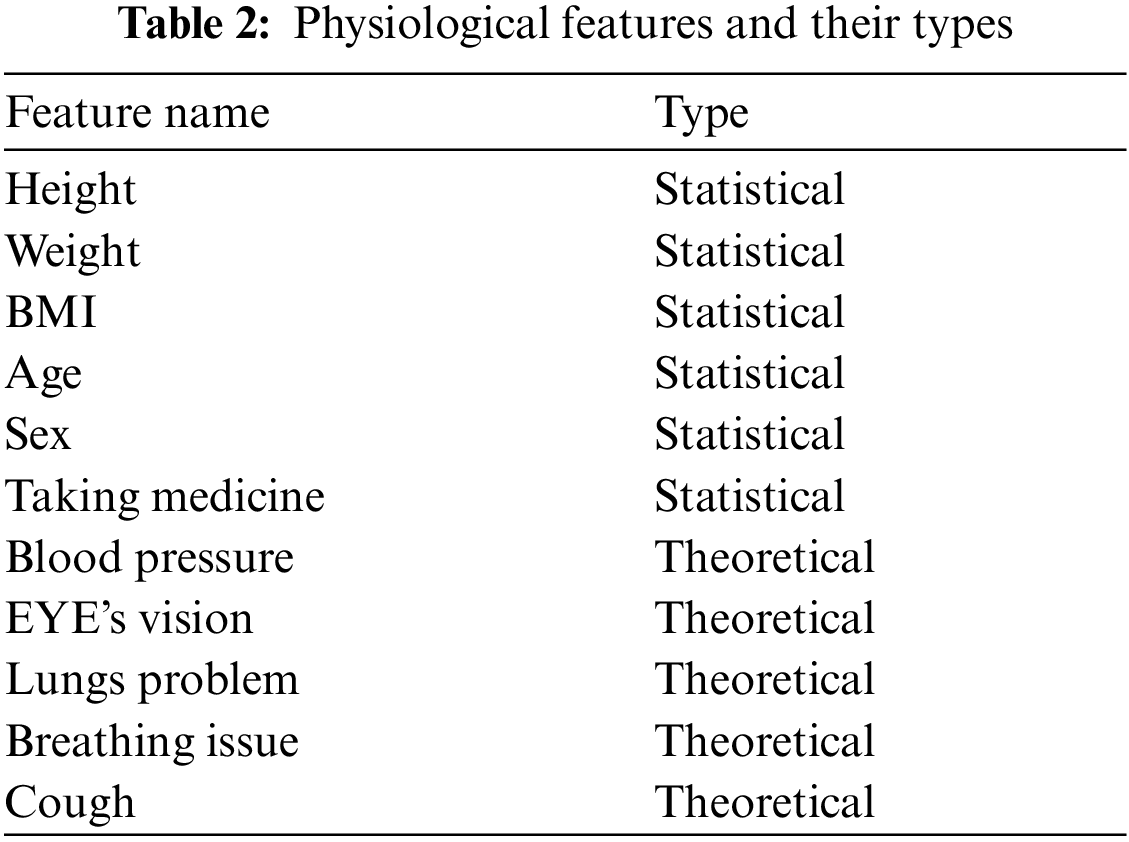
For the selection of features, 529 subjects are selected, of which 224 and 305 were males and females, respectively, as shown in Tab. 1. The clinical features of the human body are determined by factors such as heredity and, most critically, the medical condition. Disease diagnosis is greatly aided by the presence of physiological characteristics [21–23]. Wildes [24] provided an extensive investigation on the prediction of diabetes using physiological parameters that were conducted over a period of time. Tab. 2 contains a collection of physiological characteristics and their respective categories. In order to carry out the suggested approach, it is required to transform nominal data into numerical features, and this by applying the continuation method [25].
2.2 Eye Image Acquisition and Preprocessing
On an empty stomach, blood glucose levels were measured initially, and then images of the iris were obtained in the next step. The I-SCAN 2 from Cross Match Technologies (CMT) was used to get iris scans of both eyes at the same time [26]. I-SCAN 2 used the infrared spectroscopy method to produce infrared gray-level images. With the use of preprocessing techniques, the ROI was extracted. The paragraphs that follow provide detailed information about the preprocessing techniques that were employed in this work.
2.2.1 Iris Localization and Segmentation
There are two most essential properties of the iris in iridology: the iris's center and its radius Extracting and slicing the extracted iris features are the two phases in localization and segmentation steps.
In order to process the iris images, it is necessary to convert the circular iris images into fixed rectangular sections without compromising information and eliminating the external factors such as dimension irregularities and uneven illumination. In this regard, Doug-man's rubber sheet model is incorporated in this work [27]. To achieve this preprocessing step, Dougman's rubber sheet model is incorporated in this work [28].
2.2.3 Extracting Regions of Interest (ROI)
According to the iridology chart [29], different regions of the left and right iris images are linked to the human body's various organs. Further, OLD can be diagnosed using the iris segments number 2, 3, and 4 for the left iris after the second concentric circle and segment numbers 8, 9, and 10 in the right iris, as shown in Fig. 2. Therefore, after the rubber sheet normalization, the mentioned ROI for OLD diagnosis was converted into a cropped normalized rectangular iris.
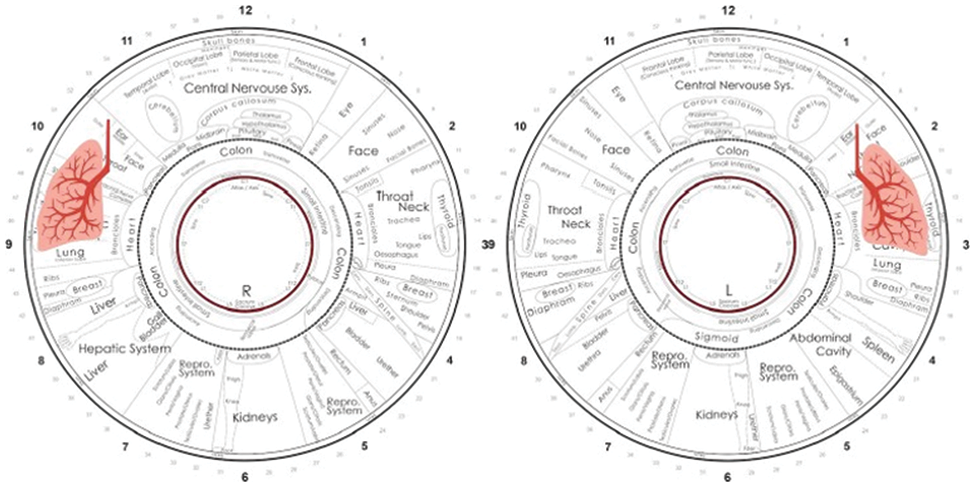
Figure 2: Iridology chart of the left and right iris images
2.3 Extraction of Iris Features
For the correct and accurate disease diagnosis, it is important to use data in which redundant features are excluded. In the case of iris features, both texture features (GLCM) and statistical features are involved. Details of these features are provided in the following subsections.
Iris images of the appropriate eye were taken after the blood glucose level was tested on an empty stomach for the first time. CMTI-SCAN 2 of CMT, was used to collect the iris images, which were then analyzed. Fig. 3 shows examples of images taken from healthy and diseased (OLD) individuals, respectively.
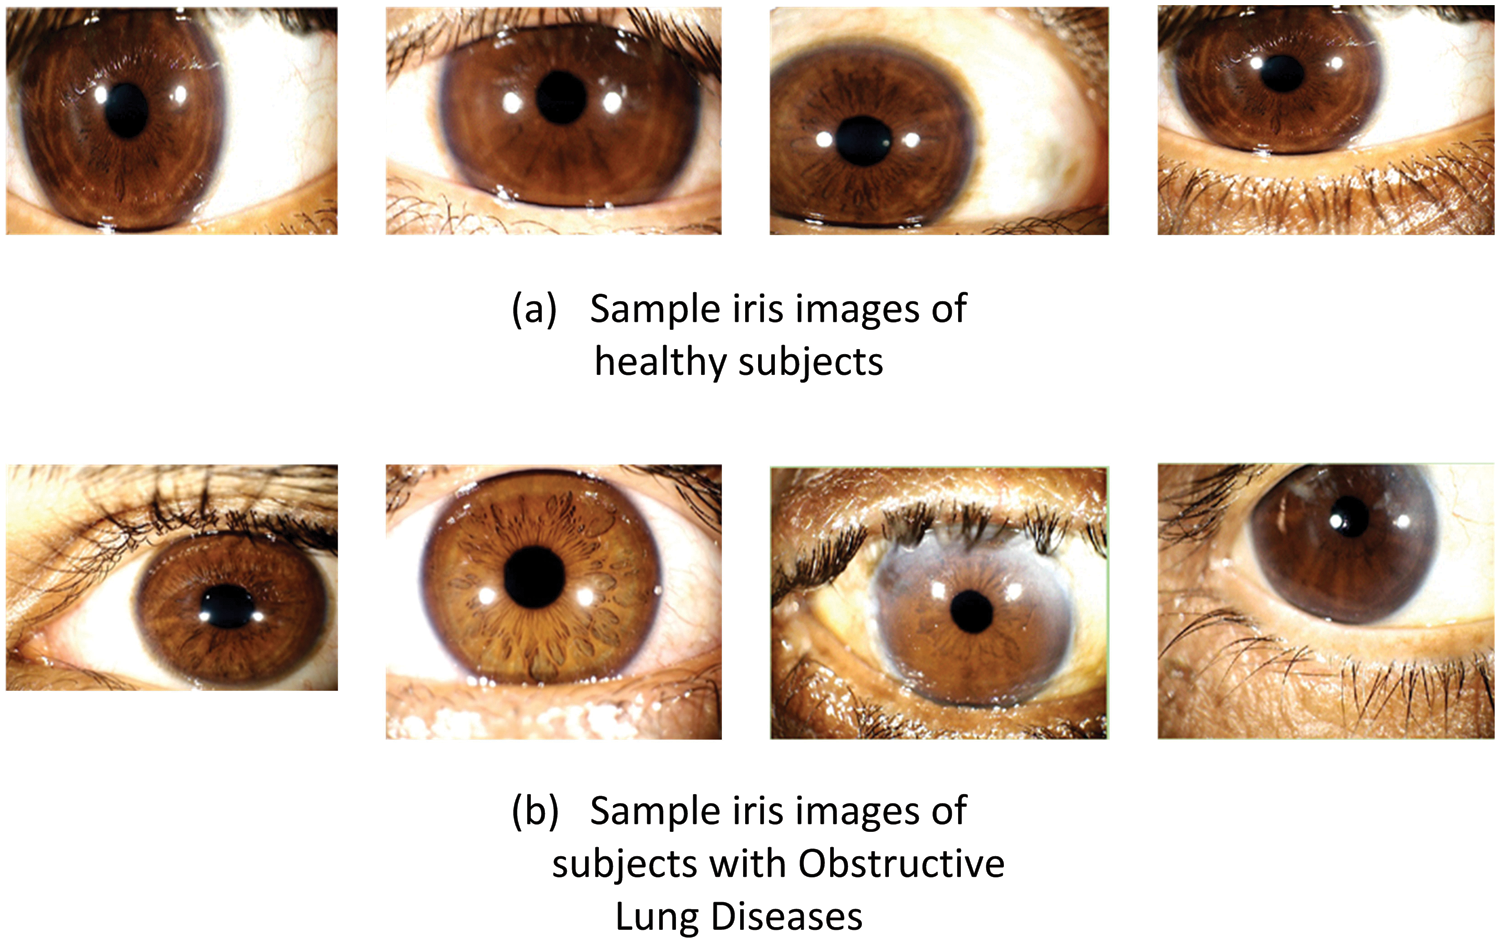
Figure 3: Iris samples: (a) Healthy subjects, (b) Subjects with Obstructive Lung Diseases (OLD)
Few parameters such as Mean Intensity (MI), correlation, Standard Deviation (SD), contrast, skewness, entropy, and kurtosis are chosen as features that can provide the details of the grayscale values of the iris images.
2.4.2 Gray-Level Co-Occurrence Matrix (GLCM) Features
As the spatial gray-level dependency matrix, which is used to assess and quantify the distribution of gray-level intensities and inter-pixel interactions, GLCM is an important component of image processing. For the diagnostic approach described below, 19 GLCM-based characteristics were retrieved and used as shown in Eqs. (1)–(15).
Here, Lp,q is element p, q of the normalized symmetrical GLCM, N is the number of gray levels in the image, μ is the GLCM mean which can be calculated using Eq. (20).
σ2 is the variance of the intensities that can be calculated using Eq. (15).
2.4.3 Gray-Level Length (GLRL) Matrix Feature
As the spatial gray-level dependency matrix, which is used to assess and quantify the distribution of gray-level intensities and inter-pixel interactions, GLCM is an important component of the image processing phase. For the diagnostic method described below. GLCM-based characteristics were retrieved and used to develop the technique. The mathematical forms of such characteristics are given in Eqs. (16)–(22).
The total number of features used in the proposed work is 112, of which 22 are the physiological features. It is also important to reduce the overall time complexity. To achieve a low time complexity, duplicate features must be removed from the dataset. For this, two reduction methods, which are student t-test and Principal Component Analysis (PCA), were used.
This test is used for binary classification .. It is a well-known method to select the relevant features. To distinguish two classes, the student's t-test determines variability and class highlights the difference [30].
2.5.2 Principal Component Analysis
PCA is another technique used to remove the redundant features from the dataset by converting the correlated variable into uncorrelated variables [31].
For the classification, a supervised learning method in which decisions are concluded based on the test data and labels is employed. The classifiers’ performance is linked with the nature, type, and complexity of the data set; therefore, data analysis is essential while selecting the classifier. Overall, ten classifiers from different families have been considered, which are: Random Forest (RF), Naïve Byes (NB), Decision Tree (DT), Support Vector Machine (SVM), K-Nearest Neighbors (K-NN), Linear Regression, (LR), Median Tree (MT), Subspace K-Nearest Neighbor (SKNN), Cubic Support Vector Machine (CSVM), Quadratic Support Vector Machine (QSVM). The manual selection of the best suitable classifier is difficult. Therefore, cross-validation is used for parameter selection. In the cross-validation method, we have selected the cross-validation value (K) = 10.
3 Experimental Setup, Results, and Discussion
In this work, the experiments are carried out using a PC with the following configuration properties: an x64-based processor, an Intel Core i7-8565U CPU @ 1.80 GHz 1.99 GHz, and a 16 GB RAM running on Windows 10 with NVIDIA GeForce MX. The ML classifiers are implemented using Jupyter notebook under python 3.7 programming language. In order to assess the performance of the model for the diagnosis of OLD, it is required to evaluate the performance of classifiers by applying quantitative metrics. For this purpose, five performance metrics were calculated: accuracy, sensitivity, precision, specificity, and F1-Score. When evaluating the overall performance of the proposed model for disease diagnosis, it is important to compute four sorts of outcomes. Let's consider class A for subjects with OLD and class B for healthy subjects. The following metrics are measures are considered in this proposed work: Low-Level Run Emphasis (LGLRE), Run-Length Non-uniformity (RLN), Long Run Emphasis (LRE), Short Run Emphasis (SRE), and Run Percentage (RP). By using Eqs. (16)–(22). These measures are computed.
The five performance measures described above, which are used for the performance assessment of the considered classifiers, are derived using the TP (True Positive), FP (False Negative), TN (True Negative), and FN (False Negative) values.
• Accuracy: It is an essential performance indicator for classification models. It indicates the total number of correctly classified subjects.
• Precision: It indicates the number of samples from one class that are correctly classified by the model.
• Sensitivity/TPR: True positive rate or sensitivity indicates the number of times subjects from any specific class has been correctly classified. Higher sensitivity means better performance of a model.
• Specificity: It refers to the number of samples correctly classified and also provide information about False Positive Rate (FPR).
• F1-Score: It gives information about the performance of the model. It relates to precision and sensitivity.
The effectiveness of this study is dependent on two primary factors: feature selection and classification techniques. Consequently, to assess the entire model, it is important to examine the outcomes of both the feature selection approach and the classification method.
3.1 Performance Evaluation with PCA
Feature selection is one of the main factors for the success of the machine learning model, as discussed earlier. The feature selection technique, also known as the feature reduction method, is used once the features have been extracted. The main goal of such methods is to eliminate unimportant features and focus on the most significant ones for correct classification. The data and computational complexity are decreased in this manner; nevertheless, lowering data features might dramatically lower the classifier's performance. Consequently, the feature selection process should verify that the correct features are selected and that only redundant features are removed. Principal component analysis and student's t-test are two well-known feature selection methods that were adopted in the study. The performance of all 10 classifiers was compared to different PCA percentages of Specific Explained Variance (SEV). It was reported that the accuracy of all classifiers was similar when tested against various SEV values up to 99% SEV of PCA. Fig. 4 depicts a sample case of cubic SVM. The performance metrics (precision, sensitivity, specificity, and F-score) followed a similar pattern, as shown in Fig. 4.
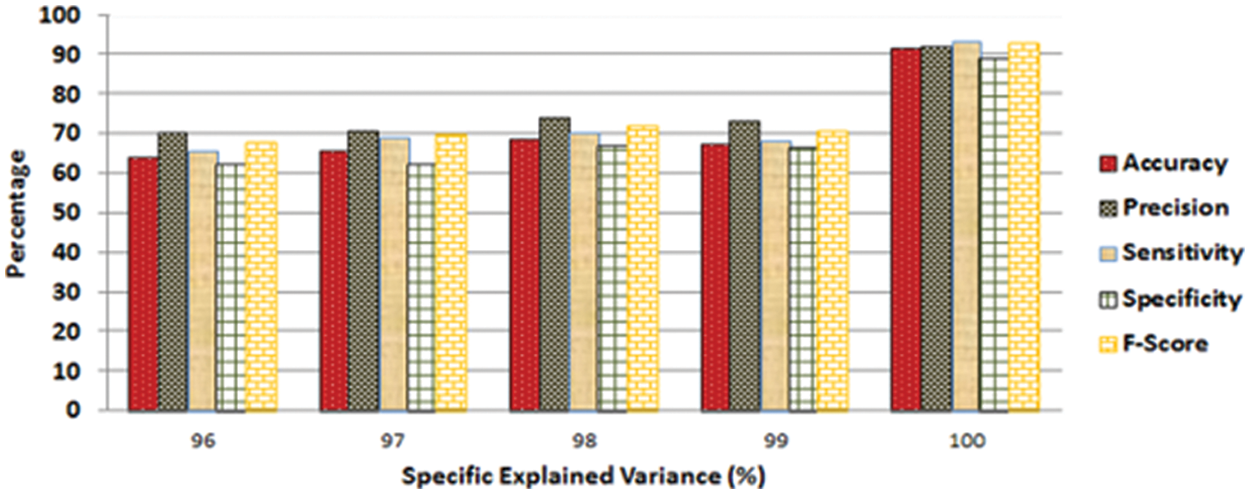
Figure 4: Values of different performance metrics measured for the SVM classifiers by considering various SEV percentages
3.2 Evaluation Using Student's T-Test
To evaluate the overall performance of the student's t-test for feature selection, an in-depth experiment is performed. There has been no significant increase in the accuracy of any of the classifiers, as seen in Fig. 5. Furthermore, the FV of forty functions results in a significant boost in accuracy. Increasing the number of features in the FV from forty to fifty, on the other hand, gives in a slight gain in accuracy, as shown in Fig. 5.
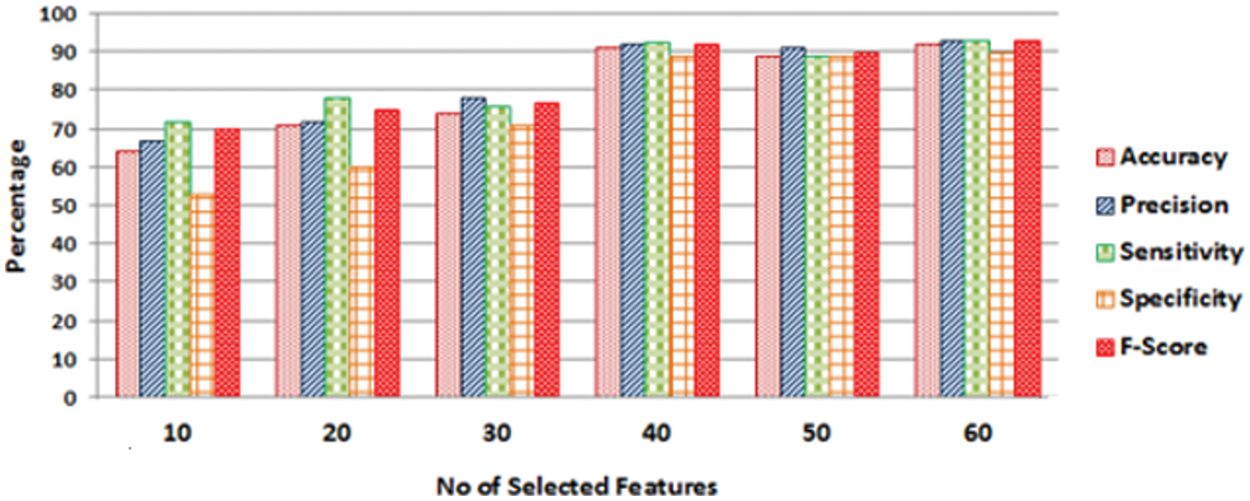
Figure 5: Performance measures of SVM classifier obtained by varying the number of selected features
An increase in the number of features leads to an increase in computing complexity. Through the experiments that were carried out, it is demonstrated that the FV of 40 features was the best choice for all classifiers in the study. It's worth noting that the PCA method did it by utilizing the FV of 86 features. As a result, it was concluded that Student's t-test performed much better than PCA. The classifier under discussion in Fig. 4 is CSVM, but the same behavior was observed for all other classifiers’ performance metrics (accuracy, precision, sensitivity, specificity, and F1-score), as was revealed for the case under consideration in Fig. 4.
In this study, FV is defined as a combination of psychological and iris features. It is critical to assess the number of physiological features picked using the student's t-test approach to verify the significance of physiological features in a specific case/situation. A total of eight physiological features were considered in the work, which are: age, BMI, shortness of breath, smoking, alcoholism, systolic blood pressure. This consideration emphasizes the importance of physiological characteristics, especially in OLD diagnosis.
3.3 Classifiers’ Performance Evaluation
As previously stated, the overall model of AI-Based Non-invasive Diagnosis for OLD included 10 unique classifiers that were used to make the diagnosis. The accuracy, precision, sensitivity, specificity, and F-Score of classifiers were evaluated using the following execution pointers: Accuracy (Fig. 6), Precision (Fig. 7), Sensitivity (Fig. 8), Specificity (Fig. 9), and F-Score (Fig. 10), and the overall result is shown in Tab. 3. It is found that the SVM performed well across the board in terms of all performance measures.
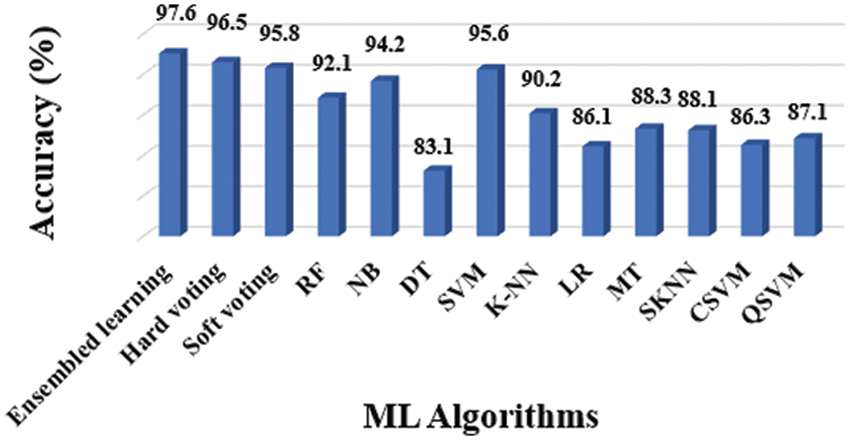
Figure 6: Accuracy results of different classifiers
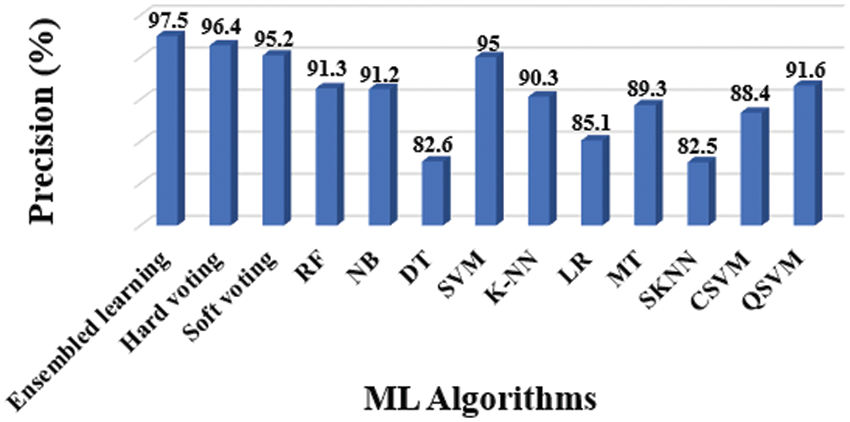
Figure 7: Precision results of different classifiers
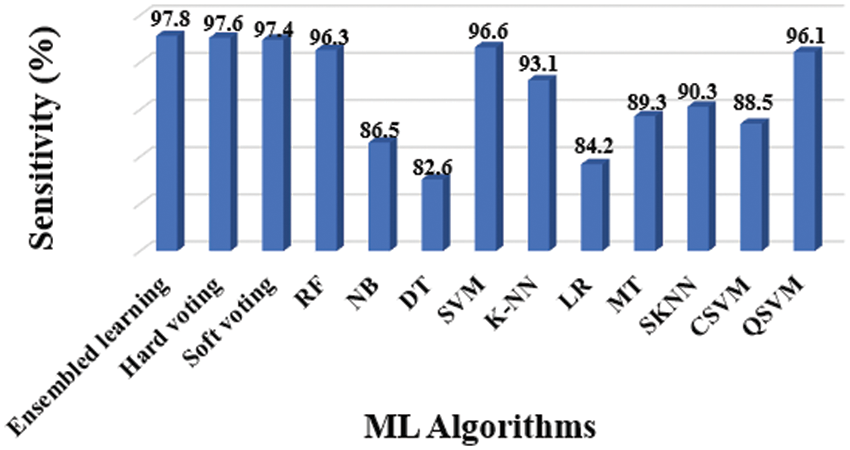
Figure 8: Sensitivity results of different classifiers
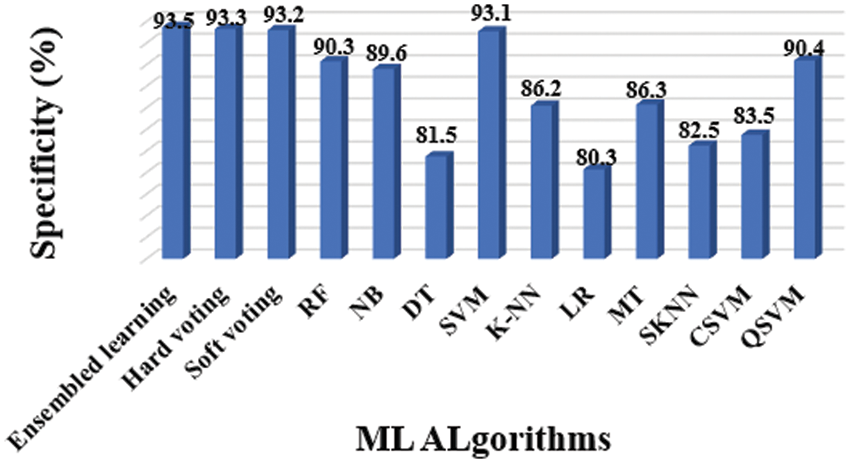
Figure 9: Specificity results of different classifiers
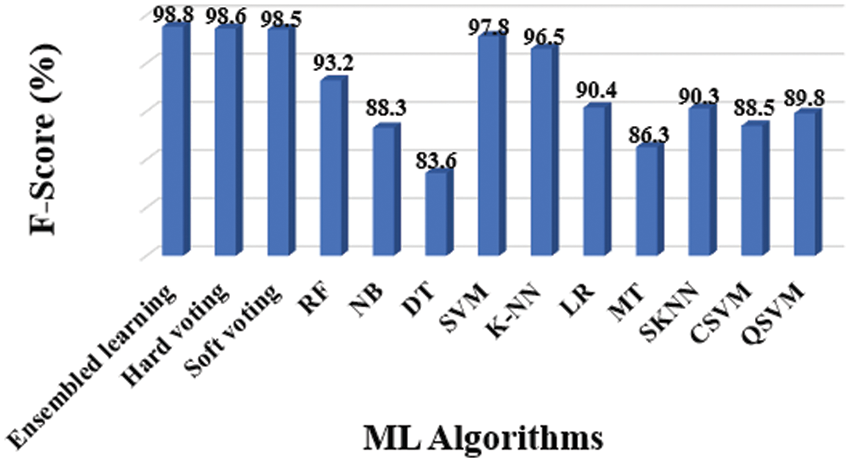
Figure 10: F-score results of different classifiers
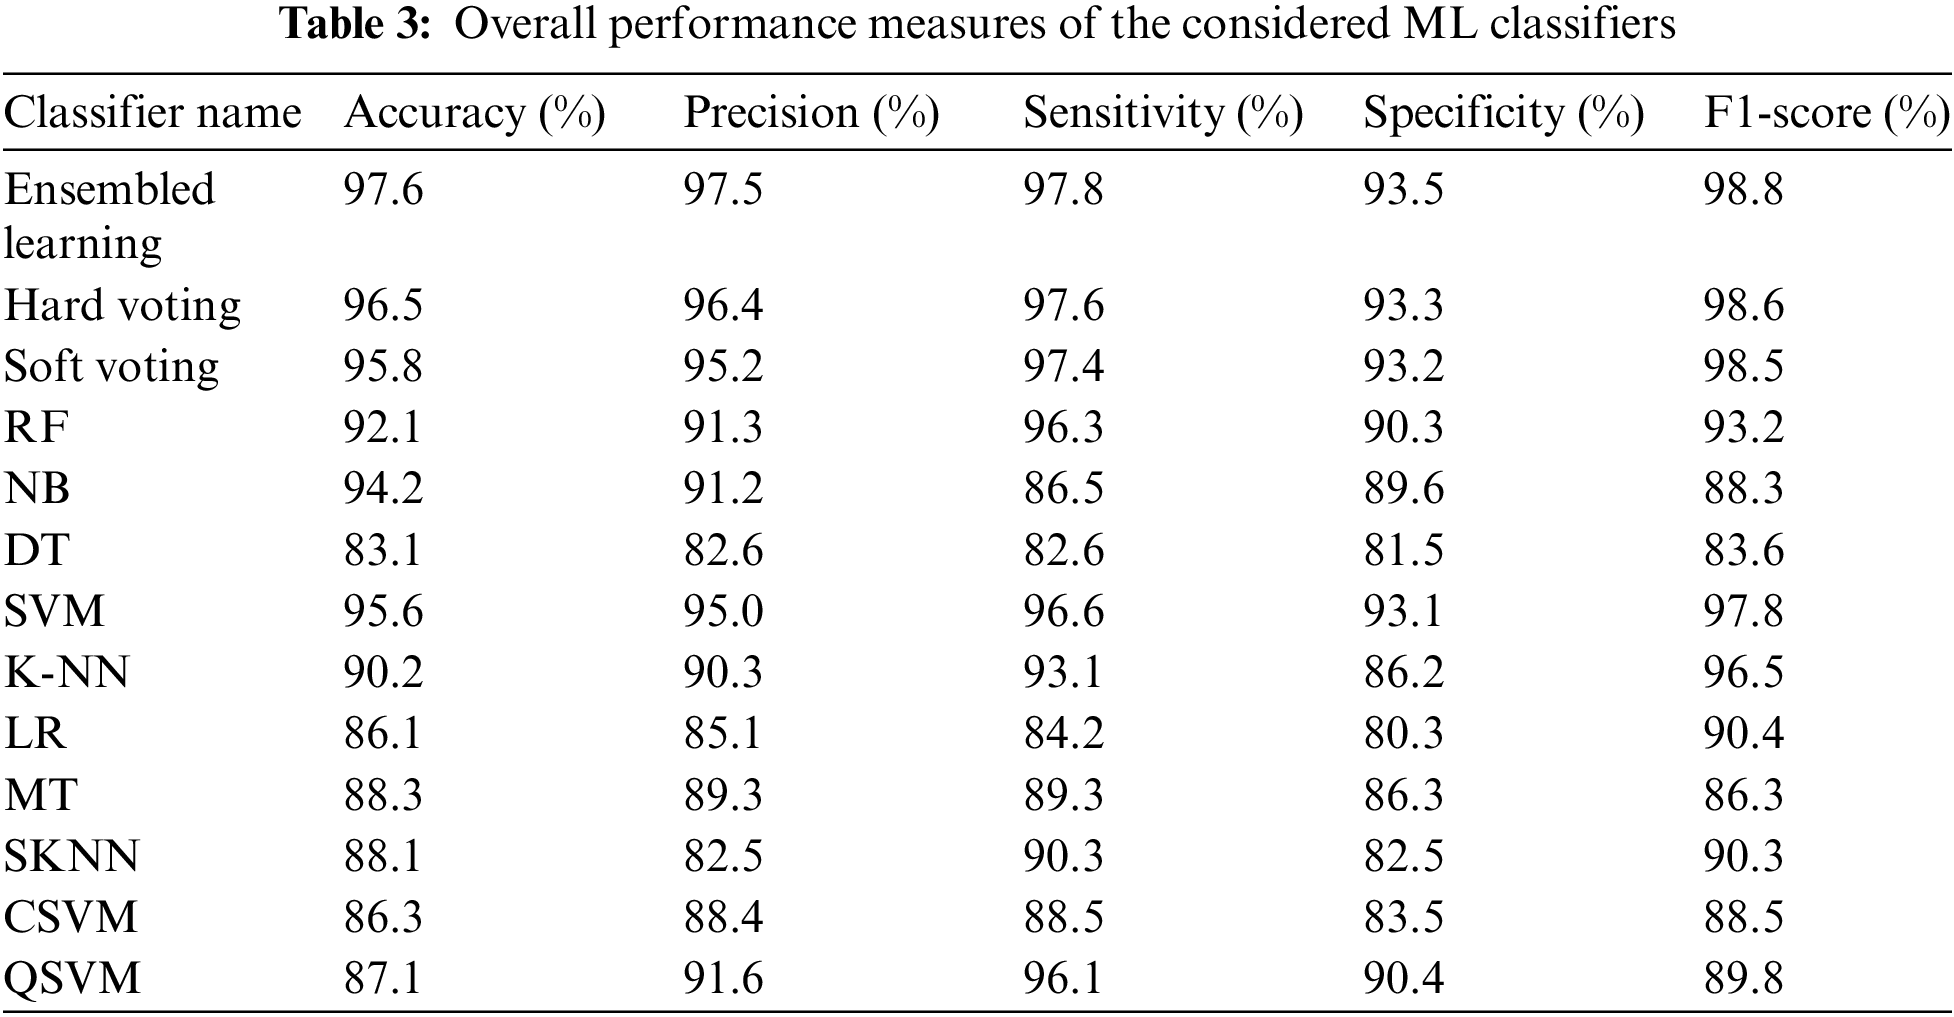
The entire model of the proposed methodology contained 10 distinct classifiers that were applied to achieve the diagnosis, as previously stated. The following experiments were conducted to assess considered classifiers’ accuracy, precision, sensitivity, specificity, and F1-Score: Tab. 3 shows the overall findings, which includes accuracy (Fig. 6), precision (Fig. 7), sensitivity (Fig. 8), specificity (Fig. 9), and F-Score (Fig. 10) measures.
Precision and specificity are the most essential performance metrics, because precision reflects the proportion of accurately labelled subjects, whilst specificity (1-Specificity) determines the fraction of subjects that are wrongly classified. The number of false positives is inversely proportional to the test's specificity. The SVM classifier outperforms the other ML classifiers, as demonstrated in Figs. 6 and 9.
The evidence about accurately classified subjects with OLD are obtained by understanding the results in terms of accuracy and sensitivity. As shown in Figs. 7 and 8, the SVM performs better than other classifiers in this situation. The F1-Score, on the other hand, is a harmonic average of accuracy and sensitivity, indicating that the SVM performs better for OLD diagnosis, as illustrated in Fig. 10.
Voting strategies are also employed to increase the accuracy of the overall proposed model. The produced outcomes of the 11 ML classifiers are obviously not the same. A reasonable strategy in this situation would be to combine these findings in order to produce the final classification. This strategy appears to be capable of improving the dataset's final classification. This work employs two well-known voting strategies, which are hard and soft voting.
The hard voting technique is also known as majority voting. We forecast the final class label in the hard voting situation as the class label predicted most frequently by the individual classifiers. Fig. 11 shows the several values of K for the K fold analysis and their corresponding accuracy values, on the basis of which hard voting techniques classify healthy and diseased subjects.
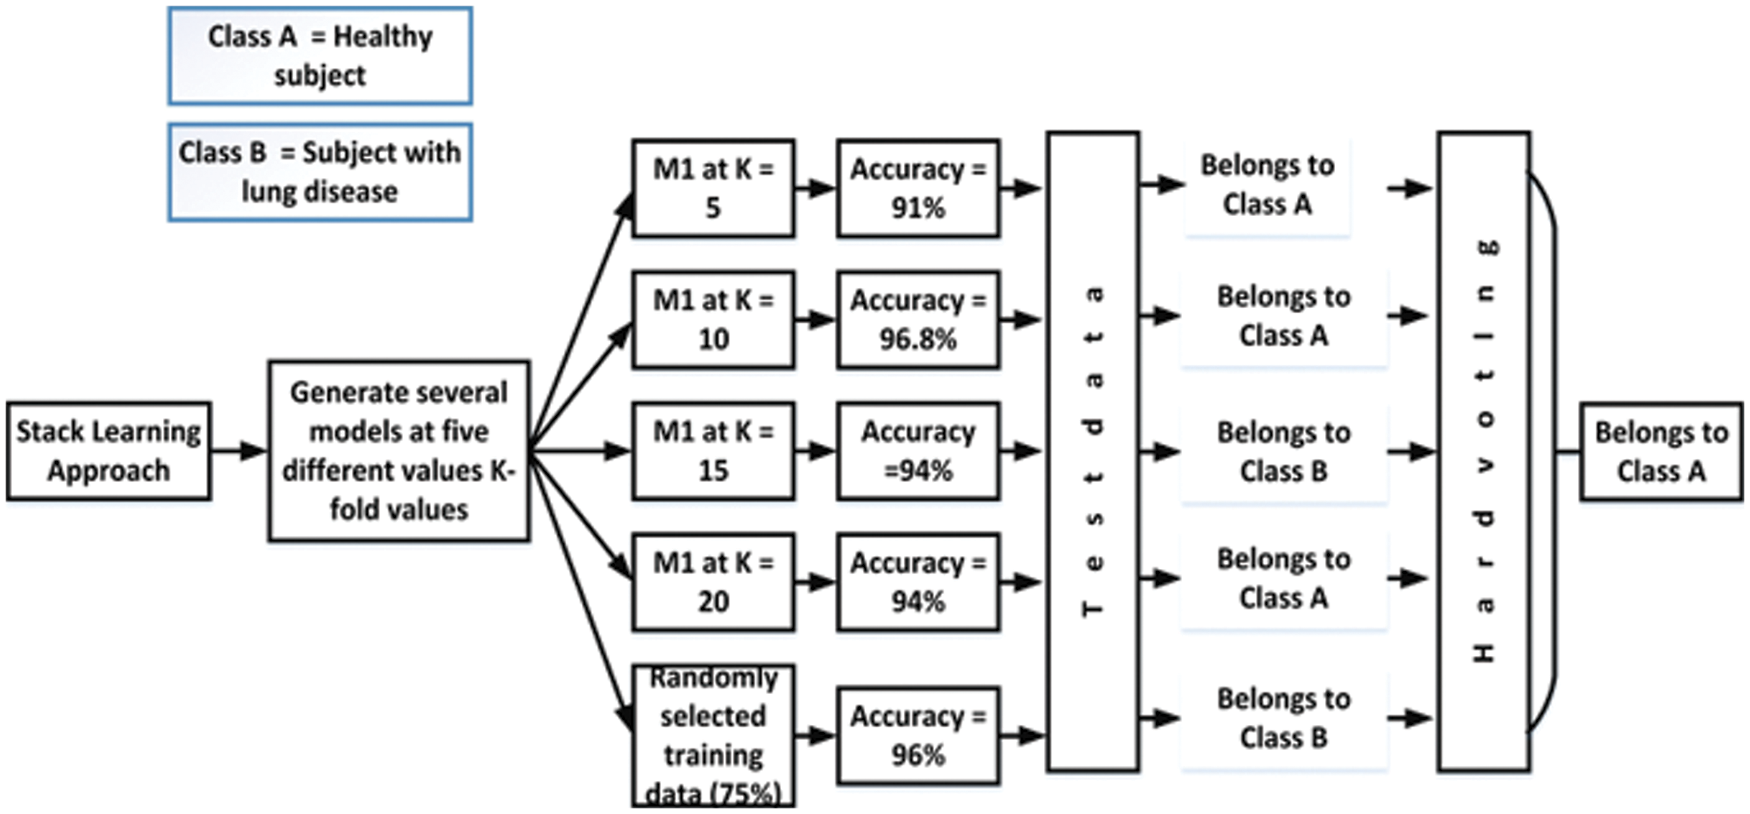
Figure 11: Hard voting strategy
Majority voting is another name for the hard voting strategy. By employing this strategy, we predict the final class label as the class label predicted by most classifiers and the classification accuracy is raised to 96.5 which is improved by 0.09%. Fig. 11 depicts the various K fold analysis values and their related accuracy values, which are used to classify healthy and diseased subjects using the hard voting strategy.
In soft voting, each classifier assigns a probability value to each data point that it belongs to a given target class. The results are averaged and weighted according to the relevance of the classifier. The vote is then awarded to the target label with the highest sum of weighted probabilities. After employing soft voting on the proposed work, it is noted that the classification accuracy of the proposed models increased by 0.03%. Fig. 12 depicts the soft voting strategy that is adopted in this work.
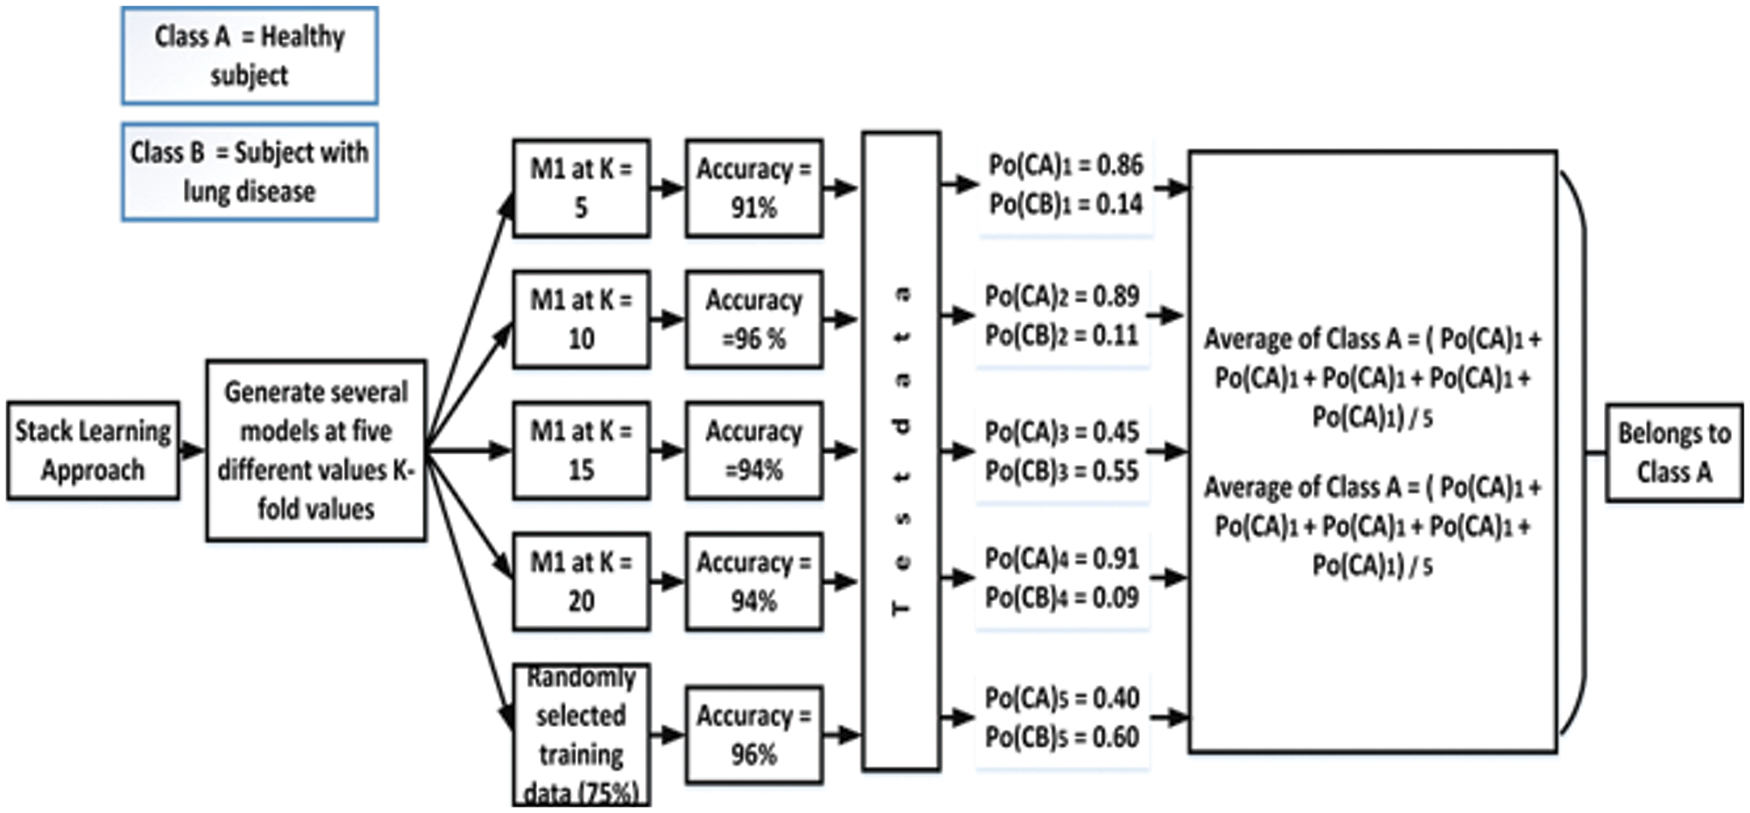
Figure 12: Soft voting strategy
As previously stated, 10-fold cross-validation was used to evaluate the findings; consequently, the selection method for 10-fold cross-validation should be examined. Fig. 13 depicts a K-fold study of the CSVM classifier with various K values (5, 10, 15, 20). We selected K = 10 in cross-validation since raising the value of K above 10 did not result in a substantial improvement in the conducted experiments.
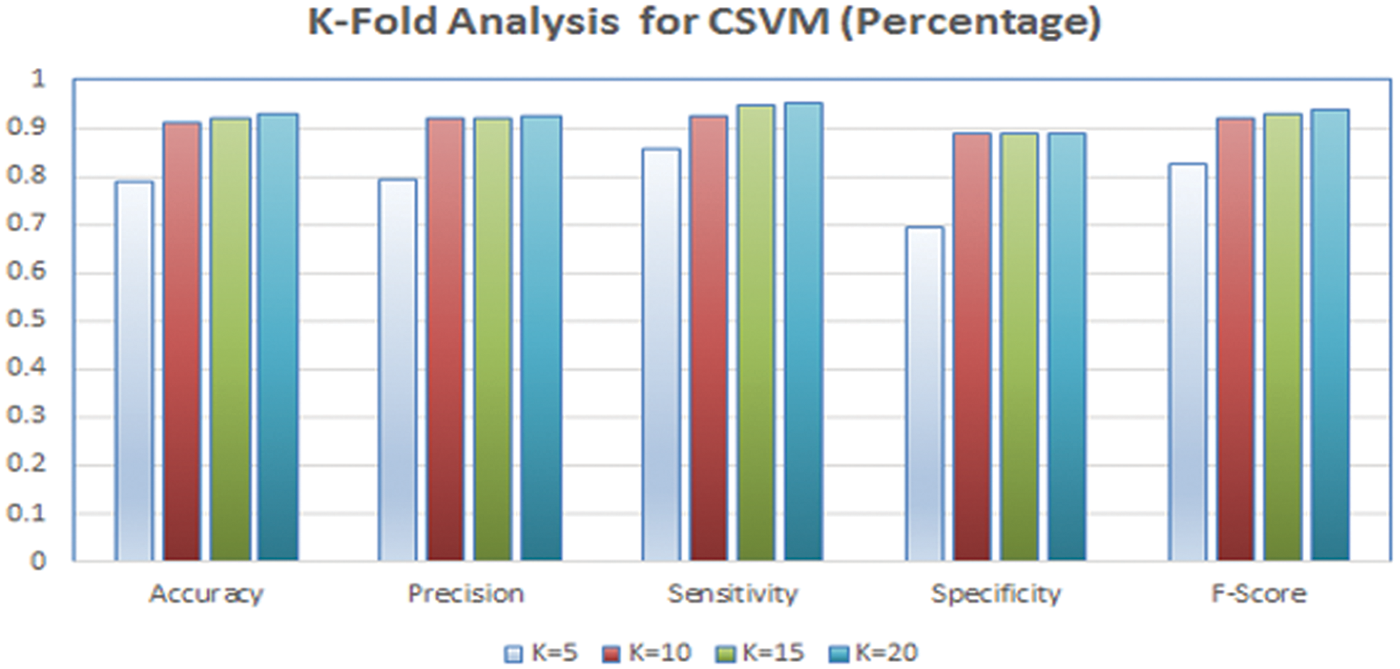
Figure 13: K-fold analysis for CSVM classifier
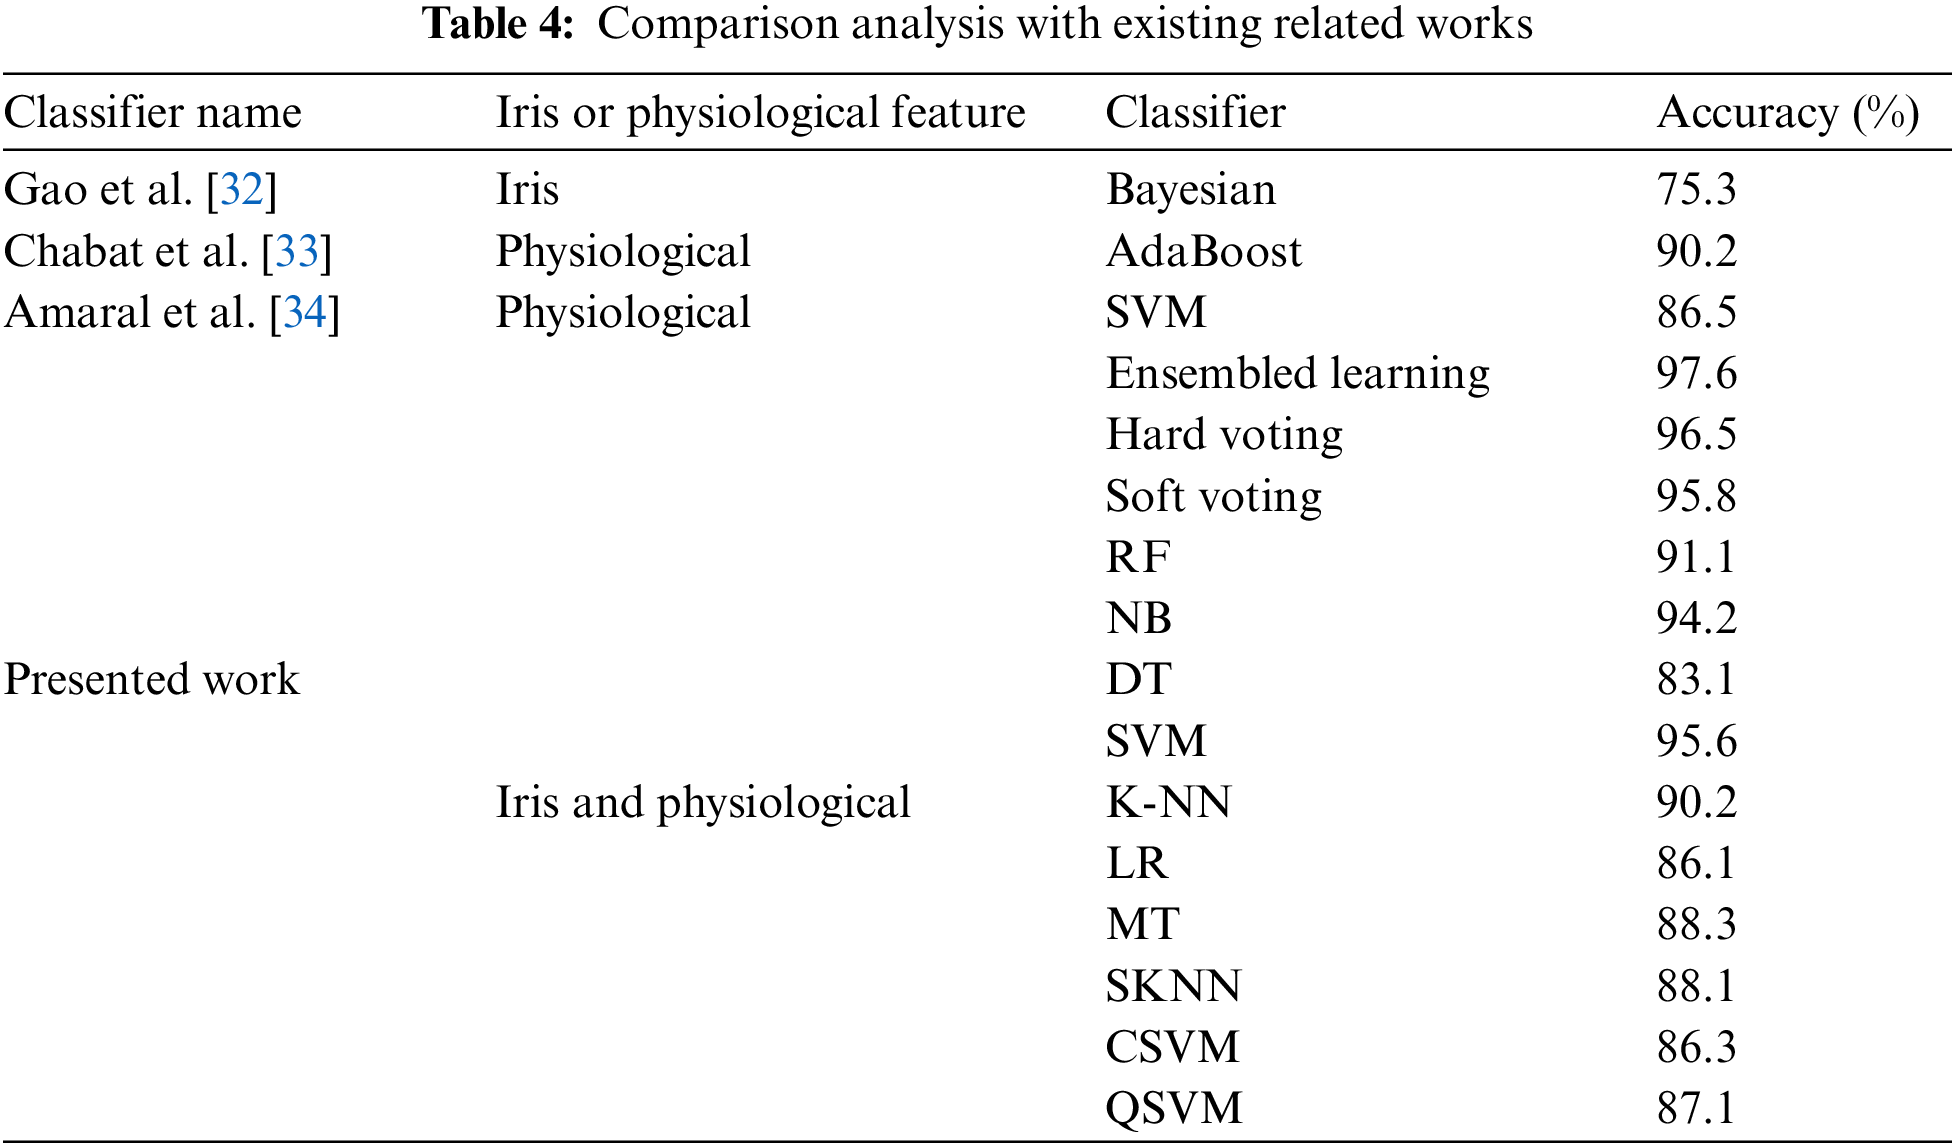
Several studies on non-invasive lung disease diagnosis have been carried out, and the proposed work has been compared to the current literature in order to guide future research. The final findings are shown in Tab. 4. The proposed approach of AI-based non-invasive diagnosis, which combined both physiological and iris information, was used to identify OLD efficiently. The suggested approach outperformed existing OLD diagnostic approaches in terms of accuracy, which attained 91%.
This study aims to present a non-invasive AI-based methodology for the diagnosis of obstructive lung diseases. The experiments were conducted on the information of 529 subjects (224 healthy subjects and 305 subjects with OLD). The proposed approach incorporates an innovative method merging both physiological and iris features for the diagnosis of OLD, as well a set of feature selection techniques. Additionally, the suggested model includes ten ML classifiers, and through the experimental results, it was proven that the proposed model might be considered as an effective solution for non-invasive early detection of OLD. This study has a limitation in that it only detects OLD at an early stage and does not indicate the type of lung disease that was detected. It is possible to address this limitation by segregating between both the textural and statistical pattern alterations of iris images obtained from patients with various types of lung disease and by acquiring and conducting experiments on distinct datasets for each type of lung disease.
The only limitation that can be found in the proposed work is that it requires a huge amount of data to achieve an accuracy higher than 97%. This can be reduced in future by employing convolutional neural networks (CNN) instead of machine learning techniques.
Acknowledgement: The authors would like to acknowledge the support of Prince Sultan University for paying the Article Processing Charges (APC) of this publication.
Funding Statement: The authors received no specific funding for this study.
Conflicts of Interest: The authors declare that they have no conflicts of interest to report regarding the present study.
1. P. E. Harris, K. L. Cooper, C. Relton and K. J. Thomas, “Prevalence of complementary and alternative medicine (CAM) use by the general population: A systematic review and update,” International Journal of Clinical Practice, vol. 66, no. 10, pp. 924–939, 2012. [Google Scholar]
2. R. Sujitha and V. Seenivasagam, “Classification of lung cancer stages with machine learning over big data healthcare framework,” Journal of Ambient Intelligence and Humanized Computing, vol. 12, pp. 5639–5649, 2021. [Google Scholar]
3. Z. Othman and A. S. Prabuwon, “Preliminary study on iris recognition system: Tissues of body organs in iridology,” in 2010 IEEE EMBS Conference on Biomedical Engineering and Sciences (IECBES), Kuala Lumpur, Malaysia, IEEE, pp. 115–119, 2010. [Google Scholar]
4. L. Ma, D. Zhang, N. Li, Y. Cai, W. Zuo et al., “Iris-based medical analysis by geometric deformation features,” IEEE Journal of Biomedical and Health Informatics, vol. 17, no. 1, pp. 223–231, 2012. [Google Scholar]
5. S. Hussein, O. Hassan and M. Granat, “Assessment of the potential iridology for diagnosing kidney disease using wavelet analysis and neural networks,” Biomedical Signal Processing and Control, vol. 8, no. 6, pp. 534–541, 2013. [Google Scholar]
6. R. Ramlee, K. Aziz, S. Ranjit and M. Esro, “Automated detecting arcus senilis, symptom for cholesterol presence using iris recognition algorithm,” Journal of Telecommunication, Electronic and Computer Engineering (JTEC), vol. 3, no. 2, pp. 29–39, 2011. [Google Scholar]
7. D. Bach and E. Wachtel, “Phospholipid/cholesterol model membranes: Formation of cholesterol crystallites,” Biomembrances, vol. 1610, no. 2, pp. 187–197, 2003. [Google Scholar]
8. R. A. Ramlee and S. Ranjit, “Detecting cholesterol presence with iris recognition algorithm,” in Int. Conf. on Information Management and Engineering, Hong Kong, China, pp. 714–717, 2009. [Google Scholar]
9. K. Klein and J. Buse, “The trials and tribulations of determining HbA targets for diabetes mellitus,” Nature Reviews Endocrinology, vol. 16, no. 4, pp. 717–730, 2020. [Google Scholar]
10. R. Agarwal and R. Sharma, “Determining diabetes using iris recognition system,” International Journal of Diabetes in Developing Countries, vol. 35, no. 4, pp. 432–438, 2015. [Google Scholar]
11. J. Banzi and Z. Xue, “An automated tool for non-contact, real-time early detection of diabetes by computer vision,” International Journal of Machine Learning and Computing, vol. 5, no. 3, pp. 225, 2015. [Google Scholar]
12. L. Salles and M. Silva, “The sign of the cross of andreas in the iris and diabetes mellitus: A longitudinal study,” Revista Escola de Enfermagem USP, vol. 49, no. 4, pp. 0626–0631, 2015. [Google Scholar]
13. G. Battineni, G. Sagaro, N. Chinatalapudi and F. Amenta, “Applications of machine learning predictive models in the chronic disease diagnosis,” Journal of Personalized Medicine, vol. 10, no. 2, pp. 21, 2020. [Google Scholar]
14. A. Shafique, J. Ahmed, W. Boulila, H. Ghandorh, J. Ahmad et al., “Detecting the security level of various cryptosystems using machine learning models,” IEEE Access, vol. 9, pp. 9383–9383, 2020. [Google Scholar]
15. A. Dwivedi, “Analysis of computational intelligence techniques for diabetes mellitus prediction,” Neural Computing and Applications, vol. 30, no. 12, pp. 3837–3845, 2018. [Google Scholar]
16. B. Tama and K. Rhee, “Tree-based classifier ensembles for early detection method of diabetes: An exploratory study,” Artificial Intelligence Review, vol. 51, no. 3, pp. 355–370, 2019. [Google Scholar]
17. J. Xi and Z. Weizhong, “Correlating exhaled aerosol images to small airway obstructive diseases: A study with dynamic mode decomposition and machine learning,” PloS One, vol. 14, no. 1, pp. e0211413, 2019. [Google Scholar]
18. A. Rajeh and J. Hurst, “Monitoring of physiological parameters to predict exacerbations of chronic obstructive pulmonary disease (COPDA systematic review,” Journal of Clinical Medicine, vol. 5, no. 12, pp. 108, 2016. [Google Scholar]
19. F. Polverino, E. B. Hysinger, N. Gupta, M. Willmering, T. Olin et al., “Lung MRI as a potential complementary diagnostic tool for early COPD,” The American Journal of Medicine, vol. 133, no. 6, pp. 757–760, 2020. [Google Scholar]
20. P. S. Zarrin, S. Pouya, N. Roeckendorf and C. Wenger, “In-vitro classification of saliva samples of COPD patients and healthy controls using machine learning tools,” IEEE Access, vol. 8, pp. 168053–168060, 2020. [Google Scholar]
21. X. H. Meng, Y. X. Huang, D. P. Rao, Q. Zhang and Q. Liu, “Comparison of three data mining models for predicting diabetes or prediabetes by risk factors,” The Kaohsiung Journal of Medical Sciences, vol. 29, no. 2, pp. 93–99, 2013. [Google Scholar]
22. A. Y. Betancourt and M. G. Silvente, “A keypoints-based feature extraction method for iris recognition under variable image quality conditions,” Knowledge-Based Systems, vol. 92, pp. 169–182, 2016. [Google Scholar]
23. J. Planger, P. Schabhuttl, T. Vuherer and N. Enzinger, “CMT additive manufacturing of a high strength steel alloy for application in crane construction,” Metals, vol. 6, no. 9, pp. 650, 2019. [Google Scholar]
24. R. P. Wildes, “Iris recognition: An emerging biometric technology,” in Proc. of the IEEE, vol. 85, no. 9, pp. 1348–1363, 1997. [Google Scholar]
25. M. Maad, “Implementation of machine learning techniques for the classification of lung X-ray images used to detect COVID-19 in humans,” Iraqi Journal of Science, vol. 62, no. 6, pp. 2099–2109, 2021. [Google Scholar]
26. S. Saglani and A. Custovic, “Childhood asthma: Advances using machine learning and mechanistic studies,” American Journal of Respiratory and Critical Care Medicine, vol. 199, no. 4, pp. 414–422, 2019. [Google Scholar]
27. W. Jionglin, J. Roy and F. S. Walter, “Prediction modeling using EHR data: Challenges, strategies, and a comparison of machine learning approaches,” in Medical Care, Lippincott Williams & Wilkins, pp. 106–113, 2010. [Google Scholar]
28. W. N. Kairuddin and W. M. Mahmud, “Texture feature analysis for different resolution level of kidney ultrasound images,” in IOP Conference Series: Materials Science and Engineering, vol. 226, no. 1, pp. 12136, 2017. [Google Scholar]
29. D. Wang, H. Zhang, R. Liu, W. L. and D. Wang, “T-Test feature selection approach based on term frequency for text categorization,” Pattern Recognition Letters, vol. 45, pp. 1–10, 2014. [Google Scholar]
30. M. U. Rehman, A. Shafique, S. Khalid, M. Driss and S. Rubaiee, “Future forecasting of COVID-19: A supervised learning approach,” Sensors, vol. 21, no. 10, pp. 3322, 2021. [Google Scholar]
31. S. Karamizadeh, S. Abdullah, A. A. Manaf, M. Zamani and A. Hooman, “An overview of principal component analysis,” Journal of Signal and Information Processing, vol. 4, no. 3, pp. 173, 2013. [Google Scholar]
32. Y. Gao, R. Zhou and Q. Lyu, “Multiomics and machine learning in lung cancer prognosis,” Journal of Thoracic Disease, vol. 12, no. 8, pp. 4531, 2020. [Google Scholar]
33. F. Chabat, G. Z. Yang and D. M. Hansell, “Obstructive lung diseases: Texture classification for differentiation at CT,” Radiology, vol. 228, pp. 871–877, 2003. [Google Scholar]
34. J. L. Amaral, A. J. Lopes, J. Veiga, A. C. Faria and P. L. Melo, “High-accuracy detection of airway obstruction in asthma using machine learning algorithms and forced oscillation measurements,” Computer Methods and Programs in Biomedicine, vol. 144, pp. 113–125, 2017. [Google Scholar]
 | This work is licensed under a Creative Commons Attribution 4.0 International License, which permits unrestricted use, distribution, and reproduction in any medium, provided the original work is properly cited. |