DOI:10.32604/cmc.2022.025863
| Computers, Materials & Continua DOI:10.32604/cmc.2022.025863 | |
| Article |
Week Ahead Electricity Power and Price Forecasting Using Improved DenseNet-121 Method
1Electrical Engineering Department, College of Engineering, Najran University Saudi Arabia, Najran, 61441, Saudi Arabia
2Department of Computer Science, COMSATS University Islamabad, Wah Campus, 22060, Pakistan
3Faculty of Maritime Studies, King Abdulaziz University, Jeddah, 21589, Saudi Arabia
4Department of Computer Science, Federal Urdu University of Arts, Science and Technology, Islamabad, 44000, Pakistan
5School of Electrical Engineering and Computer Science, National University of Science and Technology, Islamabad, 44000, Pakistan
6Department of Computer Science and Engineering, University of Engineering and Technology, Narowal Campus, Lahore, 54000, Pakistan
7Department of Electrical Engineering, HITEC University, Taxila, 47080, Pakistan
8College of Computer Science and Information Systems, Najran University, Najran, 61441, Saudi Arabia
*Corresponding Author: Ali Raza. Email: aliraza29047@gmail.com
Received: 07 December 2021; Accepted: 09 February 2022
Abstract: In the Smart Grid (SG) residential environment, consumers change their power consumption routine according to the price and incentives announced by the utility, which causes the prices to deviate from the initial pattern. Thereby, electricity demand and price forecasting play a significant role and can help in terms of reliability and sustainability. Due to the massive amount of data, big data analytics for forecasting becomes a hot topic in the SG domain. In this paper, the changing and non-linearity of consumer consumption pattern complex data is taken as input. To minimize the computational cost and complexity of the data, the average of the feature engineering approaches includes: Recursive Feature Eliminator (RFE), Extreme Gradient Boosting (XGboost), Random Forest (RF), and are upgraded to extract the most relevant and significant features. To this end, we have proposed the DensetNet-121 network and Support Vector Machine (SVM) ensemble with Aquila Optimizer (AO) to ensure adaptability and handle the complexity of data in the classification. Further, the AO method helps to tune the parameters of DensNet (121 layers) and SVM, which achieves less training loss, computational time, minimized overfitting problems and more training/test accuracy. Performance evaluation metrics and statistical analysis validate the proposed model results are better than the benchmark schemes. Our proposed method has achieved a minimal value of the Mean Average Percentage Error (MAPE) rate i.e., 8% by DenseNet-AO and 6% by SVM-AO and the maximum accurateness rate of 92% and 95%, respectively.
Keywords: Smart grid; deep neural networks; consumer demand; big data analytics; load forecasting; price forecasting
Power markets are evolving from a centralized functional approach to a realistic one in several countries throughout the world. The power market, which perceives electrical power as a communal utility, tries to reduce power costs through competition. Power cannot be stored in large quantities, therefore a stable power system requires a constant balance of power supply and energy demand. A deregulated electricity market serves as the framework for future intelligent/smart grid installations, which aim to balance supply and demand through customer engagement. Residential areas utilize roughly 66% of the power generated, according to [1]. During the generation, transfer, and supply of power, the majority of energy is dissipated in the traditional system. The SG was founded to address the existing challenges. A regular grid can be turned into an SG by integrating two-way information sharing between the provider and the consumer.
SG is an intelligent energy system that effectively manages energy generation. Transmission is an electricity process that integrates modern technologies and allows users and utilities to interact on both ends. Energy is a requirement as well as a valued asset. Demand Side Management (DSM) is a method of planning household appliances that employ optimization techniques to lessen the cost of energy, optimize the ratio of points, and strike a healthy balance between user convenience and energy expenditures [2]. SG assists users in attaining productivity and reliability with the help of DSM. The advent of Smart Meter (SM) is very helpful as it is used to collect adequate information of consumption patterns about future generations of energy by guiding the users and the energy providers to interact in actual instances. It will ensure that energy production and consumption are both in balance. By moving demand from high consumption hours to off-peak hours and saving resources, the customer engages in SG services and saves money on energy. The abstract view of the SG domain is shown in Fig. 1 [3].
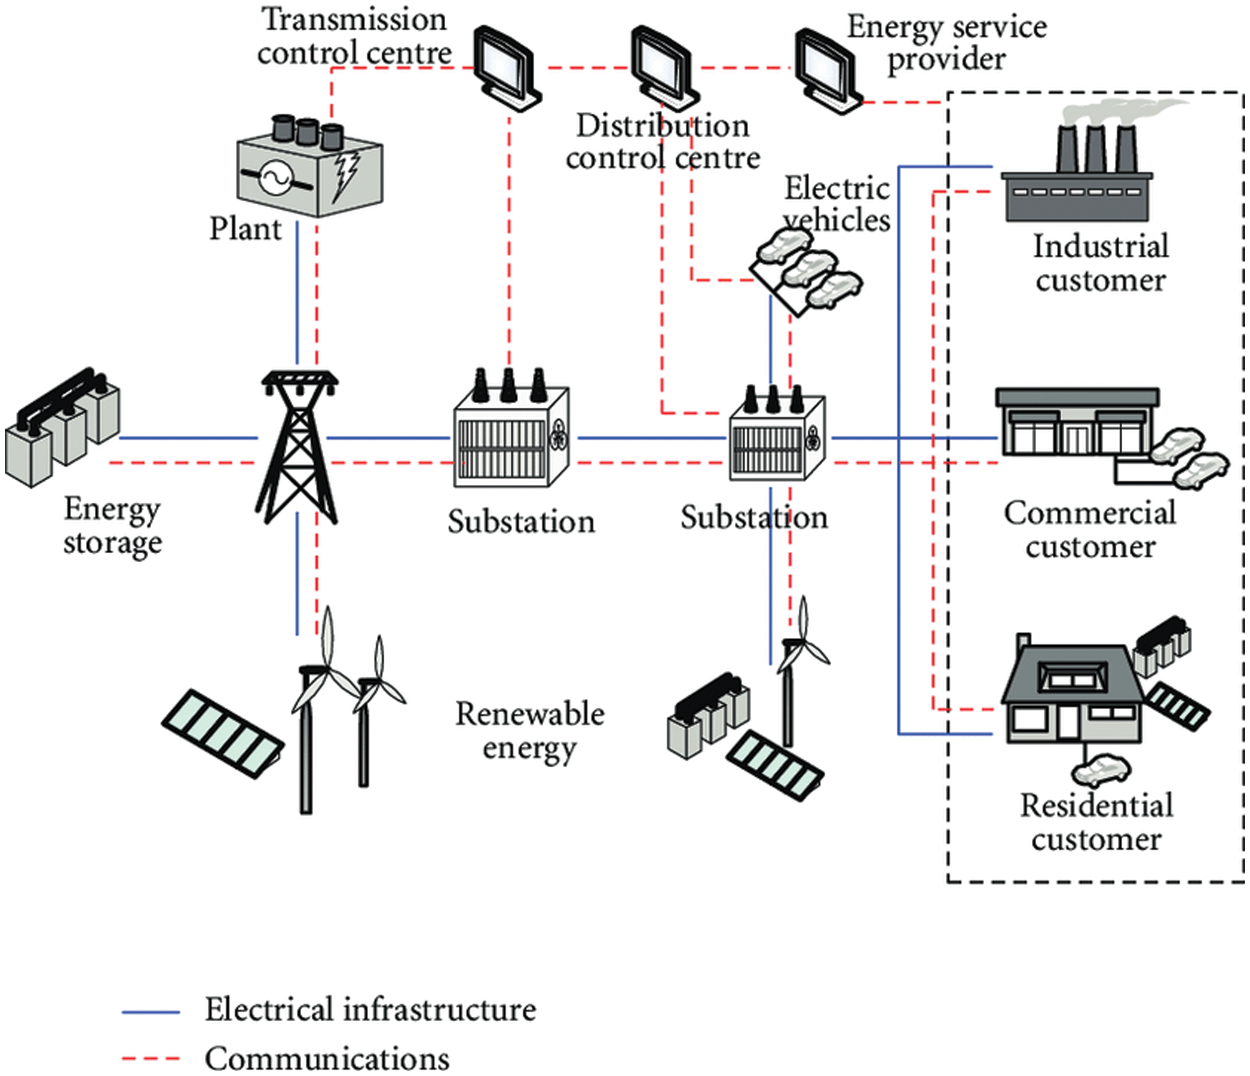
Figure 1: SG domain (abstract diagram)
Customers may track their energy use trends using DSM, which is dependent on the utility’s pricing. Market competitors gain more from load forecasting. Energy Growth, production planning, distribution management, quality control and performance analysis are all factors that must be considered in light of forthcoming load forecasts. Another issue in the power industry is the efficient production and utilization of energy. The essential aim of the energy user and the energy provider is utility maximization. The energy generators will face higher costs as a result of more accurate load forecasts, while consumers will benefit from lower electricity prices. In Singapore, there is no suitable energy-generating policy. To reduce needless generation, stability among the energy consumed and power generated is essential. As a result, for market setup management, accurate load forecasting is increasingly important. The Independent System Operator for the New England control region is a local energy distribution organization that is operated by a sovereign power system (ISO-NE). Responsible for managing the activity of the wholesale energy market. In England, ISO-NE serves the states of Massachusetts, Vermont, Rhode Island, and Connecticut. The investigation in this publication is based on a huge collection of ISO NE data. Temperature, weather conditions, and other factors all have an impact on electrical load, thus pricing isn’t the only factor. There is a substantial amount of accurate data [4]. In the end-user, a good decision process minimizes power loss, lowers energy expenditures and lowers Peak Average Ratio (PAR) [5].
In light of the above concerns, researchers are focusing their efforts on the power scheduling problem. The energy problem was solved using certain optimization methods [6].
This paper’s key contribution is:
• The number of features is reduced to minimize the computational time and complexity of training by selecting the most relevant features with the proposed feature selection ensembler.
• Processing large amounts of data using traditional methods is difficult. We proposed two modified versions (ensembler) of the classifiers, SVM and DenseNet121 with the AO method to forecast the electric load and price.
• With the proposed feature engineering methods and ensembler classifier, our proposed model training accuracy is increased by 7%, minimizing the model loss by 9%. In required available resources, our proposed ensembler scheme outperforms in electricity load and price prediction with accuracy by 8%, minimizing the computational time by 8%.
• We applied performance metrics including MAPE, accuracy, Mean Average Error (MAE), recall, prediction, f-score and statistical analysis tools (pearson test, ANOVA test, studentas test, chi-square test, etc.) to assess the working of our suggested schemes (SVM-AO and DenseNet121-AO) and existing mechanisms (Linear Regression (LR), Linear Discriminant Analysis (LDA), RF). Our suggested schemes have the lowest performance error value and low computational complexity than benchmark schemes.
1.2 Motivation and Problem Statement
Each machine learning approach has advantages and limitations. The key concerns in anticipating the power load are improved performance and accuracy. A high number of data makes accurate prediction more difficult. As a result, a variety of systems have been designed and implemented to address these issues within the time restrictions; nonetheless, certain concerns remain, such as adjusting energy production and utilization to monitor inconsistencies in power consumption and production patterns [7]. On the electricity load and price forecasting side, the methods are showing a good accuracy on some range of data, however, these methods overfit if data is increased and the results start varying [8]. Furthermore, the existence of redundant attributes has very little influence on the objective and increases the algorithm’s time complexity [9].
A Deep Learning (DL) and Statistical Learning-based solution are being developed to overcome these difficulties. Furthermore, to achieve maximum accuracy, the classifier’s variables are fine-tuned utilizing an optimization method. In the Feature Engineering process, RF and XGBoost are used to reduce duplication and sanitize the data. Finally, the AO technique is utilized to determine the best DenseNet121 hyperparameter settings. The DenseNet121 neural net has the benefit of being able to deal with large amounts of data.
The future generation of electricity networks is referred to as “SGs.” A power system that improves energy generation and management by utilizing the continuous two-way connection. Capability in pervasive computing and interactions for improved control dependability, durability, and security. An intelligent grid transports electricity from producers to users. Two-way digital communication technologies It monitors smart appliances. Buyers’ houses or buildings save energy and money even while improving reliability, performance and responsibility [10]. An SG is required to upgrade the older power system. It automatically regulates, maintains, and optimizes the operation of the connected components. It includes everything from classic main utilities to emerging regeneration scattered generators, as well as the power transmission networks and technologies that link them to industrial customers or home users with smart appliances, battery technology, and heating systems [11].
An SG provides an integrated, globally distributed transmission network by connecting energy and data flows in both directions. It leverages the benefits of digital technologies with existing power infrastructure to deliver near-instantaneous supply-side control and real information [12]. Many SG systems are presently in use in other industries, such as industrial sensor networks and telecommunications wireless networks. They’re being developed specifically for use in this cutting-edge, smart, and interconnected system. The five key domains in which SG networking systems may be characterized are advanced materials, enhanced interfaces, sensing and measurement, protocols, decision supports, integrated communications, and classes. Data centers employ diverse area networks, such as home (HANs), community (NANs), business (BANs), and industrial automation converging approaches, as a wide base for SG networking architectures [13].
SGs are devices that transfer electrical energy between generators (including traditional and distributed energy generating sources) and end-users, decreasing costs and conserving energy while enhancing system performance and reliability. On the user end, they leverage a two-way flow of information to manage intelligent systems. Smart metering strategies can combine actual energy consumption as a review and relate to demand from utilities with the help of a network design. Network service centers can provide customer electrical load data and online market rates to optimize the supply of electricity and distribution based on energy consumption. The wide adoption of modern SG elements, as well as the incorporation of current communication and knowledge technologies used in the traditional electricity network in a dynamic SG architecture, would benefit both customers and suppliers [14]. Integrating digital networking technologies into SGs will improve the reliability of traditional generating electricity and distribution while also encouraging the use of sustainable power. An SG’s basis is the ability of many organizations (e.g., control center, dedicated software, intelligent instruments, systems, etc.) to communicate with a network infrastructure. As a consequence, the development of SG network technologies depends on the establishment of a robust and broad network infrastructure [15].
The term “big data” refers to a significant amount of data concerning electrical load. Large data is a term used to indicate a large volume of highly complicated data. The discovery of previously undiscovered trends, market dynamics and other important information is aided by a huge volume of data collection. There are several load forecasting techniques presented in the literature. It’s difficult to deal with training data since it’s so large and intricate. A DNN’s processing capabilities allow it to handle huge data training [16]. DNN can properly anticipate and analyze enormous volumes of data. The literature covers a wide range of estimate techniques. Forecasting is done using RF, naive bays and ARIMA, among other classifier-based approaches. A variety of approaches are used to forecast the load or pricing. Due to various appropriate feature selection and retraining procedures, neural networks outperform alternative strategies. Shallow Neural Network (SNN) has poor results and an overfitting problem, according to the authors [17]. DNN outperforms SNN in terms of pricing and load predictions. For prediction, the author used the Rectified Linear Unit (ReLU) activation function in conjunction with the generative stochastic mechanism, i.e., Restricted Boltzmann Machine (RBM). RBM is in charge of data processing and training, whereas ReLU is in charge of load forecasting. RBM is in charge of data processing and training, whereas ReLU is in charge of load forecasting. In [18], KPCA is used to extract features and DE-based SVM is used to anticipate prices. The author implemented Deep Auto Encoders (DAE) to predict the cooling load [19]. In terms of information acquisition and reliability, DAE outperforms. DAE is an approach for machine learning that beats other schemes in terms of efficiency.
The pricing is projected and unusual load activity is detected in [20] utilizing the Gated Recurrent Units (GRU) approach. The GRU approach forecasts the price using DAE that outperforms other approaches in terms of precision. With the extensive amount of data, SG will help forecast load and complex trends. Furthermore, It also assists utilities in developing the market, transmission, and assessment operating procedures necessary for demand-supply stability. DNN models have greater predictability. The use of SG’s big data would aid in the assessment of load and cost trends. It assists utilities in producing a creation, supply, and control process, all of which are required to maintain production balance. One of the classifier’s uses is feature engineering. The authors used Hybrid Structured DNN to forecast prices in [21], although the execution time and probability of dropout of neurons are very high in this model.
In [22], the author proposed a cost forecasting strategy based on DL techniques that included DNN as an expansion of the combination LSTM-DNN framework, the hybrid GRU Convolutional Neural Network (CNN) methodology, the DNN framework, and the traditional MLP. Following that, the proposed structure is compared to 27 alternative plans. To increase prediction consistency, the recommended DL framework was discovered. To compare the proposed model to all existing approaches, a single dataset is employed. A single dataset is insufficient for all real-time investigations. Kernel Principal Component Analysis (KPCA), SVM, and Grey Component Analysis (GCA) were combined to build a dual process for feature selection, filtration, and measurement reduction. However, because the authors employed a large dataset that includes pricing for oil, wind, steam, gas, and wood, the computational overhead of the model has grown. Furthermore, it is difficult to collect all of these expenditures in a single instantaneous database; Pricing for certain resources cannot be provided ahead of time. The developers of [23] made use of DNN templates as well as the Stacked DE noising Autoencoder (SDA). SVM, traditional neural networks, and multivariate regression DNN were among the models compared by the authors. In addition, the authors used Bayesian optimization of variance and functional analysis to choose features. The prototype was proposed by the designers for estimating the prices of two marketplaces at the same time. Furthermore, aspect removal approaches can be used to enhance prediction. They limit the possibility of over-fitting. The authors contrasted a model that had previously only been offered for price prediction, which was inadequate. This article, on the other hand, forecasts both price and load.
This article proposes two models i.e., predicting the energy load as well as electricity price. Both models apply the same strategies, as these models are related. One model is used to predict the demand of the electric load and market electricity price.
The main aim of the current work is to enhance market energy price and price predictions. The suggested methodology is described in Fig. 2.
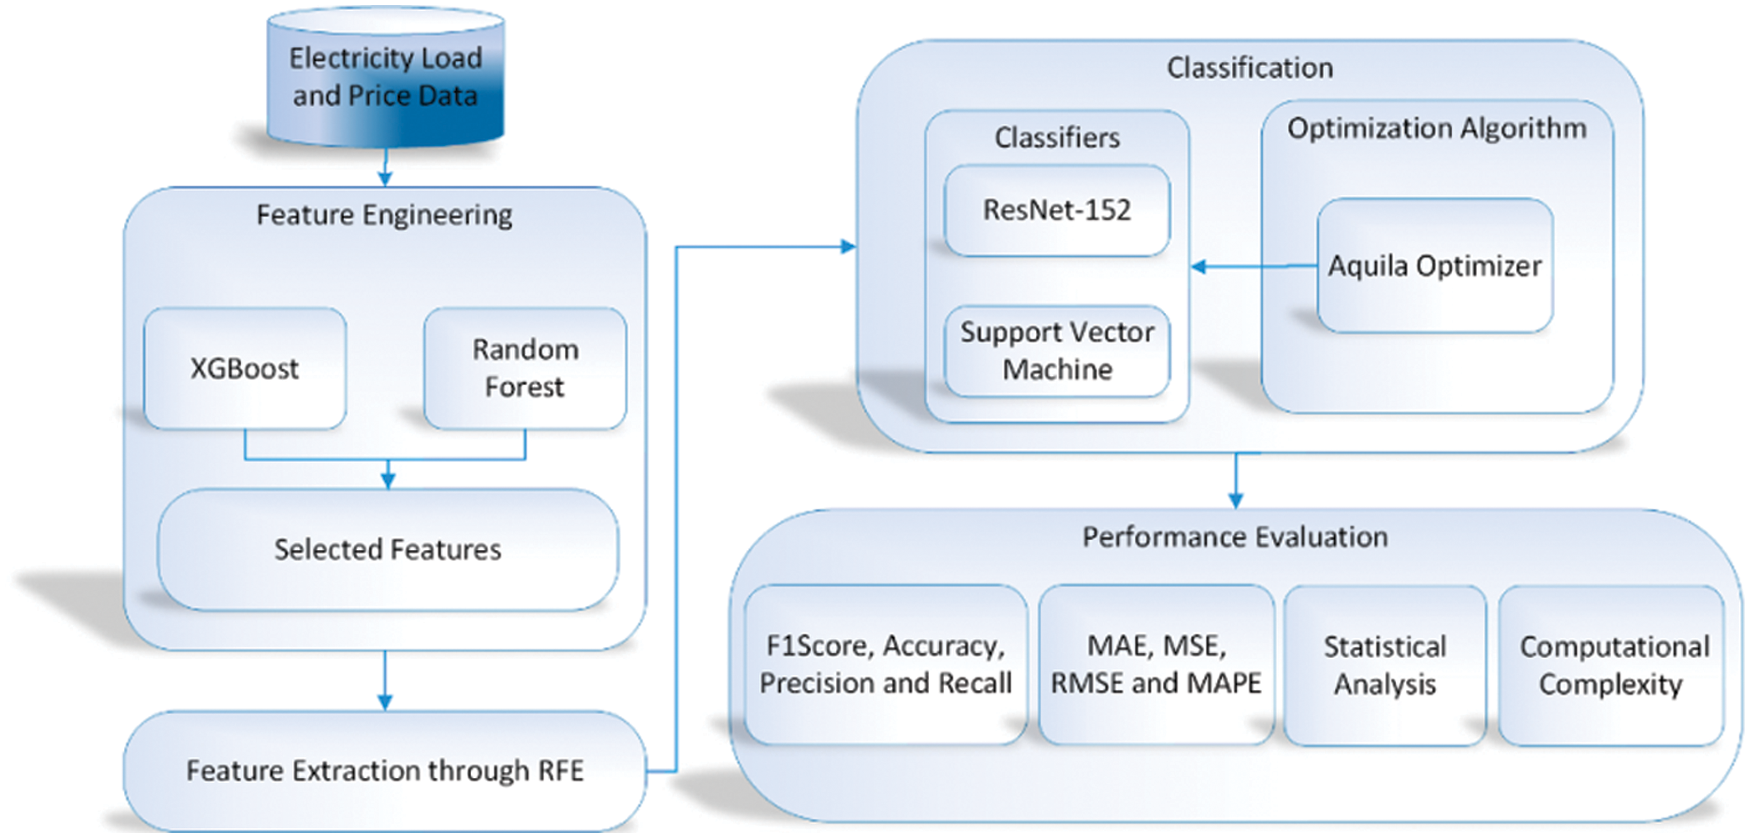
Figure 2: Proposed electricity prediction model
We present an improved technique to predict load calculated based on average of attributes, feature extraction, and prediction/forecasting after analyzing the literature study and the aforementioned methodologies. The feature extraction is done with RFE, while the feature processing is done with XGB and RF. The average feature selection values for XGB and RF are very close. The mean value of XGB and RF is employed to pick features, as shown in Eq. (1) for average feature selection. Classification is also performed using the DenseNet121 and SVM methods. In addition, the DenseNet121 and SVM parameter values are obtained using the AO meta-heuristic approach. Fig. 3a depicts the model’s working flowchart.
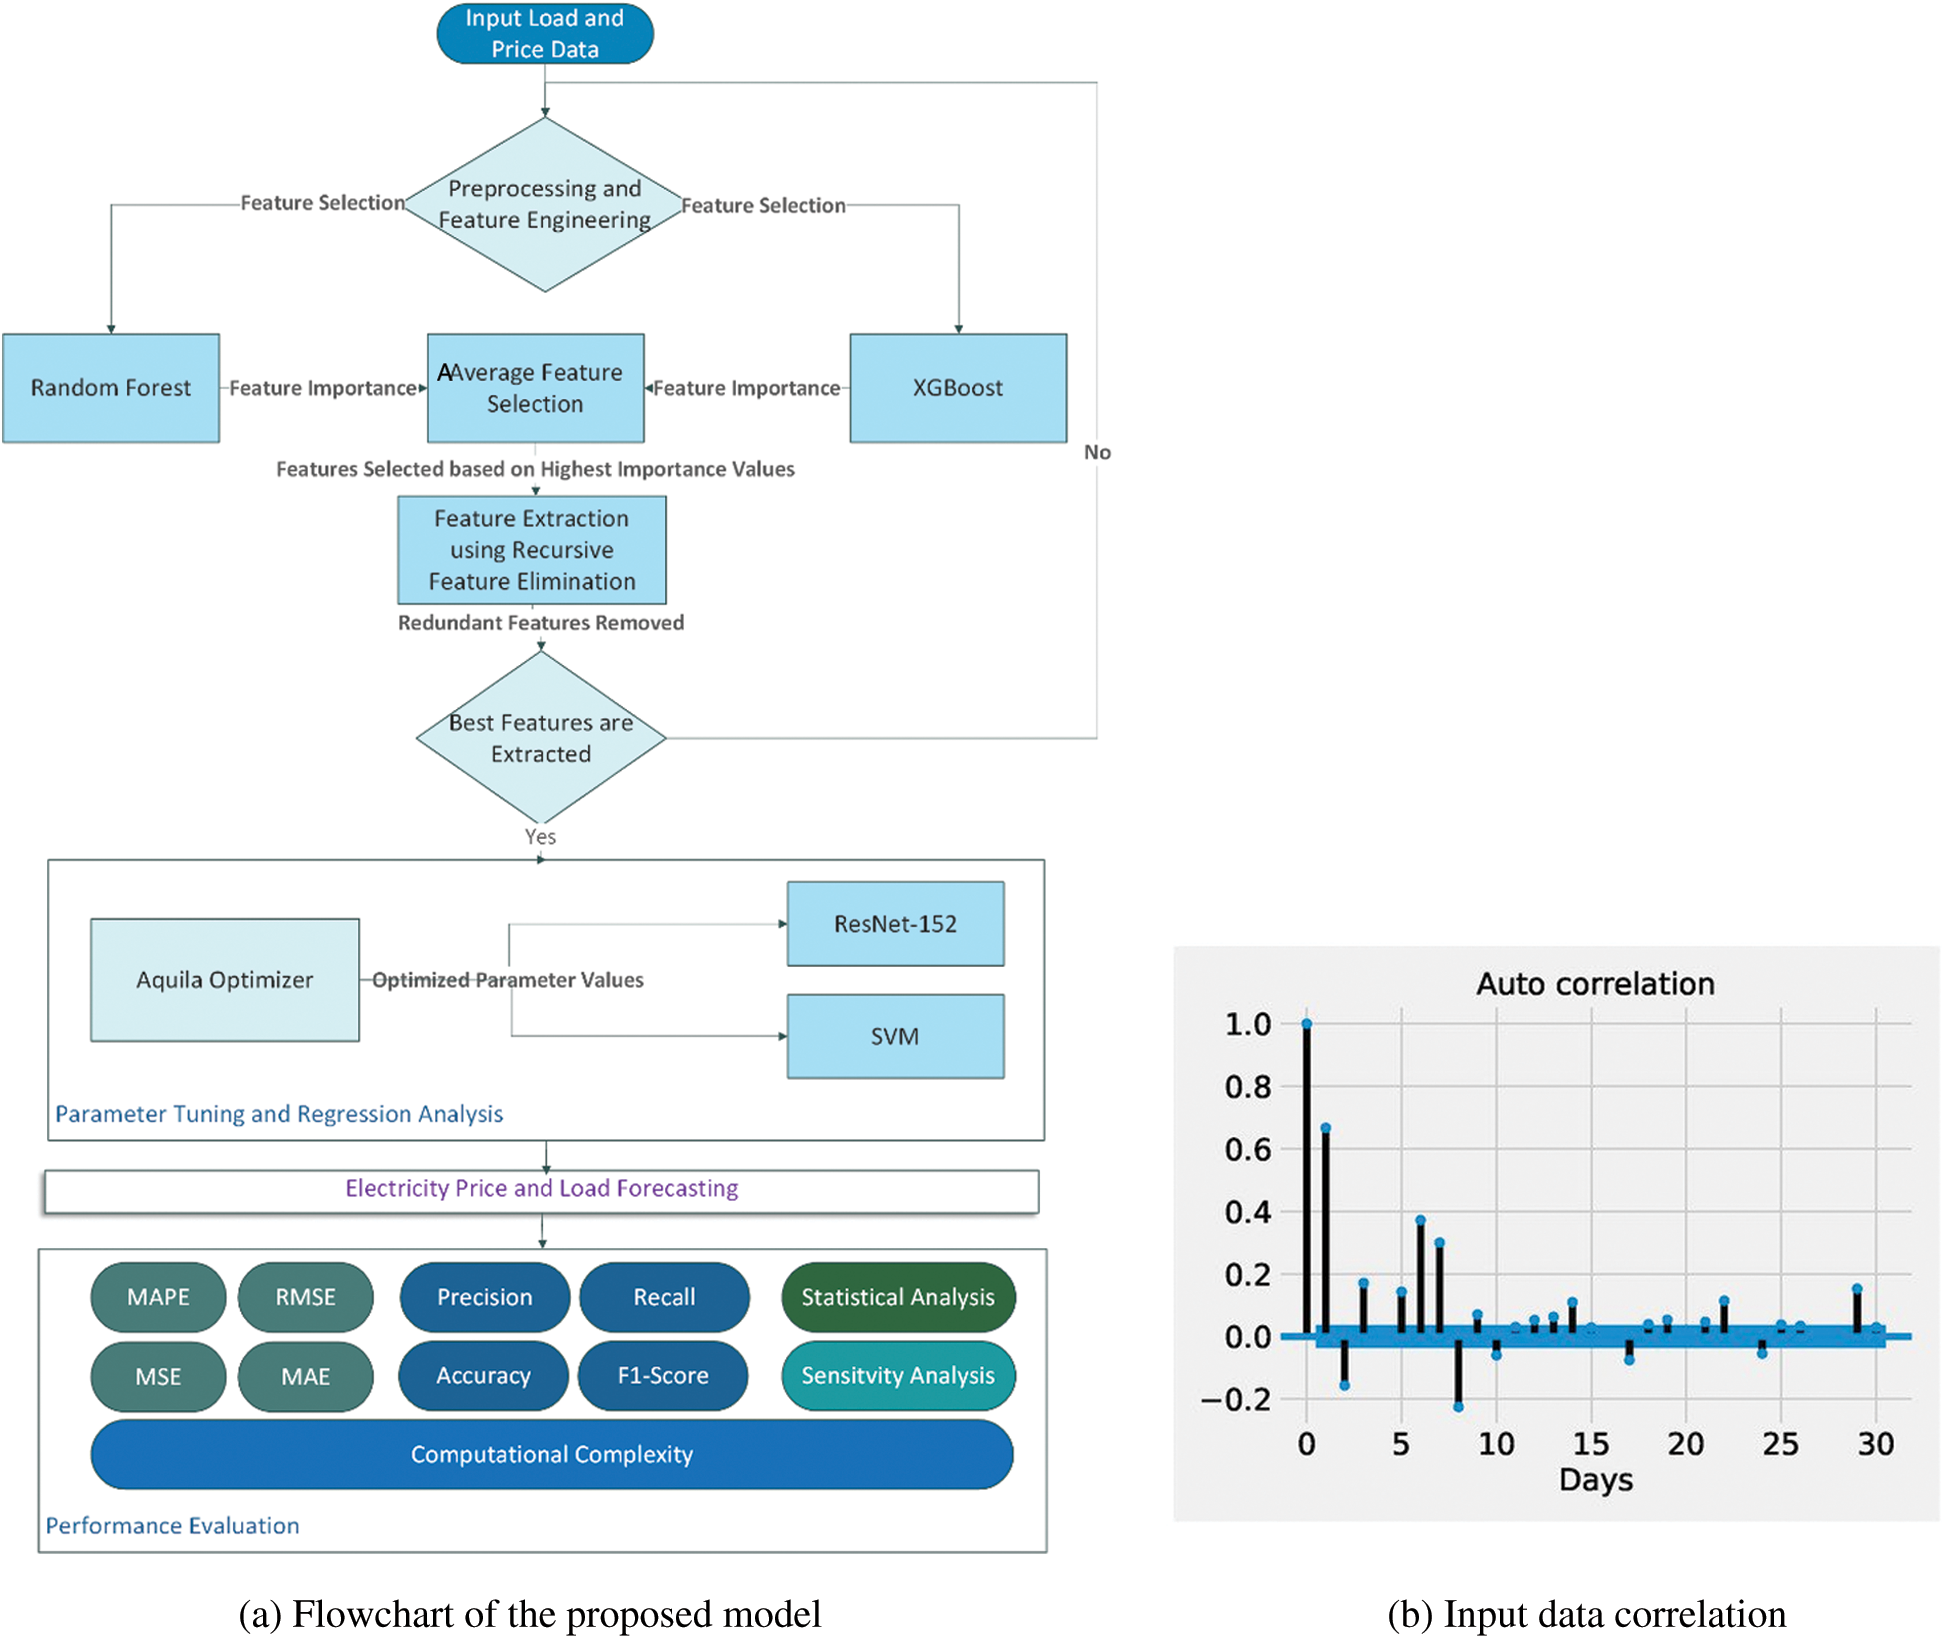
Figure 3: Proposed workflow and input data distribution/relation
In this article, the history of energy load and price information from several different new England cities is utilized. ISONE, which is utilized in this article [5], maintains the power load information. The vertical data, or columns, are referred to as “features.” Data is structured on a monthly basis and conducting training activities on the dataset on a monthly basis offers the benefit of boosting performance and learning rate. Trustworthy consumers have different patterns of use than power thieves, according to data on energy usage. There are 14 distinct characteristics in the dataset collection. The feature labeled “System Load” is considered as a target or label attribute. 70% of the data in the dataset was used to train our proposed model and 30% was used to test it. Figs. 3b and 4 provide a high-level overview and correlation of the dataset.
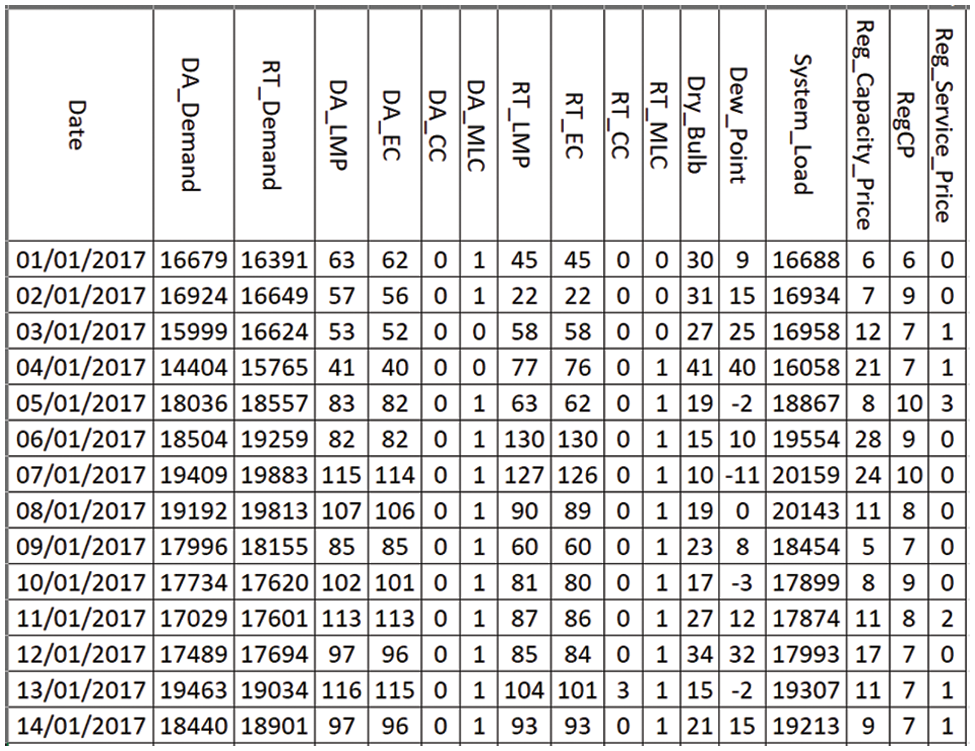
Figure 4: Dataset description
Feature engineering consists of selection features and extraction of features. With the use of machine learning to select important features, RF and XGB are utilized [8]. The impact of features on the target is computed with these methods. The range of 0 and 1 is used for feature importance calculation. As indicated in Eq. (1), the average of feature importance is used to improve feature selection.
The letters Fi and Fs stand for feature importance and feature selection, respectively.
Extraction of features is a technique for removing certain dataset features to minimize the time complexity. A subset of the collected data is chosen in this manner to provide more detailed information than the original data (new data is generated from the old data). In the literature, several methods for extracting characteristics from data have been proposed. The proposed model uses RFE and RF to remove the most redundant features during the training phase of classification to reduce the complexity. The RFE technique determines the priority and dimension of features using positive integers and true/false. To remove unnecessary features, the drop-out rate has been computed. If the average feature weight/importance exceeds the defined threshold and the priority exceeds the defined priority barrier, features are reserved/selected, according to Eq. (2). Features with a lower weight are discarded, while those with a higher weight are chosen. Using the average algorithm, the degree of features extraction is 0.63. Additionally, attributes having a priority value of more than 5 are considered when making a selection. Eq. (2) is utilized to aid in the selection of overall features.
where avgimp shows the average importance of a feature, f is the feature and pr is the priority of feature. α and β are the threshold for the selection of features. It represents the overall feature selection, whereas f represents the particular feature. The terms avg imp and pr stand for average feature importance and feature priority, respectively. The levels of feature significance and priority are indicated by the selection and extraction methods. The classifier obtains the most relevant features for predictions/forecasting after feature identification and categorization.
DenseNet is a network design that concentrates on deepening deep learning algorithms while also order to be more productive to training by employing shorter associations among layers. Each layer receives updated inputs among all future levels and passes upon the feature space to all subsequent layers to maintain the feed-forward nature. A CNN classifier is created by extracting features from the data and applying them to the labels to categorize categories from a dataset. Torchvision and PyTorch (two DL libraries) will also be required to complete this task. In contrast to other data learning models, Torchvision is a pre-trained data modeling technique that provides the highest level of control against overfitting while also boosting the optimization of results from the start.
Using the DenseNet block architecture and a growth rate of L = 5, a five-layer dense block is defined as the result of the network’s computation as a consequence of the network’s calculation. The number 121 in DenseNet-121 denotes that the neural network has 121 layers, which is a crucial feature. A typical DenseNet-121 composition consists of multiple different layers that are combined. In total, five convolution and pooling layers are used, as well as three transition layers (48, 24, 12, and 6), two DenseBlocks convolutions (1, 33), and one classification layer. There are additionally three transition layers used (6, 12, 24 and 48). According to the authors, DenseNet encourages the reuse of features, minimizes the set of variables, and improves the model’s multi-label classification and classification accuracy. Among the layers in the composite process are a non-linear activation layer, pooling layer, convolution layer and batch normalizing layer.
Fig. 5 depicts the function of a DenseNet process, which is made up of transition layers and dense blocks and is used to categorize an input review depending on its content. When a text is fed into the DenseNet, it is processed via several dense blocks, with the feature maps of each layer remaining consistent from layer to layer except the number of filters, which varies from layer to layer inside a single dense block. After going through a huge block of ice, it continues to the transition layer. Convolution and pooling are the two processes handled by the transition layer. The transition layer, which is located outside of the dense layer, performs the downsampling procedures.
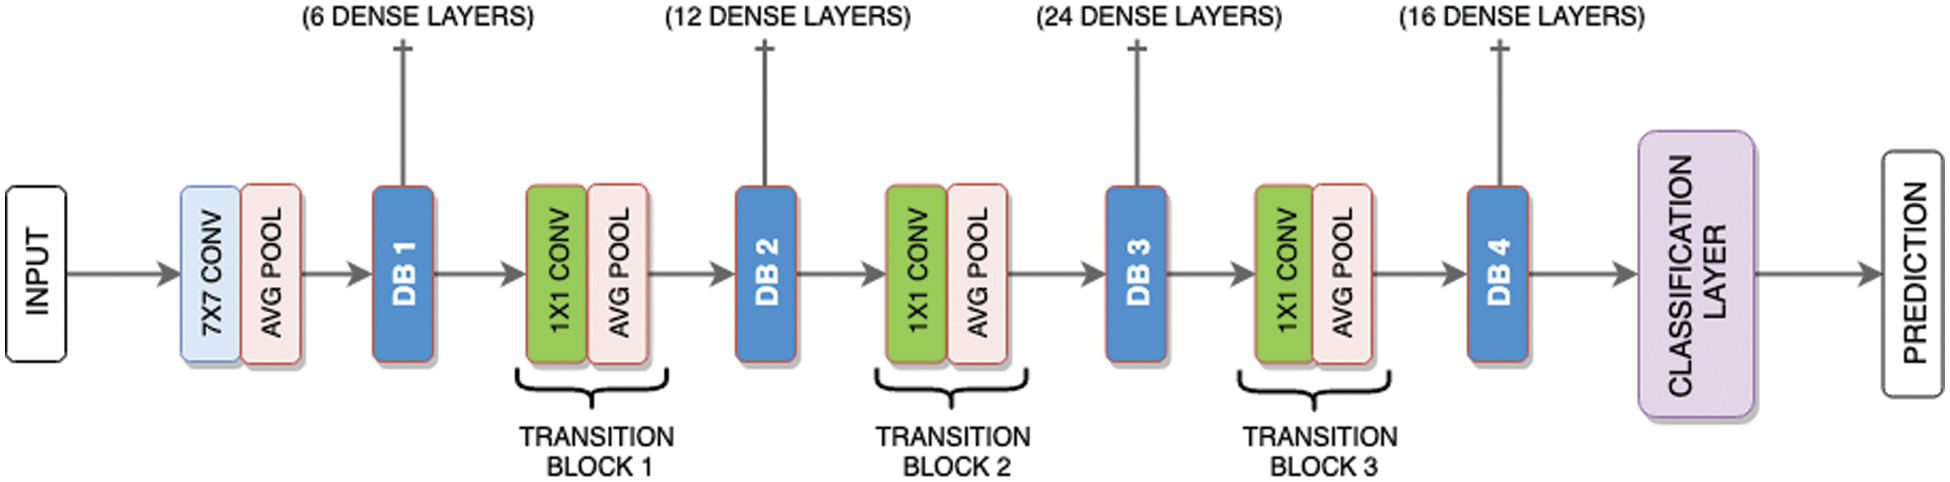
Figure 5: DenseNet model layers connection and flow
A machine learning approach i.e., SVM is used for the regression problems as well as classification of data. SVM’s main purpose is to discover the n-dimensional hyperplane [10], where the number of features is denoted by “n”. SVM draws a hyperplane among the data which better classifies the data. Support Vector Classification (SVC) for classification and Support Vector Regression (SVR) for regression are mainly two characteristics of SVM. This study proposes a better SVR by dynamically optimizing parameters with AO. A collection of parameters inside the range of SVM parameters is referred to as a subset. The main parameters of SVR are kernel, Cost function (C), gamma and epsilon. The fitness of this combination is calculated after each variation is introduced to the classifier and the k number of cross-validation approach which is utilized to verify the classifier’s prediction is accurate.
The next step is to optimize the classifier after assessing its consistency and complexity. It’s a multi-objective optimization issue, similar to single-objective optimization in standard learning algorithms. It may be resolved by utilizing the weight-sum technique to convert multi-objective optimization to single-objective optimization. Furthermore, because the ensemble’s potential to generalize is primarily defined by the trade-off between two objectives, such a technique is prone to weight shifting. To regulate the trade-off between model accuracy and diversity, we employed the AO, a swarm multi-objective optimization technique. Through the swarm population, AO will investigate optimum trade-offs. This technique tackles the multi-objective reduction issue without losing generality.
The following models are assessed based on performance metrics: MSE, MAPE, MAE and RMSE. The MSE, MAE, RMSE and MAPE formulae are provided by Eqs. (3)–(6). The MAPE is computed using the following formula [18]:
The RMSE is calculated using the formula [21]:
The average error calculation using MAE as well as the MSE are [23]:
The sensitivity analysis method, which is a simple and powerful approach to analyzing a learning model, is also used to investigate the effects of each feature on the model’s prediction. To compute feature sensitivity, we modify the feature value or try to neglect it in some way while keeping the other features constant and observing the model’s output. If altering the feature value dramatically changes the model’s output, it indicates that this feature has a significant influence on prediction.
5 Simulation Environment and Results
The environment setup for simulation and implementation impacts of our suggested approach in light of error and computational performance indicators are discussed in this section. Our suggested model is implemented on a machine with a Core i7 9th Gen processor, RAM with 8GB capacity along a dual 4.8 GHz processor chip. The IDE of Anaconda (Spyder) and programming language Python are utilized.
5.1 Prediction of Energy Load/Demand
The relevant appropriate features are selected according to the feature importance determined by XGBoost and RF as shown in Figs. 6a and 6b. The feature relevance of a variable reveals how much it affects the desired feature, in this case, the power load. The high significance value of the feature suggests that it has a considerable impact on the function being studied. The feature’s high impact reveals how important it is to the target/label. A minor change in these most appropriate attributes can have an effective impact on the objective. Low-impact characteristics are defined as features with a low relevance value. If these characteristics are removed, they have little or no effect on the target. Getting rid of unnecessary features improves computation cost and decreases computational complexity. The feature score/importance computed by the XGBoost method is shown in Fig. 6a. The importance of features determined by RF is shown in Fig. 6b. Fig. 7a depicts daily standard load power from January 2017 to December 2020. We can see that the normal load has a unique pattern in terms of time. The historical consumption behavior of customers is also shown in Fig. 7a.
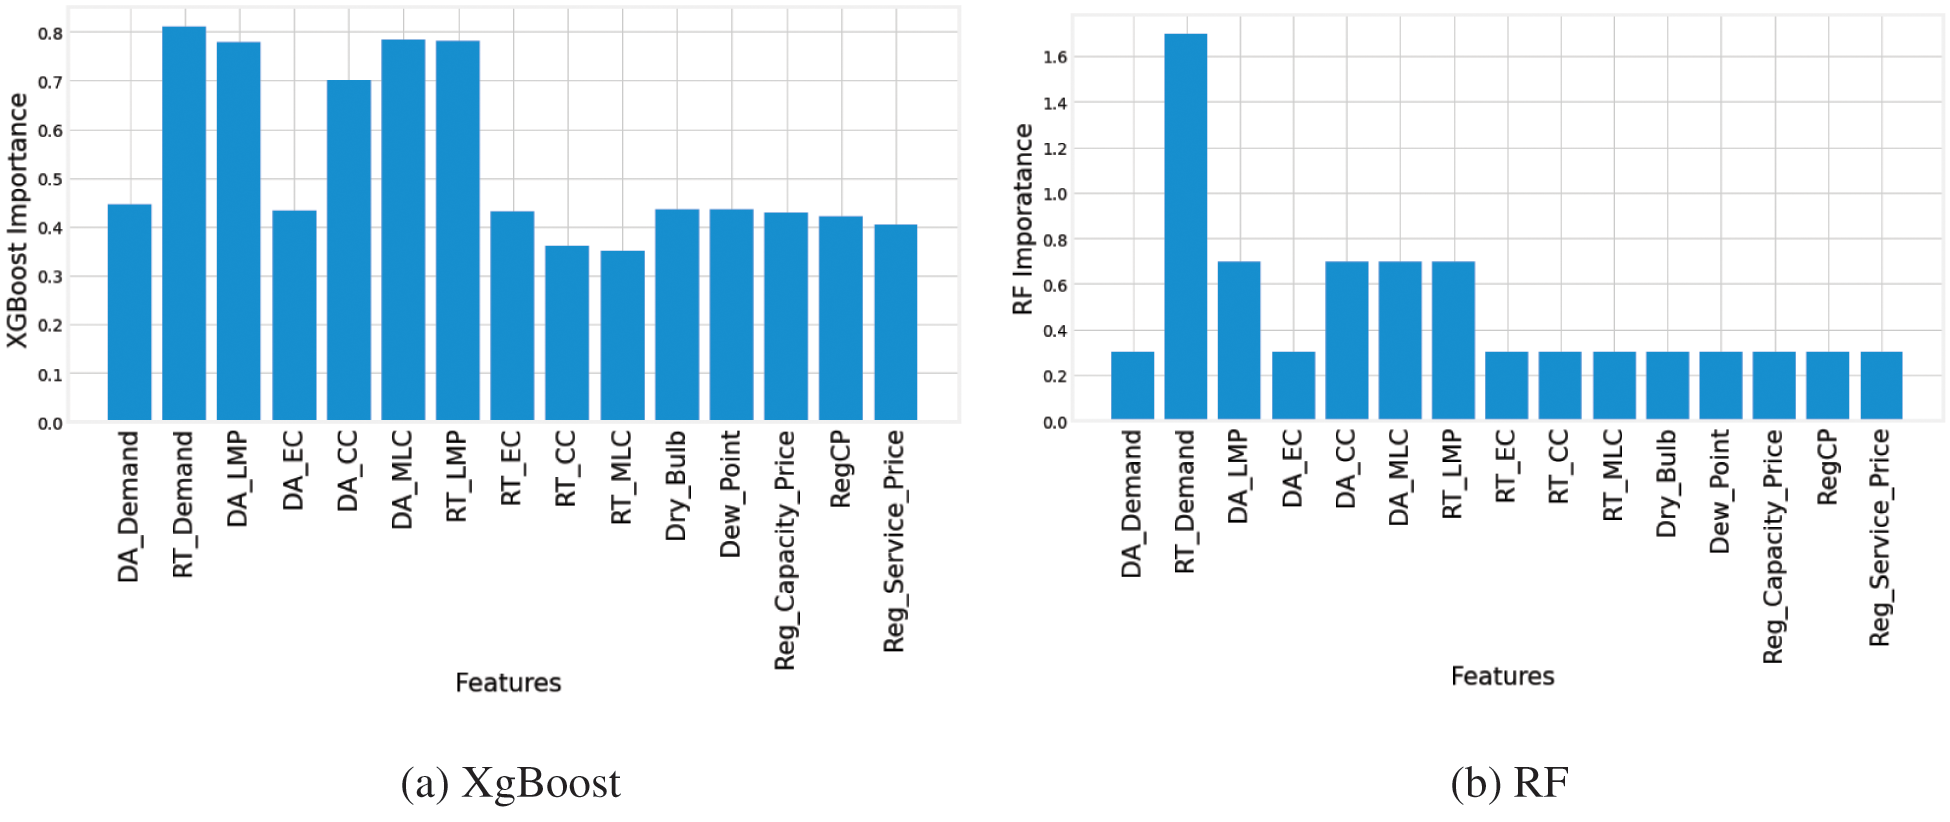
Figure 6: Computed feature importance
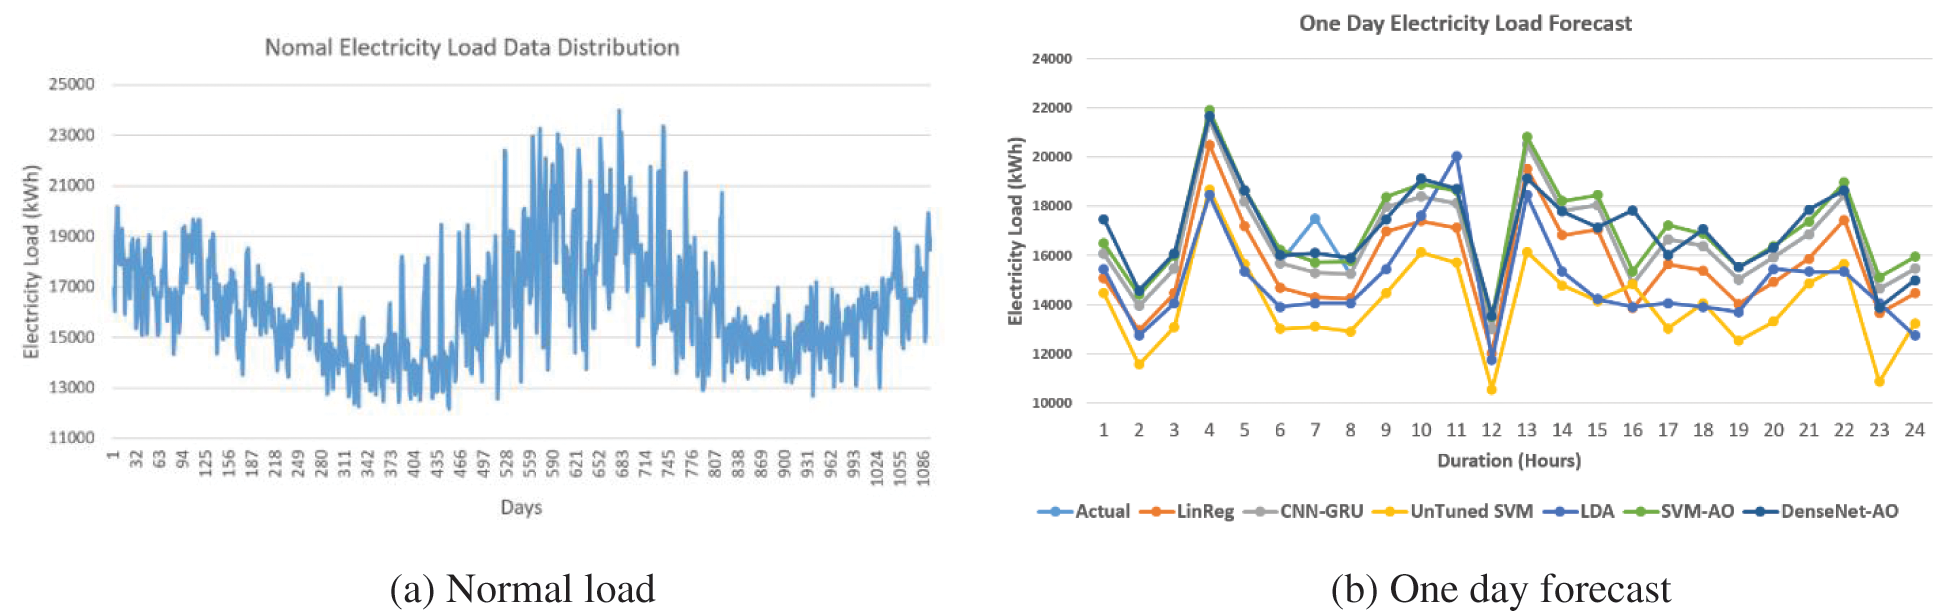
Figure 7: Normal electricity of ISO-NE 2017–2020 and forecasted load
We anticipate the electrical load for one day using the updated DL algorithm DenseNet and the machine learning algorithm SVM, as illustrated in Fig. 7b. Furthermore, as shown in Figs. 8a and 8b, we forecasted the impending power load for the following three days and one week using the same methods with high accuracy of 96 percent.
In Figs. 7a to 8b, we can observe that our suggested method beats the other standard algorithms in terms of forecasting. DenseNet-AO, the proposed algorithm, outperforms than proposed algorithm SVM-AO. The accuracy and loss curves of our suggested model are shown in Figs. 9a and 9b. The training and testing accuracy curves in Fig. 9a are growing, whereas the model loss value in Fig. 9b is dropping.
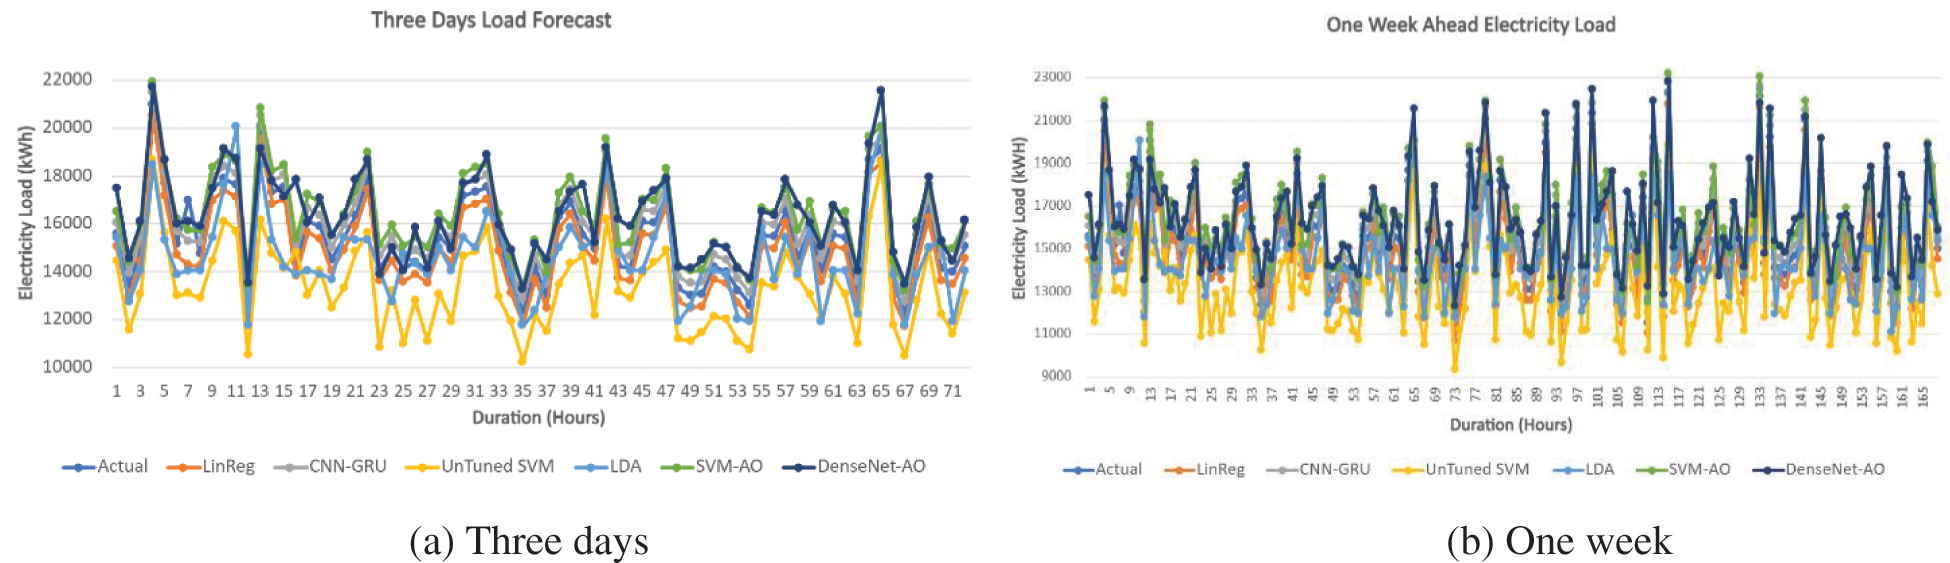
Figure 8: Electricity demand forecast
The superiority of the suggested model is demonstrated with the rise in accuracy parameter and the decrease in the loss marker-line, indicating that our proposed model works better in obtaining accuracy.
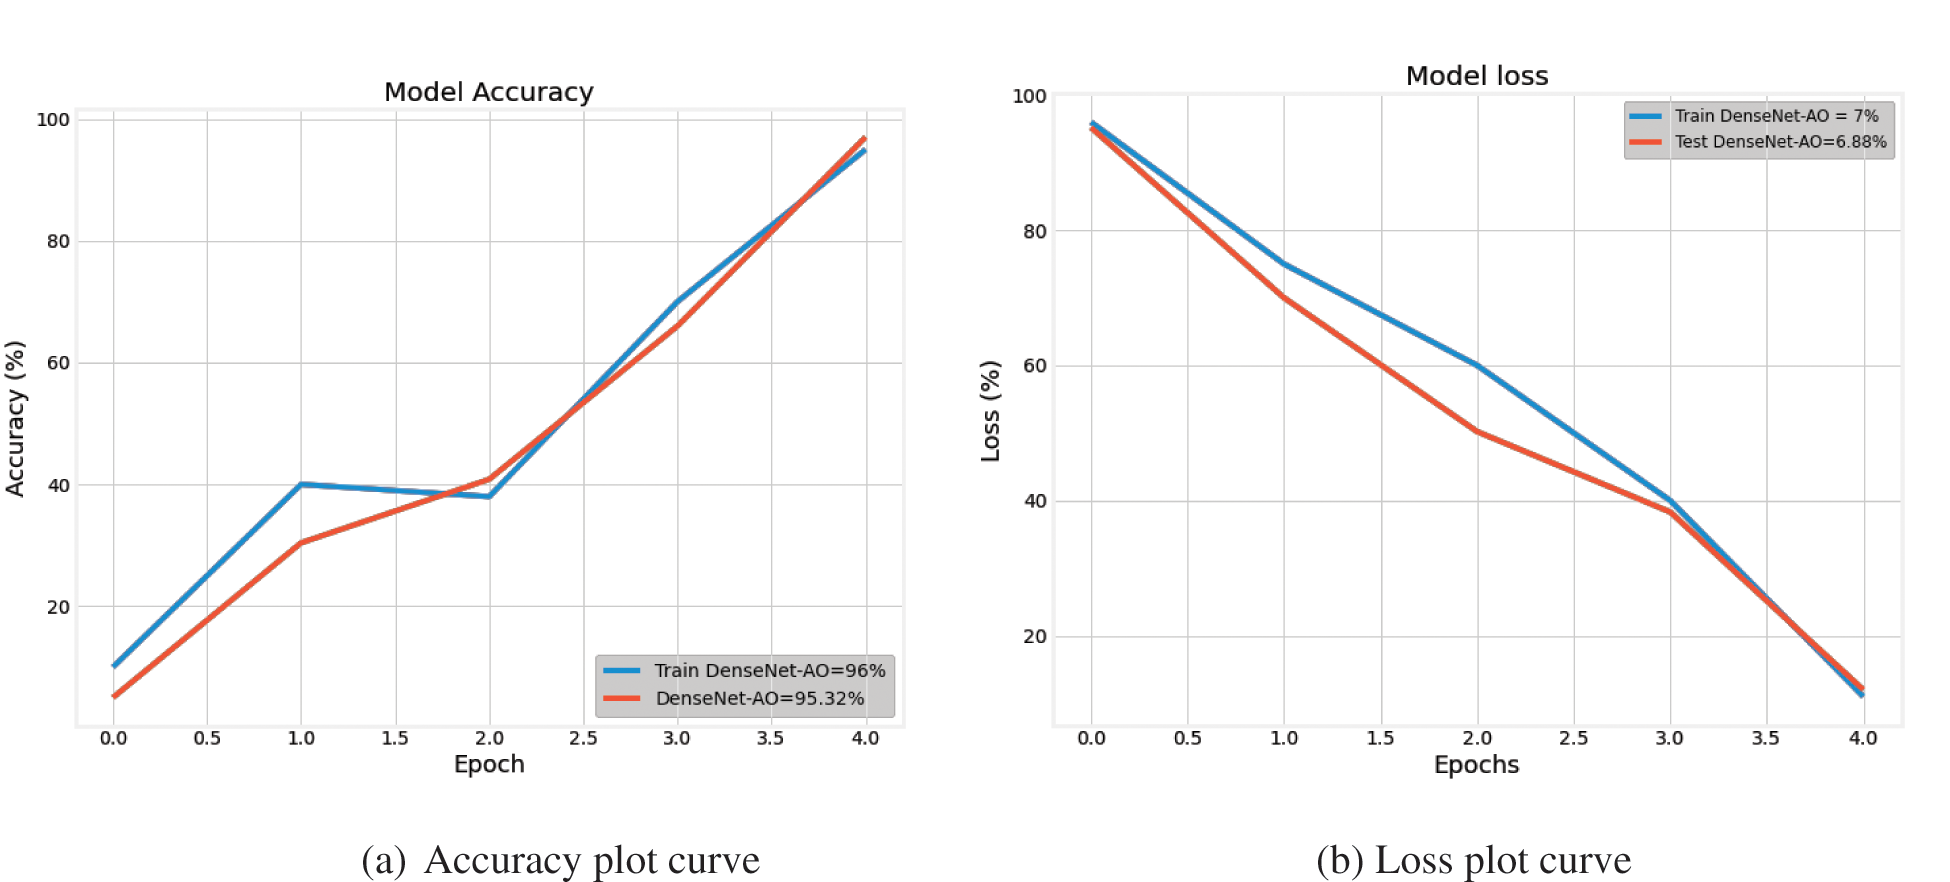
Figure 9: Accuracy curve and loss curve electricity load forecasting model
5.2 Electricity Price Forecasting
Fig. 10a depicts the average electricity price from January 2012 to December 2020. The price of power fluctuates throughout time. Figs. 10b, 11a and 11b depict one-week, three-day, two-day, and 24-hour electricity price projections. The suggested method performs effectively in terms of estimating electricity, as shown in Fig. 10b. We can see that the proposed algorithm’s curve is quite close to the actual electricity price when compared to the actual electricity price. Our proposed approach beats comparable algorithms in anticipating short-term electricity prices.
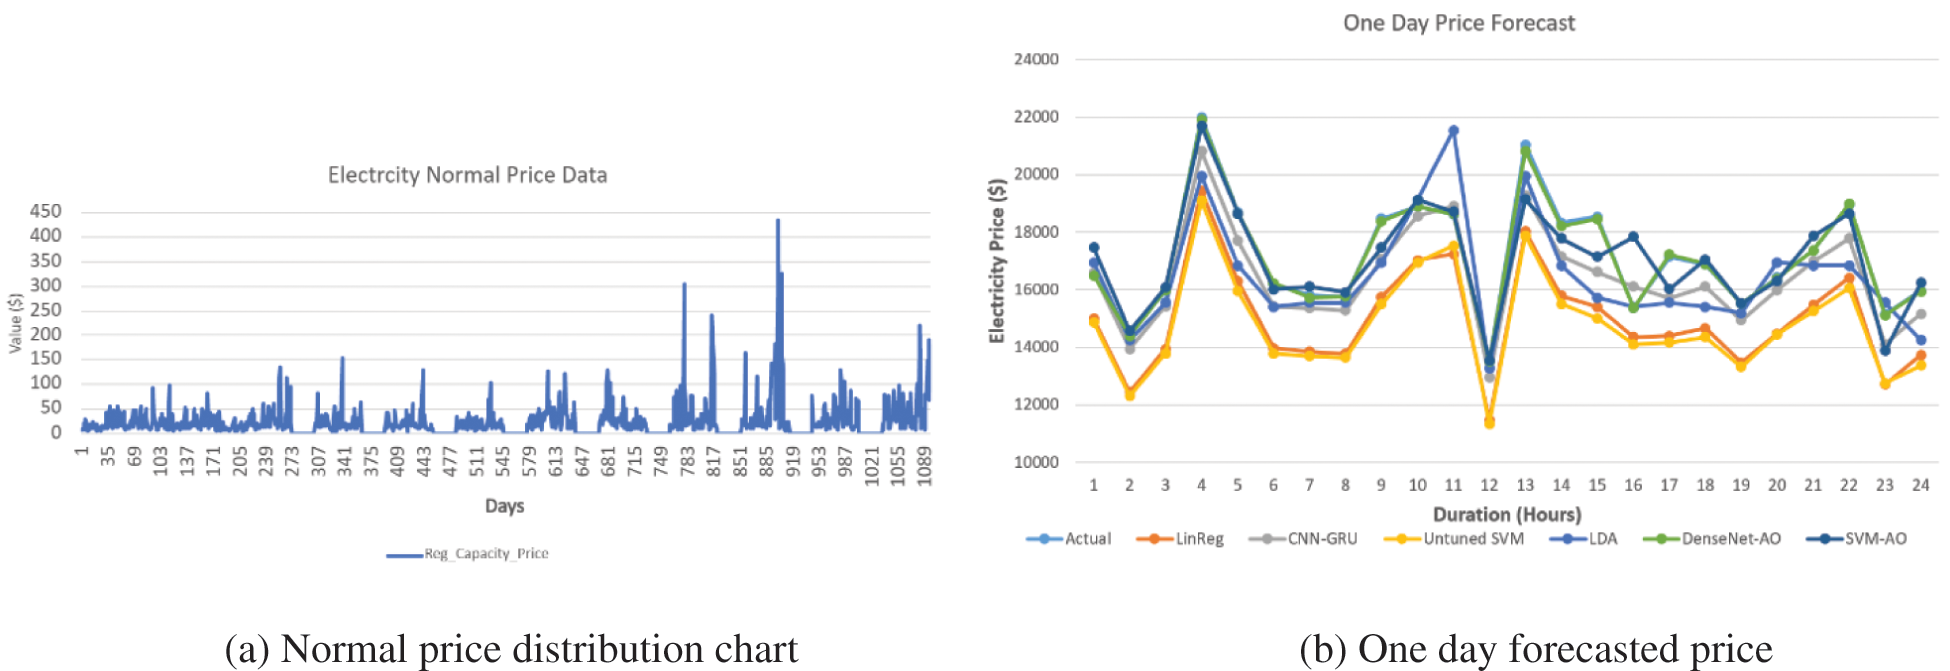
Figure 10: Electricity price of ISO-NE 2012–2020 and forecasted price
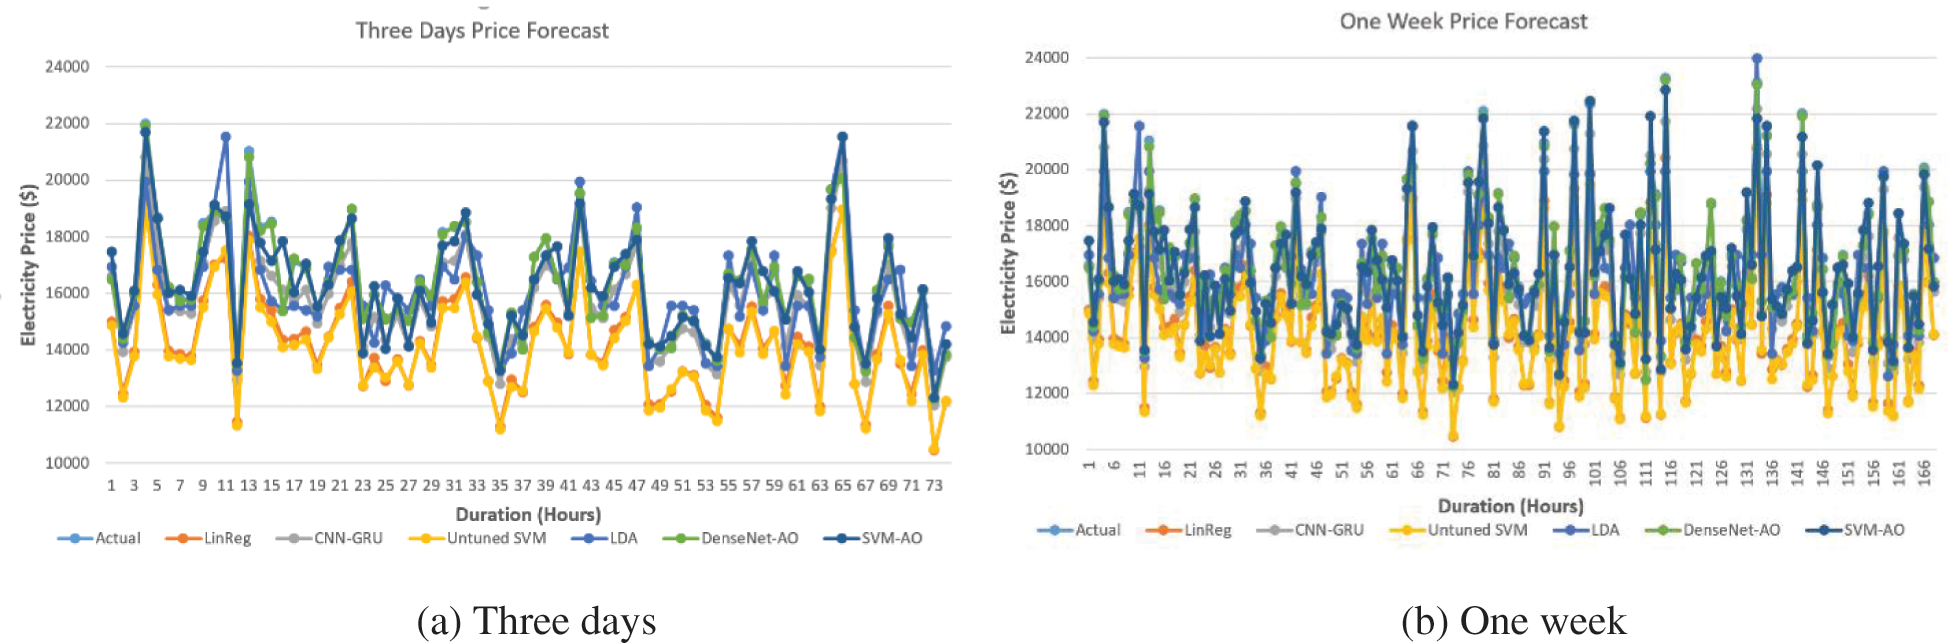
Figure 11: Forecasted price of three days and one week (proposed vs. existing schemes)
Figs. 12a and 12b describe the proposed model loss and accuracy. With the number of iterations, the proposed model’s accuracy improves while the loss value decreases. Our proposed technique performs better in terms of accuracy, attaining 96% and 93%, respectively. As the model training is improved using the AO optimized parameter values, the accuracy is increasing. The model complexity is reduced at the initial stage when the features are reduced and secondly when the AO technique provides the optimized values to the parameter of the proposed method.
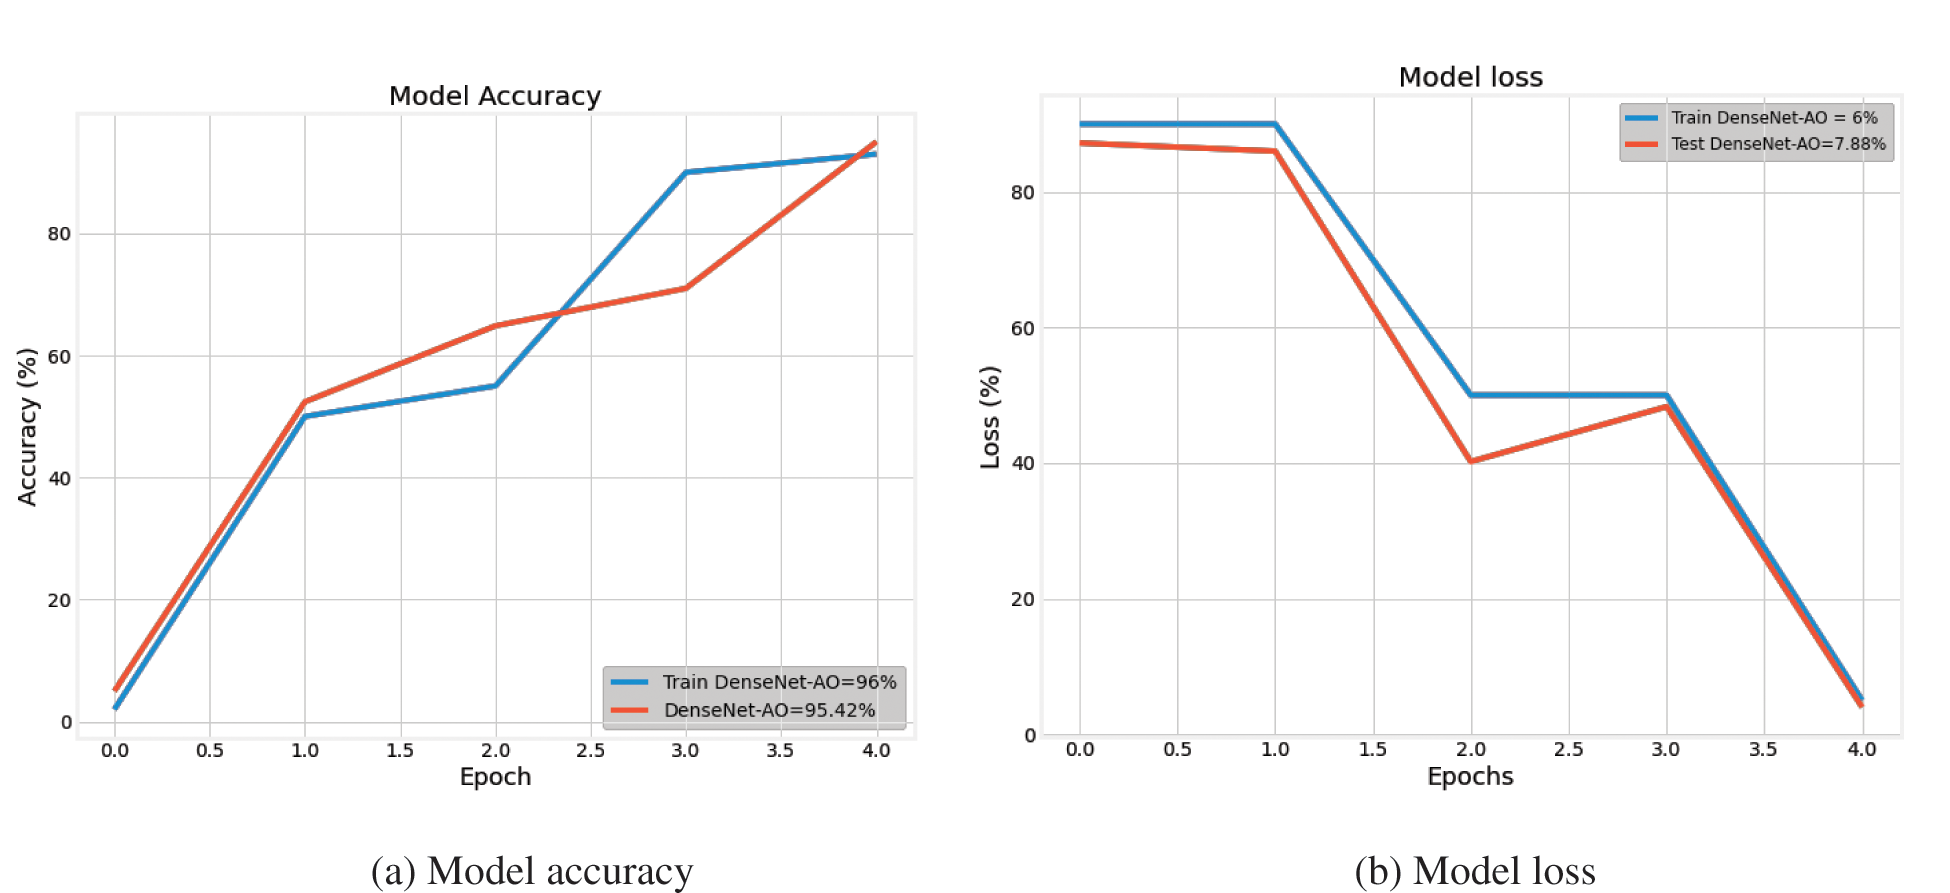
Figure 12: Price forecasting model accuracy and loss
5.3 Performance Assessment of Model for Electricity Demand and Cost Forecasting
Using performance evaluation approaches, statistical analysis, and error measurements, this section analyses the recommended model and benchmark systems.
The error measures MAE, RMSE, MSE, and MAPE were used to assess the performance, as shown in Fig. 13a and 13b. The suggested models SVM-AO and DenseNet-AO have the lowermost error rate than the RFE, LDA and RF methods. When it comes to projecting power prices and loads, the LDA method has the greatest inaccuracy rate. The lowest error indicates that the recommended approaches are preferable.
The suggested model is also evaluated and compared to the benchmark algorithm using performance evaluation criteria such as precision, F-score, accuracy, and recall. Figs. 13a and 13b show the performance error of the proposed model as well as benchmarking techniques.
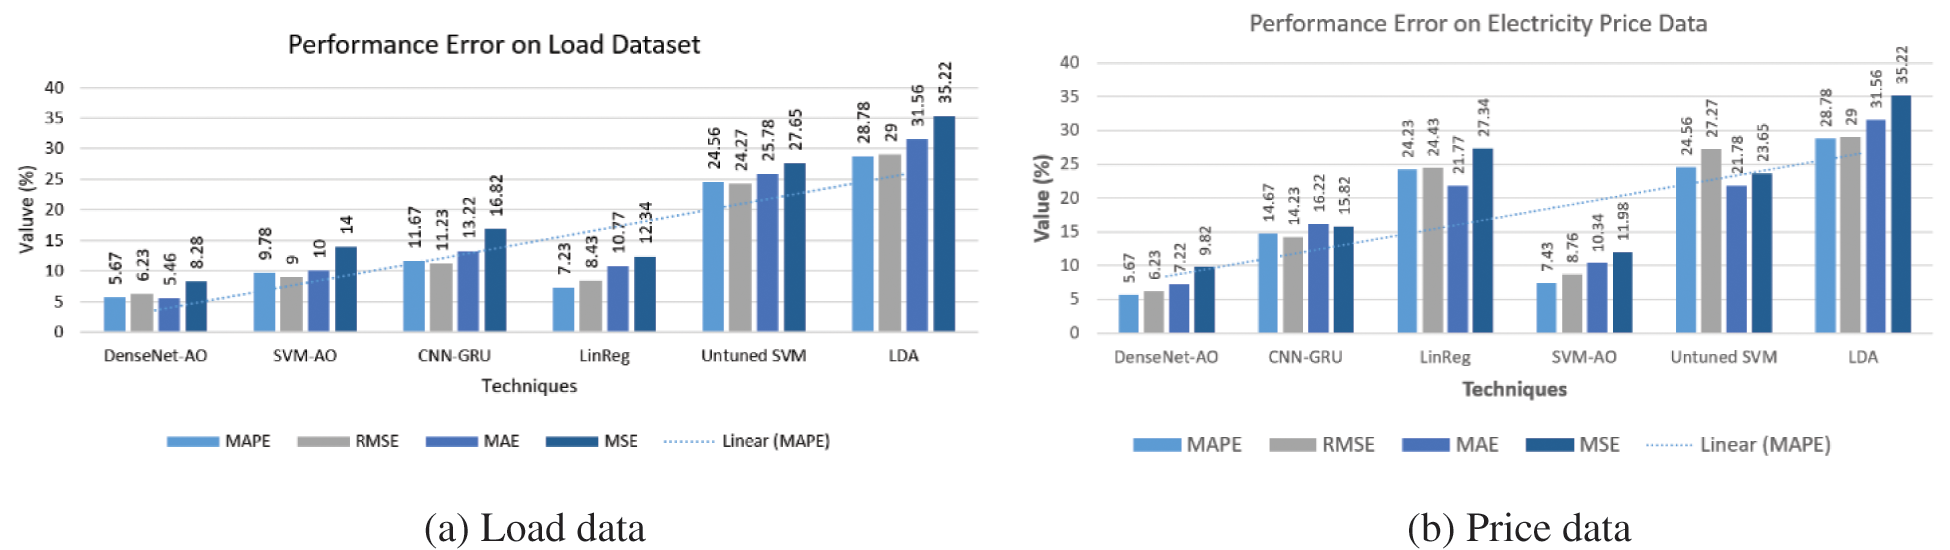
Figure 13: Performance error metrics results on existing and proposed approaches
Figs. 14a and 14b clearly illustrate that DenseNet-AO and SVM-AO are more accurate than the other benchmark algorithms. The optimization part of the suggested model has provided precise results to the models, boosting the accuracy of our developed framework. The reduction in the performance error values means our model is working better with less error rate. The accuracy of our suggested model, namely DenseNet-AO and SVM-AO in power price forecasting, is 95% and 92 percent, respectively. Furthermore, in terms of the power load forecasting model, DenseNet-AO obtained 96 percent accuracy, while SVM-AO reached 93 percent accuracy. The computational cost of DenseeNet-AO, SVM-AO, LinReg, CNN-GRU, untuned SVM and LDA is 400, 550, 880, 800, 970 and 930 s, respectively.
The performance evaluation of load demand and predictive analysis values is shown in Fig. 14. As demonstrated in Figs. 14a and 14b, our suggested technique DenseNet-AO obtained 96 percent accuracy whereas SVM-AO achieved 92 percent accuracy in load forecasting and 95 percent as well as 90 percent accuracy in price forecasting. Our approach beats existing best practices.
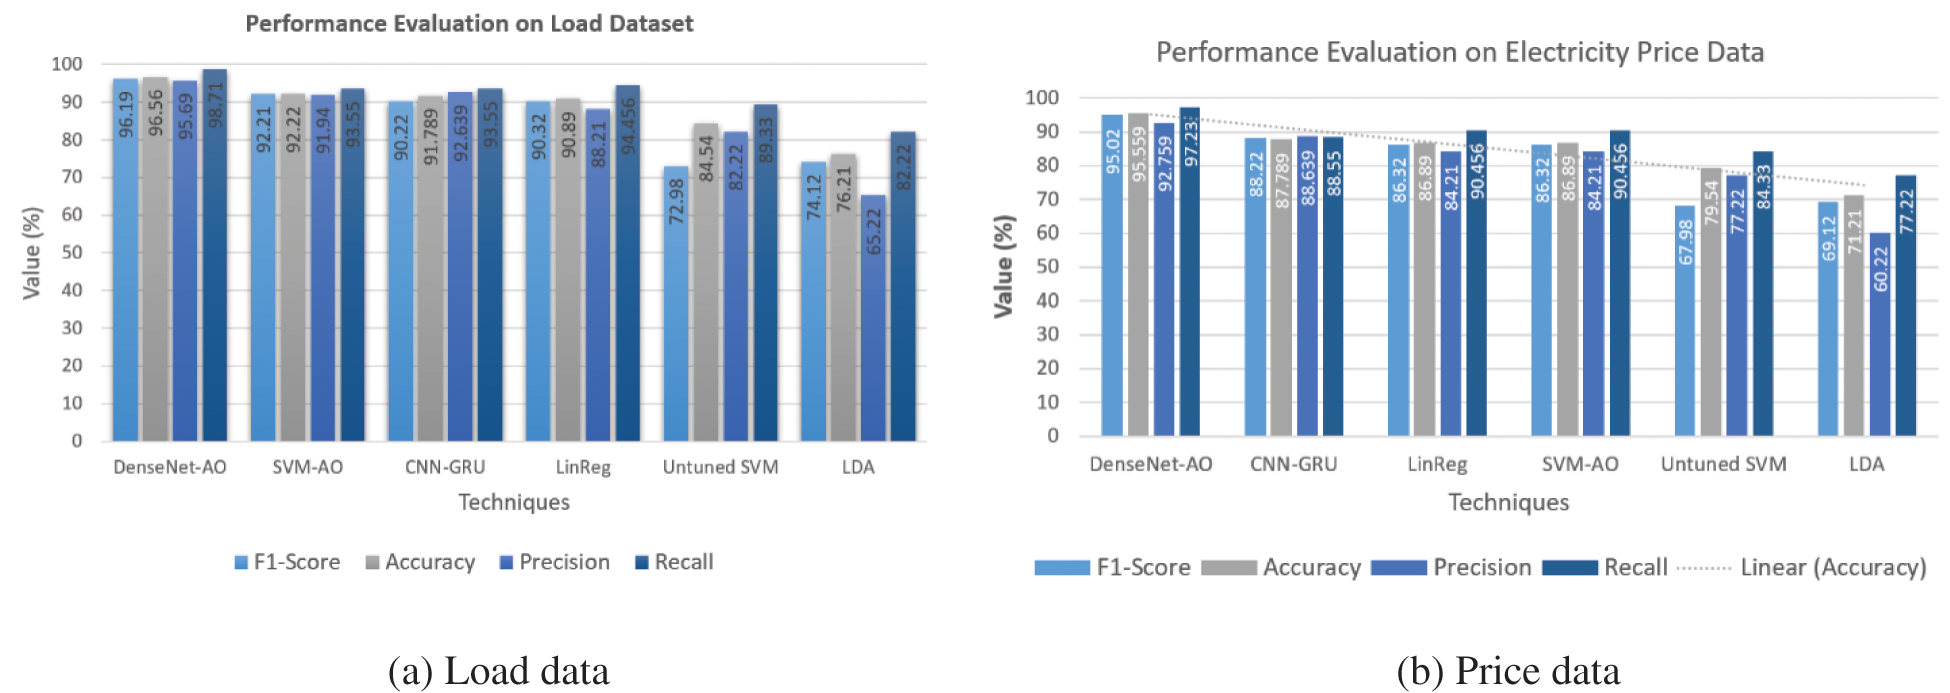
Figure 14: Performance evaluation metrics results on existing and proposed approaches
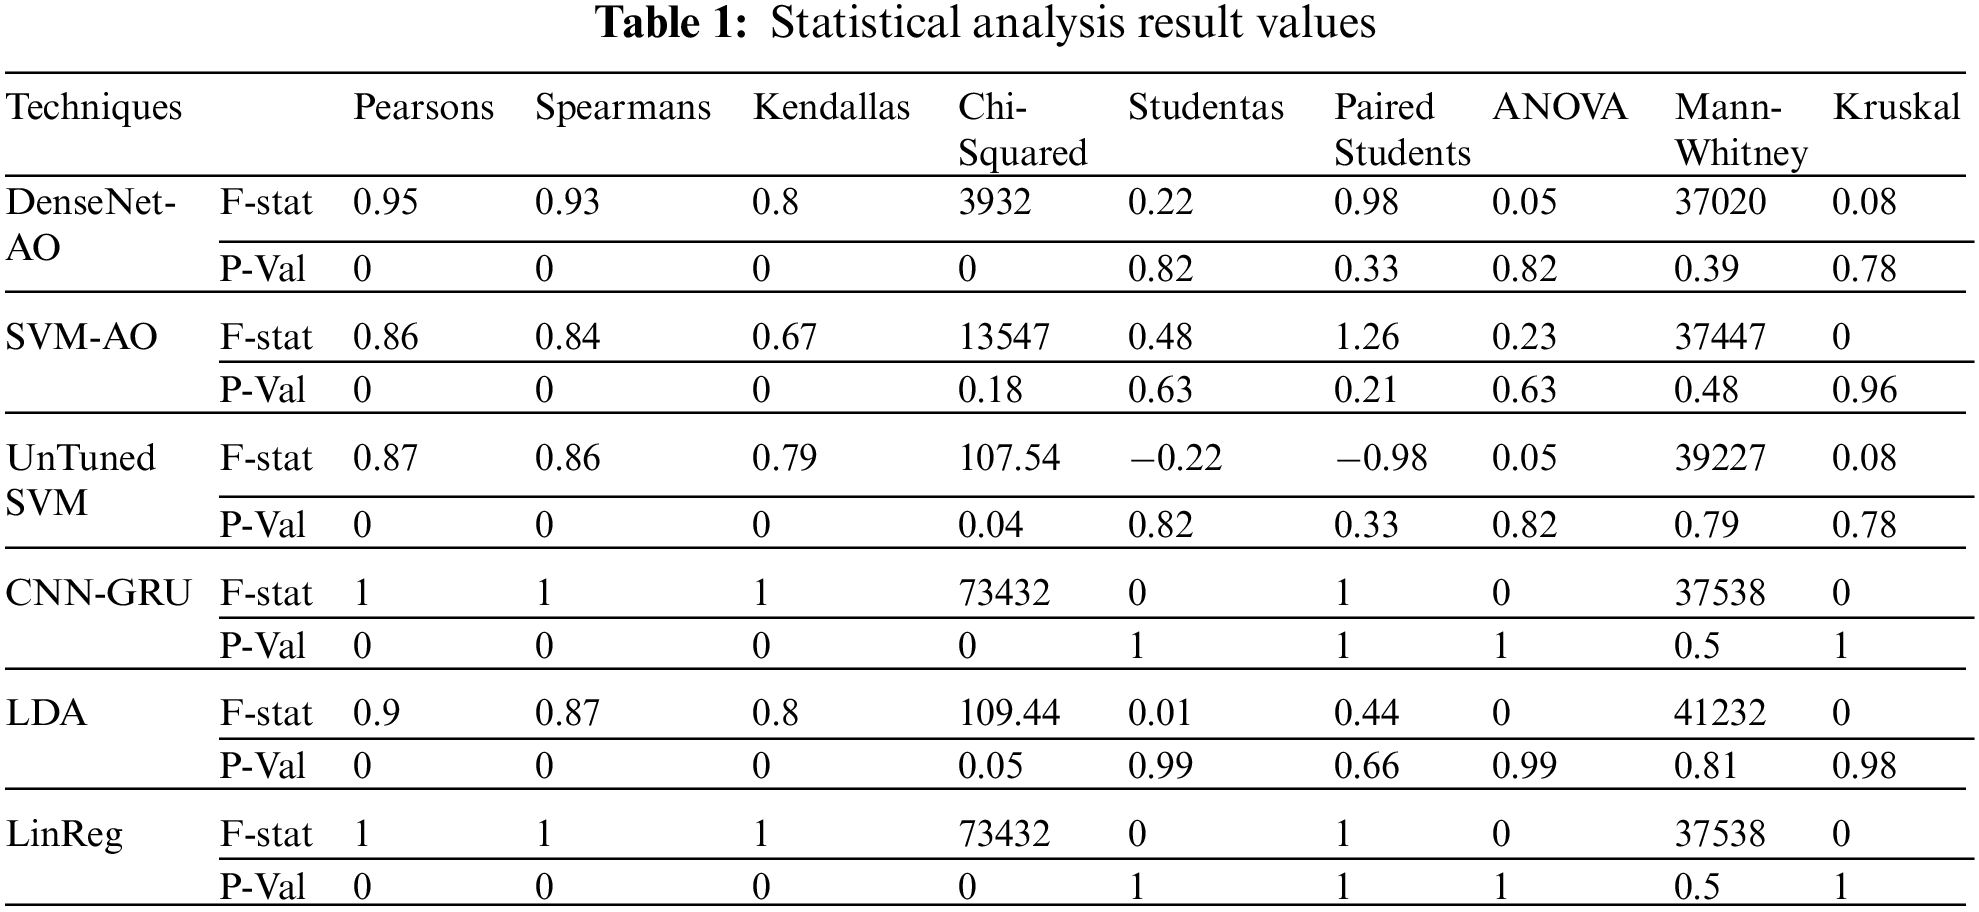
The proposed algorithm’s statistical analysis is shown in Tab. 1. To analyze our proposed model, we used ten statistical approaches. The analysis table also demonstrates the proposed model’s superiority. As we can see most of the values in the statistical analysis table are positive, which means that the hypothesis we selected is clear. The range of analysis is 0 and −1, which means if a value is more than −1 is considered as a correct hypothesis and if less than 0 considered as a false hypothesis.
The proposed model is validated in this article using a dataset from ISONE which is freely publicly available. In contrast, two models are presented for residential electric cost and energy demand forecasting. The goal of this article is to reduce computational complexity, processing time and the problem of overfitting, as well as improve classifier performance and accuracy. Missing values, redundant features and irrelevant attributes exist in the input data. Feature engineering, which comprises selection and extraction, is used to preliminary processing the input provided data. The feature engineering process, which involves choosing the most relevant features, is carried out using XGBoost, RF and RFE. The AO optimizer additionally provides optimal values for the classifier parameters, which improves the performance of the proposed classifiers, which including DenseNet and SVM. After extensive simulations, the results of our proposed model are; require very little computing time, improved preprocessing by selecting the best features, increased training accuracy, reduced model loss, high-performance accuracy and lower performance error values. A stabilization study is also performed with varied data sizes to ensure that the recommended models are stable. In load forecasting, our suggested models SVM-AO and DenseNet-AO obtained 92 percent and 95 percent accuracy, respectively, while pricing forecasting reached 89 percent and 92 percent accuracy.
To handle enormous volumes of data in a short time with maximum accuracy, we hope to integrate the new optimizers with an enhanced version of DL and machine learning methodologies in the future. We will use improved methods to analyze commercial and industrial data. We will also consider medium- and long-term load and price forecasts, respectively.
Funding Statement: The authors acknowledge the support from the Ministry of Education and the Deanship of Scientific Research, Najran University, Saudi Arabia, under code number NU/-/SERC/10/616.
Conflicts of Interest: The authors declare that they have no conflicts of interest to report regarding the present study.
1. X. Fang, S. Misra, G. Xue and D. Yang, “Smart grid, the new and improved power grid: A survey,” IEEE Communications Surveys and Tutorials, vol. 14, no. 4, pp. 944–980, 2011. [Google Scholar]
2. S. Haben, C. Singleton and P. Grindrod, “Analysis and clustering of residential customers energy behavioral demand using smart meter data,” IEEE Transactions on Smart Grid, vol. 7, no. 1, pp. 136–144, 2015. [Google Scholar]
3. X. Liu and P. S. Nielsen, “A hybrid ICT-solution for smart meter data analytics,” Energy, vol. 115, no. 1, pp. 1710–1722, 2016. [Google Scholar]
4. W. Ahmad, N. Ayub, T. Ali, M. Irfan, M. Awais et al., “Towards short term electricity load forecasting using improved support vector machine and extreme learning machine,” Energies, vol. 13, no. 11, pp. 2907–2924, 2020. [Google Scholar]
5. S. Aslam, N. Ayub, U. Farooq, M. J. Alvi, F. R. Albogamy et al., “Towards electric price and load forecasting using cnn-based ensembler in smart grid,” Sustainability, vol. 13, no. 22, pp. 12653–12681, 2021. [Google Scholar]
6. P. R. Jeyaraj and E. R. S. Nadar, “Computer-assisted demand-side energy management in residential smart grid employing novel pooling deep learning algorithm,” International Journal of Energy Research, vol. 45, no. 5, pp. 7961–7973, 2021. [Google Scholar]
7. B. S. Kwon, R. J. Park and K. B. Song, “Short-term load forecasting based on deep neural networks using LSTM layer,” Journal of Electrical Engineering and Technology, vol. 15, no. 4, pp. 1501–1509, 2020. [Google Scholar]
8. J. Wang, X. Chen, F. Zhang, F. Chen and Y. Xin, “Building load forecasting using deep neural network with efficient feature fusion,” Journal of Modern Power Systems and Clean Energy, vol. 9, no. 1, pp. 160–169, 2021. [Google Scholar]
9. E. Lee and W. Rhee, “Individualized short-term electric load forecasting with deep neural network based transfer learning and meta learning,” IEEE Access, vol. 9, no. 1, pp. 15413–15425, 2021. [Google Scholar]
10. M. Zahid, F. Ahmed, N. Javaid, R. A. Abbasi, H. S. Zainab Kazmi et al., “Electricity price and load forecasting using enhanced convolutional neural network and enhanced support vector regression in smart grids,” Electronics, vol. 8, no. 2, pp. 122–154, 2019. [Google Scholar]
11. A. Bello, R. Reneses, A. Muñoz and A. Delgadillo, “Probabilistic forecasting of hourly electricity prices in the medium-term using spatial interpolation techniques,” International Journal of Forecasting, vol. 32, no. 3, pp. 966–980, 2016. [Google Scholar]
12. W. He, “Load forecasting via deep neural networks,” Procedia Computer Science, vol. 122, no. 1, pp. 308–314, 2017. [Google Scholar]
13. K. Chen, K. Chen, Q. Wang, Z. He, J. Hu et al., “Short-term load forecasting with deep residual networks,” IEEE Transactions on Smart Grid, vol. 10, no. 4, pp. 3943–3952, 2018. [Google Scholar]
14. J. Lago, F. De Ridder and B. De Schutter, “Forecasting spot electricity prices: Deep learning approaches and empirical comparison of traditional algorithms,” Applied Energy, vol. 22, no. 1, pp. 386–405, 2018. [Google Scholar]
15. D. L. Minh, A. Sadeghi-Niaraki, H. D. Huy, K. Min and H. Moon, “Deep learning approach for short-term stock trends prediction based on two-stream gated recurrent unit network,” IEEE Access, vol. 6, no. 1, pp. 55392–55404, 2018. [Google Scholar]
16. C. Wang, H. Zhang and P. Ma, “Wind power forecasting based on singular spectrum analysis and a new hybrid laguerre neural network,” Applied Energy, vol. 259, no. 1, pp. 114–139, 2020. [Google Scholar]
17. L. Li, C. J. Meinrenken, V. Modi and P. J. Culligan, “Short-term apartment-level load forecasting using a modified neural network with selected auto-regressive features,” Applied Energy, vol. 287, no. 1, pp. 116509–116524, 2021. [Google Scholar]
18. A. Ahmad, N. Javaid, A. Mateen, M. Awais and Z. A. Khan, “Short-term load forecasting in smart grids: An intelligent modular approach,” Energies, vol. 12, no. 1, pp. 164–185, 2019. [Google Scholar]
19. M. J. Li and W. Q. Tao, “Review of methodologies and polices for evaluation of energy efficiency in high energy-consuming industry,” Applied Energy, vol. 187, no. 1, pp. 203–215, 2017. [Google Scholar]
20. Y. Xie, Y. Ueda and M. Sugiyama, “A two-stage short-term load forecasting method using long short-term memory and multilayer perceptron,” Energies, vol. 14, no. 18, pp. 1–17, 2021. [Google Scholar]
21. A. Zainab, D. Syed, A. Ghrayeb, H. Abu-Rub, S. S. Refaat et al., “A multiprocessing-based sensitivity analysis of machine learning algorithms for load forecasting of electric power distribution system,” IEEE Access, vol. 9, no. 1, pp. 31684–31694, 2021. [Google Scholar]
22. Z. Liao, H. Pan, X. Fan, Y. Zhang and L. Kuang, “Multiple wavelet convolutional neural network for short-term load forecasting,” IEEE Internet of Things Journal, vol. 8, no. 12, pp. 9730–9739, 2020. [Google Scholar]
23. S. Albahli, M. Shiraz and N. Ayub, “Electricity price forecasting for cloud computing using an enhanced machine learning model,” IEEE Access, vol. 8, no. 1, pp. 200971–200981, 2020. [Google Scholar]
 | This work is licensed under a Creative Commons Attribution 4.0 International License, which permits unrestricted use, distribution, and reproduction in any medium, provided the original work is properly cited. |