DOI:10.32604/cmc.2022.025977
| Computers, Materials & Continua DOI:10.32604/cmc.2022.025977 | |
| Article |
Brain Tumor Auto-Segmentation on Multimodal Imaging Modalities Using Deep Neural Network
1,2Department of Software Engineering, Daffodil International University, Dhaka, 1207, Bangladesh
3Department of Computing and Information System, Daffodil International University, Dhaka, 1207, Bangladesh
4Department of Computer Science & Engineering, BRAC University, Dhaka, 1212, Bangladesh
5Department of Information and Communication Engineering, Bangladesh University of Professionals (BUP), Dhaka, 1216, Bangladesh
6Department of Computer Engineering, College of Computers and Information Technology, Taif University, P.O. Box 11099, Taif 21944, Saudi Arabia
7Department of Information Technology, College of Computers and Information Technology, Taif University, P.O. Box 11099, Taif 21944, Saudi Arabia
8Department of Electrical Engineering, College of Engineering, Taif University, P.O. Box 11099, Taif 21944, Saudi Arabia
9Electronics and Electrical Communications Engineering Department, Faculty of Electronic Engineering, Menouf, 32951, Egypt
*Corresponding Author: Ahmed Nabih Zaki Rashed. Email: ahmed_733@yahoo.com
Received: 11 December 2021; Accepted: 16 February 2022
Abstract: Due to the difficulties of brain tumor segmentation, this paper proposes a strategy for extracting brain tumors from three-dimensional Magnetic Resonance Image (MRI) and Computed Tomography (CT) scans utilizing 3D U-Net Design and ResNet50, taken after by conventional classification strategies. In this inquire, the ResNet50 picked up accuracy with 98.96%, and the 3D U-Net scored 97.99% among the different methods of deep learning. It is to be mentioned that traditional Convolutional Neural Network (CNN) gives 97.90% accuracy on top of the 3D MRI. In expansion, the image fusion approach combines the multimodal images and makes a fused image to extricate more highlights from the medical images. Other than that, we have identified the loss function by utilizing several dice measurements approach and received Dice Result on top of a specific test case. The average mean score of dice coefficient and soft dice loss for three test cases was 0.0980. At the same time, for two test cases, the sensitivity and specification were recorded to be 0.0211 and 0.5867 using patch level predictions. On the other hand, a software integration pipeline was integrated to deploy the concentrated model into the webserver for accessing it from the software system using the Representational state transfer (REST) API. Eventually, the suggested models were validated through the Area Under the Curve–Receiver Characteristic Operator (AUC–ROC) curve and Confusion Matrix and compared with the existing research articles to understand the underlying problem. Through Comparative Analysis, we have extracted meaningful insights regarding brain tumour segmentation and figured out potential gaps. Nevertheless, the proposed model can be adjustable in daily life and the healthcare domain to identify the infected regions and cancer of the brain through various imaging modalities.
Keywords: Brain cancer segmentation; 3D U-Net; ResNet50; Dice measurement; ROC-AUC
A brain tumor is one of the foremost shocking’s clutters globally [1]. According to the Central Brain Tumor Registry of the United States, CBTRUS, 83,570 people were evaluated and expected to be diagnosed with brain. Other Central Nervous System (CNS) tumors within the US (24,530 harmful tumors and 59,040 nonmalignant tumors), and 18600 individuals will die from the disease [2].
Most brain tumor detection and diagnosis methods depend on the decision of neuro specialists and radiologists for image evaluation which is complicated, time-consuming, and vulnerable to human error [3]. Therefore, computer-aided diagnosis is currently in demand. In addition, in a low-income country like Bangladesh, the expense of tertiary health care is likely to be high for the majority of inhabitants [4]. As a result, ordinary people find it difficult and expensive to diagnose a disease further. On the contrary, by optimizing and standardizing the way that electronic medical record (EMR) systems are designed, we can lower the cost of supporting them with machine learning [5]. Many companies employ these techniques to improve medical diagnostics and early disease prediction [6,7].
The proposed study considers multimodal images from MRI and CT scans. Based on image fusion, a novel technique has been used to combine the multimodal images. As a result, feature extraction was easier, and an accurate result was produced when the model was trained using these fused images. This research aims to develop a robust and automatic brain cancer detection system with comparatively higher accuracy. As a result, both physicians and patients can detect brain cancer from the brain’s scan images in less time than the time required for a conventional strategy.
The main purpose of this work is to create a computerized framework for recognizing brain cancer factors utilizing cutting-edge innovation like machine learning as follows:
1. This study demonstrates a novel image fusion technique for identifying brain tumors that can provide quick and promising accuracy.
2. We employed both U-Net architecture and ResNet50 architecture for image segmentation. We compared them to show a better approach.
3. A robust system that applies the state-of-art technique combined with machine learning will be developed to make it publicly available to diagnose brain tumors from multimodal brain images.
This study is organized into five interconnected sections. In Section 2, the literature review, we have reviewed the existing literature. In Section 3, the research methodology, we have proposed the system architecture. In Section 4, the results and analysis, we have discussed the results and the corresponding relevant comparison. Finally, Section 5 concludes the paper with future work.
Several machine learning and deep learning schemes have been utilized extensively in brain tumor identification. The authors in [8] used the capsule neural network. The capsule arranged for the classification of the cancer sorts within the brain is prepared with an open database and tried applying the TGCA-GBM dataset from the TCIA. Compared with the other systems, the extra change appears within the classification exactness with the reduced computational endeavours and the preparation and forecast process time. Nevertheless, assessing the trial and testing the proposed strategy appears that the capsule neural network-based classifier has outperformed the convolutional networks.
The paper [9] used TensorFlow to detect brain cancer using MRI. It implemented the convolutional neural network (CNN)with five layers in TensorFlow. In total, the authors used 1800 MRIs in the dataset. Among this dataset, 900 images were cancerous, and 900 were non-cancerous. Data Augmentation techniques were used after the data acquisition. The training accuracy of the approach was 99%, and validation accuracy was 98.6% in 35 epochs. The system is still in development.
The authors in [10] proposes an improved approach utilizing Remaining Systems for classifying brain tumor sorts. The dataset contains 3064 MRIs of 3 brain tumor sorts (Meningiomas, Gliomas, and Pituitary tumors). The authors utilized many strategies, including ResNet, to extend the dataset measure and improve the exactness. The papers [11] and [12] used convolutional neural arrange to identify brain tumors from brain MRIs. According to [11], the Softmax classifier has the greatest exactness in CNN. And the strategy got a precision of 99.12% on the test information. The authors in [13] carry the thought of profound learning, a procedure for picture compression employing a deep wavelet autoencoder (DWA). The fundamental reason for this approach is to mix the essential includes lessening property of the autoencoder and the picture decay property of wavelet change. The authors compared the proposed method with autoencoder-deep neural network (autoencoder-DNN) and showed the superiority of DWA. On the opposite, the paper [14] utilized VGG-19 for exchange learning and the highlights are optimized through entropy for precise and quick classification.
The authors in [15] proposed a computerized multimodal classification strategy utilizing profound learning for brain tumor sort classification. The approach is comprised of four important steps. First, the direct differentiate extending uses edge-based histogram equalization and discrete Cosine transform (DCT). Second, perform profound learning includes extraction. Third, implement a correntropy-based joint learning approach beside the extraordinary learning machine (ELM) to choose the most excellent highlights. Fourth, intertwine the atrial slightest square (PLS)-based vigorous covariant highlights in one network. The combined lattice was afterwards nourished to ELM for the last classification. The said technique improved precision from 92.5% to 97.8% on distinctive BraTS datasets.
The authors in [16] unraveled the issue of multiclass classification of brain cancer by beginning with changing it into a few twofold issues. First, it chose the highlights to employ a strategy based on the Support Vector Machine Recursive Feature Elimination (SVM-RFE) rule. Then, on the other hand, the Twin Support Vector Machine (TWSVM) is utilized as the strategy of the classifier to decrease computational complexity. At last, the ponder appears 100% exact in classifying information of typical and MD classes.
The literature [17] utilized an ensemble learning approach to recognize the distinctive brain cancer grades. The study proposed a strategy to identify the components of a gathering learner. The proposed system is assessed with 111,205 attractive brain resonances having two unreservedly accessible datasets for investigation purposes. As a result, the proposed method improved precision up to 99% of exactness. The authors in [18] developed a tumor segmentation algorithm using image processing techniques with great learning machines nearby open areas (ELM-LRF) to improve precision up to 97.18%.
The previous research did not concentrate on extensively using the novel approach based on the above literature review. The majority of the study is limited to making a classifier or segmentation system using typical deep learning architecture. Secondly, it is crucial to optimize the model's loss while developing any clinical models. Real-time complex data handling will be highly significant when installing such a model into the healthcare sector. A comprehensive pipeline is required by reducing the loss, which is still missing. We used multimodal imaging modalities in the proposed research, e.g., CT scan and MRI images. We combined them to make a fused image with the help of the Image Fusion algorithm so that significant features can be extracted quickly, and simultaneously the fused image can be fed into the model to get a better and faster diagnosis. We have shown a comprehensive architecture towards developing a clinical tool because a software integration approach is demonstrated in this research for the consideration of researchers. In our ponder, state-of-the-art methods such as 3D U-Net and ResNet50 are coordinates for making a computerized and speedier determination framework.
The methodology of this proposed research is categorized into six segments: Research Dataset, Data Preprocessing, Suggested Algorithms, Selecting Loss Function, Image Fusion Approach (IFA), and Software Integration Pipeline. Fig. 1 shows the model of this proposed research. The entire study has been carried out by following the procedures. Taking a close look at Fig. 1, it can be observed that the overall research has been conducted by following the three interconnected steps, e.g., Data Preprocessing, Model Preparation, and Deployment. In the beginning, the necessary code and data are passed through the Data Extraction module. Then with the utilization of MRI and CT scan images, the signals are forwarded to the subsequent component like Data Preprocessing. After reaching out to the second module, the research dataset has been preprocessed appropriately to feed the data into the machine. After that, the concentrated models were trained and validated using the third component, such as Model Preparation; eventually, the proposed segmented models were deployed into the webserver to access it from the software system. Nonetheless, the detailed sequence and consequences are shown visually in Fig. 1.

Figure 1: Block diagram of the research model. The comprehensive pipeline is followed by three steps, e.g., data preprocessing, model preparation, and deployment, to develop effective clinical tools
Suppose we need to portray this proposed pipeline, ready to say. In that case, we'll begin with a local or cloud storage to collaborate our work which repository will be overhauled to outworking changes, and each alters will execute the total pipeline. After a alter is made to the dataset or code, the channel will take a step to the Information extraction module, where each will be disengaged. The method begins with the image combination method, where we combined MRI and CT images and made a fused picture. Then, we passed those pictures to the image segmentation module, where the division module creates diverse divisions and make a mask, label, and handles picture one by one. The information processing will be complete here, and then it’ll part the processed information to train, validate and test, and complete the entire data preprocessing process. Within another parcel, it’ll make a preparing set up and prepare the show and after it too assesses the performance to check its productivity. Finally, the deployment stage comes where the prepared model is saved to demonstrate storage. The chosen updated model will be thrust to the server for utilizing, and by interfacing that API’s, a web or mobile application can execute the brain cancer detection process.
BraTS 2015 dataset is considered in this ponder: image division of brain tumors. There are 220 MRIs of high-grade gliomas (HGG) and 54 MRIs of low-grade gliomas (LGG) within the consider. The four intra-tumoral classifications fragmented as “ground reality” are edema, upgrading tumor, non-enhancing tumor, and corruption. Each preparing test is divided into two records: The primary is a picture file with a 4D cluster of MRI pictures within the shape of a heart (240, 240, 155, 4). The Primary THREE Measurements ARE the X, Y, and Z values for each point within the 3D volume, for the most part, alluded to as a voxel. The values for four partitioned arrangements make up the fourth measurement: Pizazz is for “Liquid Weakened Reversal Recuperation”, and T1w stands for “T1-weighted” T1gd stands; for “T1-weighted with gadolinium differentiate upgrade” (T1-Gd), and T2w stands for “T2-weighted.” In each preparing illustration, the moment record may be a name record that contains a 3D cluster with (240, 240, 155). The integer values in this cluster speak to the “name” for each voxel within the related picture records: portrays the foundation, one says to edema, 2 outlines a non-enhancing tumor, and three speaks to an improving tumor. We have got to 484 preparing images, isolated into training (80%) and validation (20%).
To start, we focused on making “patches” of our information, which are alluded to as sub-volumes of the complete Attractive reverberation imaging (MRI) pictures. The patches were made since a network competent in processing the whole volume at once would essentially not fit inside our current environment's memory/GPU capabilities. As a result, we’ll employ this standard method to produce spatially steady sub-volumes of our information that can be encouraged into our arrangement. We’ll particularly create arbitrarily inspected shape sub-volume [16] from our images. Furthermore, owing to the reality that a considerable chunk of the MRI volumes is just brain tissue or dark foundation with no tumors, we need to form beyond any doubt that we select patches with a few tumor information. As a result, we’ll only choose patches with at slightest 95% non-tumor districts. Typically finished by filtering the volumes concurring to the values within the foundation names. Standardizing direction (cruel 0, step 1) At long last, since the numbers in the MRI image span such a wide run, we’ll standardize them to a cruel of zero and a standard deviation of one. Because standardization makes memorising much simpler, this can be a common technique in profound picture preparation. After that, the Sub-volume Inspecting was made. An arbitrarily produced sub-volume of estimate [160, 160, 16]. Its comparing name is in a 1-hot arrange, which has the shape [3, 160, 160, 16]. It has been guaranteed that 95% of the returned fix is non-tumor locales, whereas applying this sub-sampling strategy.
Given that our network anticipates the channels for our pictures to seem like the primary measurement (rather than the final one in our current setting), reorder the image’s measurements to have the channels show up as the primary dimension. Reorder the measurements of the name cluster to have the direct size as the classes (rather than the final one in our current setting). Decrease the names cluster measurement to incorporate the non-background classes (add three rather than four). Finally, the standardization method is connected to standardize the values over each channel and each Z plane to have a cruel of zero and a standard deviation of 1.
Several state-of-the-art techniques have been utilized for this work, but among them, the 3D U-Net Architecture and ResNet50 [12] appeared with satisfactory performance. Here should be mentioned that, for the case of fused Images, we have achieved better accuracy for ResNet50. Moreover, the 3D U-Net architecture can segment images utilizing exceptionally few clarified illustrations. This is often because 3D images have parcels of rehashing structures and shapes, empowering a quicker preparation process with barely labeled information. On the other hand, ResNet-50 is 50 layers deep CNN design. Other than that, the show has over 23 million trainable parameters, which appears significant engineering that produces it better for picture division and affirmation too, and the center CNN is utilized to degree the half-breed CNN strategies to watch the customization proficiency.
Aside from architecture, one of the basic components of any profound learning strategy is choosing our misfortune work. A common choice merely may be recognizable with is the cross-entropy loss work. Be that as it may, this misfortune work isn’t perfect for division assignments due to overwhelming course awkwardness (there are regularly not numerous positive locales)., we chose Dice Similarity Coefficient (DSC) to measure similarity in a single class and its version for multiple classes with soft dice loss.
Images are the foremost common information source in healthcare, but they are also troublesome to analyze. Clinicians must presently depend intensely on restorative picture examination performed by exhausted radiologists. Computer vision program based on the foremost later profound learning calculations permits automated investigation to supply exact comes about that is conveyed exceptionally speedier than the manual prepares. Multimodal therapeutic imaging has changed how we diagnose diseases from MRI and CT scans by making decisions. Multimodal imaging points supply a more wonderful picture that gives more exact and dependable measurements than any single image, protecting the only noteworthy highlights of the depictions program for therapeutically testing, diagnosing, and curing disorders. The two modalities considered for the picture Combination are CT and MRI.
The method of converting pictures into a shared facilitate framework in which comparable pixels speak to homogeneous organic areas is known as picture enlistment. Registration can be utilized to supply an anatomically normalized reference outline that can be used to compare brain ranges from different patients. A fundamental method in which several focuses (points of interest) are characterized on indistinguishable places in two volumes is known as picture points of interest enlistment. The volumes are enlisted once a calculation coordinates the points of interest. The CT check picture is utilized as a reference (settled) picture, and the MRI check picture is adjusted concurring to the user’s points. Fig. 2 clarifies the comprehensive architecture of the Image Fusion.

Figure 2: Comprehensive architecture of the image fusion. The MRI and CT scans are received first. The wavelet decomposition then feeds to the transfer learning algorithms to make fused images
STEP 01: Applying the wavelet deterioration on the CT picture to produce surmised LL1 coefficient and the detailed LH1, LV, and LD1 coefficients.
STEP 02: Applying the wavelet decay on the MRI to produce surmised LL2 coefficient and detailed the detailed LH2, LV2, and LD2 coefficients.
STEP 03: Applying the combination based on the VGG-19 organized on 4 sets: (LL1, LL2), (LH1, LH2), (LV1, LV2), and (LD1, LD2) to create LL, LH, LV, and LD bands.
STEP 04: Applying converse wavelet change on the 4 bands produced in step 3 to get the fused image.
Watershed division is a region-based strategy that employs image morphology. It demands the determination of slightest one marker insides each picture question, counting the foundation as an isolated protest. The markers are chosen by an administrator or given using a programmed method that considers the application-specific information of the objects. Once the things are checked, they are developed employing a morphological watershed change.
3.6 Software Integration Pipeline
From model storage updated model is chosen for the forecast of the demonstration, and the predicted model record will be conveyed utilizing a carafe system to test the demonstration from client input; typically, the test will be executed on the nearby server. To use this show to Web or mobile applications, we utilized the gunicorn server and transferred all our updated records to Heroku from the git repository. Then, through Heroku API, we used this model from the Web or mobile applications to distinguish brain cancer. Fig. 3 illustrates the model deployment pipeline, which contains seven interconnected steps: Updating Model, Model Prediction, using Flask, WSGI HTTP Server, Accessing Git Repository, Passing to the Heroku, and finally, the user’s application. The detailed explanation and illustration are shown in Fig. 3.

Figure 3: Highlighting the software integration pipeline for identifying the brain cancer and segmenting the infected region through the real-life software system, e.g., web application or mobile application
4.1 Dice Measurement Interpretation
Tab. 1 clarifies the dice measurement report for the dice coefficient. The Dice similarity coefficient (DSC) was utilized as a measurable approval metric to assess the execution of both the reproducibility of manual segmentations and the spatial cover exactness of robotized probabilistic fragmentary division of MRI pictures. We consider the best test case for all categories in each test class and expose each test case as three different test classes. The DSC average means the outcome is as expected, which is 0.9053, and it was close to the standard DSC matrix is not exceeding the margin more significant than 1. The Dice similitude coefficient (DSC) was utilized as a quantifiable validation metric to survey the execution of both the reproducibility of manual segmentations and the spatial cover precision of computerized probabilistic fragmentary division of MRIs. We consider the most acceptable test case for all classes in each test class and uncover each test case as three diverse test classes. The DSC typical mean result is as anticipated, which is 0.9053, and it was near to the standard DSC lattice, which isn't surpassing the edge more noteworthy than 1. In addition, Tab. 1 also illustrates the dice measurement report for the soft dice loss. The Dice similarity coefficient (DSC) was utilized as a quantifiable approval metric to evaluate the execution of both the reproducibility of manual segmentations and the spatial cover exactness of the computerized probabilistic fragmentary division of MRI images.
We consider the most acceptable test case for all classes in each test class and uncover each test case as three diverse test classes. The DSC typical mean result is as anticipated, which is 0.9053, and it was near to the standard DSC lattice, which is not surpassing the edge more noteworthy than 1. Soft dice loss was calculated to address the data imbalance problem to get the more excellent gradients. Nevertheless, the class imbalance can be given a different loss factor for each class. The network can deal with the frequent situation of a specific category. It remains to be explored whether it is suitable for the category imbalance scenario. Bellow cases expose the class’s efficient losses as it deals with each data class whose average mean is 0.0980. The more pleasant gradients soft dice loss had been calculated to address the data imbalance issue and a persuading wish. In any case, the class imbalance can be given a distinctive loss calculated for each class. The organization can bargain with the frequent circumstance of a particular category. It remains to be investigated whether it is reasonable for the category imbalance situation. Bellow cases expose the proficient class losses as it manages each data class whose average mean is 0.0980.

4.2 Model Classification Report (MCP)
The classification problem may seem to be a kind of multiclass classification problem, but it is an instance segmentation where each tumor in the image is independent. The main objective of this classification is to identify the positive and negative labels from the segmented images data. In the experiments, three deep learning models, namely ResNet-50, U-Net, and CNN, have been trained and tested on the chosen and segmented dataset. From Tab. 2, we found that each classification method performs quite well. The topmost is ResNet-50 which achieves 98.96% accuracy with high precision, recall & F1 score, and respectively, U-Net & CNN got the second and last position. These classification methods give performance metrics based on the segmented image using U-Net. Tab. 3 clarifies the patch level prediction in identifying the sensitivity and specificity. The demonstration covers a few important regions, but it’s unquestionably not idealized.


Fig. 4 outlines the melded pictures constituted by utilizing Picture Combination Calculations. This strategy aims to make images more worthy and comprehensible for human and machine perception, not fair to play down the sum of information. Multisensory picture combination could be a computer vision procedure that combines germane data from two or more pictures into a single image. On the other hand, Fig. 4d clarifies the segmenting of the infected region for the case of Sagitical, Transversal, and Coronal. The red mark indicates the regional segmentation towards automated measurements.
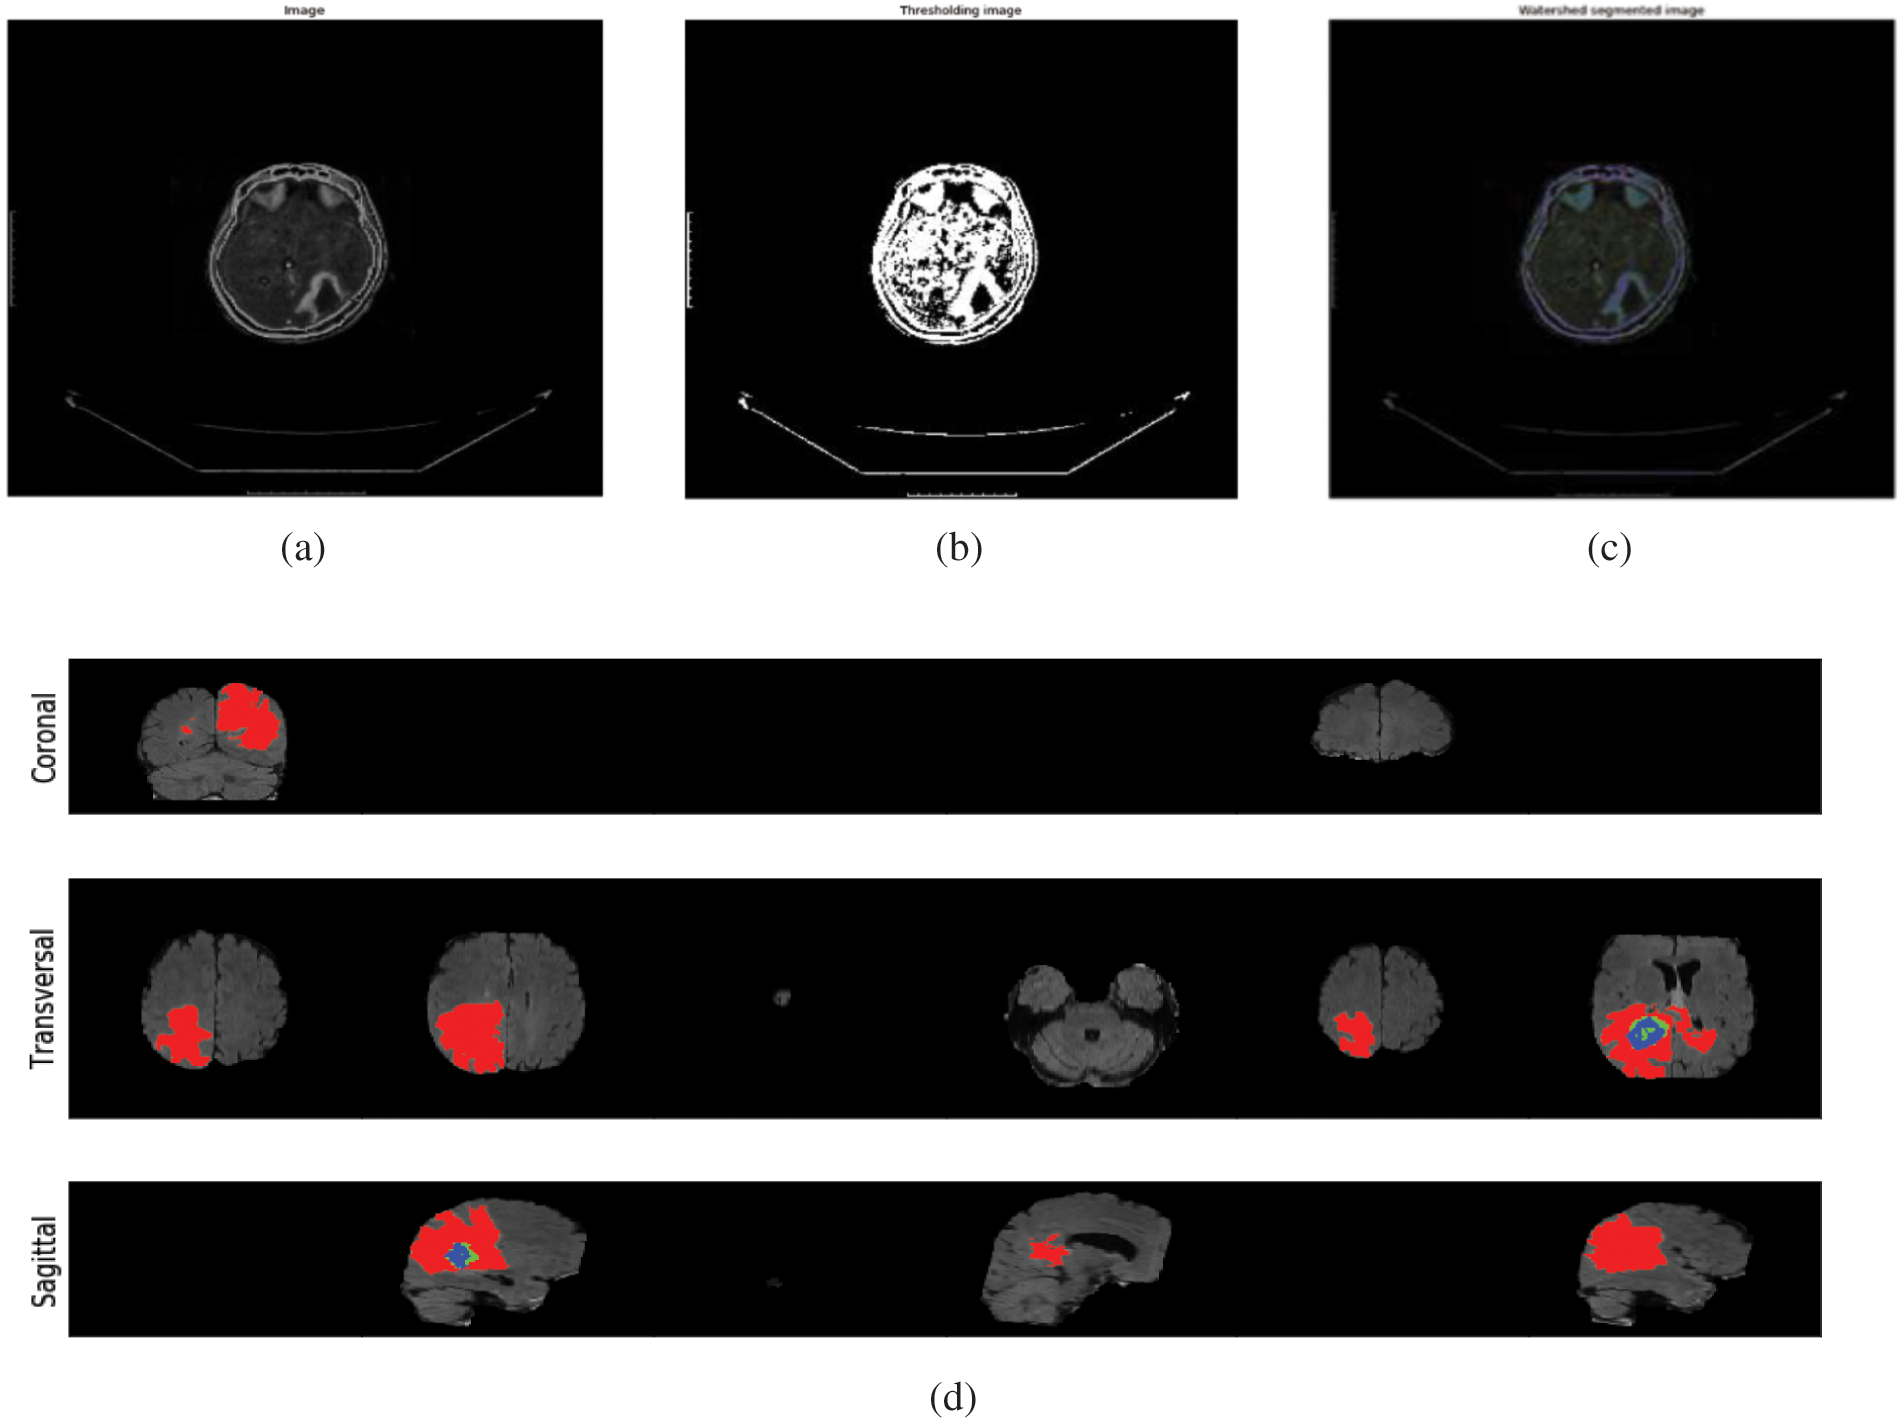
Figure 4: (a) Illustration of the normal images (b) demonstrating the thresholding Images (c) visualized the watershed segmented image (d) segmenting the infected region for the case of sagitical, transversal, and coronal. The red mark indicates the regional segmentation towards automated measurements
After the assessment, markers have been utilized to survey our concentrated demonstrate, e.g., Confusion Matrix, ROC-AUC Curve, and Loss Accuracy Estimation. It can be said that a perplexity lattice could be a capable instrument for evaluating classification models [19]. It gives you a clear picture of how well the model distinguished the classes based on the information you supplied and how the classes were misclassified. The Recipient Administrator Characteristic (ROC) bend may be a parallel classification issue evaluation metric. It’s a probability curve that displays the TPR against the FPR at distinctive edge levels, subsequently isolating the flag from the ‘noise’. The Region Beneath the Bend (AUC) could outline the ROC bend that measures a classifier’s capacity to recognize between classes [20]. The AUC shows how well the show recognizes between positive and negative categories. The higher the AUC, the way better the execution of the show. When AUC = 1, the classifier can effectively separate all Positive and Negative course focuses. Be that as it may, on the off chance that the AUC was 0, the classifier would anticipate all Negatives to be Positives and all Positives to be Negatives when the 0.5 classifier comes up short to distinguish between Positive and Negative lesson focuses. The classifier either anticipates an irregular or consistent lesson for all of the information focuses. As a result, the higher a classifier’s AUC score is, the better it can recognize between positive and negative classes, as shown in Fig. 5.
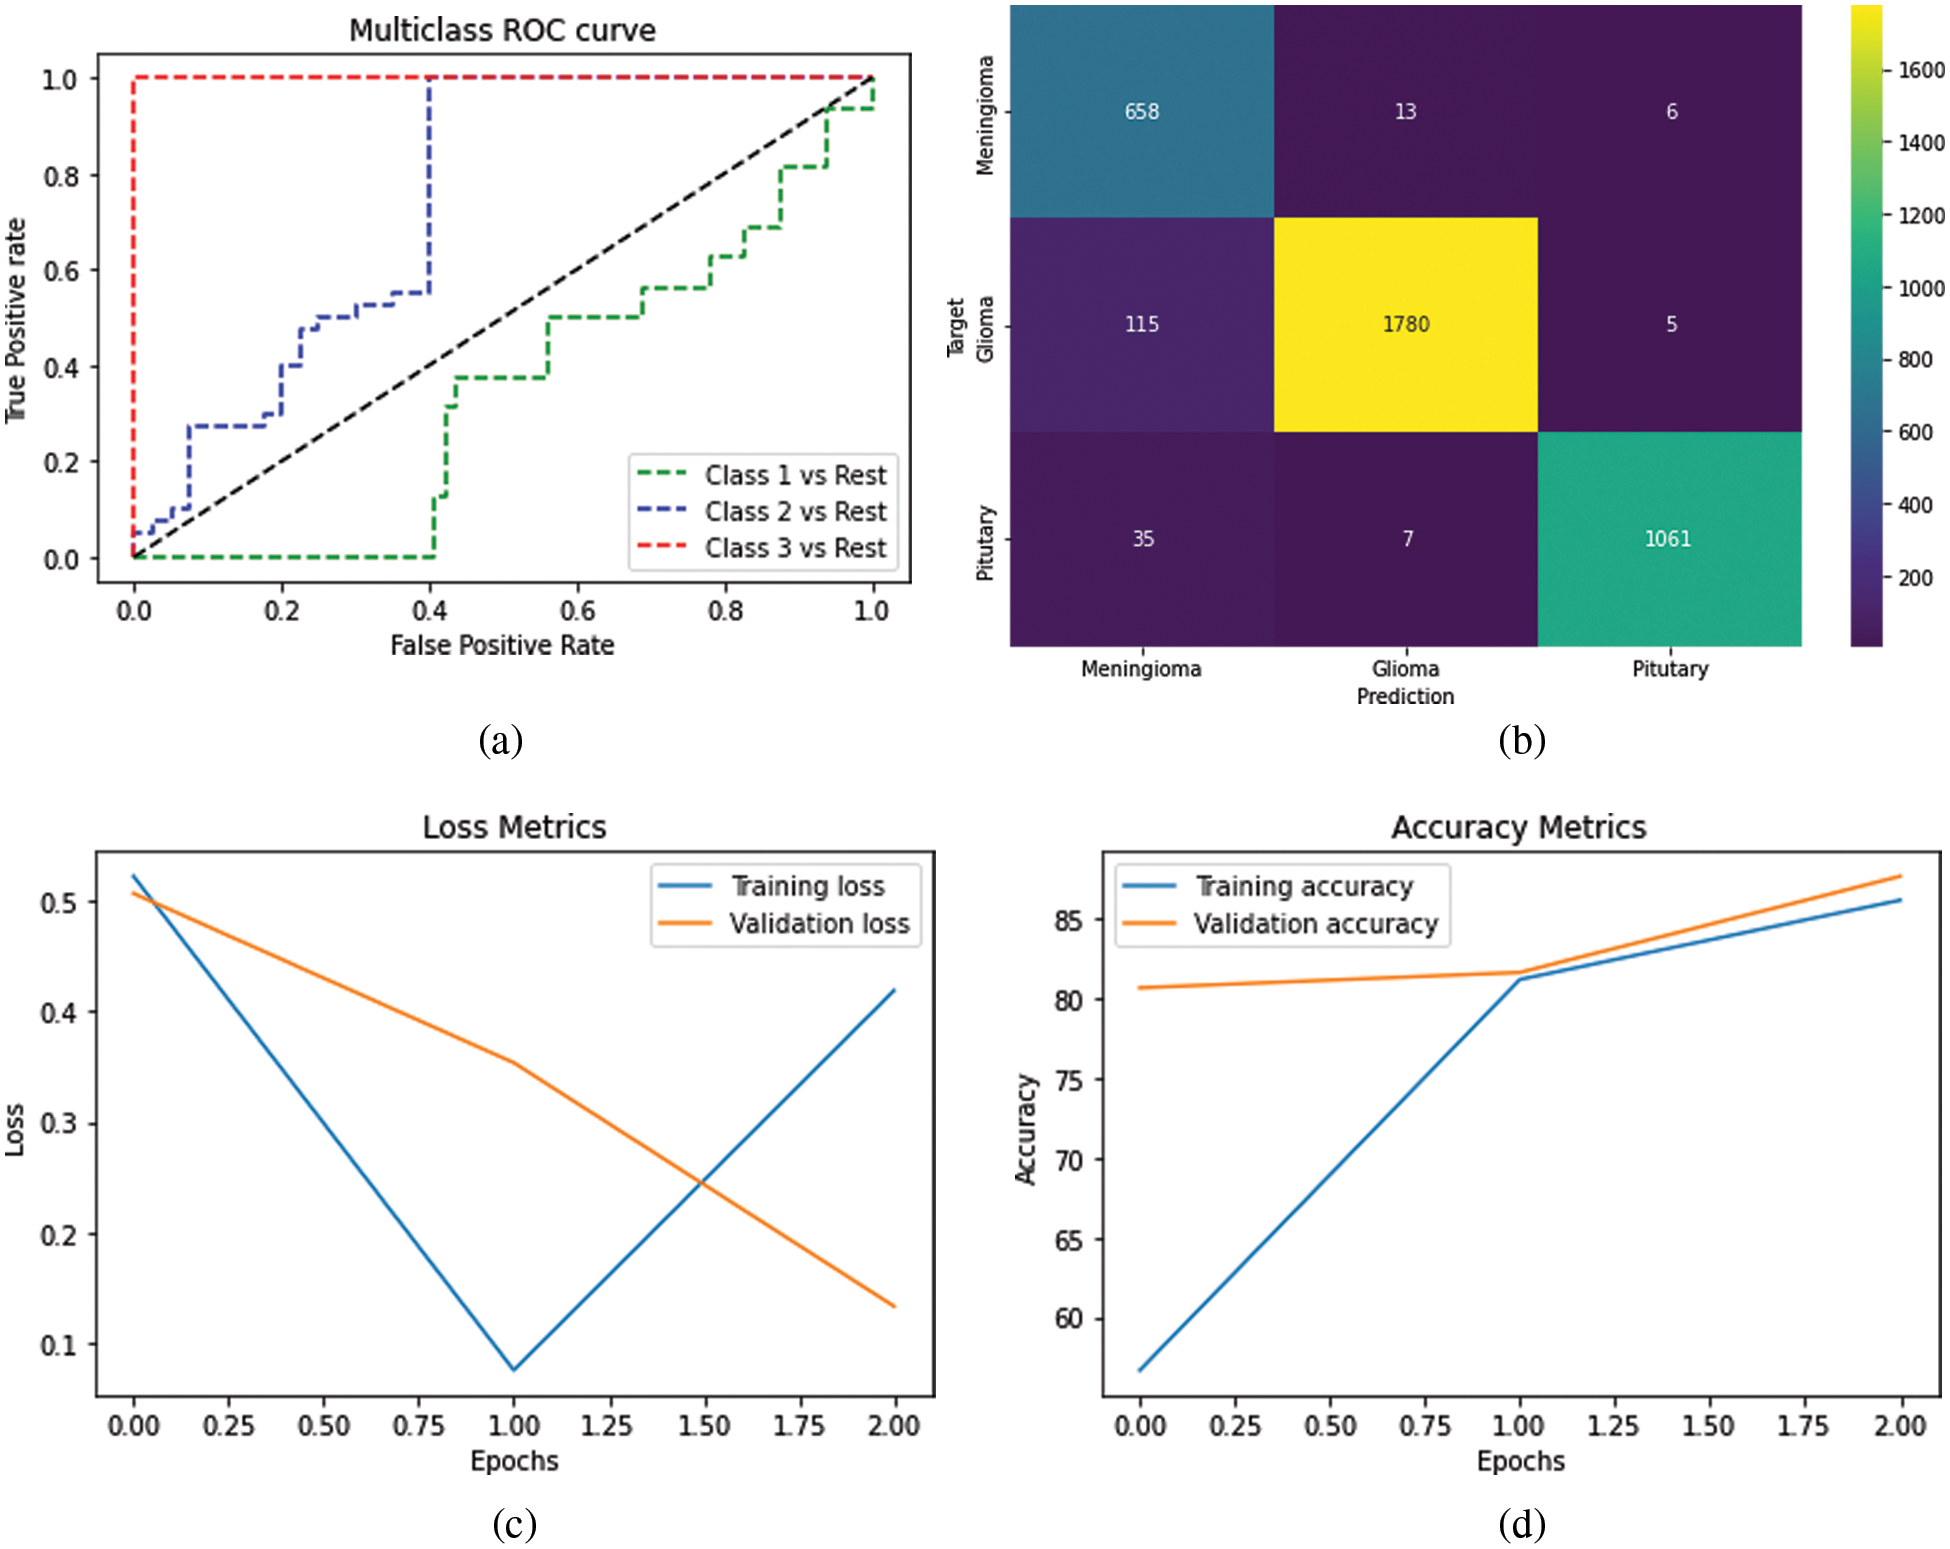
Figure 5: (a) Visualize the ROC curve of the multiclass (b) representation of the confusion matrix on the trained dataset (c) differentiation between epochs and loss (d) showing the training and validation accuracy over the epochs and accuracy
It is to be mentioned that U-Net is a promising approach for Image segmentation. However, we segmented all our data using U-Net.We used U-Net, ResNet50, and CNN to verify the classification method and received the satisfactory performance shown in Tabs. 4 and 5. Nonetheless, we made our comparison defined with two portions. On the first hand, we are executing all sorts of methods with fused segmented images where the image datasets are preprocessed by image fusion technique and then segmented through U-Net. On the other hand, we didn’t use the image fusion technique, just segmented images. It can be observed that methods executed with fused images give comparison output than the non-fused images. Since in image fusion strategy, pictures are characterized as an arrangement of vital data from different sensors utilizing different numerical models to create a single compound picture. The combination of the image is being used for joining the complementary multi-temporal, multi-view, and multi-sensor data into a single picture with moved forward picture quality and by keeping the keenness of basic highlights. Therefore, it is considered an imperative preprocessing. As we can see, the picture combination strategy contrasts with picture division and effectively the classification executions result.


4.5 Observations and Discussions
After reviewing the literature, it can be observed that a few state-of-the-art strategies were inspected in advance in terms of segmenting and classifying brain cancer, but the comprehensive pipelines are still missing. Despite having strengths and accuracy in certain specific papers, including the model’s performance over different features, several drawbacks were noticed during the reviewing phase. It is noticeable that Capsule Neural Network (CAPNN) was applied for classifying brain cancer, but the CAPNN finds difficulties in differentiating the very close object. We have also observed that SVM-RFE was used to classify brain cancer from multimodal imaging modalities and appeared with good accuracy. The results demonstrate consistent overall accuracy throughout a wide range of feature counts, implying that the same accuracy may be obtained with a minimal number of features. Some enhancements that might be explored include standardizing the data, utilizing different features, and using other ways to convert multiclass issues into binary problems. Apart from these, the previous research only concentrated on making a robust model instead of constituting the clinical tools, which is crucial because a powerful clinical application is required to complete the diagnosis faster. We used image fusion techniques and software integration to overcome these drawbacks to create “patches” of our data. CT scan and MRI are the two modalities considered in this research. We also optimized loss function, removed overfitting, and reduced the complexity of ResNet50 and 3D U-Net algorithms, for which we have achieved better accuracy in the case of fused Images. Nonetheless, we have shown a pipeline for deploying the clinical model into the webserver. The clinical models can be deployed to make real-time software to detect the brain cancer region and classify the cancer label following the procedures.
Concurring to the insights by CBTRUS, it is assessed that, in 2021, in 18600, individuals will pass on from brain cancer. Be that as it may, the mortality rate can be decreased by diagnosing the brain tumors from multimodal pictures as early as conceivable. On the opposite, the professionals’ manual discovery of brain tumors from MRIs and CT checks is time-consuming and inclined to human blunder. Machine learning approaches can reduce the required time to detect brain tumors and produce a more accurate result than the manual detection process. Our proposed system will help doctors and patients detect brain tumors from multimodal images and take the necessary steps to help the patient recover quickly. In this study, the Image Fusion technique has been used to image preprocessing, making the feature extraction more accessible and less time-consuming. Further, U-Net architecture has been used for image segmentation. Finally, U-Net, ResNet50, and CNN have been used for image classification. In this case, ResNEt50 gave the highest accuracy at 98.96%. Therefore, the proposed system can be utilized as a decision-making tool to identify brain tumors. Furthermore, the proposed approach can help remote triaging patients with brain cancer, minimizing hospital workload. This research will present a common platform for both doctors and patients in identifying brain tumors in the future. One of the drawbacks of this research is that the system is proposed based on a public dataset, as due to the pandemic, it is quite impossible to collect real-time data. However, it has been planned to train the models using real-time data in the future. This approach will provide significant clinical assistance and aid in the reduction of brain cancer mortality rates.
Acknowledgement: The authors would like to thank the Deanship of Scientific Research, Taif University Researchers Supporting Project number (TURSP-2020/348), Taif University, Taif, Saudi Arabia for supporting this research work.
Funding Statement: This study was funded by the Deanship of Scientific Research, Taif University Researchers Supporting Project number (TURSP-2020/348), Taif University, Taif, Saudi Arabia.
Conflicts of Interest: The authors declare that they have no conflicts of interest to report regarding the present study.
1. German Neuroscience Center, “Brain tumor–one of the most dangerous neurological diseases,” German Neuroscience Center, 2021. [Online]. Available: https://www.gncdubai.com/brain-tumor-one-dangerous-neurological-diseases/. [Google Scholar]
2. K. D. Miller, Q. Ostrom, C. Kruchko, N. Patil, T. Tihan et al., “Brain and other central nervous system tumor statistics,” CA: A Cancer Journal For Clinicians vol. 71, no. 5, pp. 381–406, 2021. [Google Scholar]
3. J. Amin, M. Sharif, M. Raza, T. Saba and M. A. Anjum, “Brain tumor detection using statistical and machine learning method,” Computer Methods and Programs in Biomedicine, vol. 177, no. 3, pp. 69–79, 2019. [Google Scholar]
4. M. S. Pavel, S. Chakrabarty and J. Gow, “Cost of illness for outpatients attending public and private hospitals in Bangladesh,” International Journal for Equity in Health, vol. 15, no. 1, pp. 167, 2016. [Google Scholar]
5. A. J. Riascos and N. Serna, “Machine learning based program to prevent hospitalizations and reduce costs in the Colombian statutory health care system,” International Journal of Knowledge Discovery in Bioinformatics, vol. 8, no. 2, pp. 44–64, 2020. [Google Scholar]
6. I. Ibrahim and A. Abdulazeez, “The role of machine learning algorithms for diagnosing diseases,” Journal of Application Science and Technology Trends, vol. 2, no. 1, pp. 10–19, 2021. [Google Scholar]
7. R. Bhardwaj, A. R. Nambiar and D. Dutta, “A study of machine learning in healthcare,” Annual Computer Software and Applications Conference (COMPSAC), vol. 2, pp. 236–241, 2017. [Google Scholar]
8. D. T. V. Kumar, “Classification of brain cancer type using machine learning,” Journal of Artificial Intelligence Capsule Networks, vol. 2019, no. 2, pp. 105–113, 2019. [Google Scholar]
9. A. Sawant, M. Bhandari, R. Yadav, R. Yele and S. Bendale, “Brain cancer detection from MRI: A machine learning approach (tensorflow),” International Research Journal of Engineering and Technology, vol. 5, pp. 2395–0072, 2018. [Google Scholar]
10. S. A. Abdelaziz Ismael, A. Mohammed and H. Hefny, “An enhanced deep learning approach for brain cancer MRI images classification using residual networks,” Artificial Intelligence in Medicine, vol. 102, pp. 101779, 2020. [Google Scholar]
11. M. Siar and M. Teshnehlab, “Brain tumor detection using deep neural network and machine learning algorithm,” in 9th Int. Conf. on Computer and Knowledge Engineering(ICCKE), Mashhad, Iran, pp. 363–368, 2019. [Google Scholar]
12. A. M. Alqudah, H. Alquraan, I. A. Qasmieh, A. Alqudah and W. Al-Sharu, “Brain tumor classification using deep learning technique—A comparison between cropped, uncropped, and segmented lesion images with different sizes,” International Journal of Advance Trends in Computer Science and Engineering, vol. 8, no. 6, pp. 3684–3691, 2020. [Google Scholar]
13. P. Kumar Mallick, S. H. Ryu, S. K. Satapathy, S. Mishra, G. N. Nguyen et al., “Brain MRI image classification for cancer detection using deep wavelet autoencoder-based deep neural network,” IEEE Access, vol. 7, pp. 46278–46287, 2019. [Google Scholar]
14. T. Saba, A. Sameh Mohamed, M. El-Affendi, J. Amin and M. Sharif, “Brain tumor detection using fusion of hand crafted and deep learning features,” Cognitive Systems Research, vol. 59, no. 1, pp. 221–230, 2020. [Google Scholar]
15. M. A. Khan, I. Ashraf, M. Alhaisoni, R. Damasevicius, R. Scherer et al., “Multimodal brain tumor classification using deep learning and robust feature selection: A machine learning application for radiologists,” Diagnostics, vol. 10, no. 8, pp. 1–19, 2020. [Google Scholar]
16. V. Panca and Z. Rustam, “Application of machine learning on brain cancer multiclass classification,” AIP Conference Proceedings, vol. 1862, no. 1, pp. 030133, 2017. [Google Scholar]
17. L. Brunese, F. Mercaldo, A. Reginelli and A. Santone, “An ensemble learning approach for brain cancer detection exploiting radiomic features,” Computer Methods and Programs in Biomedicine, vol. 185, no. 9, pp. 105134, 2020. [Google Scholar]
18. A. Ari and D. Hanbay, “Deep learning based brain tumor classification and detection system,” Turkish Journal of Electrical Engineering & Computer Science, vol. 26, no. 5, pp. 2275–2286, 2018. [Google Scholar]
19. A. Kulkarni, D. Chong and F. A. Batarseh, “Foundations of data imbalance and solutions for a data democracy,” in Data Democracy, In: F. A. Batarseh, R. Yang (Eds.Cambridge: Academic Press, pp. 83–106, 2020. [Google Scholar]
20. A. Bhandari, “AUC-ROC curve in machine learning clearly explained,” Analytics Vidhya, 2020. [Online]. Available: https://www.analyticsvidhya.com/blog/2020/06/auc-roc-curve-machine-learning. [Google Scholar]
 | This work is licensed under a Creative Commons Attribution 4.0 International License, which permits unrestricted use, distribution, and reproduction in any medium, provided the original work is properly cited. |