DOI:10.32604/cmc.2022.026619
| Computers, Materials & Continua DOI:10.32604/cmc.2022.026619 | |
| Article |
Improving Method of Anomaly Detection Performance for Industrial IoT Environment
1Department of Information Security Engineering, Gachon University, Seongnam, 13120, Korea
2Police Science Institute, Korea National Police University, Asan, 31539, Korea
3SysCore Lab., Sejong University, Seoul, 05006, Korea
4Department of Computer Engineering, Gachon University, Seongnam, 13120, Korea
*Corresponding Author: Jung Taek Seo. Email: seojt@gachon.ac.kr
Received: 31 December 2021; Accepted: 02 March 2022
Abstract: Industrial Control System (ICS), which is based on Industrial IoT (IIoT), has an intelligent mobile environment that supports various mobility, but there is a limit to relying only on the physical security of the ICS environment. Due to various threat factors that can disrupt the workflow of the IIoT, machine learning-based anomaly detection technologies are being presented; it is also essential to study for increasing detection performance to minimize model errors for promoting stable ICS operation. In this paper, we established the requirements for improving the anomaly detection performance in the IIoT-based ICS environment by analyzing the related cases. After that, we presented an improving method of the performance of a machine learning model specialized for IIoT-based ICS, which increases the detection rate by applying correlation coefficients and clustering; it provides a mechanism to predict thresholds on a per-sequence. Likewise, we adopted the HAI dataset environment that actively reflected the characteristics of IIoT-based ICS and demonstrated that performance could be improved through comparative experiments with the traditional method and our proposed method. The presented method can further improve the performance of commonly applied error-based detection techniques and includes a primary method that can be enhanced over existing detection techniques by analyzing correlation coefficients between features to consider feedback between ICS components. Those can contribute to improving the performance of several detection models applied in ICS and other areas.
Keywords: Industrial IoT; industrial control system; anomaly detection; clustering algorithm; correlation coefficient
Modern IIoT Environment is based on ICS; as IT technology convergence, services become more affluent and provide more advanced innovative mobility services [1]. On the other hand, various IT technologies based on IIoT stand out contrasting characteristics by exposing different attack points that weaken the physical security of the existing ICS. For example, malware such as Stuxnet and BlackEnergy conducted advanced persistent attacks (APT), causing accidents that exceeded the security level of the isolated network environment of ICS, which was previously recognized as safe [2,3], and such Accidents are significant events that have changed public perception. In particular, the primary contact point of the attack exploited by each malware was industrial software grafted with IT technology, which is a new attack point that cannot be seen in existing ICS [3]. Due to these environmental changes, there is a positive meaning that a lot of research money and time is invested in researching intelligent security technologies such as key management and threat identification as well as platform security for IIoT [1,4,5], for ICS based on such mobility environment, relevant security research is now unavoidable for proper computing. Among such studies, technologies for detecting anomalies in ICS are advanced security technologies that IT technologies have combined with the development of computing technologies, but the ICS environment faces another problem that requires continuous availability [6]. Each device forms one process in the ICS environment by creating a feedback relationship by various commands that can maintain the process. Still, if the wrong command is injected, both availability and function can be seriously violated [7]. Essentially, to minimize infringement, it is essential to study technical performance to prevent accidents by reducing false positives and false positives by using technical methods that can increase the performance of anomaly detection models. Therefore, in this paper, to consider the operational and environmental characteristics of IIoT-based ICS, the HAI dataset that captures time-series data and driving data through sophisticated and complex actions between 4 testbeds was utilized [8]. To improve the performance of the detection model specialized for IIoT-based ICS, we propose a method to improve the detection rate by applying the correlation coefficient between clustering and feature to the error value predicted by the model.
The presented method is expected to contribute as follows:
• To consider the feedback behavior between ICS components, it includes a primary method that can be improved over existing detection techniques by analyzing correlation coefficients between features.
• By learning the Long Short-Term Memory (LSTM) neural network by reflecting the characteristics of the time-series data, applying the clustering technique to the value predicted by the model, which can detect the error by amplifying the error value and improve the performance.
• By combining methods, to generate expected thresholds for each sequence, the performance of commonly applied error-based detection techniques can be further enhanced.
2 Related Works and Establishment Requirements for Performance Improvement
As parallel computing power has rapidly increased, anomaly detection technology that requires many resources has begun to attract attention. The ICT field is used to identify cases different from typical situations, such as malware behavior and fault behavior [9,10]. There are supervised, unsupervised, and semi-supervised mechanisms in machine learning methods that are widely known so far. In particular, the supervised learning method provides a separate label, so it is easy to build the requirements for the model to discriminate effectively, and it has been adopted in many studies [10–12]. However, it maintains a long cycle and operates for an extended period without interruption in actual ICS; the training data ratio is unbalanced due to the low frequency of abnormal data occurring during operation [13,14]. There are clear limitations that increase the risk of overfitting and reduce the detection performance of the model [14]. Ultimately, to improve the model’s performance in the ICS environment, it is necessary to set the prerequisites for performing unsupervised or semi-supervised learning. In addition, anomaly detection can be approached in various ways depending on the data type. The anomaly detection data set applied in the existing anomaly detection research case based on the ICT environment has a sequential form and the test case does not follow the typical behavior pattern and main goal is to find data that do not exist [14]. However, in the ICS environment, the physical process has data in which the physical process is complicatedly intertwined according to the driving cycle or workflow, and the data has a contextual form in which the data changes according to the relationship between time and the workflow performed in the preceding time [15]. In essence, the sequential shape-based anomaly detection technique applied in the existing ICT environment has limitations in detecting contextual anomaly appearing in the ICS environment, and to compensate for the limitations, temporal characteristics such as workflows can be effectively reflected. It is necessary to select a model with an existing model to improve detection performance. In this regard, RNNs are available to model types, but RNNs are effective on short sequences and have limitations in that gradients are lost when learning long sequences. Long Short-Term Memory (LSTM) and Gated Recurrent Units (GRU)s have been proposed. As a related example, Trinh et al. [16] introduced the concept of reconstruction error in LSTM. They presented a method to identify abnormal events by learning in a semi-supervised method based on mobile traffic generated in a next-generation cellular (5G) network environment. LSTM was utilized to effectively identify error values when one or more point anomalies were included. This allowed us to successfully detect irregular patterns that may appear in contextual anomalies to mobile traffic.
Moreover, data observed in the ICS environment consists of time-series data according to the workflow, unlike ICT. This is because, in addition to the contextual types represented by time-series data, there are also dissimilarity patterns such as data points or sequence points deviating from the norm and collective anomaly that gradually differs from normal data over time [16,17], so dissimilarity patterns exist. Technologies with the types that can detect them must go hand in hand. A typical approach is to cluster predictive data to detect dissimilarity patterns. As a related example, Maamar et al. [17] presented various power patterns that can occur in the Advanced Metering Infrastructure (AMI) system. Although the temporal characteristics are not reflected, it is challenging to provide labeling information because the patterns are flexible according to the usage trend of users. However, using only normal behavior data, we clustered the power consumption patterns based on the K-means algorithm and were able to successfully identify the types of abnormal power patterns that deviate from the standard points [18,19]. A clustering-based anomaly detection method like this example means that it can detect dissimilarity patterns in a limited environment with very little labeling data, such as an ICS environment, leading to improved performance.
When considering the operational aspects of ICS, it is complicated to generate an accurate model because it is not easy to guarantee availability if a process is stopped due to a false positive [1]. To solve this problem, it is inevitable to increase the detection performance while minimizing the amount of computation for predicting the model’s results. However, solving the availability problem of ICS with numerical optimization, the algorithm on which the model is based, is a big challenge. Therefore, the feature selection technique can be considered a method to minimize the performance calculation. Feature Selection is a method that individually selects features with high learning efficiency without adjusting variables such as hyper-parameters and parameters. For example, Cai et al. [19] suggested feature selection methods based on information measurement considering relevance and redundancy rather than learning using all features when using the data set trained by the model for detection. Chandrashekar et al. [20] experimented with anomaly detection using many features through 3 machine learning algorithms; they derived that it is not always excellent in model performance and not always good when correlation analysis of features through feature selection and model performance improvement. These cases prove that the improved performance was measured more than that of the experimental group that did not.
2.2 Establishment of Requirements for Performance Improvement of ICS Anomaly Detection
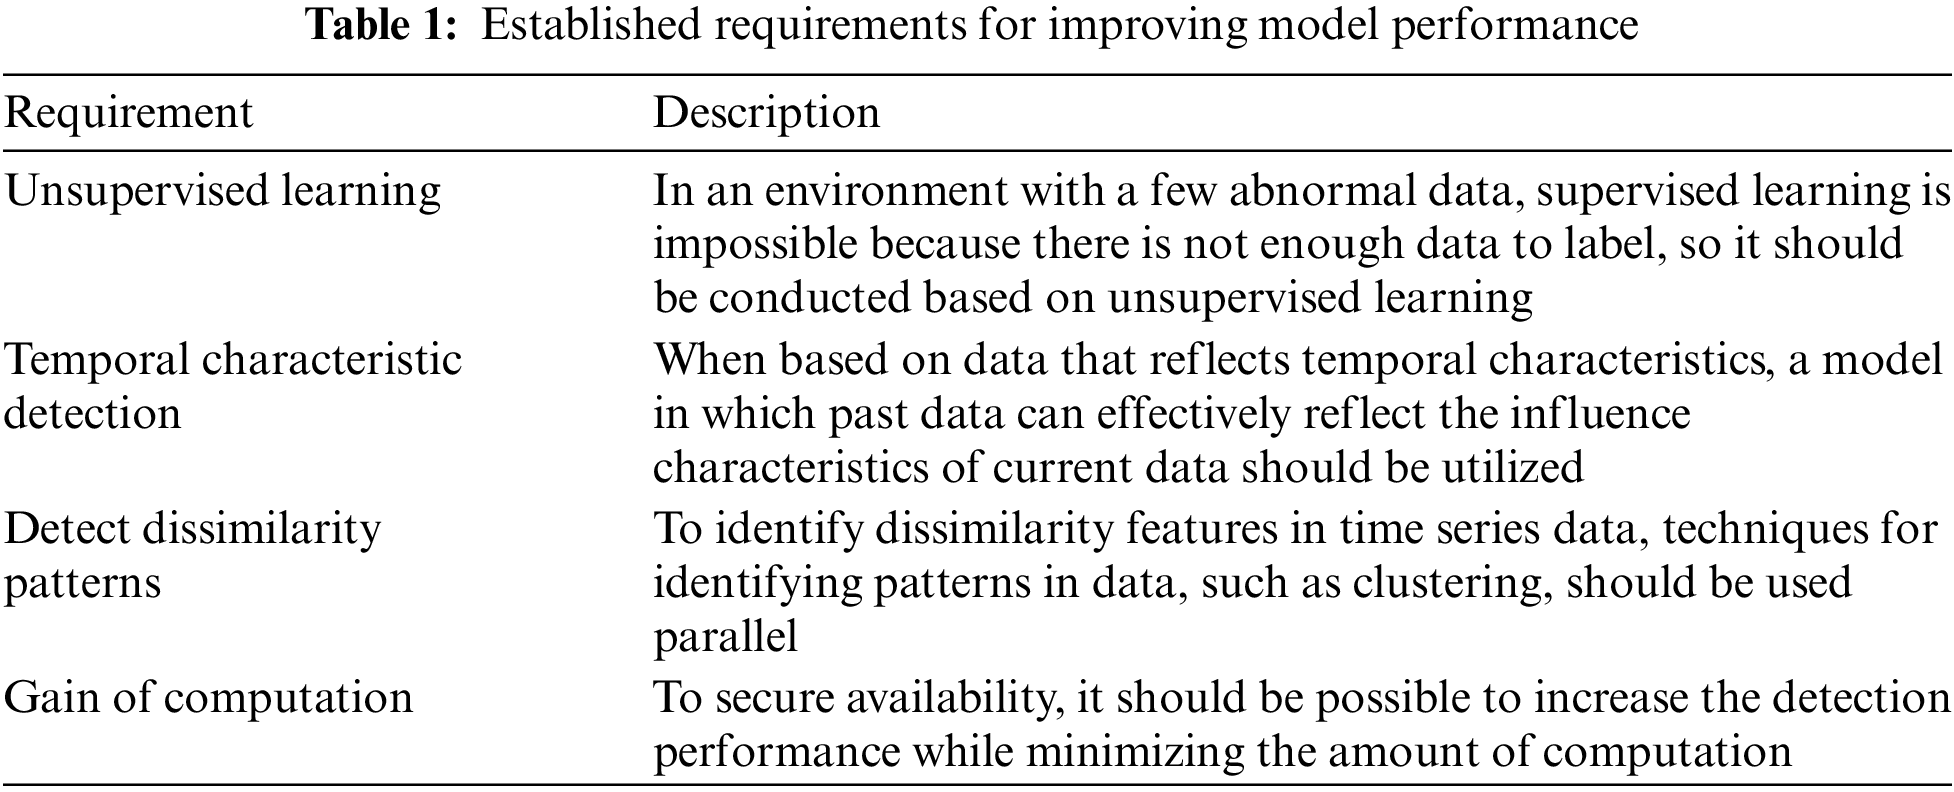
Through Session 2.1, we investigated the learning methods, data types and characteristics, and limitations of detecting dissimilarity patterns from an ICS perspective and explained the need to supplement the limitations from existing research cases. In addition, the requirements for improving the performance of the ICS anomaly detection model were established based on previous research cases related to the requirements. We conducted a performance improvement study that can satisfy the requirements shown in Tab. 1, and the detailed mechanism of the proposed performance improvement technique was described in Session 4. The additional description of the requirements for performance improvement we have established is as follows: First, in IIoT-based ICS environments, it is common to have little abnormal data; supervised learning is challenging because there is not enough data to label. To improve functional performance, it must be performed based on unsupervised learning. Second, because workflow feedback has a constant sequence cycle, detecting only a single point is not effective in detecting abnormal behaviors that may appear at a future point, so it should reflect Temporal characteristics. Third, even if the scalar data observed by the ICS component is in the normal range, it may be abnormal behavior depending on the periodic features. The model must detect similar patterns that may appear at a specific time. In addition, efforts should be taken to minimize computational volume, such as algorithm improvement, to minimize availability infringement. These requirements are like those used in the existing IT field but differ in additional considerations regarding workflow-based systems and availability in ICS. Time-series characteristics should be considered as in previous research cases.
3 Dataset Selection Considering the ICS Environment
We selected the HAI dataset reflecting the environmental and temporal characteristics of ICS [8,21]. The HAI dataset is a dataset captured in a complex process system environment that combines three testbed systems: a turbine testbed from GE, a boiler testbed from Emerson, a modular production system (MPS) from FESTO, and a water treatment testbed; the dataset provided the features of characteristics of testbed operation that configured a boiler process (P1), turbine process (P2), water treatment process (P3), and HIL simulation (P4) [8]. The HAI dataset was first released in February 2020; it has been officially distributed up to version 21.03 through ongoing updates and includes ICS operation data under normal and abnormal conditions. In South Korea, HAICon 2021 event was held to compete for ICS anomaly detection performance [8]. In this event, individual and public scores will be ranked using an evaluation formula called Time-Series Precision and Recall (TaPR) [22]. This evaluation formula is a technology that can evaluate how well the anomalies are judged in sequence data and can be effectively evaluated in sequence data environments such as HAI datasets. This competition was 0.68455 based on the individual’s highest score, which required a significant level of detection of anomalies that could occur in ICS. The datasets used in the event are more anomalous than the HAI 21.03 version, and event participants also scored less F1-score than 0.8, and the main function of the baseline code provided in the event is to detect anomalies by setting thresholds, a traditional method used in the ICS field. This dataset has not been officially distributed, and we named it “HAI 21.04”, which was revealed to a limited extent at the competition. This dataset consists of 86 functions for work data monitored by each device constituting the processing system. The other consists of timestamp values observed in the SCADA process system, including scalar values. Especially, timestamp data has elements that indicate that it is time-series data and can ultimately be utilized to reflect temporal characteristics, contains training data, and validation data. Training data was constantly captured in 1-second increments from 2021-07-11 10:00:00 to 2021-08-09 09:00:00, with a total of 1,004,402 pieces. The training data does not provide a separate label to indicate an attack point. This reflects the operational characteristics of the control system, the frequency of abnormal symptoms occurring in the existing control system is very low [11]. This reflects the inherent limitations in the control system environment, so the attack point label is not provided in the training data but the validation data used for hyper-parameter tuning of the model. The validation data consists of 86,400 pieces and has the same features as the training data. This data can be used to validate and tune the model’s performance. We created a time window to perform data training on the model and performed the process of creating train and label data, respectively. For time-series data such as HAI data to create a time window, each sequence is divided by second intervals, the second is train data to predict the next time, and the second is the data that appears after a certain second and label data is given as shown in Fig. 1.
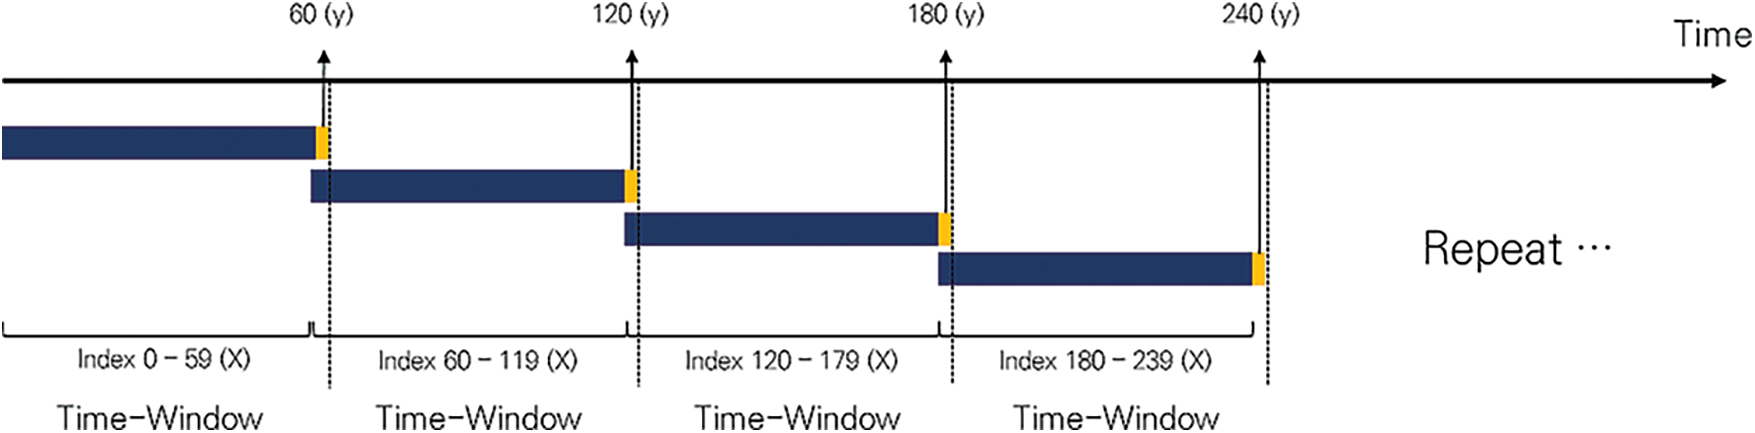
Figure 1: Sequence data generation process using N-gram technique
For example, the training data for 1-89, 2-90, 3-91,… seconds (X) label the data for the following points 90 seconds, 91 seconds, 92 seconds, …, respectively (y). This process can give label data to data that have not previously been given a different correct answer and can implement semi-supervised learning that can predict data for the next time window. This technique is often applied when processing natural language and is called the N-gram technique [23]. Here, when natural language data is decomposed into word units, the shape of the sequence equals the time series data. It is a representative technology that can be converted into learnable data and is necessary to detect content-based attacks such as malformed data injection attacks, but the identification of sequence-based attacks has wide applications when monitoring packet sequences [23]. An example of using the train and label data generated based on the above method is covered in Session 5.
4 The Proposed Methodology to Improve the Performance of the Detection Model
This session covered the basic concepts of correlation coefficient and clustering techniques used to improve performance in an IIoT-based ICS environment. In addition, the feature selection method based on the correlation coefficient was explained, and the optimal feature set was presented by applying it to the HAI dataset described in Session 3. It also describes the clustering technique due to the predicted values of the trained model.
4.1 The Correlation Coefficient-Based Feature Selection Technique for Optimal Learning
The correlation coefficient is a statistical value that can quantitatively express how well a linear relationship between discrete values of data is formed. The most generalized way to calculate the correlation coefficient is the Pearson Correlation Coefficient (PCC) [20]. The Pearson correlation coefficient is calculated as a value from +1 to −1 according to the Cauchy-Schwarz inequality when there are two variables,
If PCC is calculated, the linear relationship between features can be quantitatively estimated according to the correlation coefficient, and the PCC coefficient is determined by the following Eq. (1):
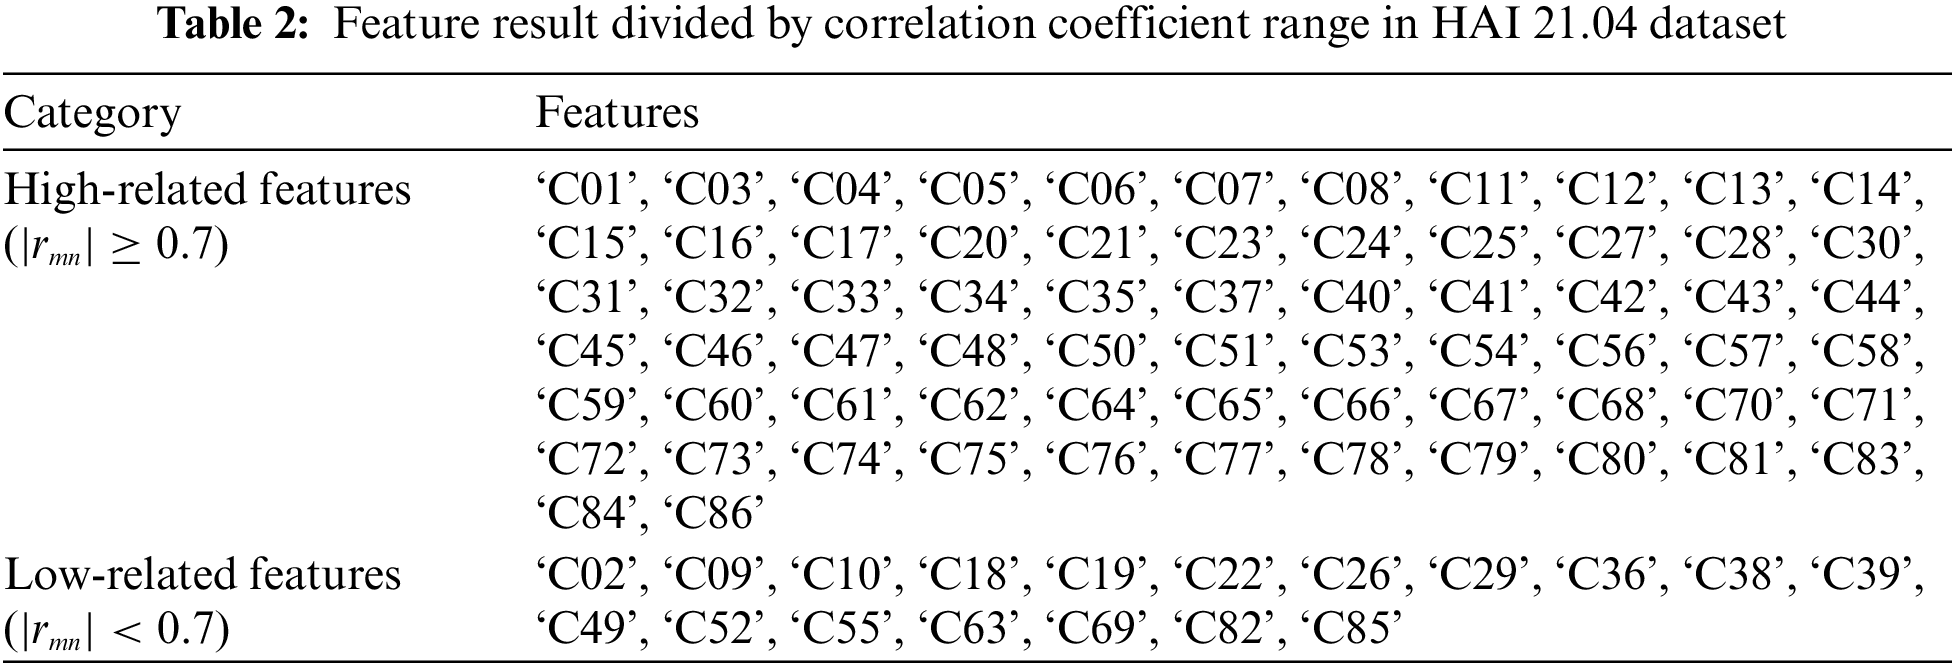
Previously, Shin et al. [21] suggested improving the model’s performance compared to the previous one by removing unnecessary features that do not have a linear relationship in the learning process based on PCC. Accordingly, we measured how the 86 features excluding timestamps have a linear relationship from the training data of the HAI 21.04 dataset using PCC. The measurement result is as shown in Fig. 2. The lighter the color, the stronger the positive linear relationship of features, and the darker the color, the stronger the negative linear relationship between the feature and feature.

Figure 2: PCC result of HAI 21.04 dataset
Among them, we focused on features with relatively strong correlations. From a statistical point of view, the relative criterion of having a relatively strong correlation in PCC theory is not individually defined. However, according to Bruce (2009), for a correlation coefficient with PCC between 0.7–1.0 or –0.7–1.0, a general guideline for interpreting the existence of a relatively strong linear or linear relationship between two variables is presented [24]. Therefore, we measured the feature relationship that exceeds the absolute value of 0.7, assuming that the PCC coefficient between feature
4.2 Clustering Algorithm for Relative Threshold Implementation and Error Value Amplification
Since the anomaly detection model used in the fish system environment is based on unsupervised learning, only data in a normal state can be learned. The most used method for these models to detect anomalies is to set an optimal threshold by calculating the error between the predicted value of the training data to be predicted and the validation data value based on the previously learned normal data. There is a way. As shown in Fig. 3, statistical aspects of operation with operation cycle can be observed from each feature data kept in the control system environment, and the process characteristics of the control system are actively reflected. Suppose this is predicted from the model point of view when arbitrary driving data is input. In that case, the prediction value will be predicted considering the driving cycle of the control system learned by the model in advance. Then, when there is a predicted value that the Prediction value deviates from a certain standard, it is out of the normal driving cycle. It can be determined that such data is an anomaly. In this case, to set a predetermined criterion, an optimal threshold with the highest performance may be searched for and used. However, the conventionally applied threshold setting method uses a method in which a single threshold is applied and used for all periods. Since the functional data changes according to the sequence and cycle in the control system environment, when a single threshold is used, there is a limit to encompassing all the ranges for discriminating abnormalities concerning the changing operational data. Therefore, we presented the concept of a “relative threshold” in which the criterion for judging anomalies considering the driving cycle for the value predicted by the model can be changed according to the process. Also, by amplifying the error for the result predicted by the detection model, the error range between the abnormal data and the normal data is widened, and a method to improve the prediction performance is proposed. A clustering algorithm was used to suggest two methods.

Figure 3: Visualization result of observation data of HAI 21.04 dataset
Clustering refers to the process of dividing objects into groups given arbitrary data, a data group can be defined considering the characteristics of the data, and the data is clustered based on the central point of each data. Clustering can be a group of data with similar characteristics, called a cluster. If the characteristics of some data are different from the cluster, it will belong to another cluster, and the most representative clustering method is the point assignment clustering process, which selects a central point for each cluster and selects the points closest to the center. The procedure of moving the average point of the selected central point and moving the central point to the average point is repeated.
while selecting a point close to the central moving point again. That is, if a point that minimizes the maximum value of distances from each point in the cluster or a point that reduces the average of distances from each point is selected, the group belonging to each data is updated for data having a similar value, the same cluster index can be assigned. The K-means algorithm, which can effectively perform clustering, aims to minimize the cost function when the sum of the squares of the distance between the center of each group and the data in the group is the cost function [17,18]. If not, it equals the optimal number of clustering, the point at which the slope of the tangent line becomes decrease is the most optimal number of clustering and is commonly referred to as the Elbow technique.
Next, we focused on the purpose for which the validation data set is utilized; the validation dataset is required for administrators to improve the performance of their models. At this time, the verification dataset refers to a data sample used when fine-tuning the hyper-parameter of the model and provides an evaluation index. If the model detects anomalies based on the error value, the error value is calculated using the verification data, and the process of finding the optimal threshold for detecting the anomaly is performed. The error between the value predicted by the model and the label data is calculated through the validation data, the process of turning to the best threshold can be performed using the data sample that provides the evaluation index. Let
After that, for each element of the set of error values, one cluster label X from 0 to n can be assigned to the error values based on the clustering algorithm such as K-means. To calculate each weight of each cluster label
For the previously calculated error value
A method of calculating a threshold set for each clustered index is proposed to generate a relative threshold. Previously, an abnormality was determined by setting a single threshold; we describe the process of creating a relative threshold in which the threshold changes by adding the relative ratio for each clustered index to the single threshold. Let
If the average value of a clustered index has a value smaller than
On the other hand, outliers that deviate from the normal value could be included when calculating the error value, significantly affecting the cluster label’s average value. There are dissimilarity patterns, such as sequence points that differ from the normal, which prevent the model from learning the data effectively. To minimize the disturbance factors, a rolling technique based on a moving average such as a Simple Moving Average (SMA) can be additionally applied; these techniques help close the data gap [11].
To summarize, the improvement method presented in this session is characteristic that a threshold can be assigned to each section based on the average value. Compared to using the existing single threshold, the model can flexibly place a reference point for detecting anomalies by giving multiple thresholds instead of using a single threshold for each section. In addition, a method for amplifying the error value by assigning weights to each cluster label is also proposed to improve the environment in which a relative threshold can be assigned. Based on the proposed performance improvement method, we tested whether the performance of the detection model was improved, and the results are described in Session 6.
4.3 Establishment of Performance Improvement Method by Combining Correlation Coefficient and Clustering Method
we described how the performance improvement techniques presented in Sessions 4.1 and 4.2 could be combined to improve the performance of models in detecting anomalies, and the summarized process is shown in Fig. 4.

Figure 4: Methods for improving detection rates based on correlation coefficients and clustering
We hypothesized a requirement to improve performance through Session 2, and we first considered the progression through which the model learns data and improves its performance. In general, there is a preprocessing process that creates data for learning the model, a training process that trains the data into the model, and a validation process that adjusts the hyper-parameter values of the model. In preprocessing, the data required for learning is selected and converted into a scalar value to make a learnable form. At this time, like the methodology proposed in Session 4.1, we measure the feature correlation coefficient and prepare a way to improve performance in the preprocessing process by using the method to generate a set between highly correlated features. Next, hyper-parameter tuning is performed in the validation process based on the model predicted results, this induces the model to operate correctly by adjusting the scope for detecting anomaly data. Here, we used the K-means algorithm that can cluster the driving characteristics appearing from the validation data together with a method to actively adjust the hyper-parameter called threshold using the method proposed in Session 4.2 and the error predicted by the model. By relatively amplifying the values by clustering index, the amplification value is reflected in the error value to help improve the detection rate. The performance improvement experiments and results analysis are discussed in Session 5.
5 Performance Improvement Experiment and Result Analysis
To test the performance of the model, we benchmarked it in the following experimental environment: CPU - Intel Xeon Silver 4216 2.10 GHz two slots, RAM - 64 GB, GPU - Tesla V100S 32 GB. Also, according to the data generation method mentioned in Session 3 for the HAI 21.04 dataset, train data and label data were generated based on the time window. In addition, based on the train data, an Exponential Weighted Moving Average (EWMA) for noise attenuation was substituted, and data normalization was performed. We constructed three experimental conditions to effectively compare the performance improvement, which is as follows: The common experimental condition was to calculate the error value between the model predicted value and the validation value and applied a simple moving average (SMA) through rolling. In addition, we utilized the N-gram technique that generates data based on the time window at 1-second intervals. Since it is designed with data for predicting the next point, we built an LSTM neural network with three bidirectional cells to reflect the temporal characteristics effectively. The detailed structure of the network architecture is shown in Fig. 5

Figure 5: Architectural details of the model adopted in the experiment
We adopted the TaPR metric to evaluate the performance of the LSTM model more effectively [23]. TaPR can measure time series recognition precision and recall, suitable for evaluating anomaly detection methods in time series data. In time-series data, anomalies correspond to a series of instances, so traditional metrics overlook these characteristics and give high marks to methods that only detect long anomalies. Traditional evaluation indicators evaluate detection rates based on single data, not one instance. However, there is a limit to reflecting all these characteristics because the ICS environment has a constant sequence cycle, and its condition changes continuously. To overcome this problem, we consider the variability of anomalies detected through detection scores TaP (how many abnormalities were detected and sub-scoring), TaR (how accurately each anomaly was detected), considering the variability of the detected anomalies, and evaluating existing metrics using multiple examples, it also proved that the metric is more suitable for time series data compared to Performance was evaluated relative to the average (F1-Score) value [8,23].
The three experimental conditions for measuring performance are as follows. The first experiment is anomaly detection performance based on a single threshold, a traditional method used in ICS. The second experiment is the same as the first experimental environment, but anomaly detection performance measures when PCC-based characteristic selection is reflected. The third experiment measures anomaly detection performance when the K-means-based relative threshold is applied to the second condition. All experimental conditions aim to measure the highest performance while changing the threshold and derive the highest performance based on TaPR.
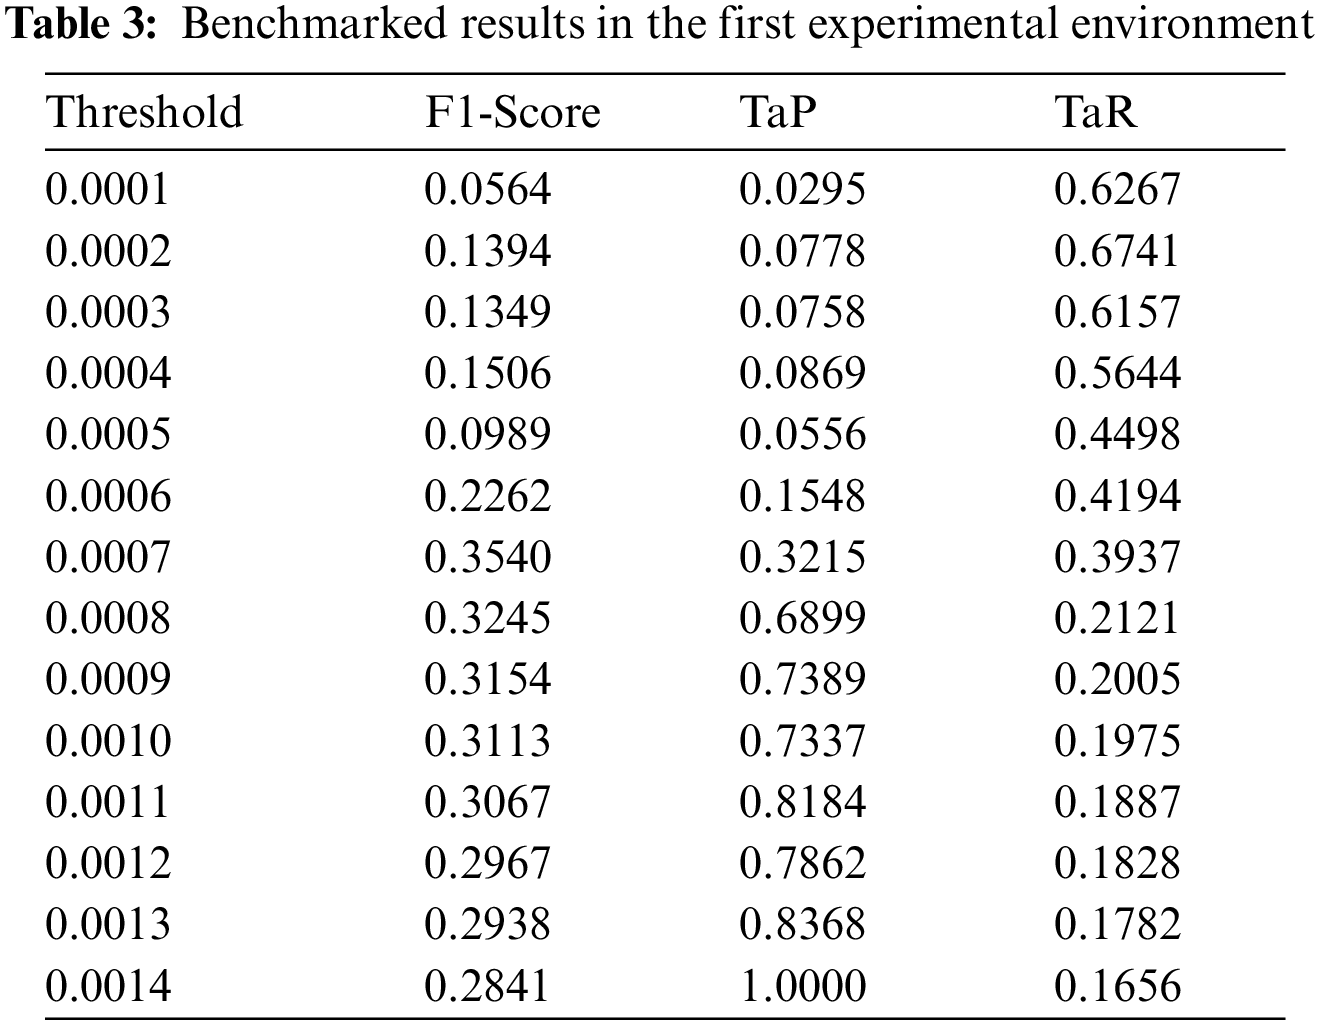
In the first experiment (experimental group), the model was trained using all the features of HAI 21.04, and the result with the highest F1-Score was measured using a single threshold based on the method mentioned in [17]. As shown in Fig. 6, the error value (blue), attack point (orange), and threshold (red) are shown. If the error value is greater than the threshold, it is the most common method of judging an abnormality. As a result of the experiment, it measured the best performance when the threshold was set to 0.015, and F1-Score 0.354 was recorded, see Tab. 3. This shows that the performance figure is low and needs improvement. The 7 attack points shown in the HAI 21.04 verification data have variable error values because the processing system contains complexly linked anomalous data. Low scores are obtained even in the actual performance evaluation. In addition, when using the single threshold used in the existing traditional method, many attack points that can cover a specific sequence point are missed.

Figure 6: The error graph in the first experimental environment and the threshold results in the best performance
In the second experiment (control group 1), based on the method proposed in Session 4.1, we experimented with improving model performance by applying correlation coefficient-based feature selection. Unlike the first experimental condition, we evaluated whether the performance improvement of the model was effective by adopting only the features corresponding to the high-related feature set in Tab. 2 without using all the features. As a result of the experiment, it measured the best performance when the threshold was set to 0.018, and F1-Score 0.548 was recorded, see Tab. 4. It shows that compared to the experimental group, there is a performance improvement of about 54% compared to the existing one. As shown in Fig. 7, unlike the first experiment, the error value at about 27,000–30,000 points was significantly improved, and thus the TaP level was improved. However, a number still needs performance improvement, many areas need to be improved, and the attack point is missing.
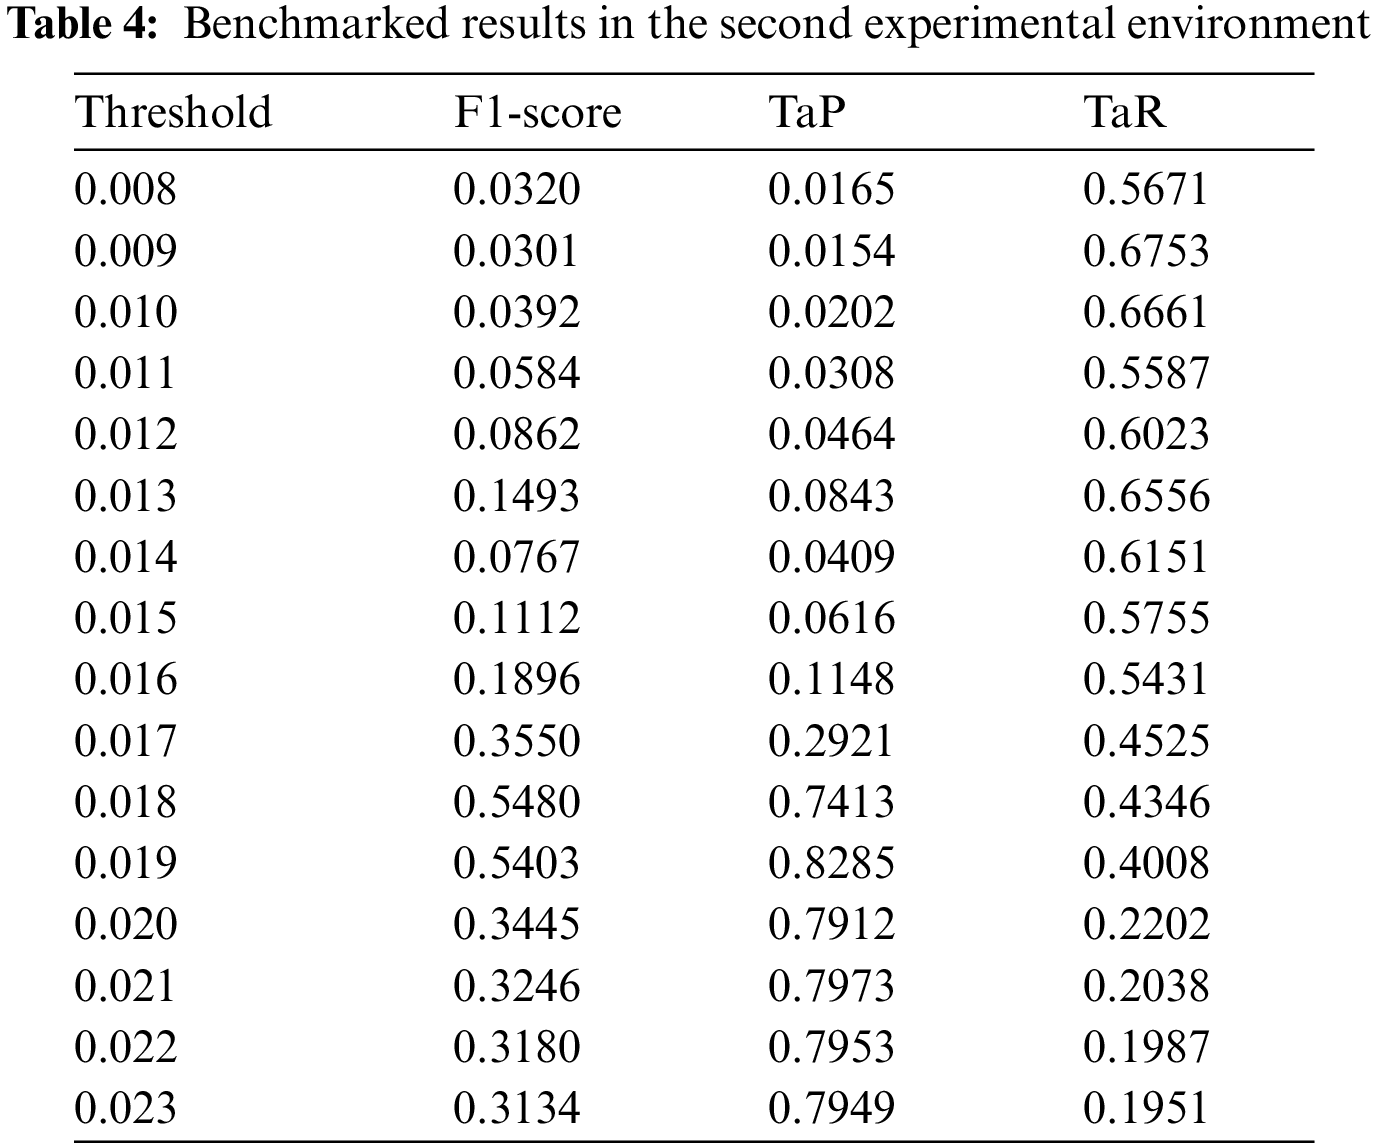

Figure 7: The error graph in the second experimental environment and the threshold results in the best performance
The third experiment (control group 2) conducted correlation coefficient and clustering-based model performance improvement experiments. The feature selection technique proposed in Session 4.1 and the technique presented in Session 4.2 were used in this experiment. Also, unlike the experimental group, a relative threshold was applied by dividing the error mean by clustering label. As shown in Eq. (5), the relative threshold can be adjusted by the
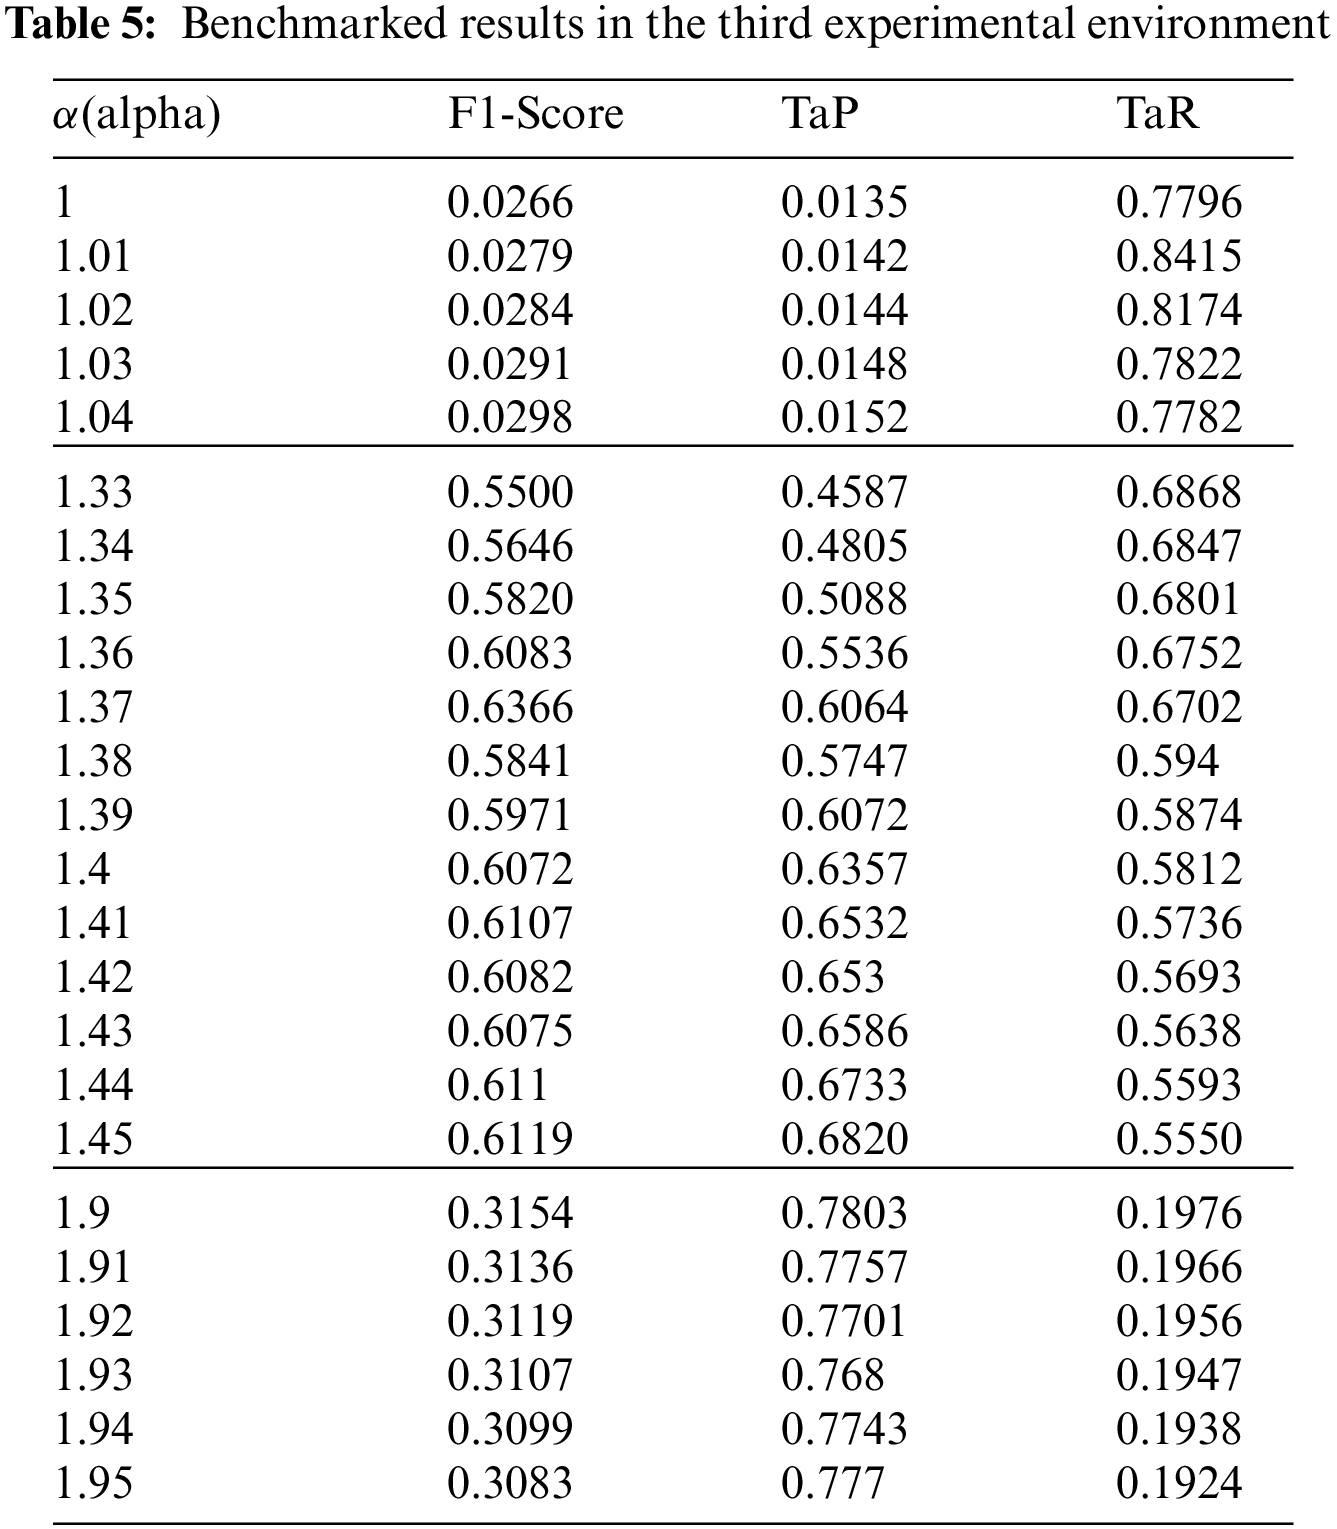

Figure 8: The error graph in the third experimental environment and the threshold results in the best performance
The results of performing the above experiment and analyzing the observations are as follows: This experiment was evaluated whether it can meet the requirements for performance improvement assumed in the related study: First, the first experiment, which is the baseline of the experiment, is the threshold value The general technical concept of detecting anomalies by setting the A limiting condition for using the model in ICS was defined in this experiment, and no separate training process was performed on abnormal data. Therefore, the requirement of “unsupervised learning” can be satisfied. Second, we adopted an RNN-like neural network called LSTM in the experimental environment. LSTM compensates for the shortcomings of the existing RNN and has the strength to preserve the characteristics of data existing in the past. This can efficiently learn time series characteristics, and the HAI dataset sets the conditions for using data with temporal characteristics reflected. Thus, it can meet the “Temporal characteristic detection” requirement. In addition, we proved that the model trained based on the feature set has higher performance when the second experimental result is compared to the first experimental result. This led to performance improvement without algorithm improvement and hyper-parameter tuning and could satisfy the requirement of “Gain of computation.” On the other hand, a performance improvement experiment was performed under the experimental condition in the third experiment. The second experimental condition and the K-means-based clustering algorithm were combined, and a procedure for clustering the error values predicted by the model was added. Giving the first experimental condition a cluster characteristic gives a threshold for each clustered index based on the error mean value, and a variable threshold can be built. In addition, error values are amplified to detect outlier data more effectively with ambiguous boundaries with normal data, and cluster characteristics are assigned to give weight to the amplified values. Under these experimental conditions, higher performance could be provided compared to the first and second experimental conditions, which met the “Detect dissimilarity patterns” requirement.
We demonstrated better performance compared to existing detection methods through the proposed correlation coefficient clustering-based performance improvement technique. In addition, we derived experimental results that could satisfy the 4 requirements for improving the performance of the ICS anomaly detection model derived in Session 2.2. In addition, by adopting an HAI dataset that does not reflect the attack label separately, very few attack points can occur in the control system environment to meet the reality of how well the actual model can detect. In a control system environment, abnormal data can have fatal consequences, so research is inevitable to improve the performance of models that can detect abnormalities, and a lot of efforts will be needed to continue. ICS is the foundation of IIoT, is essential to the industry. When there is a specific IIoT system, it is expected that if the workflow operates SCADA, it can contribute to the study of anomaly detection through our proposed method. Essentially, ICS’s top priority is to keep operations unchanged for a long time with a specific cycle and sequence, and proposed performance improvement measures to detect anomalies are expected to help minimize errors. In the future, we will study how to detect anomalies that can predict and consider time relationships and workflow-specific sequences by adding the performance improvement techniques presented in this paper. The methods proposed in the future will be continuously studied to effectively improve and reflect various conditions for applying existing methods.
Funding Statement: This work was supported by the National Research Foundation of Korea (NRF) grant funded by the Korea government (MSIT) (No. NRF-2020R1A2C1012187, 50%), the Nuclear Safety Research Program through the Korea Foundation of Nuclear Safety (KoFONS) using the financial resource granted by the Nuclear Safety and Security Commission (NSSC) of the Republic of Korea (No. 2101058, 25%), the Institute of Information & communications Technology Planning & Evaluation (IITP) grant funded by the Korea government (MSIT) (No. 2021-0-00493), 5G Massive Next Generation Cyber Attack Deception Technology Development, 25%).
Conflicts of Interest: The authors declare that they have no conflicts of interest to report regarding the present study.
1. A. Moradbeikie, K. Jamshidi, A. Bohlooli, J. Garcia and X. Masip-Bruin, “An IIoT based ICS to improve safety through fast and accurate hazard detection and differentiation,” IEEE Access, vol. 8, pp. 206942–206957, 2020. [Google Scholar]
2. A. N. Jahromi, H. Karimipour, A. Dehghantanha and K. K. R. Choo, “Toward detection and attribution of cyber-attacks in IoT-enabled cyber-physical systems,” IEEE Internet of Things Journal, vol. 8, no. 17, pp. 13712–13722, 2021. [Google Scholar]
3. A. Sajid, H. Abbas and K. Saleem, “Cloud-assisted IoT-based SCADA systems security: A review of the state of the art and future challenges,” IEEE Access, vol. 4, pp. 1375–1384, 2016. [Google Scholar]
4. A. Shahzad, Y. Kim and A. Elgamoudi, “Secure IoT platform for industrial control systems,” in 2017 Int. Conf. on Platform Technology and Service (PlatCon), Busan, Korea (Southpp. 1–6, 2017. [Google Scholar]
5. L. Dhirani, A. Eddie and N. Thomas, “Industrial IoT, cyber threats, and standards landscape: Evaluation and roadmap,” Sensors (SENSORS-BASEL), vol. 21, no. 11, pp. 3901, 2021. [Google Scholar]
6. S. Mubarak, M. H. Habaebi, M. R. Islam, F. D. A. Rahman and M. Tahir, “Anomaly detection in ICS datasets with machine learning algorithms,” Computer Systems Science and Engineering, vol. 37, no. 1, pp. 33–46, 2021. [Google Scholar]
7. S. K. Khaitan and J. D. McCalley, “Design techniques and applications of cyberphysical systems: A Survey,” IEEE Systems Journal, vol. 9, no. 2, pp. 350–365, 2015. [Google Scholar]
8. H. K. Shin, W. Lee, J. H. Yun and B. G. Min, “Two ICS security datasets and anomaly detection contest on the HIL-based augmented ICS testbed,” in Cyber Security Experimentation and Test Workshop (CSET ‘21), New York, NY, USA, pp. 36–40, 2021. [Google Scholar]
9. M. B. Umair, Z. Iqbal, M. Bilal, J. Nebhen, T. A. Almohamad et al., “An efficient internet traffic classification system using deep learning for IoT,” CMC-Computers, Materials & Continua, vol. 71, no. 1, pp. 407–422, 2022. [Google Scholar]
10. R. Vinayakumar, M. Alazab, K. P. Soman, P. Poornachandran, A. Al-Nemrat et al., “Deep learning approach for intelligent intrusion detection system,” IEEE Access, vol. 7, pp. 41525–41550, 2019. [Google Scholar]
11. R. Mitchell and I. R. Chen, “A survey of intrusion detection techniques for cyber-physical systems,” ACM Computing Surveys, vol. 46, no. 4, pp. 1–29, 2014. [Google Scholar]
12. W. Jia, R. M. Shukla and S. Sengupta, “Anomaly detection using supervised learning and multiple statistical methods,” in 2019 18th IEEE Int. Conf. On Machine Learning and Applications (ICMLA), Boca Raton, FL, USA, pp. 1291–1297, 2019. [Google Scholar]
13. S. Ghosh and S. Sampalli, “A survey of security in SCADA networks: Current issues and future challenges,” IEEE Access, vol. 7, pp. 135812–135831, 2019. [Google Scholar]
14. C. Hwang and T. Lee, “E-SFD: Explainable sensor fault detection in the ICS anomaly detection system,” IEEE Access, vol. 9, pp. 140470–140486, 2021. [Google Scholar]
15. K. Choi, J. Yi, C. Park and S. Yoon, “Deep learning for anomaly detection in time-series data: Review, analysis, and guidelines,” IEEE Access, vol. 9, pp. 120043–120065, 2021. [Google Scholar]
16. H. D. Trinh, E. Zeydan, L. Giupponi and P. Dini, “Detecting mobile traffic anomalies through physical control channel fingerprinting: A deep semi-supervised approach,” IEEE Access, vol. 7, pp. 152187–152201, 2019. [Google Scholar]
17. A. Maamar and K. Benahmed, “A hybrid model for anomalies detection in AMI system combining K-means clustering and deep neural network,” Computers, Materials & Continua, vol. 60, no. 1, pp. 15–39, 2019. [Google Scholar]
18. Y. Wang and J. Zhang, “An improved algorithm of K-means based on evolutionary computation,” Intelligent Automation & Soft Computing, vol. 26, no. 5, pp. 961–971, 2020. [Google Scholar]
19. J. Cai, J. Luo, S. Wang and S. Yang, “Feature selection in machine learning: A new perspective,” Neurocomputing, vol. 300, pp. 70–79, 2017. [Google Scholar]
20. G. Chandrashekar and F. Sahin, “A survey on feature selection methods,” Computers & Electrical Engineering, vol. 40, no. 1, pp. 16–28, 2014. [Google Scholar]
21. H. K. Shin, W. Lee, J. H. Yun and H. C. Kim, “HIL-based augmented ICS (HAI) security dataset,” 2021. [Online]. Available: https://github.com/icsdataset/hai. [Google Scholar]
22. W. S. Hwang, J. H. Yun, J. Kim and H. C. Kim, “Time-series aware precision and recall for anomaly detection: considering variety of detection result and addressing ambiguous labeling,” in Proc. of the 28th ACM Int. Conf. on Information and Knowledge Management (CIKM ‘19), New York, NY, USA, pp. 2241–2244, 2019. [Google Scholar]
23. F. Schuster, A. Paul and H. König, “Towards learning normality for anomaly detection in industrial control networks,” in 7th IFIP WG 6.6 Int. Conf. on Autonomous Infrastructure, Management, and Security: Emerging Management Mechanisms for the Future Internet, Munich, Germany, pp. 61–72, 2016. [Google Scholar]
24. R. Bruce, “The correlation coefficient: Its values range between +1/−1, or do they?,” Journal of Targeting Measurement and Analysis for Marketing, vol. 17, no. 10, pp. 139–142, 2009. [Google Scholar]
 | This work is licensed under a Creative Commons Attribution 4.0 International License, which permits unrestricted use, distribution, and reproduction in any medium, provided the original work is properly cited. |