DOI:10.32604/cmc.2022.026715
| Computers, Materials & Continua DOI:10.32604/cmc.2022.026715 | |
| Article |
Automated Artificial Intelligence Empowered Colorectal Cancer Detection and Classification Model
1Information Technology Department, Faculty of Computing and Information Technology, King Abdulaziz University, Jeddah, 21589, Saudi Arabia
2Centre of Artificial Intelligence for Precision Medicines, King Abdulaziz University, Jeddah, 21589, Saudi Arabia
3Mathematics Department, Faculty of Science, Al-Azhar University, Naser City, 11884, Cairo, Egypt
4Biochemistry Department, Faculty of Science, King Abdulaziz University, Jeddah, 21589, Saudi Arabia
*Corresponding Author: Mahmoud Ragab. Email: mragab@kau.edu.sa
Received: 03 January 2022; Accepted: 18 March 2022
Abstract: Colorectal cancer is one of the most commonly diagnosed cancers and it develops in the colon region of large intestine. The histopathologist generally investigates the colon biopsy at the time of colonoscopy or surgery. Early detection of colorectal cancer is helpful to maintain the concept of accumulating cancer cells. In medical practices, histopathological investigation of tissue specimens generally takes place in a conventional way, whereas automated tools that use Artificial Intelligence (AI) techniques can produce effective results in disease detection performance. In this background, the current study presents an Automated AI-empowered Colorectal Cancer Detection and Classification (AAI-CCDC) technique. The proposed AAI-CCDC technique focuses on the examination of histopathological images to diagnose colorectal cancer. Initially, AAI-CCDC technique performs pre-processing in three levels such as gray scale transformation, Median Filtering (MF)-based noise removal, and contrast improvement. In addition, Nadam optimizer with EfficientNet model is also utilized to produce meaningful feature vectors. Furthermore, Glowworm Swarm Optimization (GSO) with Stacked Gated Recurrent Unit (SGRU) model is used for the detection and classification of colorectal cancer. The proposed AAI-CCDC technique was experimentally validated using benchmark dataset and the experimental results established the supremacy of the proposed AAI-CCDC technique over conventional approaches.
Keywords: Colorectal cancer; medical data classification; noise removal; data classification; artificial intelligence; biomedical images; deep learning; optimizers
Cancer grading is a procedure that determines the extent of malignancy and it is a major criteria utilized in medical settings to plan the treatment and inform the patient about disease prognosis [1]. However, it is challenging to attain high accuracy in cancer grading process in pathology practice. At the time of diagnosis, the tumors exhibit high levels of heterogeneity since the cancerous cells are capable enough to produce different levels of angiogenesis, host inflammatory response, and tumor necrosis among other factors included in tumor growth [2]. Also, the spatial preparation of heterogeneous cell types is proved that it has an association with cancer grading [3]. Thus, both quantitative and qualitative analyses of distinct types of cancer cells can assist in tumor stratification which in turn helps in determining the most effective therapeutic options [4]. Genomic architecture and cancer-specific markers can be used to classify tumors and identify different types of cells within the tumor. However, this scenario requires extensive characterization, time and experimental validation of tumor cells to identify useful markers [5].
In Colorectal Cancer (CRC), the morphology of intestinal gland includes gland formation whereas architectural appearance is a primary criterion for cancer grading. Glands are significant histological structures in almost all organs of the body with a primary purpose to achieve i.e., to secret carbohydrates and proteins [6]. Human colon contains masses of glands in it. Intestinal gland originates in the epithelial layer that is composed of single sheet of columnar epithelium. This epithelium forms a tubular shaped finger which expands the internal surface of colon to baseline connecting tissues [7]. Intestinal glands are responsible for the absorption of nutrients and water, mucus secretion to protect the epithelium in hostile mechanical and chemical environments and provide a niche for epithelial cells to redevelop. Because of its hostile environments, epithelial layers are one of the fastest and continually redeveloping structures in human body. This rapid renewal process of the cells needs coordination among cell apoptosis, proliferation, and differentiation processes [8]. When there is a loss in integrity among these processes, in the regeneration of epithelial cells, colorectal cancer i.e., colorectal adenocarcinoma develops and it is one of the common types of cancer. It is challenging to segment the gland images manually. Automatic gland segmentation allows the extraction of quantitative features related to gland morphology in digitalized image of CRC tissues. The effective segmentation of glands paves the way towards increasing the accuracy of cancer grading and computer-enabled grading of CRC. However, effective segmentation of glands, to differentiate cancer grading, remains a challenging problem [9]. At present, medical imaging is an effective mechanism in the diagnosis of different diseases including the presence of solid tumors. Machine Learning (ML) device is used in medical image processing to resolve medical images and pattern recognition [10].
Bychkov et al. [11] combined recurrent and convolution structures to train a deep network and forecast the CRC result based on the images of tumour tissue samples. The novelty of this method is that it straightforwardly predicts the patient outcomes without intermediate tissue classification. Vorontsov et al. [12] estimated the agreement, efficiency, and the performance of Fully Convolutional Network (FCN) for liver lesion detection and segmentation during CT scan examination in patients with Colorectal Liver Metastases (CLM). This retrospective analysis examined an automated model in which the proposed FCN was tested, trained, and validated with 26, 115, and 15 contrast materials while the CT examination contained 105, 261, and 22 tumors respectively. In general, manual segmentation and tumor detection by a radiotherapist remain the standard reference. The implementation of fully automatic and user-corrected segmentation is compared with manual segmentation. The communication period of automatic, inter-user agreement and user-corrected segmentation have been evaluated earlier.
Zhou et al. [13] developed an approach in which global labels were utilized to attain Whole Slide Images (WSIs) after which localization and classification of carcinoma was done by integrating the features in distinct magnifications of WSI. The method was tested and trained by 1346 CRC WSI. Xu et al. [14] presented a Deep Learning (DL)-based model in CRC detection and segmentation using the images of digitalized H&E-stained histology slides. Based on the assumption that this method is an excellent performer on standard slides, the NN algorithm can be used further as an appropriate screening method that can save time of the pathologists in finding the tumor region. Also, their technique is recommended as an effective supporter of CRC diagnosis. Ito et al. [15] focused on using deep DL software and Convolutional Neural Network (CNN) to help in cT1b diagnoses. Recessed, Protruding, and flat lesions were investigated in this study. Caffe and AlexNet were employed for ML methods. Data Finetuning which increases the number of images, was implemented. Over-sampling was carried out for training image to avoid impartialities in image number and learning was conducted.
The current research work presents an Automated AI-empowered Colorectal Cancer Detection and Classification (AAI-CCDC) technique. Primarily, the proposed AAI-CCDC technique performs pre-processing in three levels namely, gray scale transformation, Median Filtering (MF)-based noise removal, and contrast improvement. In addition, Nadam optimizer with EfficientNet model is also utilized to produce meaningful feature vectors. Furthermore, Glowworm Swarm Optimization (GSO) with Stacked Gated Recurrent Unit (SGRU) model is used in the detection and classification of CRC. The proposed AAI-CCDC technique was validated for its performance using benchmark dataset and the results were assessed under different metrics.
2 Design of AAI-CCDC Technique
In current study, an effective AAI-CCDC technique is developed for the examination of histopathological images to diagnose CRC. The presented AAI-CCDC technique encompasses pre-processing, EfficientNet-based feature extraction, Nadam-based parameter tuning, SGRU-based classification, and GSO-based hyperparameter tuning. The usage of Nadam and GSO algorithms is for improving the detection and classification efficiency of CRC. Fig. 1 is the overall block diagram of the proposed AAI-CCDC technique.

Figure 1: Block diagram of AAI-CCDC technique
In this initial stage of AAI-CCDC technique, pre-processing of the image is executed in three levels namely, gray scale transformation, MF-based noise removal, and contrast improvement. At first, the color images are converted into grayscale form. Followed by, the noise is removed with the help of MF technique. This results in
where C implies the neighboring value. Thirdly, CLAHE model is used for contrast enhancement procedure.
2.2 Stage II: EfficientNet Based Feature Extraction
After image pre-processing, extraction of features is the next stage in which EfficientNet model is used [17]. The authors utilized EfficientNetB4 technique to Transfer Learning (TL) procedure and global_average_pooling2d layer to minimize the over fitting issues by decreasing the entire number of parameters. In the same way, an order of three inner dense layers with RELU activation function and dropout layer are additionally used. Overall, a 30% dropout rate is selected arbitrarily so as to avoid over-fitting. At last, one resultant dense layer has two resultant units against binary classification, and three resultant units for multi-class classification with softmax activation function which is for creating the presented automated detection method. Open source materials such as software and library materials are only used for the current study. In order to reproduce the outcomes, the reader utilizes Google Colab Notebook with the help of GPU runtime type. This software i2 is utilized at no costs, as it is offered by Google for research purposes. This software utilizes a Tesla K80 GPU of 12 GB. EfficientNet techniques were used for pre-training while scaled CNN technique was utilized in TL from image classification issues. ImageDataAugmentor is a custom image data generator to Keras that supports augmentation components.
The authors utilized three distinct important libraries for the technique presented in this study. These libraries contain EfficientNet, Albumentation, and ImageDataAugmentor modules. Accordingly, EfficientNet techniques are dependent upon easy and extremely-effective compound scaling techniques. This technique allows the scale up baseline ConvNet for some target resource constraint, but the model’s efficacy is continued and utilized in TL dataset. In general, EfficientNet technique attains a combination of superior accuracy and optimum efficacy on the present CNN’s namely MobileNetV2, ImageNet, AlexNet, and GoogleNet. No similar analysis is conducted so far utilizing EfficientNet to TL regarding COVID-19 classification to optimum updating of author skill. EfficientNet contains B0 to B7 techniques while everyone has distinct parameters in the range of 5.3 M to 66 M. The authors, in this study, utilized EfficentNetB4 which has 19 M parameter and it is an appropriate model which can be justified based on its resource and resolve.
2.3 Stage III: Nadam Optimizer
Nadam optimizer can be utilized as per the literature [18] to fine tune the hyperparameters of EfficientNet model. NAdam is more of Nesterov momentum to adaptive moment estimation (Adam). In order to consider the DBN method for optimization of normal charging voltage as instance, the upgrade rules of Adam are attained as follows
where
In case at present Nesterov momentum, the deviation correction evaluates the
The typical momentum technique has a drawback i.e., its rate of learning cannot be altered from the trained method and it utilizes a single rate of learning to update the weight.
2.4 Stage IV: SGRU Based Classification
In this final stage, SGRU model is exploited to determine the class labels for CRC detection. Traditional ML method deals with time series problems; all the moments of a sample are considered as a distinct independent arbitrary parameter. Further, it is also given to the neural network or regression method for training purposes. But, the current model assumes that the information at distinct moments is independent of each other. So, their time sequence is taken into account [19]. RNN model is presented for capturing the temporal relation by utilizing ML method. GRU is an adapted RNN-based LSTM model. Once the error signal is propagated backwards through time in traditional RNN, the signal tends to blow up or go vanish. These two cases result in network failure to learn from the information. GRU has the capacity to avoid the abovementioned problems and minimize the difficulty of the model without any loss of effective learning capacity.
GRU cell forms every step in the GRU model. In this regard, both reset and update gates are FC layers with sigmoid activation and are utilized for memory control. The preceding hidden layers preserve the historical memory while the update gates control the addition of candidate hidden layer to the hidden layer. The reset gates know how to integrate the input with historical memory so that it becomes a candidate hidden layer. At last, the candidate hidden layer, which is previously a hidden layer, and the output of update gate constitute the existing output and hidden layers. GRU cell is formulated based on the equations given below.
Here,
2.5 Stage V: GSO Based Hyperparameter Tuning
In order to improve the detection outcomes of SGRU model, GSO algorithm is utilized. In the presented approach, all the glowworms have a local visibility range and a luciferin level. The local visibility range identifies the neighboring glowworm that is visible to them whereas the luciferin level of glowworm defines its light intensity [20]. The glowworm probabilistically selects a neighbor with high luciferin level than itself and flies towards the neighbor as it get attracted towards the light. The local visibility range is dynamic so as to maintain a large number of neighbors. The GSO simulates the glowworm behavior and contains three stages. In luciferin update stage, the luciferin level of all the glowworms is estimated based on the decay of its luminescence and the merits of its novel location after carrying out the movement with an evolution cycle t. The luciferin level of glowworm i is upgraded as follows.
Whereas
In the movement stage of evolution cycle, all the glowworms in a swarm should implement a movement. This is done by flying towards a neighbor with high luciferin level than the incumbent glowworm and is situated within the local visibility neighborhood i.e., radius
Here,
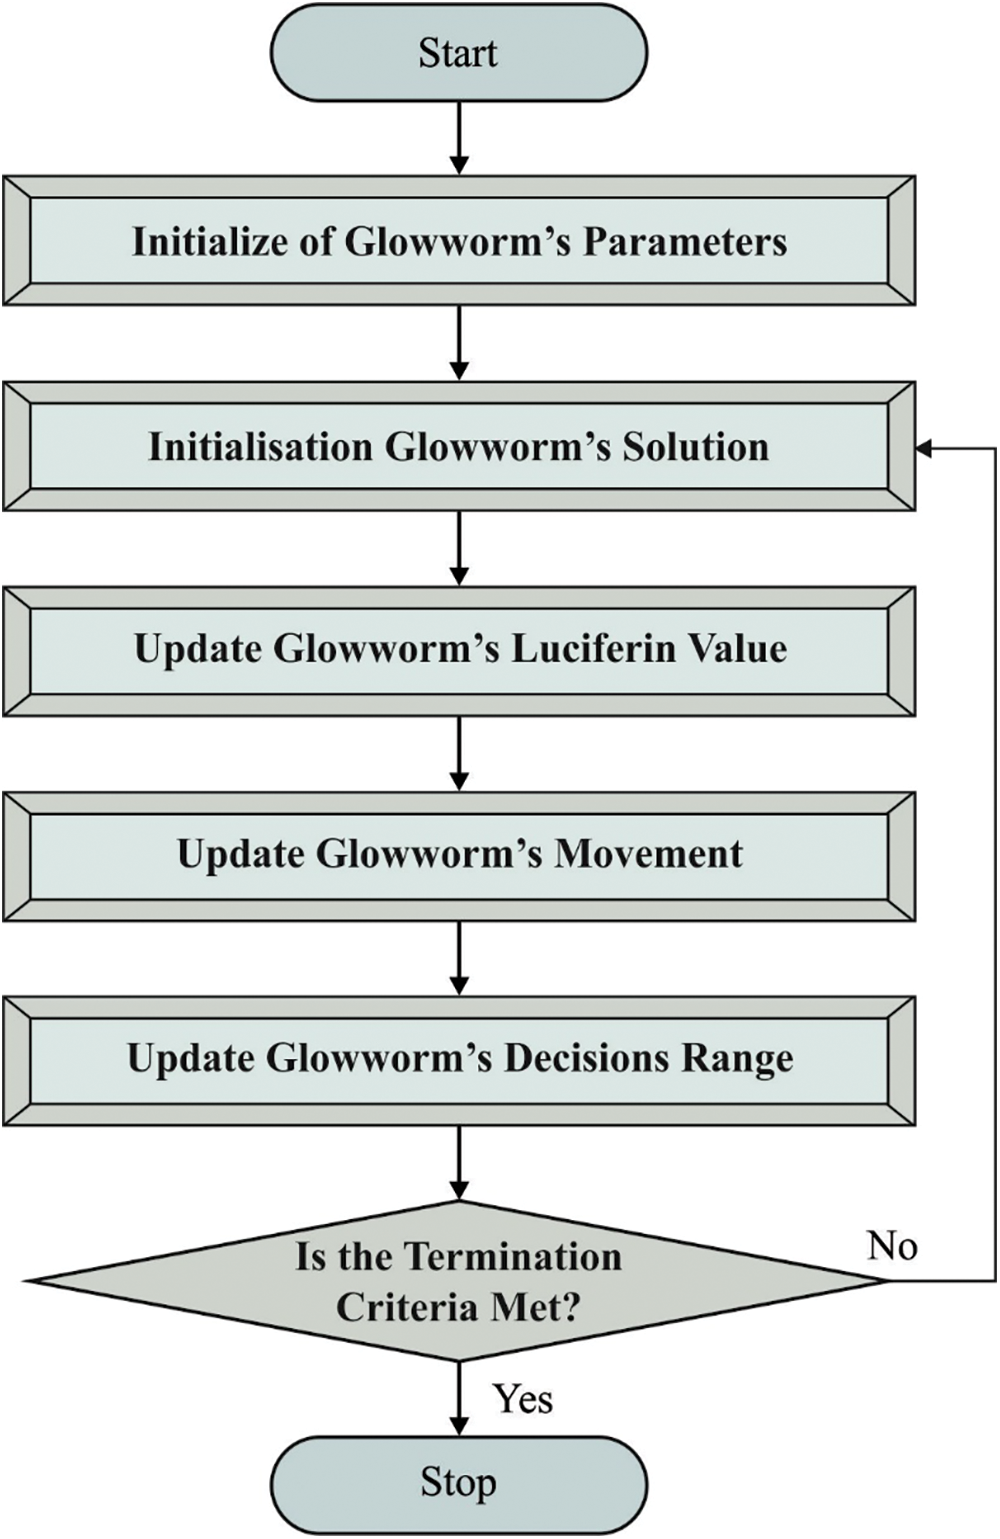
Figure 2: Flowchart of GSO technique
whereas s denotes the movement distance and
whereas
The proposed AAI-CCDC technique was experimentally validated using the publicly available Warwick-QU dataset for its performance [21]. The data contains 165 colorectal histopathological images obtained from 74 patients with benign tumors and 91 patients with malignant tumors [22]. This data was captured using Zeiss MIRAX MIDI Scanner by relating an image data weight range of 716 kilobytes, 1.187 kilobytes, and image data resolution range of 567 × 430 pixels to 775 × 522 pixels with all pixels maintaining a distance of 0.6 μm in the actual distance. The representative sample images of CRC are shown in Fig. 3.
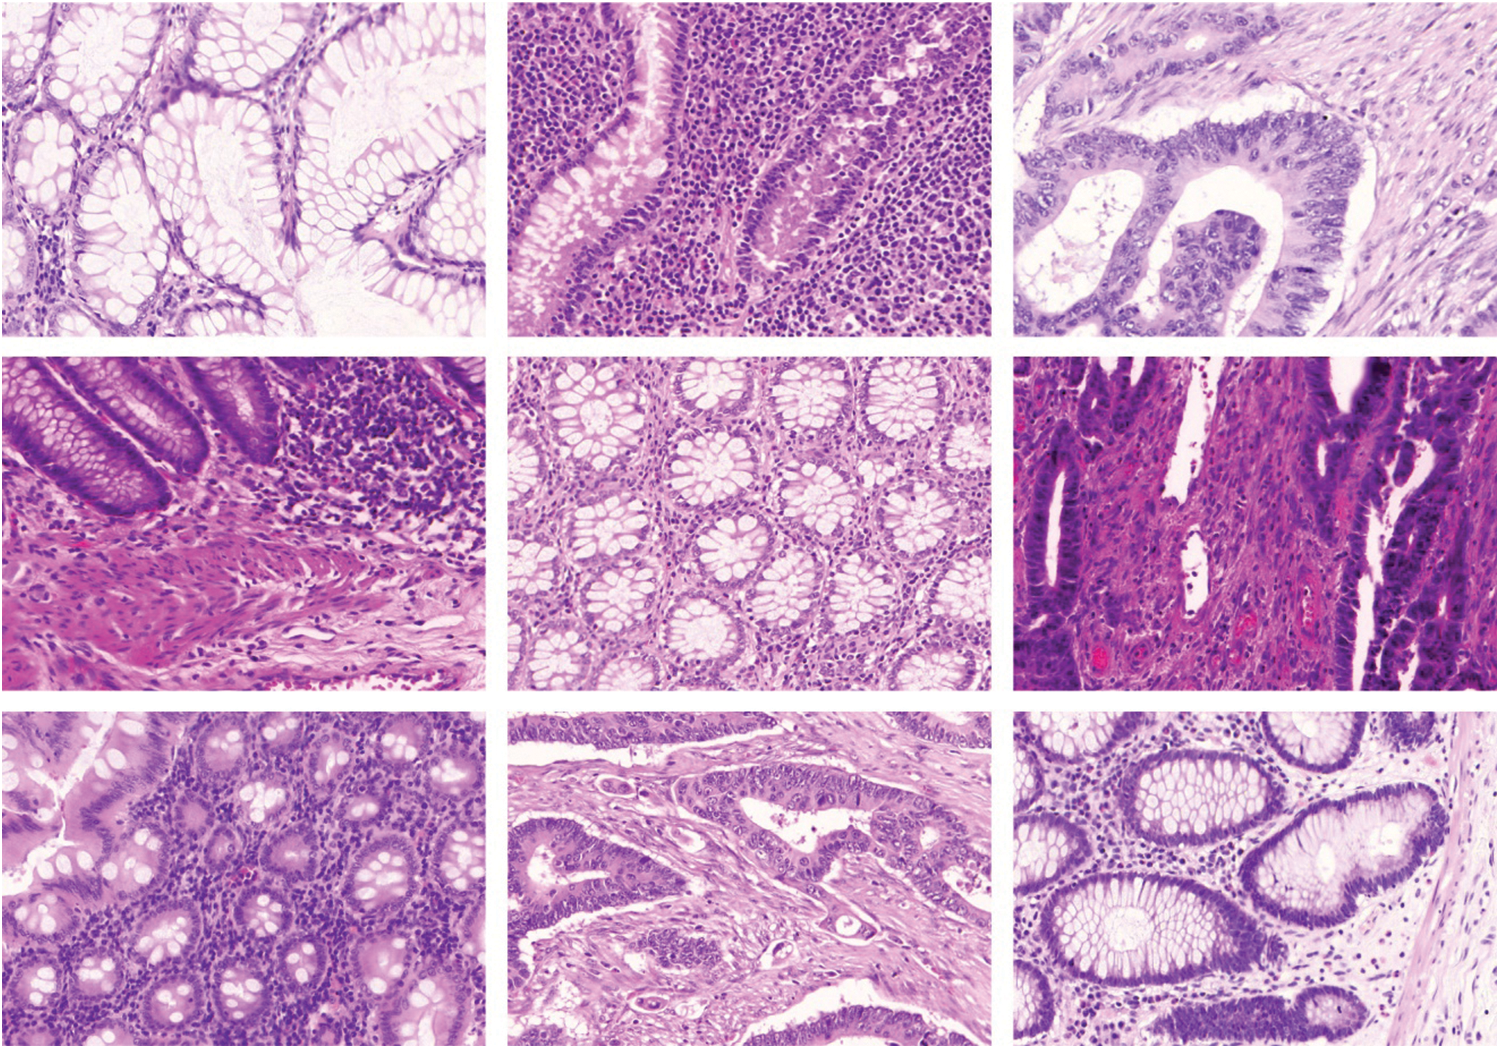
Figure 3: Representative histopathological images from patients with benign and malignant Colorectal Cancer
Fig. 4 showcases ten confusion matrices generated by AAI-CCDC technique under distinct epochs. With 200 epochs, the proposed AAI-CCDC technique stratified 73 images as benign tumors and 88 images as malignant tumors. With 400 epochs, AAI-CCDC technique stratified 73 images as benign tumors and 90 images as malignant tumors. Further, for 1400 epochs, the proposed AAI-CCDC technique stratified 74 images as benign tumors and 87 images as malignant tumors. Eventually, with 1800 epochs, AAI-CCDC technique classified 73 images as benign tumors and 88 images as malignant tumors. Lastly, with 2000 epochs, the presented AAI-CCDC technique identified 71 images as benign tumors and 87 images as malignant tumors.

Figure 4: Confusion matrix of AAI-CCDC technique under distinct epochs
Tab. 1 depicts the results of overall analysis of AAI-CCDC technique under distinct epochs. The results show that the proposed AAI-CCDC technique produced effective outcomes under all epochs. For instance, with 200 epochs, AAI-CCDC technique offered an
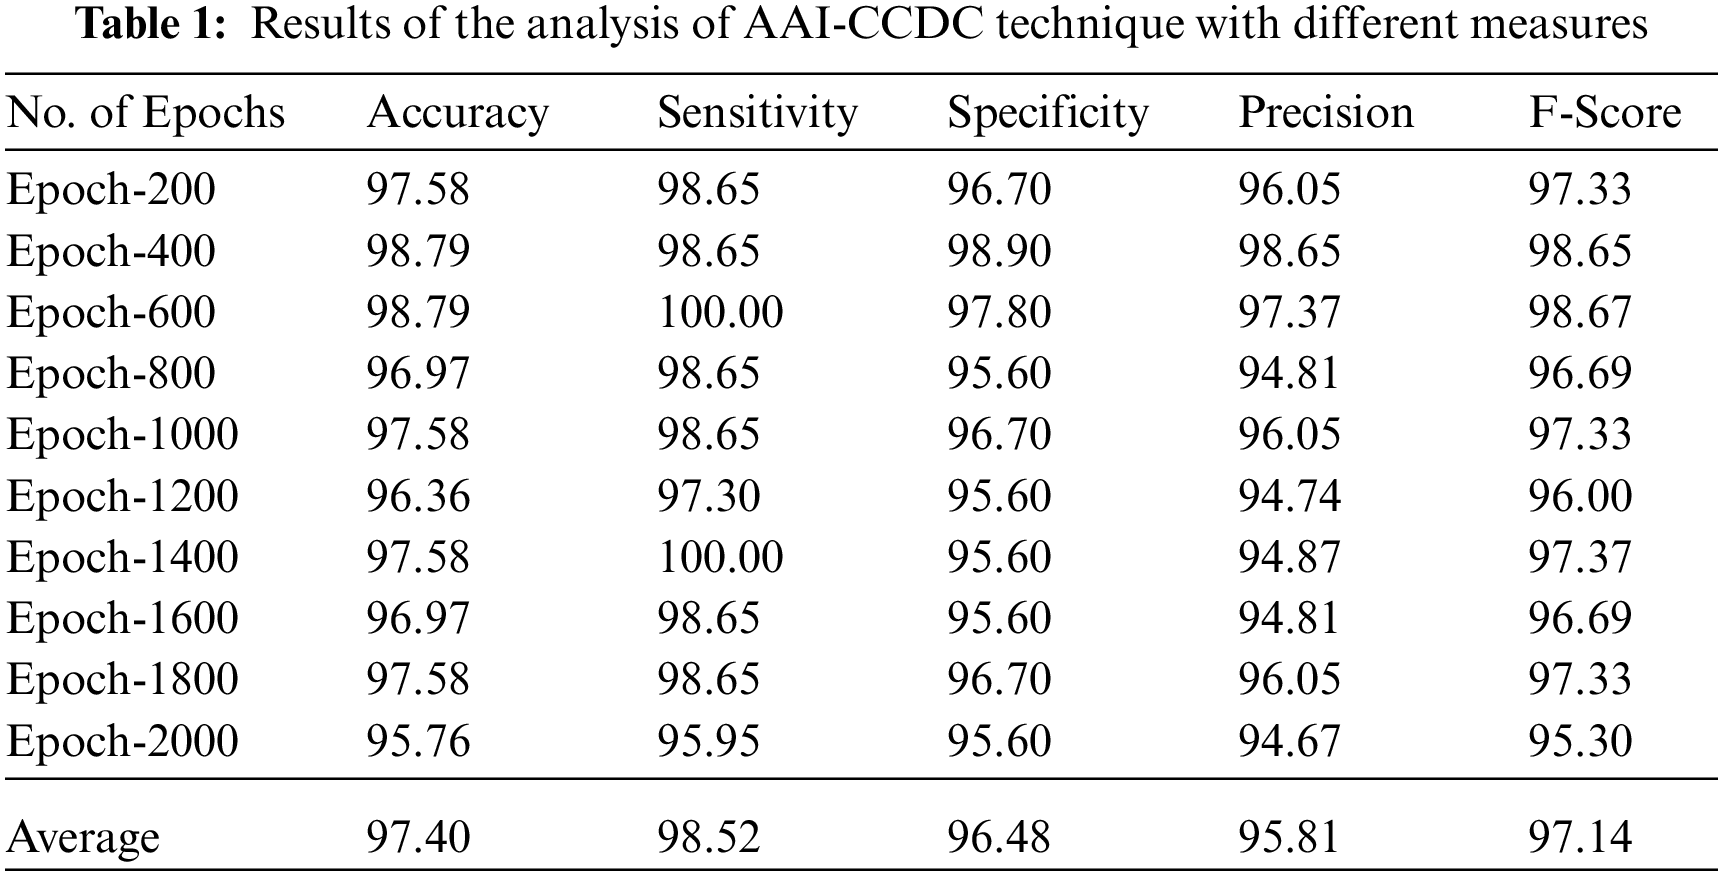
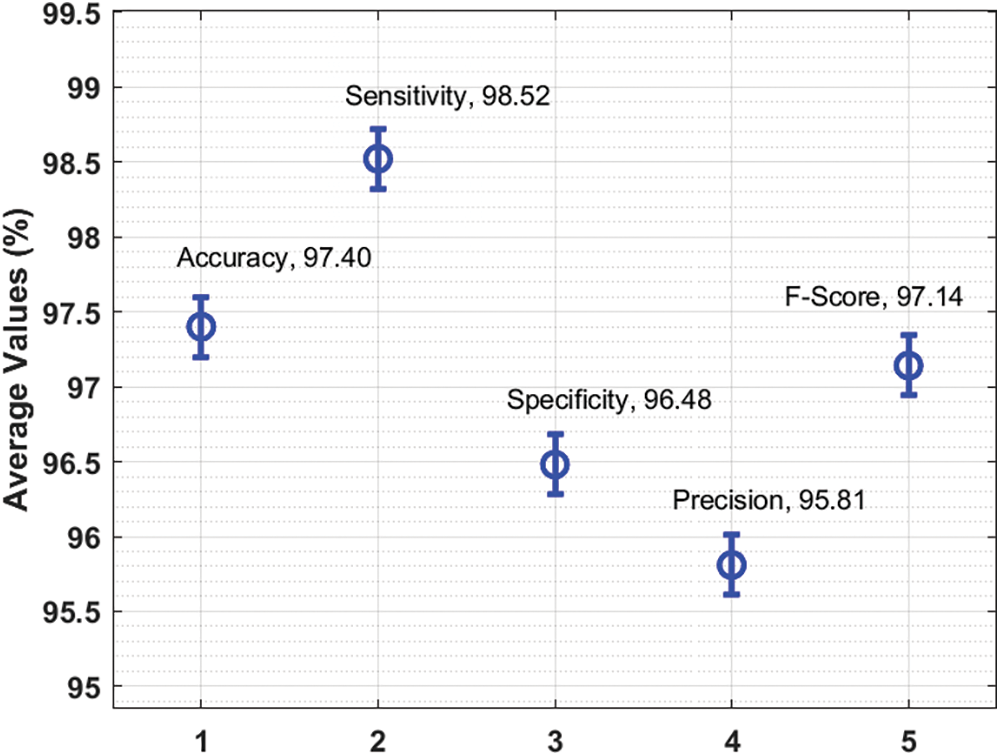
Figure 5: Average analysis results of AAI-CCDC technique under different measures
The overall accuracy outcome analysis results accomplished by the proposed AAI-CCDC technique on test data is portrayed in Fig. 6. The results exhibit that the presented AAI-CCDC technique accomplished an improved validation accuracy than the training accuracy. It is also observed that the accuracy values got saturated at an epoch count of 1000.
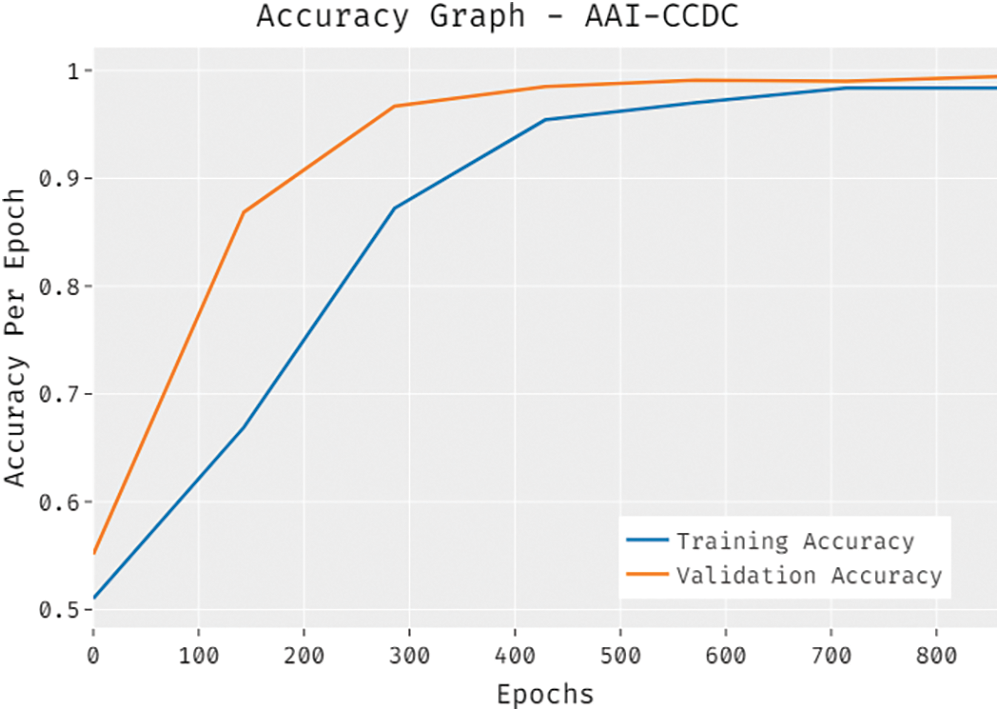
Figure 6: Accuracy graph analysis results of AAI-CCDC technique
The overall loss outcome analysis results of the proposed AAI-CCDC algorithm on test data are shown in Fig. 7. The figure reveals that the proposed AAI-CCDC system achieved a low validation loss compared to training loss. It is additionally noticed that the loss values got saturated at the epoch count of 1000.
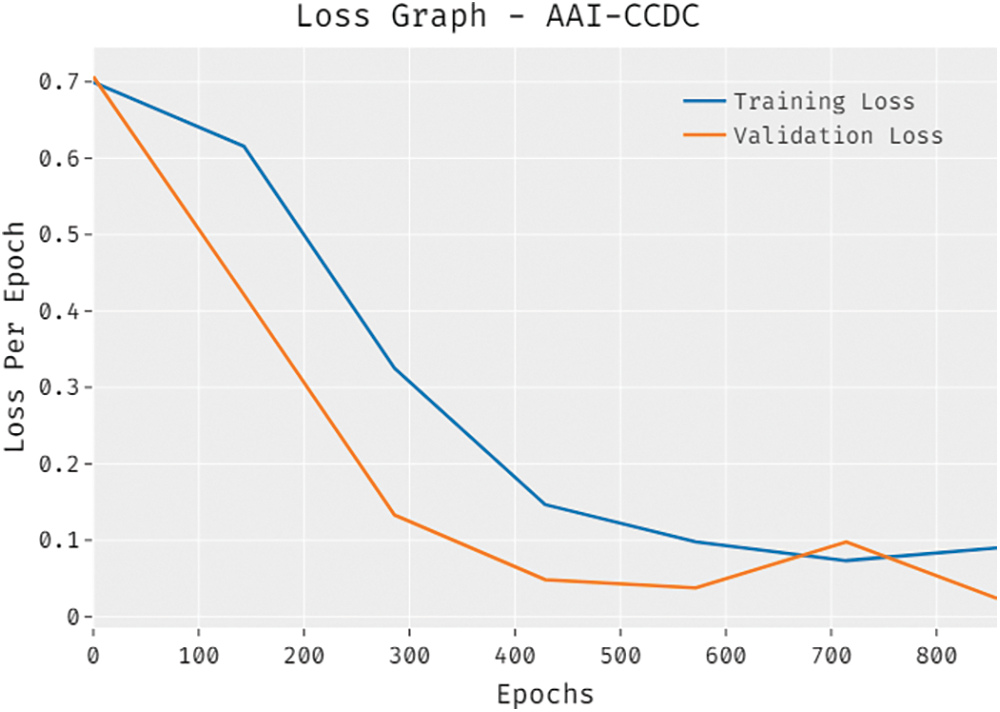
Figure 7: Loss graph analysis results of AAI-CCDC technique
Fig. 8 demonstrates the comparative
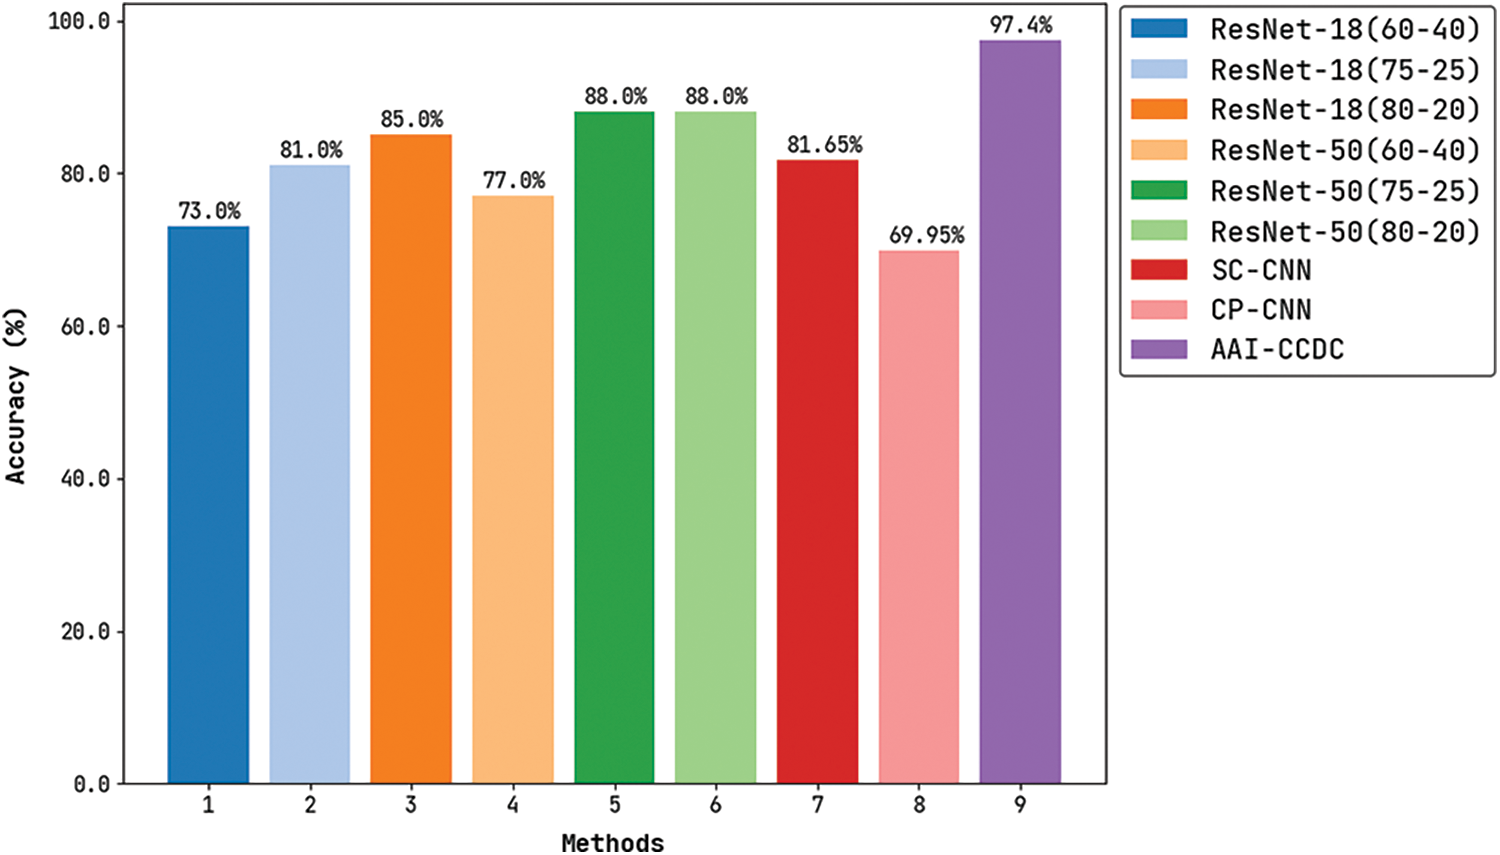
Figure 8: Accuracy analysis results of AAI-CCDC technique with recent algorithms
Fig. 9 depicts the results for comparative
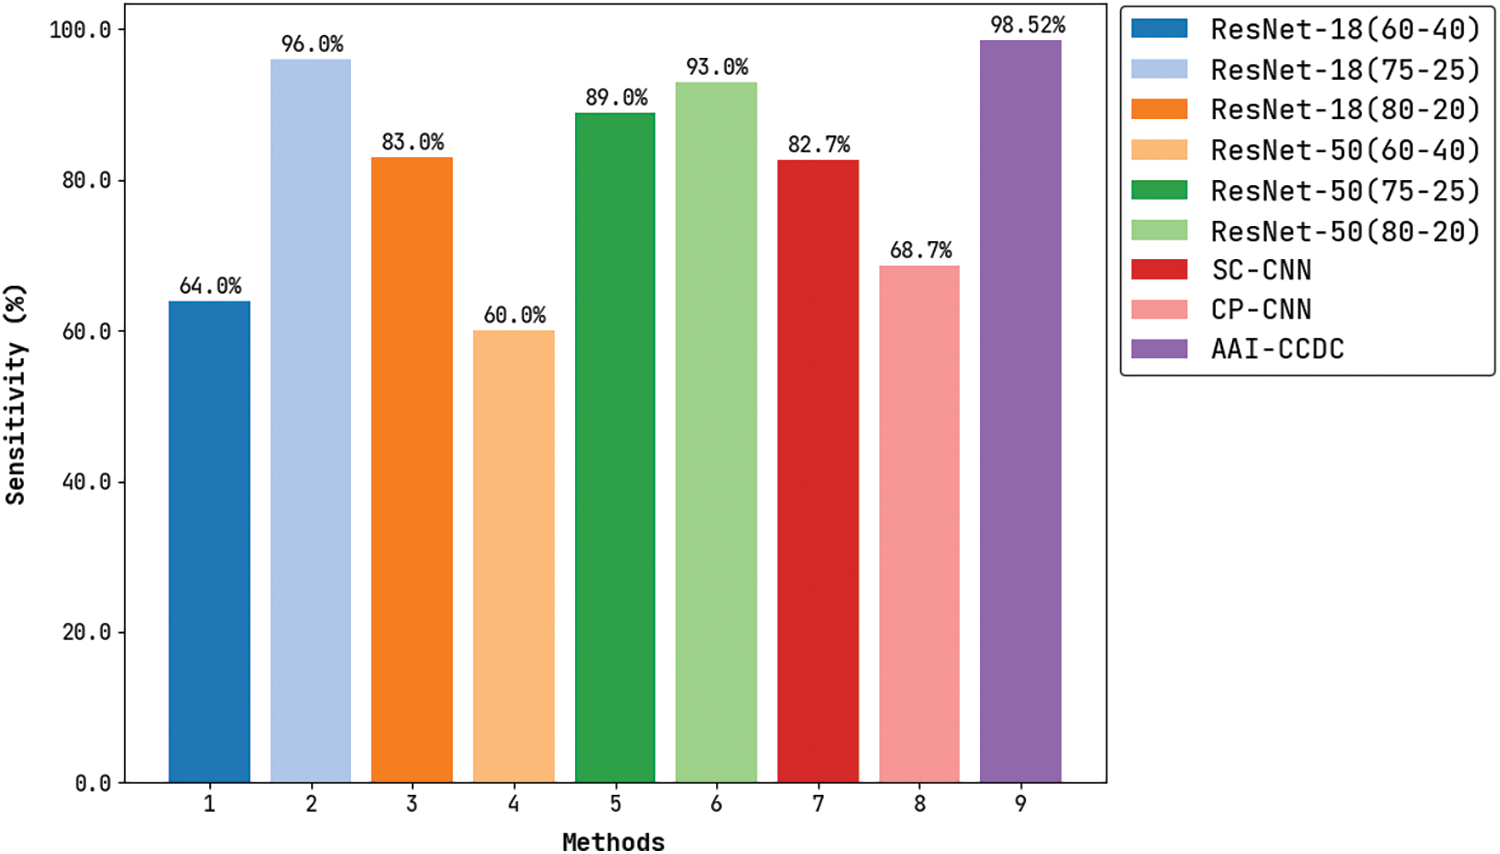
Figure 9: Sensitivity analysis of AAI-CCDC technique with recent algorithms
Fig. 10 portrays the comparative

Figure 10: Specificity analysis of AAI-CCDC technique with recent algorithms
In current study, an effective AAI-CCDC technique is developed to assess the histopathological images so as to diagnose and classify CRC. The presented AAI-CCDC technique encompasses preprocessing, EfficientNet-based feature extraction, Nadam-based parameter tuning, SGRU-based classification, and GSO-based hyperparameter tuning. Nadam and GSO algorithms are used to improve the detection and classification efficiency of CRC. The proposed AAI-CCDC technique was experimentally validated against benchmark dataset and the experimental results infer that AAI-CCDC technique is superior to recent approaches in terms of performance. It achieved the maximum
Acknowledgement: This work was funded by the Deanship of Scientific Research (DSR), King Abdulaziz University, Jeddah, under Grant No. (D-398–247–1443). The authors, therefore, gratefully acknowledge DSR technical and financial support.
Funding Statement: This work was funded by the Deanship of Scientific Research (DSR), King Abdulaziz University, Jeddah, under Grant No. (D-398–247–1443).
Conflicts of Interest: The authors declare that they have no conflicts of interest to report regarding the present study.
1. A. Echle, N. T. Rindtorff, T. J. Brinker, T. Luedde, A. T. Pearson et al., “Deep learning in cancer pathology: A new generation of clinical biomarkers,” British Journal of Cancer, vol. 124, no. 4, pp. 686–696, 2021. [Google Scholar]
2. M. Bilal, S. E. A. Raza, A. Azam, S. Graham, M. Ilyas et al., “Development and validation of a weakly supervised deep learning framework to predict the status of molecular pathways and key mutations in colorectal cancer from routine histology images: A retrospective study,” The Lancet Digital Health, vol. 3, no. 12, pp. e763–e772, 2021. [Google Scholar]
3. E. Wulczyn, D. F. Steiner, M. Moran, M. Plass, R. Reihs et al., “Interpretable survival prediction for colorectal cancer using deep learning,” NPJ Digital Medicine, vol. 4, no. 1, pp. 71, 2021. [Google Scholar]
4. W. Y. Chuang, C. C. Chen, W. H. Yu, C. J. Yeh, S. H. Chang et al., “Identification of nodal micrometastasis in colorectal cancer using deep learning on annotation-free whole-slide images,” Modern Pathology, vol. 34, no. 10, pp. 1901–1911, 2021. [Google Scholar]
5. M. Bilal, S. E. A. Raza, A. Azam, S. Graham, M. Ilyas et al., “Novel deep learning algorithm predicts the status of molecular pathways and key mutations in colorectal cancer from routine histology images,” MedRxiv, 2021, https://doi.org/10.1101/2021.01.19.21250122. [Google Scholar]
6. Y. Li, F. Zhang and C. Xing, “Screening of pathogenic genes for colorectal cancer and deep learning in the diagnosis of colorectal cancer,” IEEE Access, vol. 8, pp. 114916–114929, 2020. [Google Scholar]
7. K. Kim, S. Kim, K. Han, H. Bae, J. Shin et al., “Diagnostic performance of deep learning-based lesion detection algorithm in ct for detecting hepatic metastasis from colorectal cancer,” Korean Journal of Radiology, vol. 22, no. 6, pp. 912, 2021. [Google Scholar]
8. O. Bardhi, D. S. Sosa, B. G. Zapirain and L. Bujanda, “Deep learning models for colorectal polyps,” Information, vol. 12, no. 6, pp. 245, 2021. [Google Scholar]
9. W. Zhou, L. Yao, H. Wu, B. Zheng, S. Hu et al., “Multi-step validation of a deep learning-based system for the quantification of bowel preparation: A prospective, observational study,” The Lancet Digital Health, vol. 3, no. 11, pp. e697–e706, 2021. [Google Scholar]
10. S. H. Kim, H. M. Koh and B. D. Lee, “Classification of colorectal cancer in histological images using deep neural networks: An investigation,” Multimedia Tools and Applications, vol. 80, no. 28–29, pp. 35941–35953, 2021. [Google Scholar]
11. D. Bychkov, N. Linder, R. Turkki, S. Nordling, P. E. Kovanen et al., “Deep learning based tissue analysis predicts outcome in colorectal cancer,” Scientific Reports, vol. 8, no. 1, pp. 3395, 2018. [Google Scholar]
12. E. Vorontsov, M. Cerny, P. Régnier, L. D. Jorio, C. J. Pal et al., “Deep learning for automated segmentation of liver lesions at ct in patients with colorectal cancer liver metastases,” Radiology: Artificial Intelligence, vol. 1, no. 2, pp. 180014, 2019. [Google Scholar]
13. C. Zhou, Y. Jin, Y. Chen, S. Huang, R. Huang et al., “Histopathology classification and localization of colorectal cancer using global labels by weakly supervised deep learning,” Computerized Medical Imaging and Graphics, vol. 88, pp. 101861, 2021. [Google Scholar]
14. L. Xu, B. Walker, P. I. Liang, Y. Tong, C. Xu et al., “Colorectal cancer detection based on deep learning,” Journal of Pathology Informatics, vol. 11, no. 1, pp. 28, 2020. [Google Scholar]
15. N. Ito, H. Kawahira, H. Nakashima, M. Uesato, H. Miyauchi et al., “Endoscopic diagnostic support system for ct1b colorectal cancer using deep learning,” Oncology, vol. 96, no. 1, pp. 44–50, 2019. [Google Scholar]
16. T. M. Y. Shiju and A. V. N. Krishna, “A Two-pass hybrid mean and median framework for eliminating impulse noise from a grayscale image,” in 2021 2nd Int. Conf. on Advances in Computing, Communication, Embedded and Secure Systems (ACCESS), Ernakulam, India, pp. 206–210, 2021. [Google Scholar]
17. J. Wang, Q. Liu, H. Xie, Z. Yang and H. Zhou, “Boosted EfficientNet: Detection of lymph node metastases in breast cancer using convolutional neural networks,” Cancers, vol. 13, no. 4, pp. 661, 2021. [Google Scholar]
18. D. Gao, Y. Wang, X. Zheng and Q. Yang, “A fault warning method for electric vehicle charging process based on adaptive deep belief network,” World Electric Vehicle Journal, vol. 12, no. 4, pp. 265, 2021. [Google Scholar]
19. J. Xie, H. Zhang, L. Liu, M. Li and Y. Su, “Decomposition-based multistep sea wind speed forecasting using stacked gated recurrent unit improved by residual connections,” Complexity, vol. 2021, pp. 1–14, 2021. [Google Scholar]
20. K. N. Krishnanand and D. Ghose, “Glowworm swarm optimisation: A new method for optimising multi-modal functions,” International Journal of Computational Intelligence Studies, vol. 1, no. 1, pp. 93, 2009. [Google Scholar]
21. https://www.warwick.ac.uk/fac/sci/dcs/research/tia/glascontest/download. [Google Scholar]
22. K. Sirinukunwattana, D. R. J. Snead and N. M. Rajpoot, “A stochastic polygons model for glandular structures in colon histology images,” IEEE Transactions on Medical Imaging, vol. 34, no. 11, pp. 2366–2378, 2015. [Google Scholar]
23. D. Sarwinda, R. H. Paradisa, A. Bustamam and P. Anggia, “Deep learning in image classification using residual network (resnet) variants for detection of colorectal cancer,” Procedia Computer Science, vol. 179, pp. 423–431, 2021. [Google Scholar]
24. K. Sirinukunwattana, S. E. A. Raza, Y. W. Tsang, D. R. J. Snead, I. A. Cree et al., “Locality sensitive deep learning for detection and classification of nuclei in routine colon cancer histology images,” IEEE Transactions on Medical Imaging, vol. 35, no. 5, pp. 1196–1206, 2016. [Google Scholar]
 | This work is licensed under a Creative Commons Attribution 4.0 International License, which permits unrestricted use, distribution, and reproduction in any medium, provided the original work is properly cited. |