DOI:10.32604/cmc.2022.026759
| Computers, Materials & Continua DOI:10.32604/cmc.2022.026759 | |
| Article |
Importance of Adaptive Photometric Augmentation for Different Convolutional Neural Network
1AI Reliability Lab, ThinkforBL Consultancy Services, Gangnam, Seoul, Korea
2Department of Biosystems Engineering, Chungbuk National University, Cheongju-si, Chungcheongbuk-do, 28644, Korea
*Corresponding Author: Ji Hwan Park. Email: jihwan.park@thinkforbl.com
Received: 04 January 2022; Accepted: 23 February 2022
Abstract: Existing segmentation and augmentation techniques on convolutional neural network (CNN) has produced remarkable progress in object detection. However, the nominal accuracy and performance might be downturned with the photometric variation of images that are directly ignored in the training process, along with the context of the individual CNN algorithm. In this paper, we investigate the effect of a photometric variation like brightness and sharpness on different CNN. We observe that random augmentation of images weakens the performance unless the augmentation combines the weak limits of photometric variation. Our approach has been justified by the experimental result obtained from the PASCAL VOC 2007 dataset, with object detection CNN algorithms such as YOLOv3 (You Only Look Once), Faster R-CNN (Region-based CNN), and SSD (Single Shot Multibox Detector). Each CNN model shows performance loss for varying sharpness and brightness, ranging between −80% to 80%. It was further shown that compared to random augmentation, the augmented dataset with weak photometric changes delivered high performance, but the photometric augmentation range differs for each model. Concurrently, we discuss some research questions that benefit the direction of the study. The results prove the importance of adaptive augmentation for individual CNN model, subjecting towards the robustness of object detection.
Keywords: Object detection; photometric variation; adaptive augmentation; convolutional neural network
The convolutional neural network is a state-of-the-art machine learning technique that is similar to the multilayer perceptron (MLP). The research topic related to object detection based on CNN has always been popular among researchers [1–3]. Object detection involves feature extraction and the classification of images with multiple layers of Convolutional to find the position of the specific object in the image, which is marked with the bounding boxes, for a visual understanding. The object detection technique is more applicable in many intelligent applications such as surveillance [4], face detection [5], emotional changes [6], and many useful fields [7]. The images are often trained with defined classes for a specific task from a large set of images. In normal situations, the training is performed with the input images with defined image characteristics such as sharpness and brightness. However, during the test phase, the images might be different from the training set with unpredicted situations. In such situations, the current preprocessing might not be enough. Few kinds of research specify the importance of the image characteristic. Bianco et al. [8] discuss the suitable color balanced dataset to improve the accuracy of the image classification. When it comes to color balancing, some algorithms such as the constancy algorithm and color characteristics procedure are applied. Similarly, the other characteristics of the image, such as sharpness and brightness, have an image-enhancing algorithm to change or maintain their consistency. Sivamani et al. [9] explain the importance of image characteristics in the training and evaluation phase, in which both the sharpness and brightness within the range of −75% to 75% are used to estimate the difference in the accuracy with the YOLO model.
With the collection of augmentation techniques, there is always a lack of standardization, due to the controversy between the dataset and algorithm. Although the study explained [9] the difference in accuracy with image characteristics for YOLO, it cannot be generalized for the other models. Unfortunately, the researchers focused on finding a new algorithm, instead of standardizing or balancing the dataset for the chosen model. Photometrically balanced dataset represents the image augmented dataset with the weak index of the sharpness, brightness, or other image characteristics. The need for explicit criteria for photometric variation is even more essential in important dataset important datasets such as medicine, military, or nuclear areas as the severity weighs in the features of the image. Although the augmentation is non-rigorous, we discuss the impact of a photometrically imbalanced dataset with three CNN algorithms such as YOLOv3, Faster RCNN, and SSD. In addition to the high accuracy claims and performance of the models, the unsuccessful result continues to exist in a different environment [10]. The high performance proclaimed by the researcher is reversed when applied to the public dataset [11]. Hence, the fault prediction model that sets the criterion is exceptionally decisive on the public dataset with different image characteristics and conditions. By acknowledging the availability of predictive models, we made an attempt to clarify the imbalance dataset covered with different domains of techniques ranging from data mining and statistical, to other machine learning techniques. With this clarification, even imbalanced datasets may become the representative guidance for many models.
In this study, we concurrently investigate the image characteristics such as brightness and sharpness with different CNN models in the context of object detection. We aim to ease the understanding of the practitioner, about the adaptiveness between the algorithm and dataset and choose the augmentation wisely. We performed our experiments with PASCAL VOC dataset [12] which includes images of 20 classes. First, the test dataset was augmented photometrically within the range of −80% to 80%. The test result with the original CNN model showed the dissimilar accuracy between the models on each photometric change. By speculating the weak range, the mixture of augmentation was grouped, to check the performance of each CNN model. With the recorded result, we discuss the issue and reason for choosing adaptive photometric augmentation. The rest of the paper is organized as follows: Section 2 discuss the research questions that inspired the research; Section 3 explains the dataset and the methods used for this study; Section 4 describes the experimental analysis to support the adaptive augmentation and Section 5 discusses the result of the analysis. Lastly, Section 6 included conclusion of the paper with the importance of adaptive photometric augmentation in each CNN model and the future research directions.
The high performance of the prediction models is always presumed to depend on the feature selection. Therefore, we direct—research area on the importance of adaptiveness between the dataset and model, which is closely related to the performance. The objective was inspired by the following research questions (RQ), which will be discussed later in the result.
RQ1. Without data leakage, could high performance be attained for random augmentation on photometric change? Yu et al. [13] address the issue of the data augmentation that involves the privacy and data leakage. There are similar studies, to improve the performance with the liable privacy over the dataset. In case, what if the dataset only needs to focus on brighter images, and the augmented dataset contains the darker images?
RQ2. How effective is the random augmentation related to cost, size and time? Many researches are underway to compensate the loss from random augmentation [14]. Regardless, can the AI model deliver high performance?
RQ3. Is it reasonable to use the same photometric augmentation index for all the datasets, irrespective of CNN algorithms? Will the performance level retain?
RQ4. What if the model shows poor performance in safety-related industries like health care, biometric or national defense? The photometric characteristics are sensitive in such a field, which requires high importance to the respective models. However, it can be seen that augmentations are feature-oriented, instead of limit-oriented augmentation on selected features.
In this study, we used the PASCAL dataset with a wide range of data organized from 2005. PASCAL VOC challenge has set a benchmark with its object recognition and detection, which affirms the standardization of the dataset. The dataset consists of the following two principal challenges: image classification and object detection. In addition to this, it also has pixel-level segmentation that can detect the hand, feet, and head of the image. It also indicates the reason that it provides plug-and-play training methods and retains the state of art each year. Therefore, we chose this dataset for our study.
Furthermore, there is a mixture of images with different brightness and sharpness indexes that can facilitate detailed research on our proposed concept. Figs. 1a and 1b show the sharpness and brightness index of the total image in the PASCAL dataset. With the normal index of the image being 0.5, the sharpness increases with an index greater than 0.5 and decreases to blurriness with an index less than 0.5. Similarly, the normal index of sharpness is 0, while an increasing index value shows the sharpness increase and an index less than 0 shows the sharpness decrease. As can be seen from Fig. 1, the images have a different level of brightness, while the sharpness of the images is relatively stable on a negative scale but contains a variety of images on the positive scale.

Figure 1: Histogram plot for number of images on (a) Brightness index and (b) Sharpness index
3.2 Photometric Characteristics
Most of the researchers focus on the balancing dataset related to class or feature, to avoid the overfitting of the model but neglect the balancing of the image characteristics. The texture of the image with some variations such as light, color, temperature, brightness, etc., has always been a focus for image recognition [15]. Color and texture information can be combined in several ways. The influence of sharpness and brightness needs to be considered seriously, as they can be linked to more important fields, such as medicine, security, and face recognition. The edge detection technique [16] also features the response to the characteristic changes in brightness, color, and texture of the image. There are parallel, sequential and integrative approaches that represent the color and texture analysis [17]. Sapkale et al. [18] explains the effectiveness of various combinations of color and texture in the image classification, which performed very poorly with changes in the illuminant. This was also confirmed again by Cusano et al. [19]. To successfully highlight the image characteristic in object detection, the descriptors need to be robust with the change in various images. Ye et al. [20] explores the prediction of a visible image with varying brightness with CNN application. Pixel-based colors are ranked to determine the correlation measure related to the sensitivity of illumination changes [21]. Cusano et al. [22] proposed a descriptor that measures the local contrast: a property that is less sensitive than the color itself to variations in the color of the illuminant. There are a few more strategies related to the importance of image characteristics, such as color texture recognition with Gabor filters and discrete Fourier transform. Ke et al. [23] also investigated the quality assurance model and the enhancement of images using the machine learning approach. Object recognition with a CNN model can also be executed with Fisher Vectors according to the pool features [24]. Unless a complex combination is used, the CNN approach will outperform the traditional method [25].
Sharpness is a significant entity that determines the feature of the object in the image using image edges and can also be measured by edge response. Few of the techniques used to measure the sharpness include the rise distance technique, frequency domains, and the modulation transfer function. The rise distance technique calculates the sharpness with the distance of pixel-level that ranges from 10% to 90%, hence named 10%–90% rise distance [25].
Usually, the rise distance calculation is not easy due to the consideration of the individual components of the camera such as the software, lens, and digital sensor. Therefore, the sharpness is measured in the frequency domain. Inevitably, the Fourier transform is associated with the frequency domain, where Eq. (1) represents the Fourier of the output transformation and Eq. (2) represents the spatial domain of the input image.
where
f = Frequency;
t = time;
ω = 2πf.
Brightness is the visual attribute that serves as visual stimuli that appear to be intense or dim [26]. Brightness is also widely represented as Luminance, which is represented in the ITU-R BT.601 standard as equated in (3)
where r, g, and b are stimulus RGB coordinates.
From the above explanation, it is evident that brightness and sharpness are important image characteristics that affect the visual impact. To obtain a more accurate result, a more balanced dataset, including the feasible image characteristics, is required. Therefore, we explored this domain to compare the CNN models with different ranges of image characteristics to identify the suitable image characteristic range for each model.
YOLOv3 is a widely used object detector that was advanced from You Only Look Once (YOLO). In 2015, YOLO was the first introduction that offered high and fast accuracy on the PASCAL VOC database. The object detection delivers the bounding boxes and class probability with confidence levels. Although YOLO has a high demand for object detection with fast and accurate results, it fails to detect multiple objects in close range, thereby resulting in low accuracy in a specific situation. To solve this, YOLO 9000 was proposed to adapt object detection for overlapping objects. However, there was a downfall in speed and accuracy. To solve these issues, YOLOv3 [27] was introduced with better speed and accuracy. YOLOv3 was proven to have an advantage in speed and accuracy compared to the previous version.
Faster R-CNN was mainly proposed for object detection [28], provided with the detected bounding boxes and the corresponding class labels. The whole process is divided into two phases: region proposal network and image classification. The input image is generated into 2D feature map with the first 2D ConvNet, while a second 2D ConvNet generates the set of class diagnostic region proposals that consist of bounding box coordinates mapped with each pixel location of the feature map. The boundaries are marked with respect to the anchor boxes. Next, the features in the region are pooled to the RoI polling [29]. DNN classifiers predict the class probabilities and detection boundaries for each class. Faster R-CNN has extended to localization, along with object detection [30–32].
Single shot multibox detector (SSD) [33] is also considered as one of the major object detection algorithms with significant performance accuracy. All the CNN layers are utilized efficiently to detect the object, and finally, the result of each layer is merged. Finally, the non-maximum suppression (NMS) suppresses the detection box. In contrast to RCNN, SSD does not require a two-stage algorithm or region proposal network. SSD detects the objects from feature maps on each layer. Therefore, SSD provides high-speed detection. The only disadvantage of SSD is the limitation in object detection. SSD was built based on the VGG16 [34] network; therefore, each layer in the feature map detects the objects independently. This neglects the small object due to the lack of information that is not shared among the layers [35]. The challenging task is to solve this issue that including the replacement of VGGNet with ResNet [36,37], resulting in a poor accuracy rate.
The overall experiment involves the performance analysis of object detection with photometric variation with the YOLOv3, Faster RCNN, and SSD models. According to the research review, the accuracy detection is different for each model, which also includes various augmentation techniques. Here, the PASCAL VOC 2007 test dataset with 4952 images was characteristically adjusted between 80% to −80% with an interval of 20. In other words, one image was converted to seven images with multiple photometric variations, which produced 34664 images in total. All the images were tested with the pre-trained model to test the adjusted image with sharpness and brightness. Firstly, a single test image was tested on all three models, as represented in Fig. 2, which explains the difference in the model with their respective object detection with an image from the dataset. The original image was annotated with eight objects, while Faster RCNN, YOLO, and SSD can detect seven, four, and three objects, respectively, which shows the accuracy.

Figure 2: List of detected objects with original and other CNN models
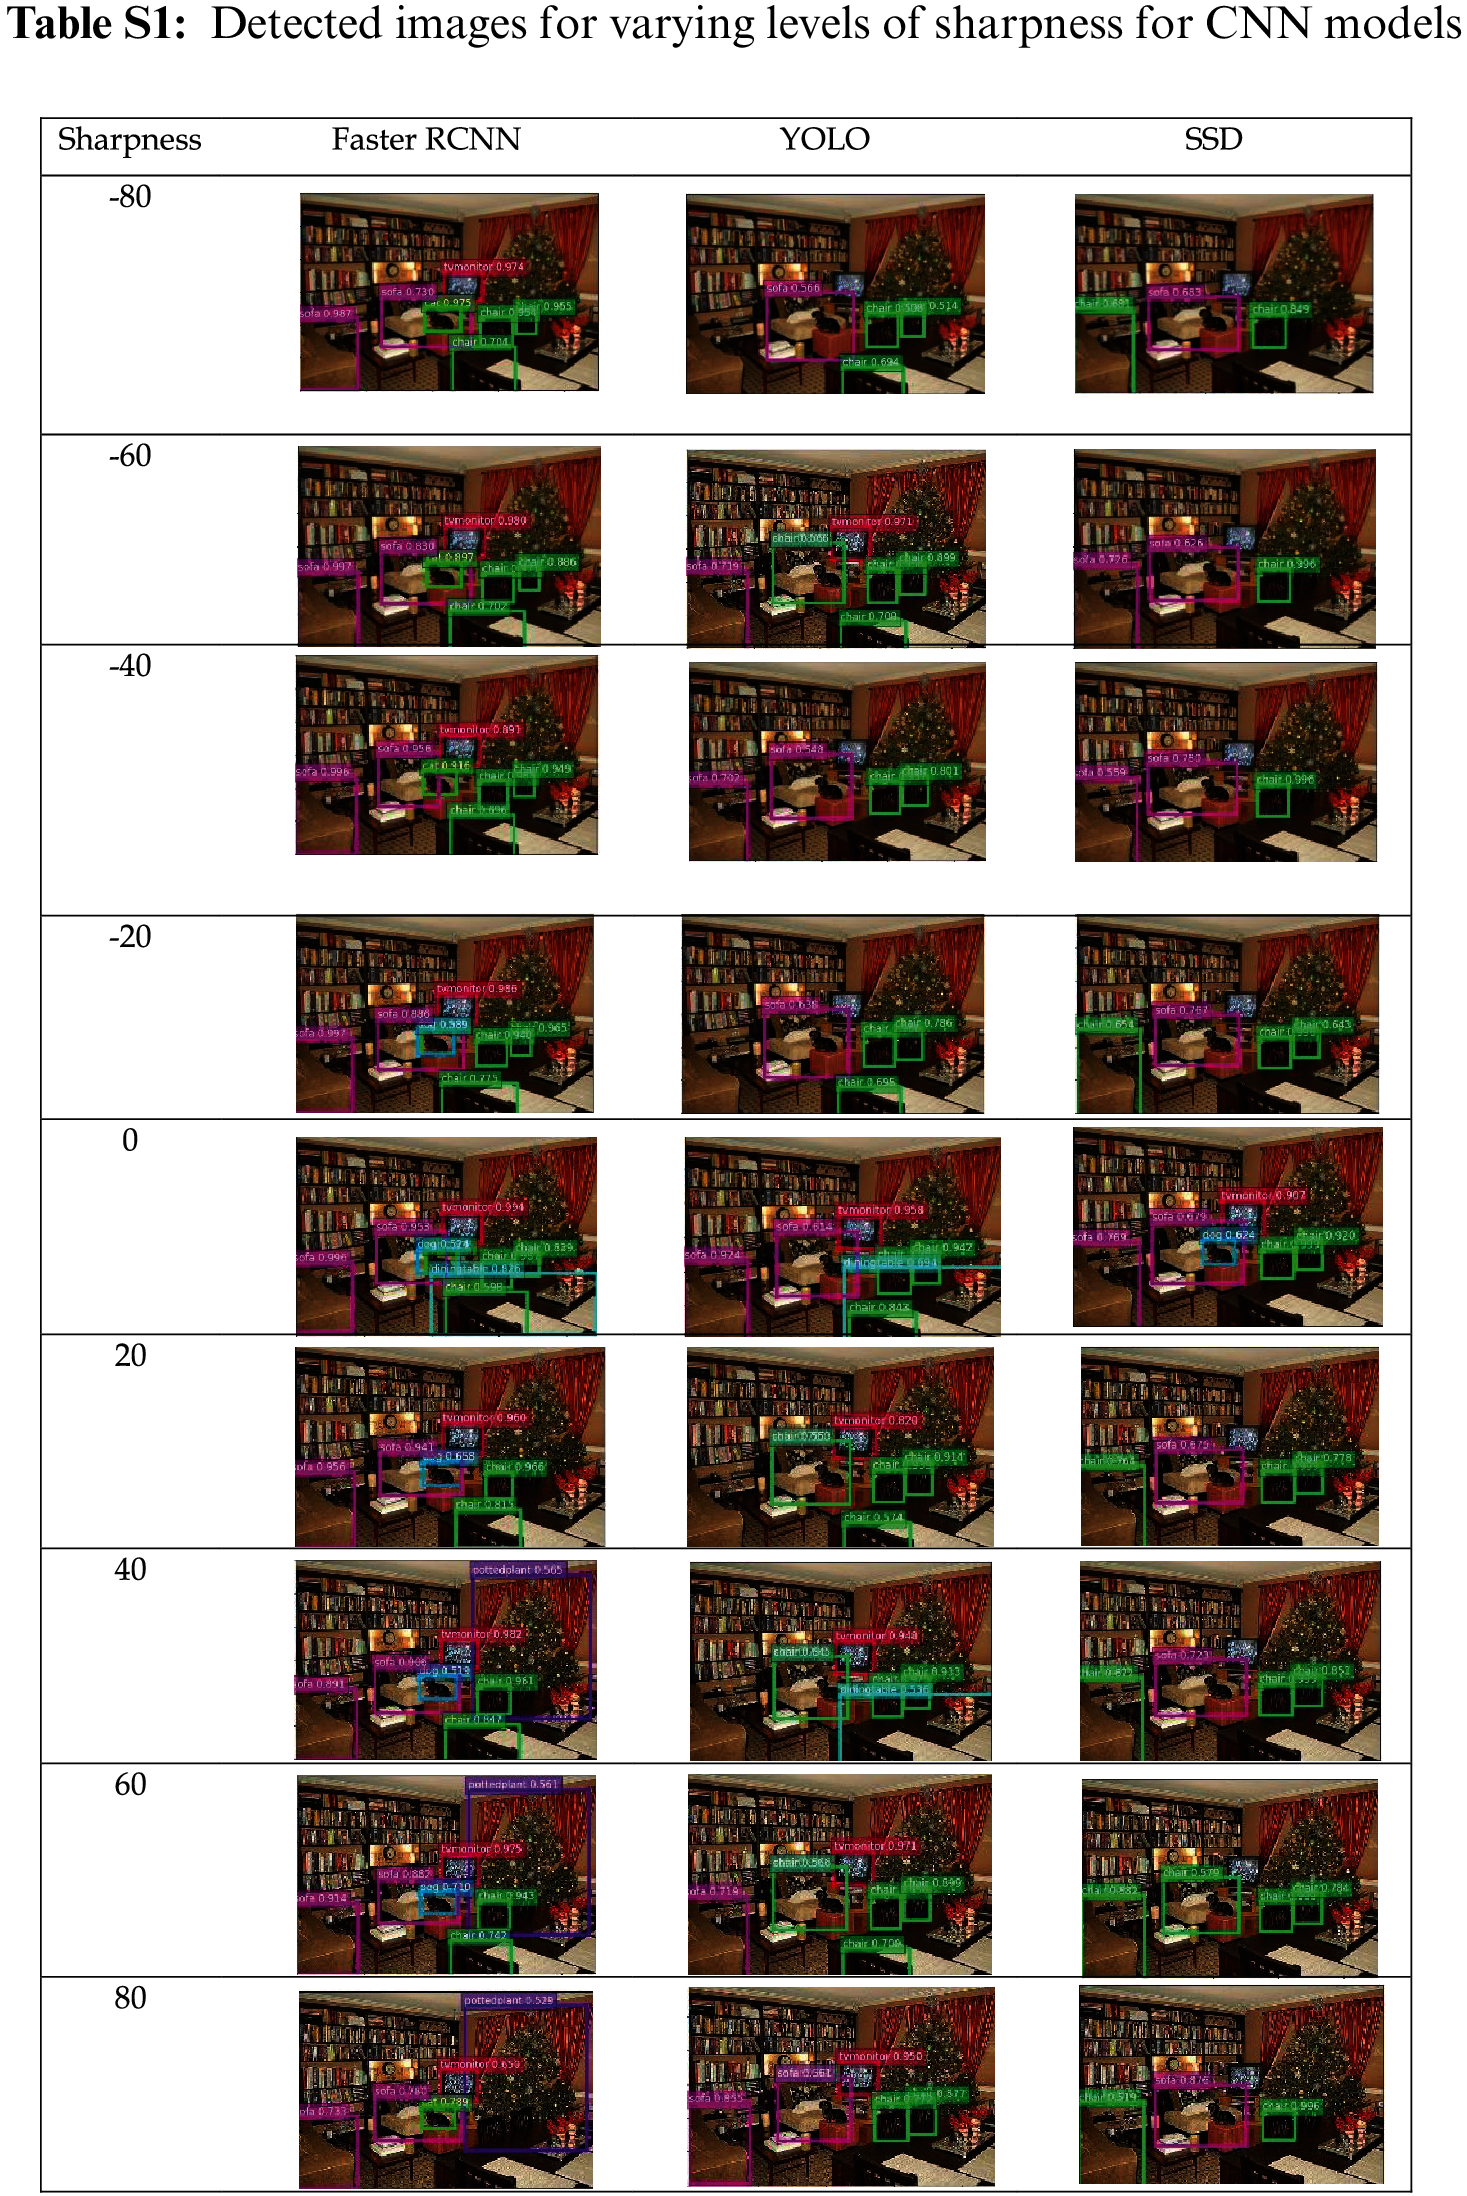
Variation result implies that the photometric changes will naturally affect the prediction accuracy. Similarly, the sharpness and brightness of the test images were adjusted in the range of −80 and 80, and the detected results for each model are tabulated in Tabs. S1 and S2 respectively. Both of the tables explain the difference in the detected objects between the models. Comparisons of the number of detected objects for the adjusted sharpness and brightness are shown in Figs. 3a and 3b, respectively. From Fig. 3b and Tab. S2, it can be identified that the detection accuracy increases with brightness, yet each model gives its best output at a different range of brightness. This is more evident with varying sharpness, where Faster RCNN can give high accuracy with original and −20% sharpness, but YOLOv3 and SSD show a sharp contrast of accuracy declination for the same range, as shown in Fig. 3a and Tab. S1. Compared to the brightness, the adjusted sharpness images are more reliable with increment, but the sharpness reveals less detection or a failure to recognize the objects. This indicates that the training dataset lacks a balanced dataset that can detect the varying image characteristics. It also indicates that the model created with the original dataset will face a low accuracy rate when tested with images of low brightness and sharpness.

Figure 3: Comparison of the number of detected objects with (a) adjusted sharpness and (b) adjusted brightness among between Faster RCNN, YOLOv3, and SSD (one image)
Apparently, the difference in one image cannot justify or generalize the decision on the importance of photometric change in object detection. Figs. 4 and 5 show the object detection of three images with different backgrounds for three object detection models at a different range of brightness and sharpness, respectively. The number of detected objects differs from the original detection with varying image characteristics. In other words, the accuracy is reduced for each limit of brightness. In contrast to the previous results from Figs. 4 and 5, Faster RCNN shows very low accuracy because of the false positive results. This shows the importance of the image characteristics in the object detection models. In comparison to the brightness, the varying sharpness does not show a major accuracy loss in object detection. It should be noted that few false-negative results were detected, indicating that the increasing sharpness might also decrease the overall accuracy rate.
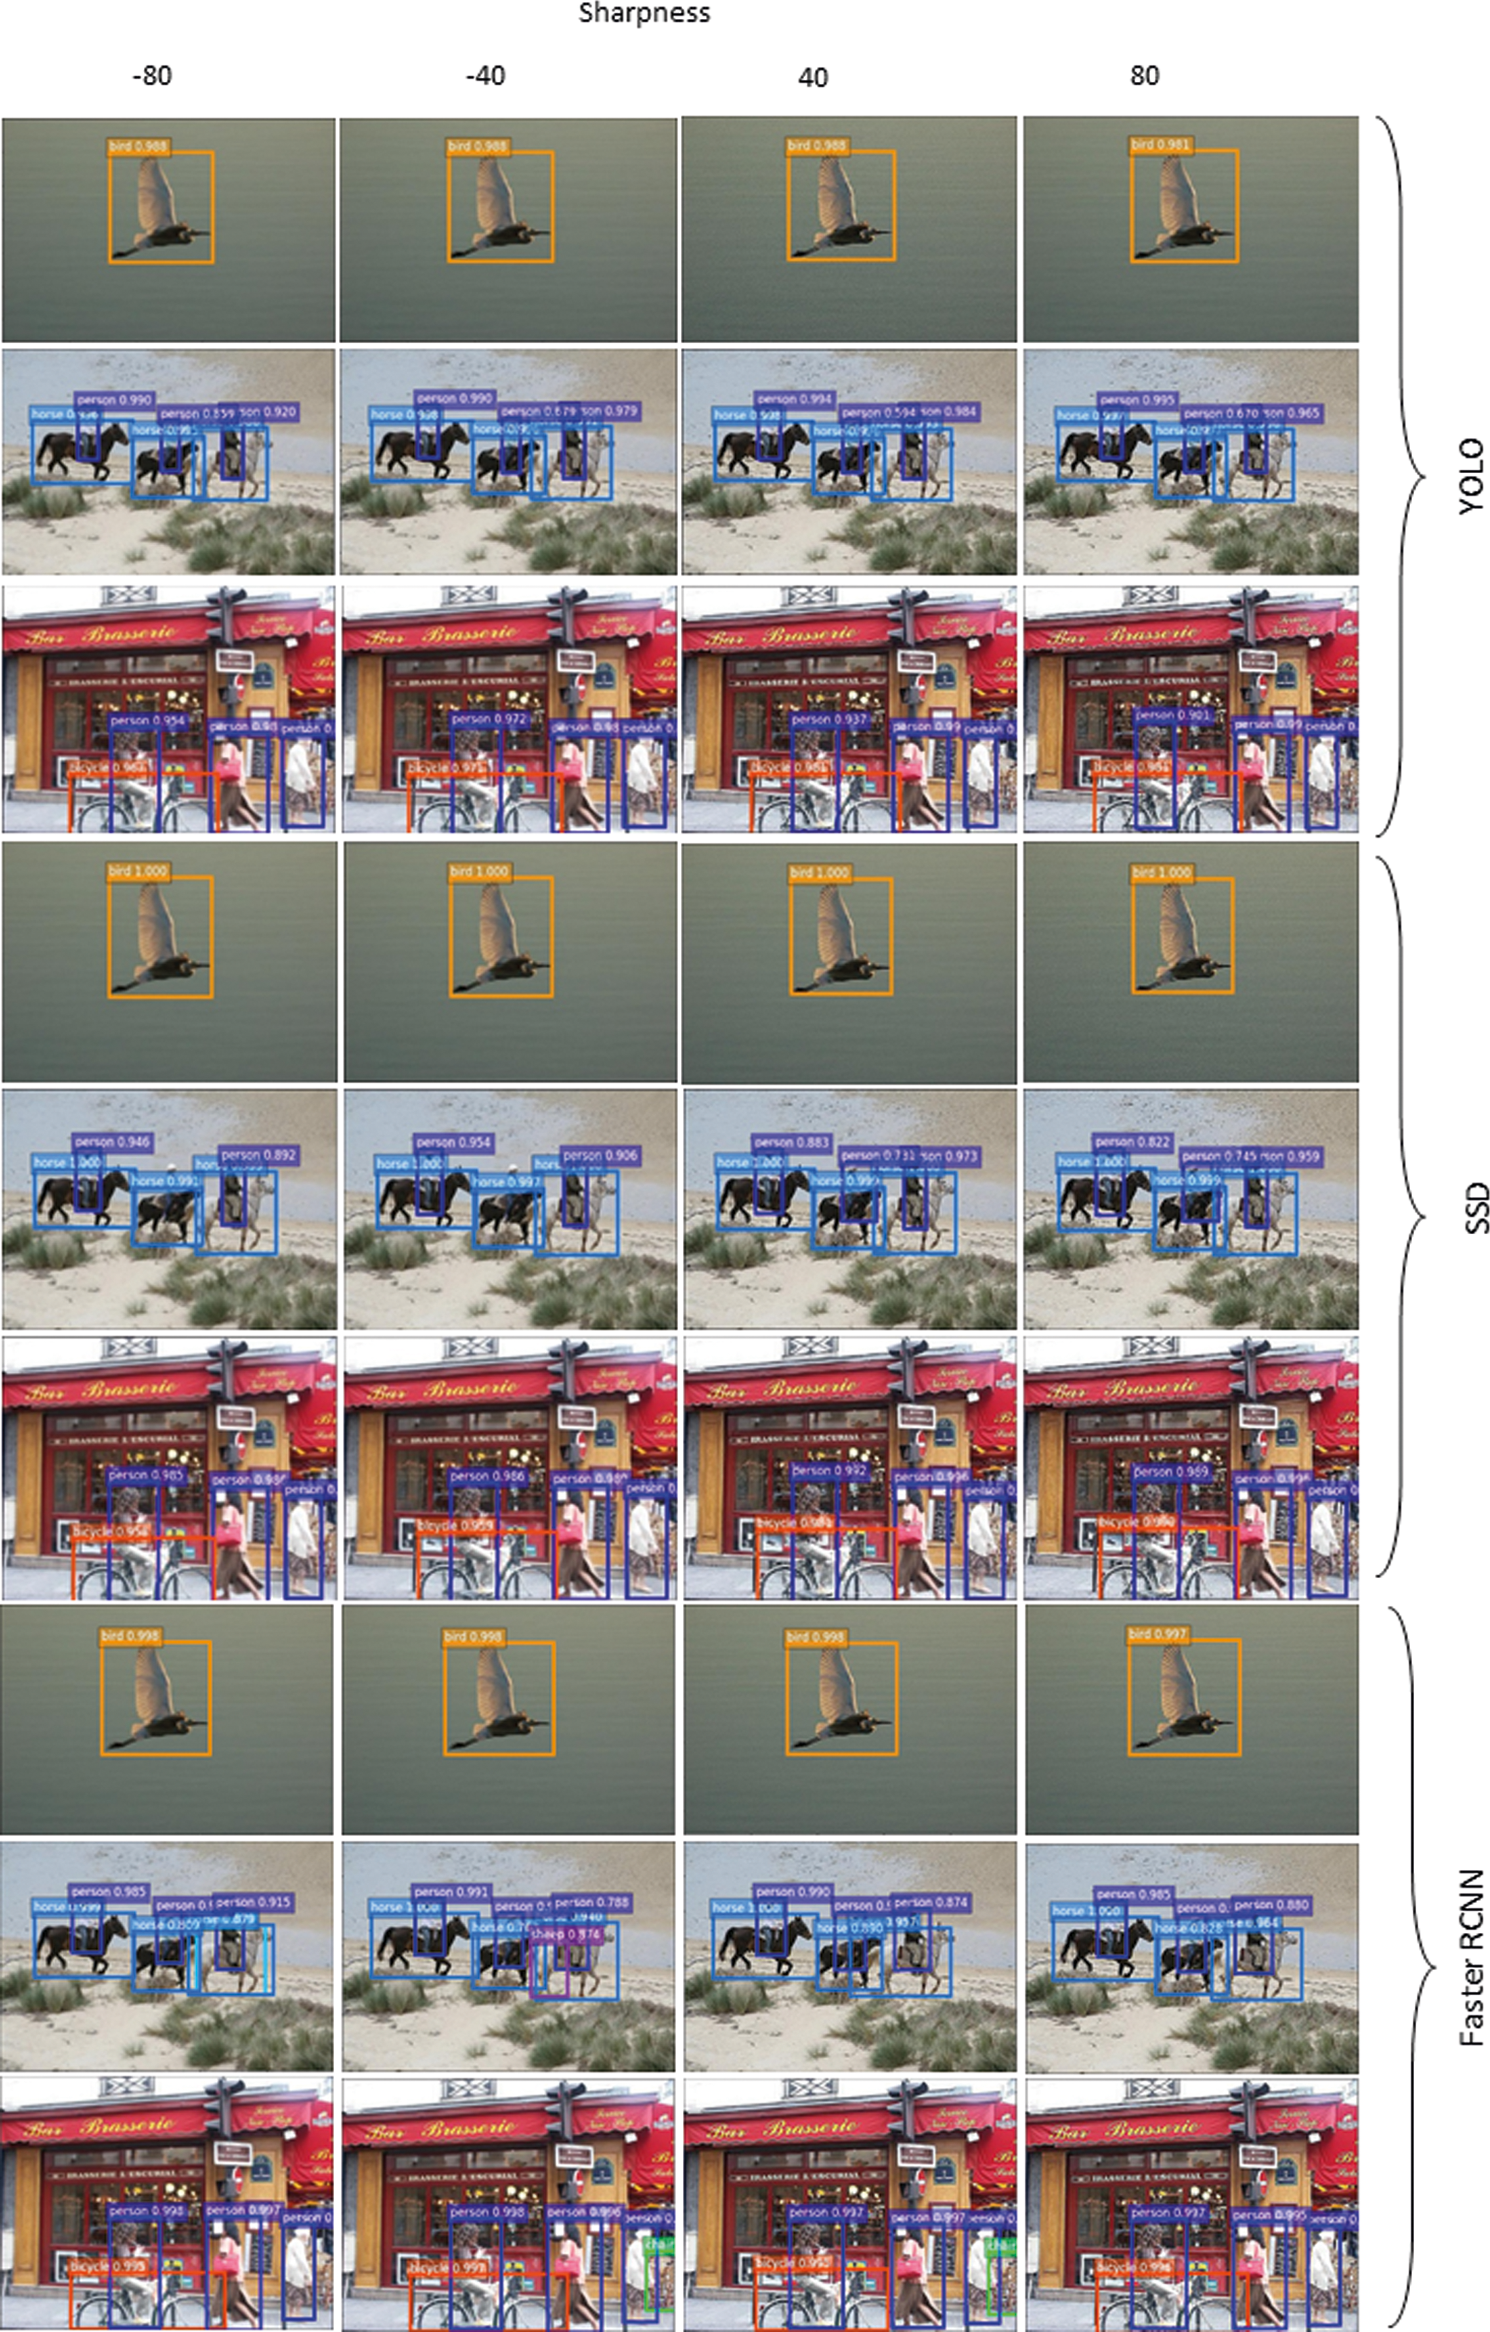
Figure 4: Result of object detection with varying image sharpness for SSD, YOLOv3, and Faster RCNN models
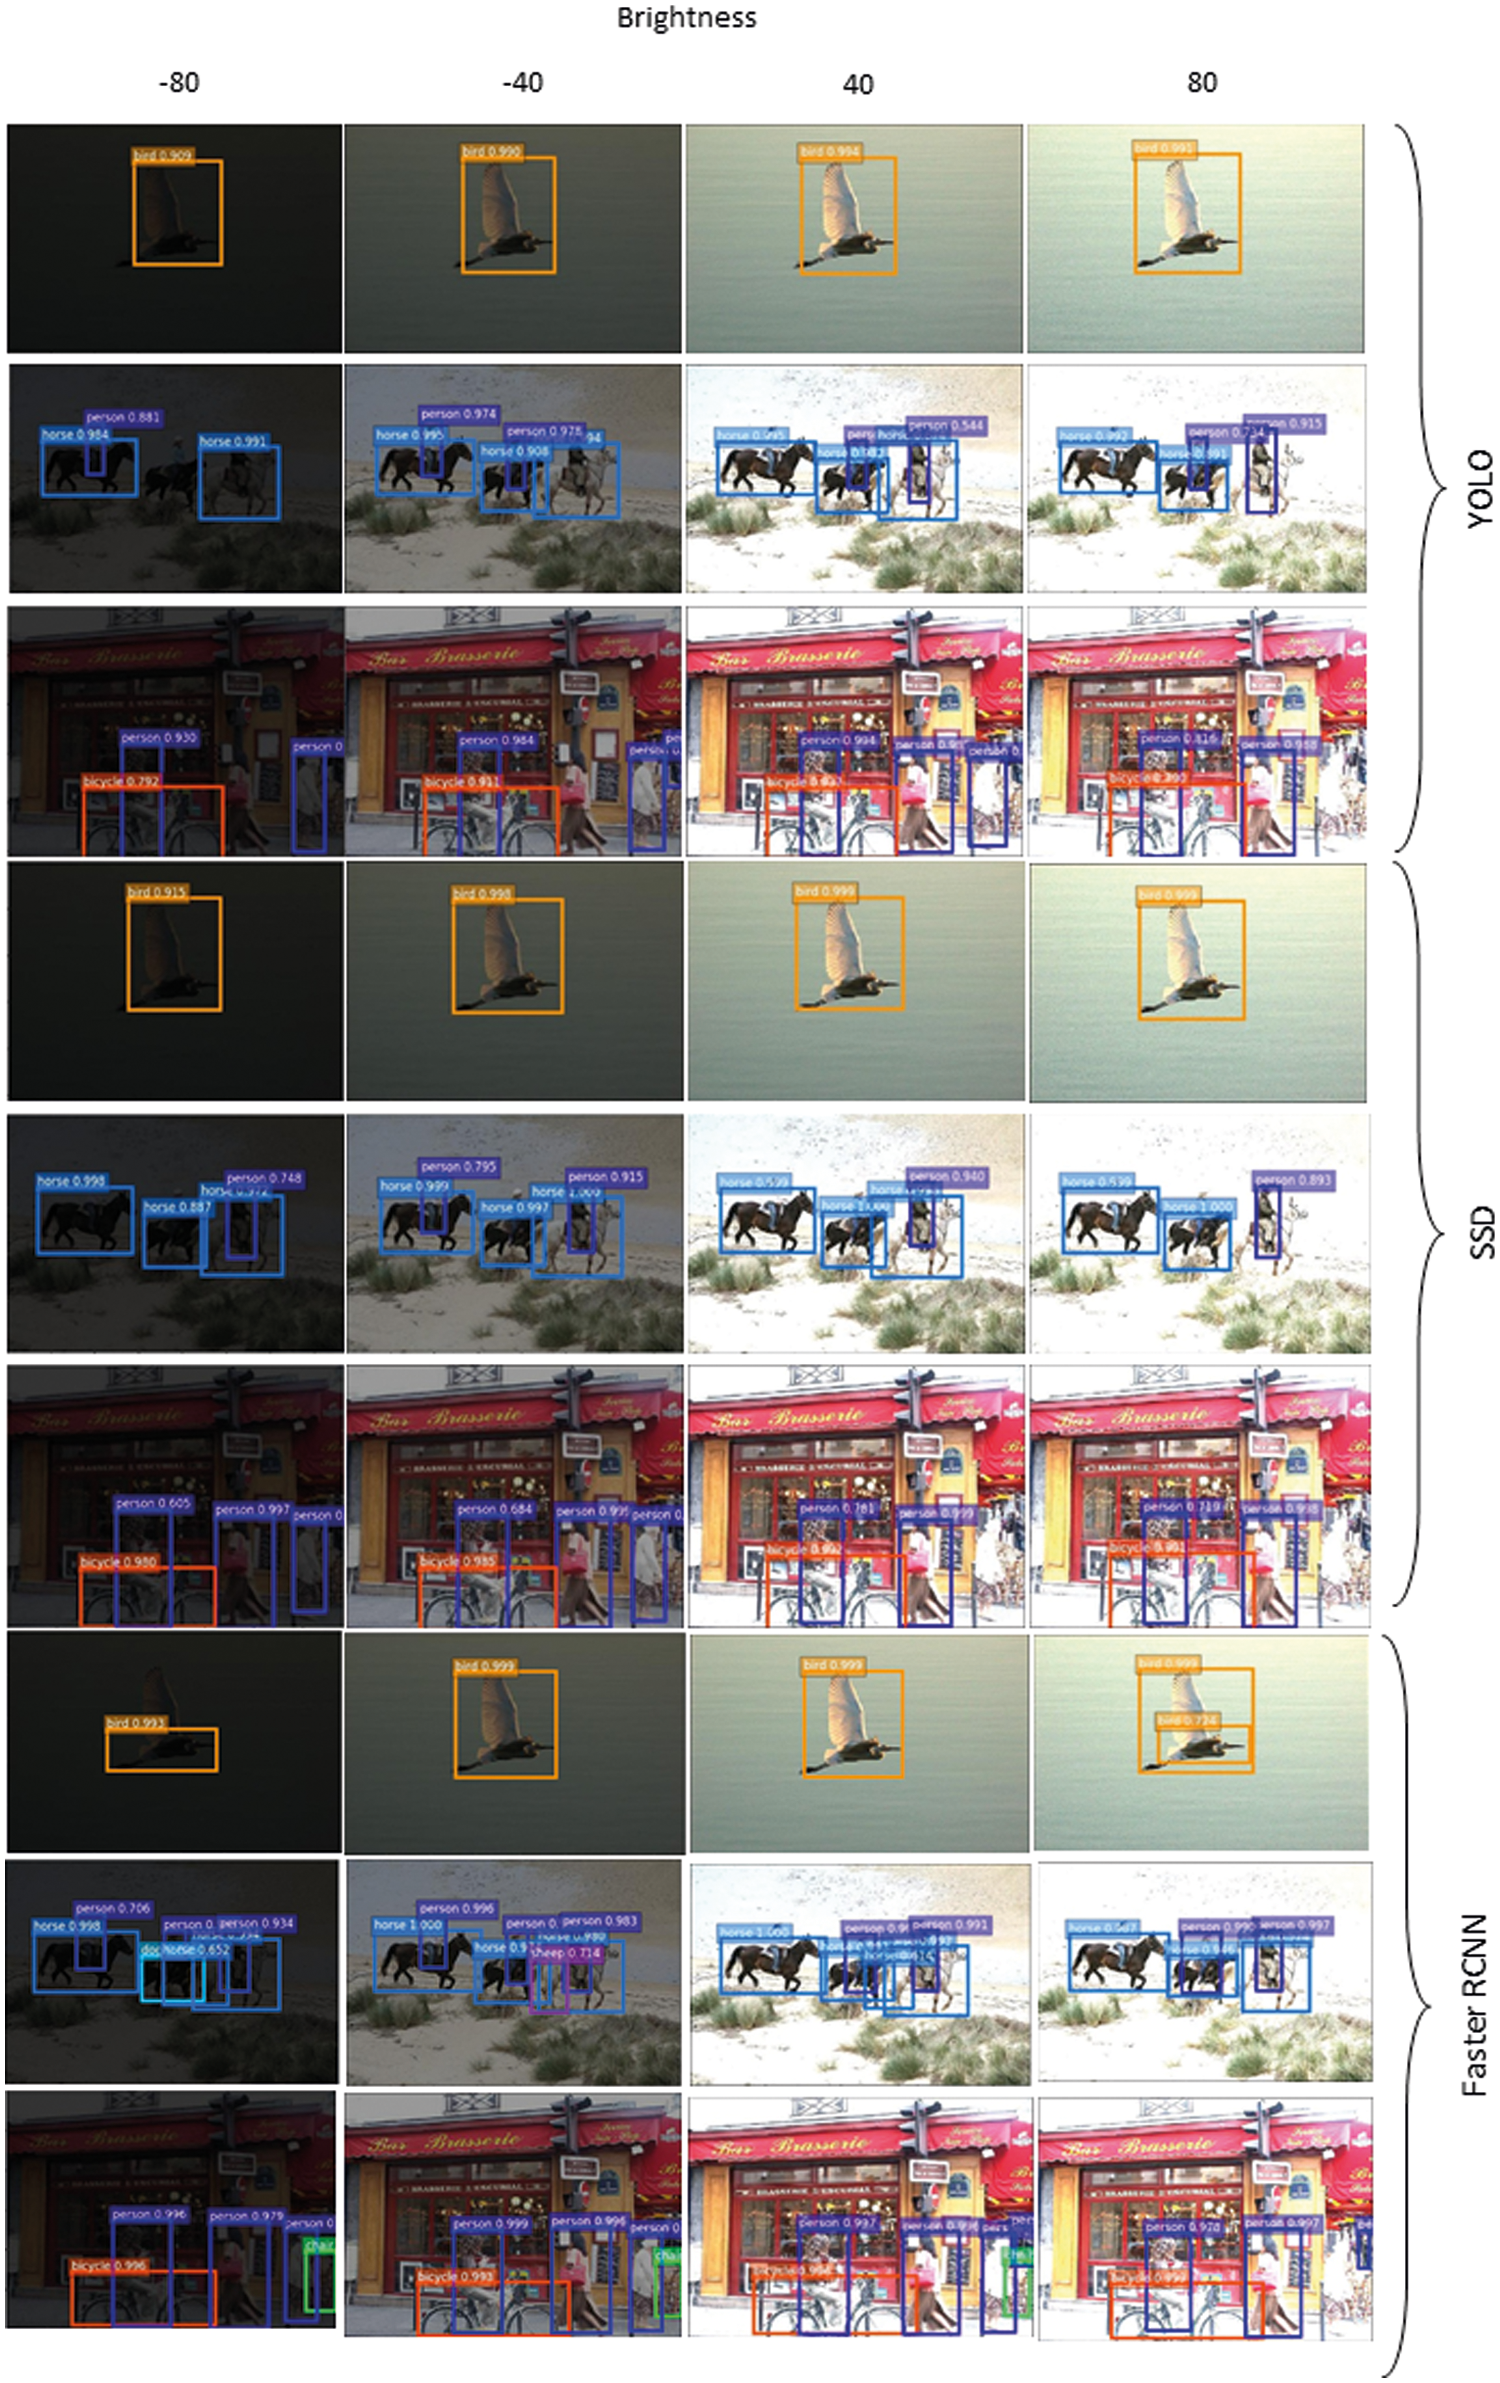
Figure 5: Result of object detection with varying image brightness for SSD, YOLOv3, and Faster RCNN models
Fig. 6 shows the precision-recall curve for all the classes for the three models (SSD, YOLOv3, and FasterRCNN) within the brightness range of −80% and 80%. The images of the test dataset were augmented individually with the respective photometric variation and evaluated with their respective models. The overall accuracy for each CNN model decreased with the change in the photometric variation. The situation made it difficult to select the augmentation range for brightness or sharpness. Therefore, we checked the mAP result of the individual classes from the PASCAL dataset.


Figure 6: Precision × recall curve result for the 20 classes in PASCAL VOC 2007 dataset with varying brightness
From Figs. 7–9, it can be seen that the difference(Δ) of the brightness percentage between the original and photometrically augmented model is high with −80% and 80% brightness of YOLOv3 and SSD, while F-RCNN showed less precision with −80%, 80%, and −40%. Similarly, the precision decreased with −40% and −80% sharpness. Considering these results, we selected four different training schemes to evaluate the three CNN models. Apart from original and random augmentation, the following augmentation groups were used for evaluation:
• Augmented Dataset (Brightness: 80%)
• Augmented Dataset (Brightness: −40%)
• Augmented Dataset (Brightness: 80% + Sharpness: −40%)
• Augmented Dataset (Brightness: −40% + Sharpness: −40%)
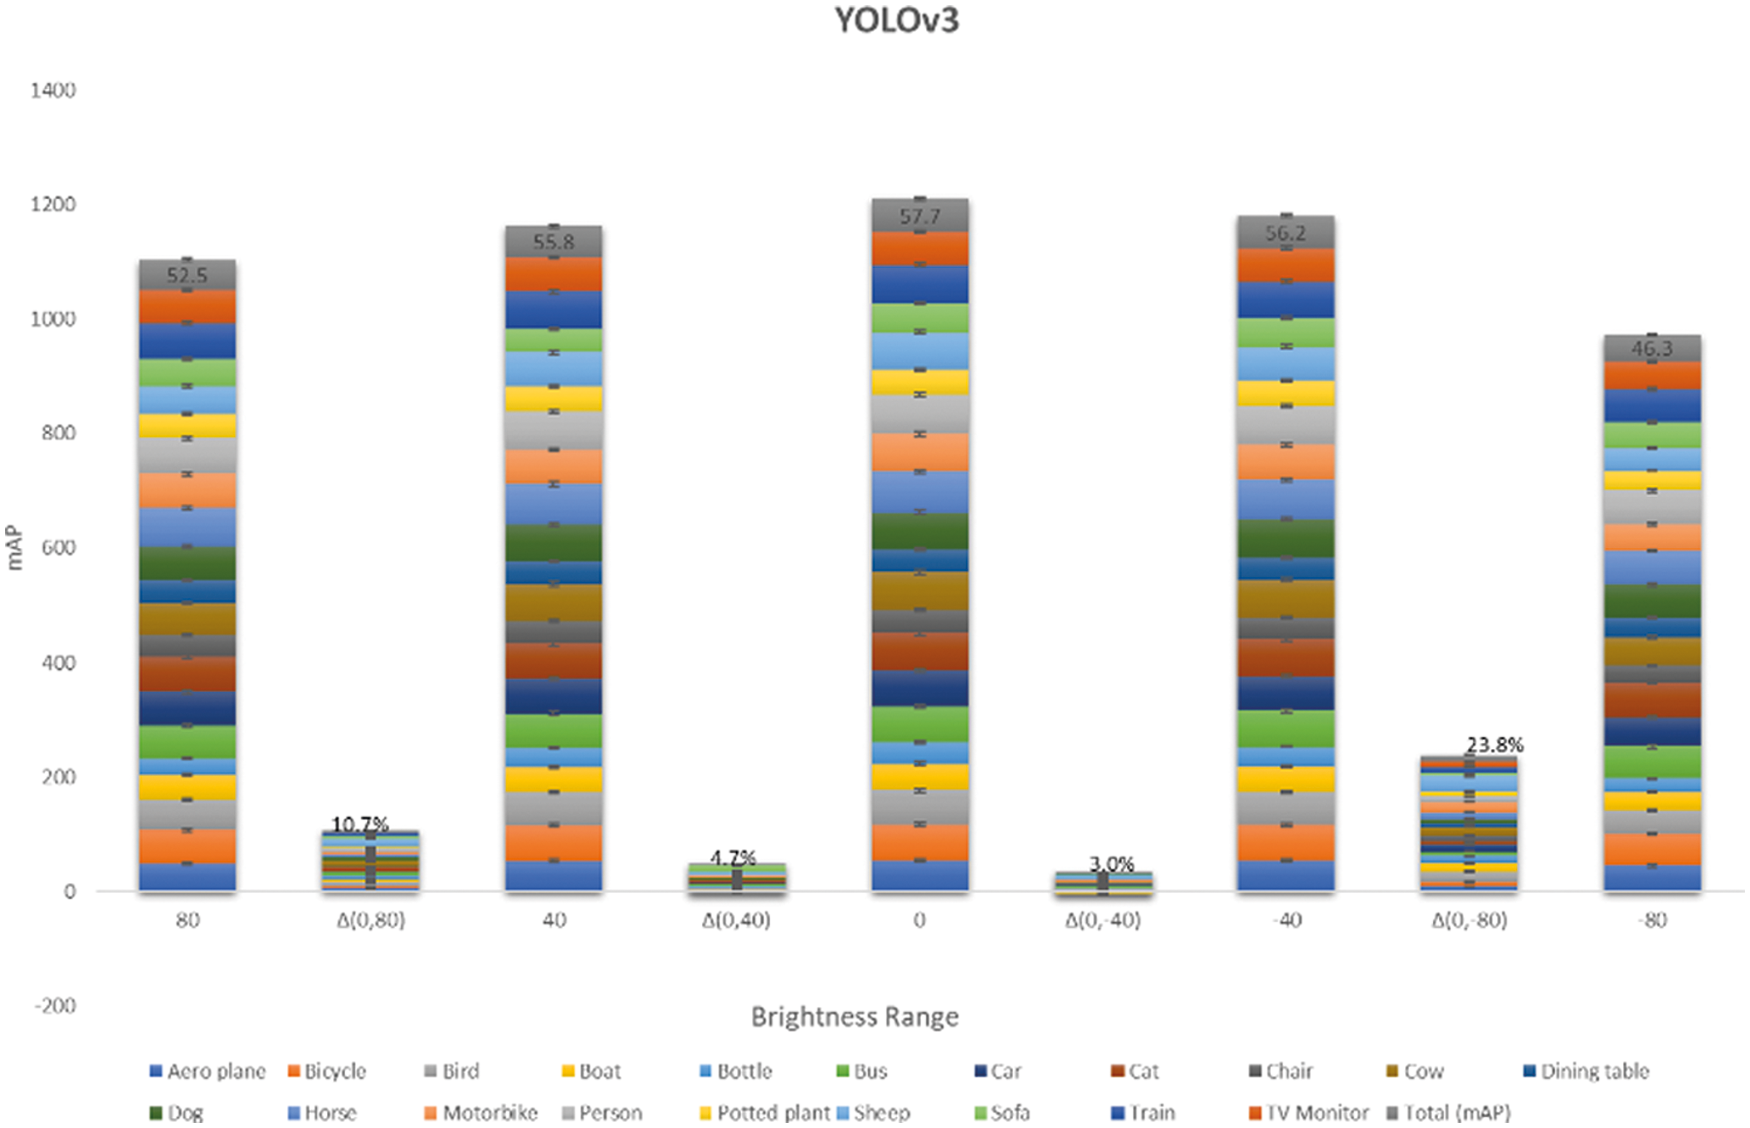
Figure 7: Mean Average Precision result for 20 classes in PASCAL VOC dataset for YOLOv3 model with varying levels of brightness

Figure 8: Mean Average Precision result for 20 classes in PASCAL VOC dataset for Faster R-CNN model with varying levels of brightness
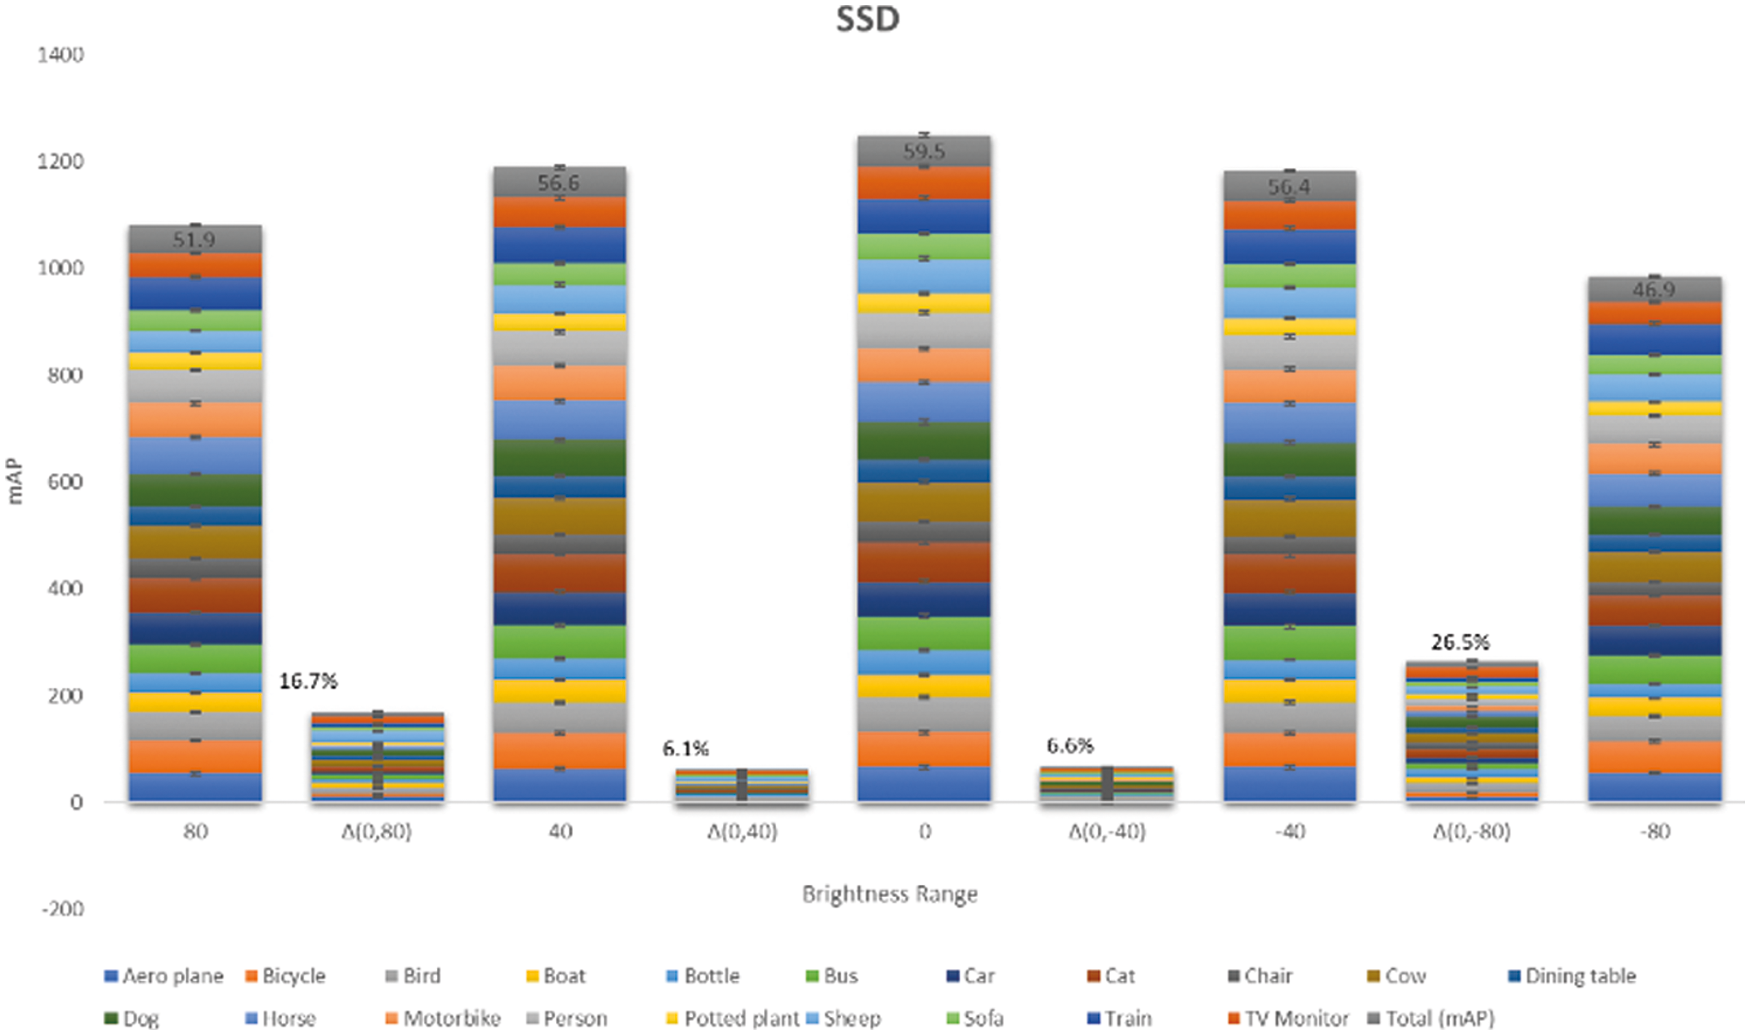
Figure 9: Mean Average Precision result for 20 classes in PASCAL VOC dataset for SSD model with varying levels of brightness
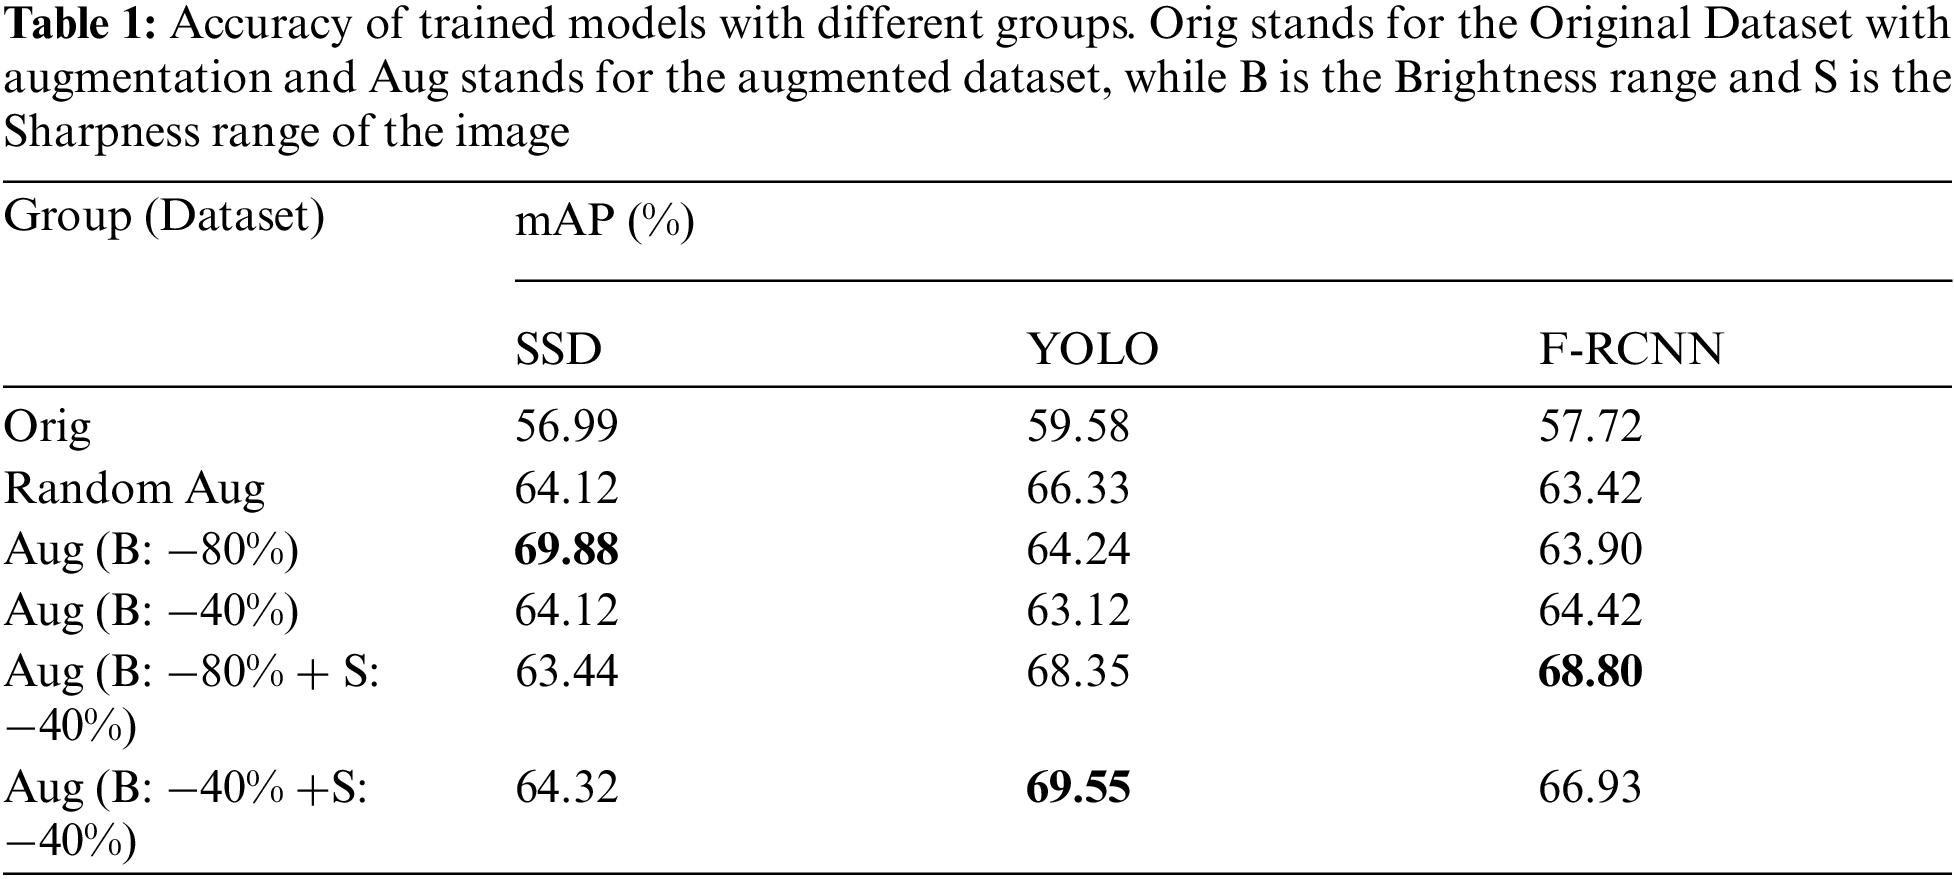
The results across the three groups are tabulated in Tab. 1. It can be seen that the photometrically balanced dataset for the respective models improved their accuracy, compared with the original model. All groups show improvement in the precision calculation, but the key is identifying the adaptive augmentation for both dataset and CNN model. Indeed, the random augmentation yields high performance compared to the original dataset. However, the adaptive augmentation can produce higher performance with less cost, time and memory. In group three, the accuracy significantly increased from 57.72% to 68.80% for the F-RCNN model, but group three did not have the highest accuracy for the SSD and YOLO models. SSD showed high precision with group five and the YOLO model showed high precision with group four. The results show that the adaptive augmentation range for each image characteristic will create a photometrically balanced dataset to improve the performance of the object detection, irrespective of the model or random augmentation.
We here showed that object detection with photometric variation suffers severe performance impairments based on CNN models. The accuracy rates of each model with different levels of sharpness and brightness are shown in Figs. 5 and 6, respectively. The accuracy result shows that a photometrically balanced dataset needs to be created with respect to the model. Most researchers stipulate the importance of selecting the best CNN method for object detection. Our study did not focus on the selection of a CNN algorithm by comparing the results with accuracy. Instead, we discussed the difference between the model accuracy related to its characteristics, which might help in identifying the perfect range of augmentation to create a balanced dataset. To date, there are only a few researchers that focus on image characteristics such as color balancing [8] and hue difference [22], especially in image classification. However, in the object detection method, the focus on image characteristics has been neglected.
Compared to the sharpness characteristic, the loss is high with varying brightness. Therefore, the brightness-adjusted images were taken into consideration for a detailed explanation that includes all 20 classes from the PASCAL VOC dataset within the range of −80% and 80% for the SSD model. To the best of our knowledge, the image characteristic has not been considered for the evaluation of the dataset. Each class produces different mAP results with different image characteristics for the same SSD model, assuring the importance of the image characteristics.
Performance comparison of the evaluation dataset with and without the test cases has given a detailed knowledge and importance towards the preparation of the dataset. Research questions that motivated the study are explained with the experimental result.
RQ1: Can the random augmentation on photometric change yield high performance?
We compared the images with photometric variation across different CNN models as shown in Figs. 4 and 5. The result shows that the performance of Faster RCNN drops more than YOLO and SSD with the change in brightness and sharpness. Cubuk et al. [38] mentioned that the random augmentation increases the performance to 1.0%–1.3%, while our adaptive augmentation can increase the performance to 10%–12%. Although the compared datasets are different, the result shows a satisfying performance with adaptive augmentation. Also, from Tab. 1, we can see that random augmentation shows acceptable accuracy but it can be a disadvantage for a specific dataset where the dataset mostly deals with night-time images.
RQ2. How effective is the random augmentation related to cost, size and time?
The main disadvantages of augmentation include computing cost, additional memory, and time consumption. Tab. 1 explains that regardless of the disadvantages, random augmentation can increase performance but is not as effective as adaptive augmentation. With the scope of the dataset, algorithm, and its environment, the augmentation should be robust and correlative. Our proposal can greatly reduce the cost, time and memory, compared to the existing technique of random augmentation [14].
RQ3. Is it reasonable to use the same photometric augmentation index for all the datasets, irrespective of CNN algorithms? Will the performance level retain?
Most researchers focus on the improvement of the algorithm which results in many new image processing algorithms to increase the performance [8,39]. Still, the same dataset cannot yield high results on various models. Tab. 1 shows that SSD, YOLOv3 and Faster RCNN give high performance with augmentation Aug (B: −80%), Aug (B: −40% +S: −40%) and Aug (B: 80% + S: −40%) respectively. It reminds the necessity of adaptive augmentation to the respective dataset and the chosen algorithm.
RQ4. What if the model shows poor performance in safety-related industries like health care, biometric or national defense?
In recent years, pattern recognition has been involved in many high platforms such as nuclear energy, security, and medical facilities. Machine learning algorithms are accepted, thanks to their advanced methods and reliability. Hence, the mismatch of the dataset and the algorithm, along with augmentation can cause a major in high-risk areas. To emphasis the importance of the issue, the paper compares the result of the photometrically augmented image with the actual image on different CNN algorithms. To create a risk-free reliable environment, the dataset and algorithm need to be more adaptive.
With the results from 4952 test dataset images on the different range of image characteristics such as brightness and sharpness on three models, we also identify the following points:
• Image background with fewer noises is not affected by the varying image characteristics;
• The YOLOv3 and SSD models show a satisfactory result with small object detection, irrespective of varying image characteristics;
• It is inappropriate to conclude the accuracy of the test results with an imbalanced training image with various image characteristics.
Although the review given by [40–42] shows the high accuracy of detection with the SSD and YOLOv3 models, the result varies with the indulgence of image characteristics. Therefore, adaptive photometric augmentation is a necessary standard for any object detection model. Regrettably, we couldn’t establish a fixed range of photometric variation for each model. Nevertheless, the research topic has been focused on the standardization of the dataset for the respective CNN algorithms. In this context, we strongly propose that the preparation of the training dataset needs to be adaptive between the dataset and the model to yield high performance.
The current progress in technology proves that the CNN algorithm is so flexible and fast in object detection and image classification. However, the results are insignificant when there is a lack of a balanced dataset either in a feature-based or class-based perspective. It is even more suboptimal when the characteristic for one model does not match with the other model. In this work, we have systematically evaluated the importance of image characteristics with a varying range of −80% to 80%. The effectiveness of the object detection for each object detection model such as Faster RCNN, YOLOv3, and SSD cannot be completely proven with few images. Both sharpness and brightness exhibit different results for each model with a varying range of augmented images, implying that there is no fixed range of image characteristics.
To facilitate the performance of object detection, it was demonstrated that the adaptive photometric changes can be effective by grouping the weak index of the photometric characteristics. F-RCNN shows 68.80% with the augmented dataset with a brightness index of 80% and sharpness index of −40%. Similarly, SSD and YOLO show better performances with the augmented dataset with an index range of −80% brightness, and an index range of −40% brightness and −40% sharpness, respectively. In particular, our work explores the relation between the CNN models’ robustness and the photometric image augmentation, which provides insights on improving performance. For future work, we would like to verify the result with the real application and expand our scope of features selection and standardize the photometric range for the dataset preparation.
Funding Statement: The authors received no specific funding for this study.
Conflicts of Interest: The authors declare that they have no conflicts of interest to report regarding the present study.
1. A. Krizhevsky, I. Sutskever and G. Hinton, “Imagenet classification with deep convolutional neural networks,” Advances in Neural Information Processing Systems, vol. 25, pp. 1097–1105, 2012. [Google Scholar]
2. K. Simonyan and A. Zisserman, “Very deep convolutional networks for large-scale image recognition,” arXiv preprint, arXiv: 1409.1556, 2014. https://arxiv.org/abs/1409.1556. [Google Scholar]
3. B. Zhou, A. Lapedriza, J. Xiao, A. Torralba and A. Oliva, “Learning deep features for scene recognition using places database,” Advances in Neural Information Processing Systems (NIPS), vol. 27, pp. 1–9, 2014. [Google Scholar]
4. A. Ullah, K. Muhammad, I. U. Haq and S. W. Baik, “Action recognition using optimized deep autoencoder and CNN for surveillance data streams of non-stationary environments,” Future Generation Computer Systems, vol. 96, no. 2, pp. 386–397, 2019. [Google Scholar]
5. M. Coşkun, A. Uçar, Ö. Yildirim and Y. Demir, “Face recognition based on convolutional neural network,” in 2017 Int. Conf. on Modern Electrical and Energy Systems (MEES), New York, IEEE, pp. 376–379, 2017. [Google Scholar]
6. Y. Moroto, K. Maeda, T. Ogawa and M. Haseyama, “Tensor-based emotional category classification via visual attention-based heterogeneous cnn feature fusion,” Sensors, vol. 20, no. 7, pp. 2146, 2020. [Google Scholar]
7. D. Li, L. Deng, B. B. Gupta, H. Wang and C. Choi, “A novel CNN based security guaranteed image watermarking generation scenario for smart city applications,” Information Sciences, vol. 479, no. 2, pp. 432–447, 2019. [Google Scholar]
8. S. Bianco, C. Cusano, P. Napoletano and R. Schettini, “Improving CNN-based texture classification by color balancing,” Journal of Imaging, vol. 3, no. 3, pp. 33, 2017. [Google Scholar]
9. S. Sivamani, S. I. Chon and J. H. Park, “Investigating and suggesting the evaluation dataset for image classification model,” IEEE Access, vol. 8, pp. 173599–173608, 2020. [Google Scholar]
10. M. Nilashi, O. Ibrahim, M. Dalvi, H. Ahmadi and L. Shahmoradi, “Accuracy improvement for diabetes disease classification: A case on a public medical dataset,” Fuzzy Information Engineering, vol. 9, no. 3, pp. 345–357, 2017. [Google Scholar]
11. C. Kolias, G. Kambourakis, A. Stavrou and S. Gritzalis, “Intrusion detection in 802.11 networks: empirical evaluation of threats and a public dataset,” IEEE Communications Surveys & Tutorials, vol. 18, no. 1, pp. 184–208, 2015. [Google Scholar]
12. M. Everingham, L. Van Gool, C. K. Williams, J. Winn and A. Zisserman, “The pascal visual object classes (VOC) challenge,” International Journal of Computer Vision, vol. 88, no. 2, pp. 303–338, 2010. [Google Scholar]
13. D. Yu, H. Zhang, W. Chen, J. Yin and T.-Y. Liu, “How does data augmentation affect privacy in machine learning?,” Proceedings of the AAAI Conference on Artificial Intelligence, vol. 35, no. 12, pp. 10746–10753, 2021. [Google Scholar]
14. A. Muquri and S. Konstholm, “Data augmentation and related opportunity cost for managing the contemporary data sparsity,” 2021. https://kth.diva-portal.org/smash/get/diva2:1594672/FULLTEXT01.pdf. [Google Scholar]
15. F. Bianconi, R. W. Harvey, P. Southam and A. Fernández, “Theoretical and experimental comparison of different approaches for color texture classification,” Journal of Electronic Imaging, vol. 20, no. 4, pp. 043006, 2011. [Google Scholar]
16. M. A. Oskoei and H. Hu, “A survey on edge detection methods,” University of Essex, UK, vol. 33, 2010. https://citeseerx.ist.psu.edu/viewdoc/download?doi=10.1.1.167.1515&rep=rep1&type=pdf.. [Google Scholar]
17. F. S. Khan, R. M. Anwer, J. Van De Weijer, M. Felsberg and J. Laaksonen, “Compact color-texture description for texture classification,” Pattern Recognition Letters, vol. 51, pp. 16–22, 2015. [Google Scholar]
18. S. S. Sapkale and M. P. Patil, “Material classification using color and texture features,” in Int. Conf. on Recent Trends in Image Processing and Pattern Recognition, Germany, Springer, pp. 49–59, 2018. [Google Scholar]
19. C. Cusano, P. Napoletano and R. Schettini, “Evaluating color texture descriptors under large variations of controlled lighting conditions,” Journal of the Optical Society of America A, vol. 33, no. 1, pp. 17–30, 2016. [Google Scholar]
20. N. Ye, K. Wolski and R. K. Mantiuk, “Predicting visible image differences under varying display brightness and viewing distance,” in Proc. of the IEEE/CVF Conf. on Computer Vision and Pattern Recognition, Long Beach, CA, USA, pp. 5434–5442, 2019. [Google Scholar]
21. M. Seifi, X. Song, D. Muselet and A. Trémeau, “Color texture classification across illumination changes,” in Conf. on Colour in Graphics, Imaging, and Vision, Springfield, Society for Imaging Science and Technology,2010, pp. 332–337, 2010. [Google Scholar]
22. C. Cusano, P. Napoletano and R. Schettini, “Combining local binary patterns and local color contrast for texture classification under varying illumination,” Journal of the Optical Society of America A, vol. 31, no. 7, pp. 1453–1461, 2014. [Google Scholar]
23. P. Ke, C. Jung and Y. Fang, “Perceptual multi-exposure image fusion with overall image quality index and local saturation,” Multimedia Systems, vol. 23, no. 2, pp. 239–250, 2017. [Google Scholar]
24. C. Cusano, P. Napoletano and R. Schettini, “Combining multiple features for color texture classification,” Journal of Electronic Imaging, vol. 25, no. 6, pp. 061410, 2016. [Google Scholar]
25. R. Ahmad, Y. Ding and O. P. Simonetti, “Edge sharpness assessment by parametric modeling: Application to magnetic resonance imaging,” Concepts in Magnetic Resonance Part A, vol. 44, no. 3, pp. 138–149, 2015. [Google Scholar]
26. S. Bezryadin, P. Bourov and D. Ilinih, “Brightness calculation in digital image processing,” in Int. Symp. on Technologies for Digital Photo Fulfillment, Springfield, Society for Imaging Science and Technology, 2007, pp. 10–15, 2007. [Google Scholar]
27. J. Redmon and A. Farhadi, “Yolov3: An incremental improvement,” arXiv preprint arXiv:02767, 2018. https://arxiv.org/abs/1804.02767. [Google Scholar]
28. S. Ren, K. He, R. Girshick and J. Sun, “Faster R-CNN: towards real-time object detection with region proposal networks,” IEEE Transactions on Pattern Analysis Machine Intelligence, vol. 39, no. 6, pp. 1137–1149, 2016. [Google Scholar]
29. S. M. Abbas and S. N. Singh, “Region-based object detection and classification using faster R-CNN,” in 2018 4th Int. Conf. on Computational Intelligence & Communication Technology (CICT), New Jersey, IEEE, pp. 1–6, 2018 [Google Scholar]
30. J. Gao, Z. Yang and R. Nevatia, “Cascaded boundary regression for temporal action detection,” arXiv preprint arXiv:01180, 2017. [Google Scholar]
31. X. Dai, B. Singh, G. Zhang, L. S. Davis and Y. Qiu Chen, “Temporal context network for activity localization in videos,” in Proc. of the IEEE Int. Conf. on Computer Vision, Venice, Italy, pp. 5793–5802, 2017. https://www.computer.org/csdl/proceedings-article/iccv/2017/1032f727/12OmNyGbI8q. [Google Scholar]
32. H. Xu, A. Das and K. Saenko, “R-c3d: Region convolutional 3d network for temporal activity detection,” in Proc. of the IEEE Int. Conf. on Computer Vision, Venice, pp. 5783–5792, 2017. [Google Scholar]
33. W. Liu, “SSD: Single shot multibox detector,” in European Conf. on Computer Vision, Berlin, Springer, pp. 21–37, 2016. [Google Scholar]
34. C. Chen, M.-Y. Liu, O. Tuzel and J. Xiao, “R-CNN for small object detection,” in Asian Conf. on Computer Vision, Berlin, Springer, pp. 214–230, 2016. [Google Scholar]
35. C.-Y. Fu, W. Liu, A. Ranga, A. Tyagi and A. C. Berg, “Dssd: Deconvolutional single shot detector,” arXiv preprint arXiv:06659, 2017. https://arxiv.org/abs/1701.06659. [Google Scholar]
36. J. Dai, Y. Li, K. He and J. Sun, “R-fcn: Object detection via region-based fully convolutional networks,” in Advances in Neural Information Processing Systems, Red Hook, pp. 379–387, 2016. [Google Scholar]
37. P. V. Vu and D. M. Chandler, “A fast wavelet-based algorithm for global and local image sharpness estimation,” IEEE Signal Processing Letters, vol. 19, no. 7, pp. 423–426, 2012. [Google Scholar]
38. E. D. Cubuk, B. Zoph, J. Shlens and Q. V. Le, “Randaugment: Practical automated data augmentation with a reduced search space,” in Proc. of the IEEE/CVF Conf. on Computer Vision and Pattern Recognition Workshops, Seattle, WA, USA, pp. 702–703, 2020. [Google Scholar]
39. X. Xu, N. Mu, H. Zhang and X. Fu, “Salient object detection from distinctive features in low contrast images,” in 2015 IEEE Int. Conf. on Image Processing (ICIP), New Jersey, IEEE, pp. 3126–3130, 2015. [Google Scholar]
40. N. Aloysius and M. Geetha, “A review on deep convolutional neural networks,” in 2017 Int. Conf. on Communication and Signal Processing (ICCSP), New Jersey, IEEE, pp. 0588–0592, 2017. [Google Scholar]
41. A. Dhillon and G. K. Verma, “Convolutional neural network: A review of models, methodologies and applications to object detection,” Progress in Artificial Intelligence, vol. 9, no. 2, pp. 85–112, 2020. [Google Scholar]
42. W. Rawat and Z. Wang, “Deep convolutional neural networks for image classification: A comprehensive review,” J Neural Computation, vol. 29, no. 9, pp. 2352–2449, 2017. [Google Scholar]
Supplementary Materials

 | This work is licensed under a Creative Commons Attribution 4.0 International License, which permits unrestricted use, distribution, and reproduction in any medium, provided the original work is properly cited. |