DOI:10.32604/cmc.2022.026999
| Computers, Materials & Continua DOI:10.32604/cmc.2022.026999 | |
| Article |
Multi-Scale Attention-Based Deep Neural Network for Brain Disease Diagnosis
1Faculty of Information Technology, College of Computer Science and Technology, Beijing Artificial Intelligence Institute, Beijing University of Technology, Beijing, 100124, China
2Department of Natural and Computing Science, University of Aberdeen, Aberdeen, U.K
*Corresponding Author: Yin Liang. Email: yinliang@bjut.edu.cn
Received: 08 January 2022; Accepted: 02 March 2022
Abstract: Whole brain functional connectivity (FC) patterns obtained from resting-state functional magnetic resonance imaging (rs-fMRI) have been widely used in the diagnosis of brain disorders such as autism spectrum disorder (ASD). Recently, an increasing number of studies have focused on employing deep learning techniques to analyze FC patterns for brain disease classification. However, the high dimensionality of the FC features and the interpretation of deep learning results are issues that need to be addressed in the FC-based brain disease classification. In this paper, we proposed a multi-scale attention-based deep neural network (MSA-DNN) model to classify FC patterns for the ASD diagnosis. The model was implemented by adding a flexible multi-scale attention (MSA) module to the auto-encoder based backbone DNN, which can extract multi-scale features of the FC patterns and change the level of attention for different FCs by continuous learning. Our model will reinforce the weights of important FC features while suppress the unimportant FCs to ensure the sparsity of the model weights and enhance the model interpretability. We performed systematic experiments on the large multi-sites ASD dataset with both ten-fold and leave-one-site-out cross-validations. Results showed that our model outperformed classical methods in brain disease classification and revealed robust inter-site prediction performance. We also localized important FC features and brain regions associated with ASD classification. Overall, our study further promotes the biomarker detection and computer-aided classification for ASD diagnosis, and the proposed MSA module is flexible and easy to implement in other classification networks.
Keywords: Autism spectrum disorder diagnosis; resting-state fMRI; deep neural network; functional connectivity; multi-scale attention module
Brain disease diagnosis is now becoming a new hotspot issue in the research of artificial intelligence and brain science. Noninvasive brain imaging technologies have effectively enhanced the understanding of the neural substrates underlying brain disorders, and may help to reveal the associated biomarkers that can be used for imaging diagnosis. As a non-invasive brain imaging technology, resting-state functional magnetic resonance imaging (rs-fMRI) has been widely applied in brain diseases diagnosis [1,2]. Owing to the expectation of existing interactions between different brain regions, functional connectivity (FC) analysis, which measures the temporal correlations in the fMRI activity between spatially distant brain regions, has become the primary method to analyze rs-fMRI data. Recent studies have shown that many brain diseases, such as autism spectrum disorder (ASD), schizophrenia, and Alzheimer’s disease, are associated with abnormalities in the brain FC patterns [3–5].
With the rapid development of artificial intelligence and data mining techniques, machine learning methods have been employed in recent studies to classify the FC patterns for brain disease diagnosis. As an important feature extraction technique, deep learning models can automatically learn lower-dimensional abstract feature representations from the initial input. Recently, more and more works have applied deep learning methods to the FC-based brain disease classification [6–8]. Among them, auto-encoder (AE) is currently the most widely used model that construct fully connected deep neural network (DNN) for the FC pattern classification. These methods reshape the FC patterns in vector forms as input and commonly need to learn a large number of parameters. Although substantial achievements have been made in the FC pattern classification, these DNN models can cause problems such as slow model convergence and overfitting due to the dense model parameters. Moreover, for the FC pattern, the data at each location represents the strength of functional correlation between different brain regions, which has obvious biological significance. Therefore, exploring robust classification model as well as improving the model interpretability will be benefit to promote the computer-aided brain disease classification and the research of biomarkers for clinical diagnosis.
In this work, we proposed a multi-scale attention-based DNN (MSA-DNN) model to classify the FC patterns for brain disease diagnosis. The model consisted of a backbone classification network based on fully connected structure and a multi-scale attention (MSA) module. For the backbone network, we built a DNN based on AEs to project high-dimensional FC features into a lower-dimensional feature space. We combined both unsupervised and supervised training processes to improve the effectiveness of feature learning. Inspired by the attention mechanism [9,10], we proposed a flexible MSA module that can be embedded between the hidden layers of the backbone network. The MSA module extracted multi-scale features of the FC patterns and added attention weights to the FC features at each position. This ensures that more important FC features are continuously emphasized and less important FC features are continuously suppressed. To verify the effectiveness of the proposed model, we performed systematic experiments on the Autism Brain Imaging Data Exchange (ABIDE) dataset, which aggregated large-scale collections of rs-fMRI data for ASD patients and healthy controls. Ten-fold and leave-one-site-out cross-validations were conducted to examine the classification performance. Moreover, we conducted saliency map analysis to locate the most important FC features correlated to the ASD classification [11].
The main contributions of this paper are summarized as follows:
(1) We proposed a novel MSA-DNN model to classify FC patterns for ASD diagnosis. The model built a DNN with both unsupervised and supervised training steps to improve the effectiveness of feature learning. A flexible MSA module was added between the hidden layers of the DNN model, which can fuse the multi-scale features of the FC patterns to enhance the sparsity of the model weights and improve the model interpretability.
(2) Systematic experiments were conducted on the large-scale multi-sites ABIDE dataset. Results of ten-fold and leave-one-site-out cross-validation experiments indicate the robust classification performance of our MSA-DNN model. We also identified important FC features as biomarkers associated with ASD classification.
(3) This study further extends previous studies on FC-based brain disease classification. The proposed MSA module is flexible and easy to implement, and can be embedded into other classification networks.
The use of non-invasive rs-fMRI has greatly promoted the neuroscience studies, which helps to investigate the pathological mechanism underlying the brain disease as well as to detect the potential diagnostic biomarkers [1,12]. Rs-fMRI can measure blood oxygen level-dependent (BOLD) signal fluctuations to reflect the functional activities of neurons or brain regions, thus can be used to quantify the functional interactions between brain regions. Neuroscience studies have shown that the human brain is a highly interactive system which can perform complex cognition tasks through the interconnections of multiple brain regions. An increasing number of studies have indicated that many brain diseases are associated with interruptions or abnormalities in the FC patterns [13–15].
Machine learning techniques have been widely used in recent rs-fMRI studies to identify the FC pattern differences associated with brain diseases [16–19]. Classical machine-learning methods such as the support vector machine (SVM), logistic regression (LR), and random forest (RF) have been found effective in analyzing the fMRI data. Due to their simple and easy to implement properties, these methods, especially the SVM, have been widely employed as classifiers for the FC pattern classification. For instance, Rosa et al. [18] built a sparse framework with graphical LASSO and L1-norm regularization linear SVM for discriminating the major depressive disorder (MDD). Chen et al. [19] applied SVM to classify the FC patterns constructed from different frequency bands for ASD diagnosis. However, these methods may not able to effectively learn high-level abstract feature representations for the complex FC patterns thus limit the further improvement of their performance. As a promising alternative, deep learning methods can automatically learn multi-level low-dimensional abstract feature representations from the initial input, and have achieved outstanding performance in computer vision, communications, and fog computing [20–24]. Recently, deep learning methods have attracted an increasing attention in computer-aided medical diagnosis [25–27]. Accordingly, adopting DNN to analyze the FC patterns for brain disease classification has become the new trends [6–8]. Among the deep learning methods, AE is commonly employed model that construct fully connected DNN for FC pattern classification. Kim et al. [28] adopted AE with L-1 regularization as pre-training model to initial DNN for the classification of schizophrenia, and obtained lower error rate than SVM. Heinsfeld et al. [8] built a stack AE (SAE) model with two denoising AEs to distinguish the ASD group from the healthy controls, and achieved robust classification performance on the large-scale ASD dataset. In general, these DNNs can extract more informative abstract features to analyze the FC patterns and achieve better classification performance than traditional machine learning methods. However, these DNN models commonly need to train a large amount of model parameters from high-dimensional input FC pattern, which may lead to slow model convergence and overfitting problems. Therefore, study of robust classification model while enhance the sparsity of the model weights may further promote the computer-aided brain disease classification.
In this study, we proposed a novel MSA-DNN model to classify FC patterns for ASD diagnosis. A flexible MSA module was introduced to fuse the multi-scale FC features and enhance the sparsity of model weights. Detailed implementations of our model are described in the following sections.
3.1 Data Acquisition and Preprocessing
In this study, rs-fMRI data were obtained from the large-scale ASD dataset ABIDE (http://fcon_1000.projects.nitrc.org/indi/abide/). ABIDE aggregates previously collected rs-fMRI data with corresponding anatomical and phenotypic information from 17 international sites to make available for data sharing with the broader scientific community. The rs-fMRI data in ABIDE have been widely used in recent research to explore the pathological basis of ASD and potential diagnostic biomarkers. Data preprocessing was performed by the Configurable Pipeline for the Analysis of Connectomes (CPAC) [29], which mainly included slice-time correction, motion correction, spatial registration and normalization, nuisance signal regression, and band-pass filtering (0.01–0.1 Hz). After data check and collation, a total of 989 subjects were included in the subsequent analysis. The phenotypic information of the subjects in this study is summarized in Tab. 1.

3.2 Overview of the Proposed Classification Framework
In this study, we proposed a MSA-DNN model to classify the FC patterns for ASD diagnosis. Fig. 1 shows the overview flowchart of our classification framework. The FC patterns were constructed from the pre-processed rs-fMRI data by correlation analysis, and the network nodes were defined by CC200 brain atlas (Fig. 1a). Considering the high dimensionality of the FC features, we designed a novel DNN model to learn abstract feature representations from the FC patterns for ASD classification. The model consisted of a backbone network based on fully connected structure and a MSA module. For the backbone network, we built a DNN based on AEs to project high-dimensional FC features into a lower-dimensional feature space (Fig. 1b). In addition to the unsupervised learning process, a supervised training step was further employed to improve the effectiveness of feature learning. This was implemented by adding a flexible MSA module between the hidden layers of the backbone network (Fig. 1c). The MSA module fused multi-scale features of the FC patterns and added attention weights to the FC features to continuously emphasize the more important FCs and suppress the less important FCs. Details for each stage are described in the following subsections.
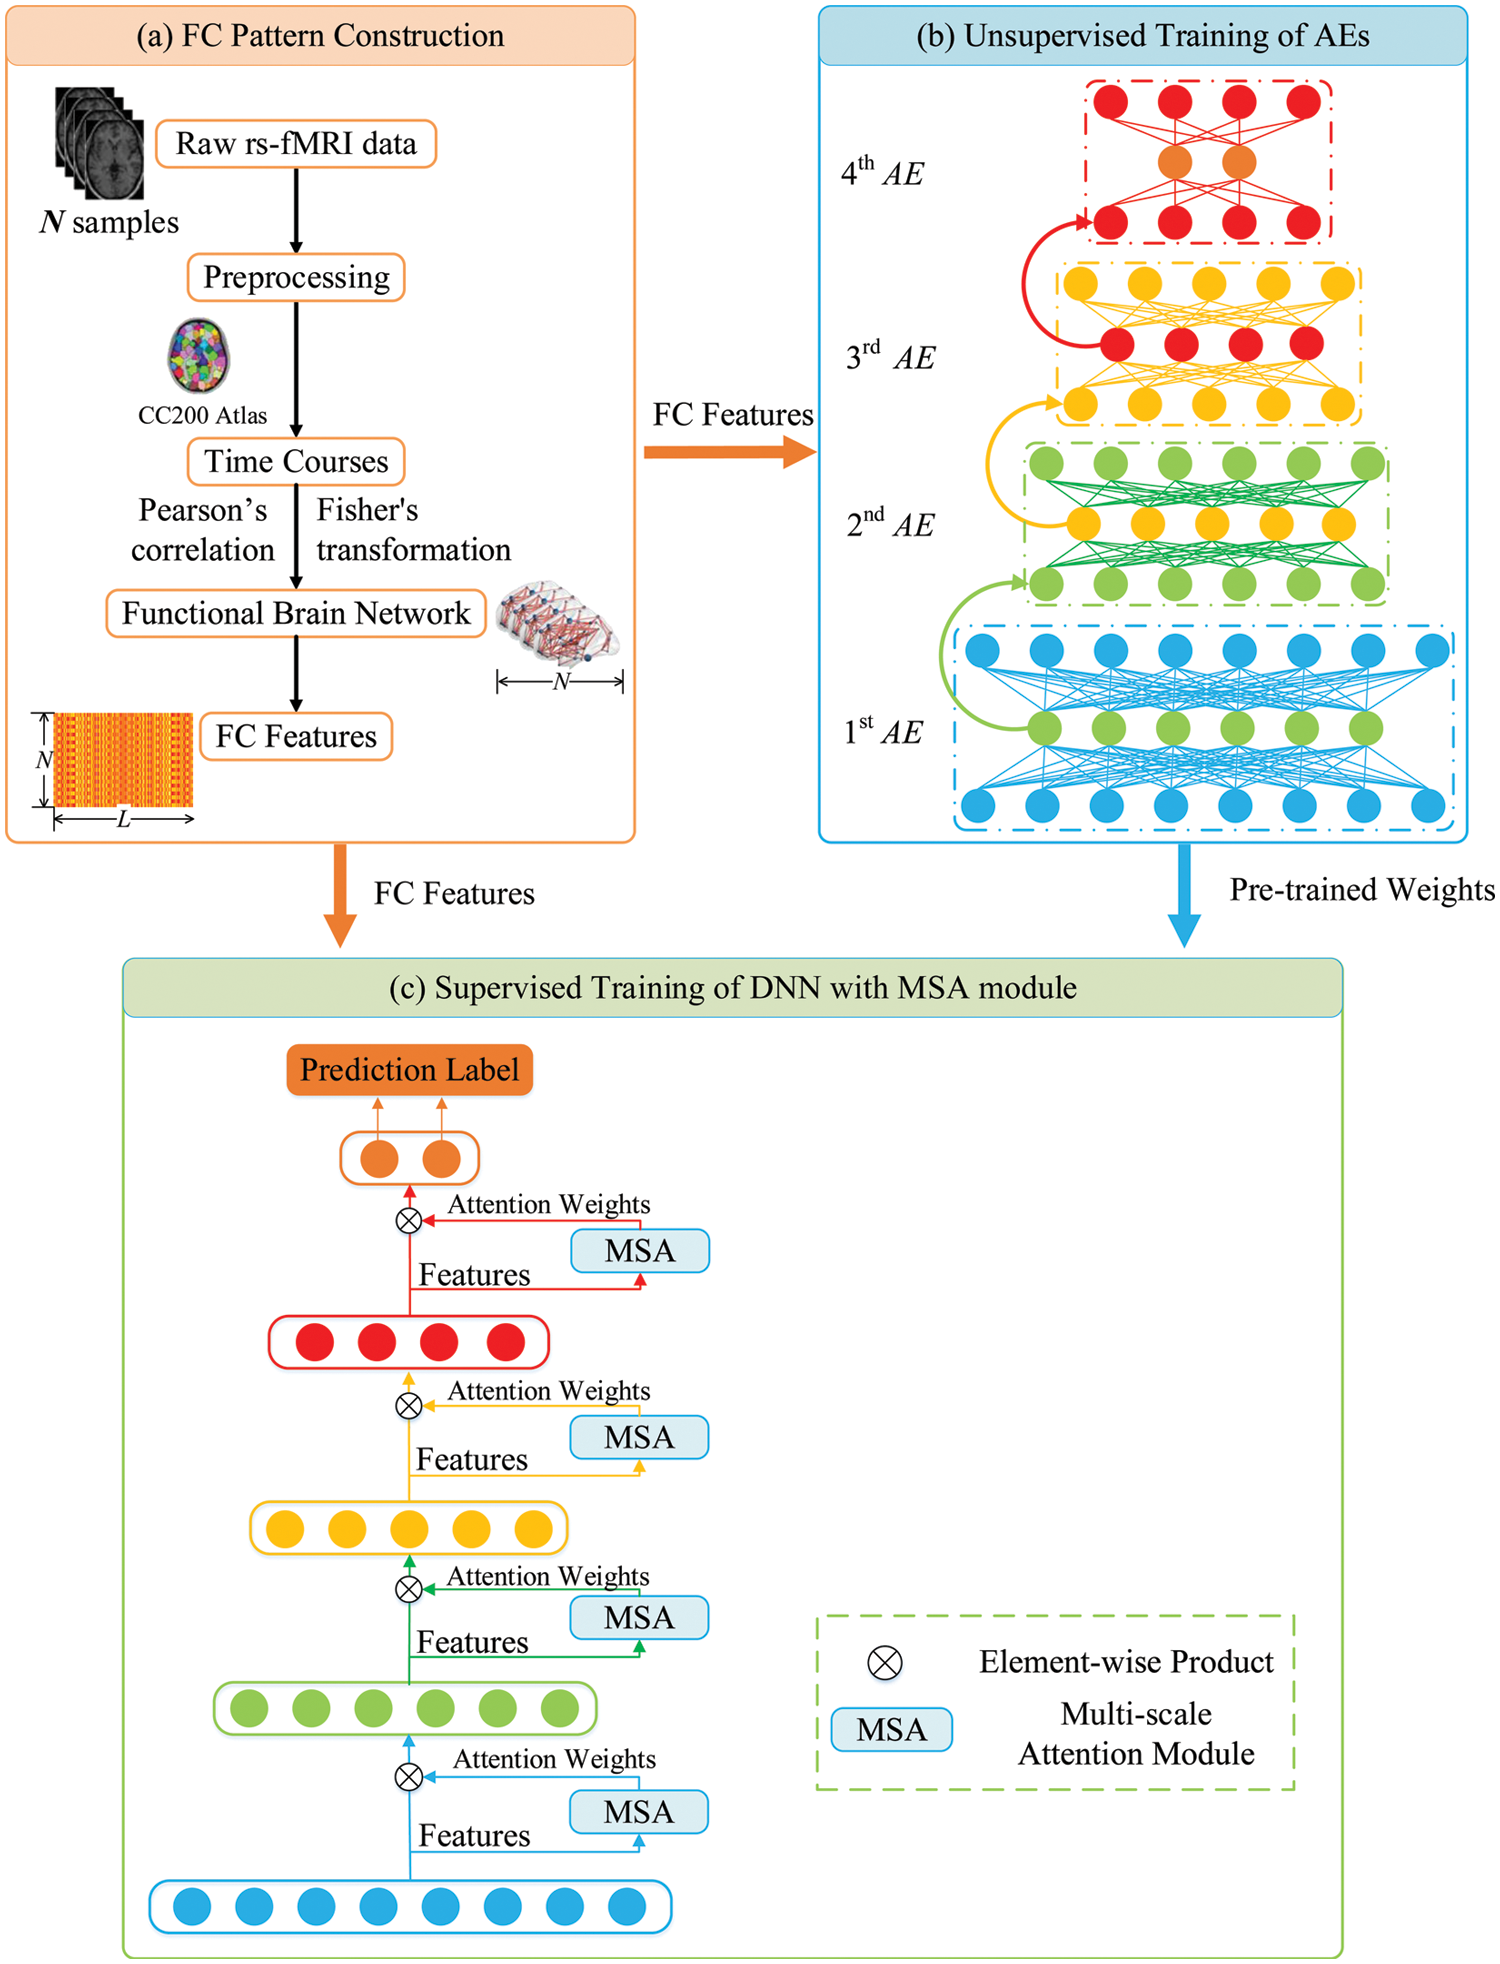
Figure 1: Overview flowchart of the proposed classification framework
3.3 Construction of the FC Patterns
As shown in Fig. 1a, the average time series were extracted from each ROI, and the FC patterns were constructed by the computation of pairwise correlations between the regional-averaged rs-fMRI signals for each brain region pair. The correlations were calculated by Pearson’s correlation coefficients. Assume that
where
3.4 AE-Based Backbone DNN Construction
For the backbone network, we built a DNN model based on AEs to learn abstract feature representations from the initial high-dimensional FC patterns. AE is a neural network model that learns a lower-dimensional feature representation (hidden layer) of the input nodes by encoding and decoding procedures with unsupervised learning (Fig. 2). The purpose of AE training is to reduce the differences between the input data xi and the reconstructed data zi by continuously optimizing the loss function, so that the abstract feature representations can retain maximum useful information.
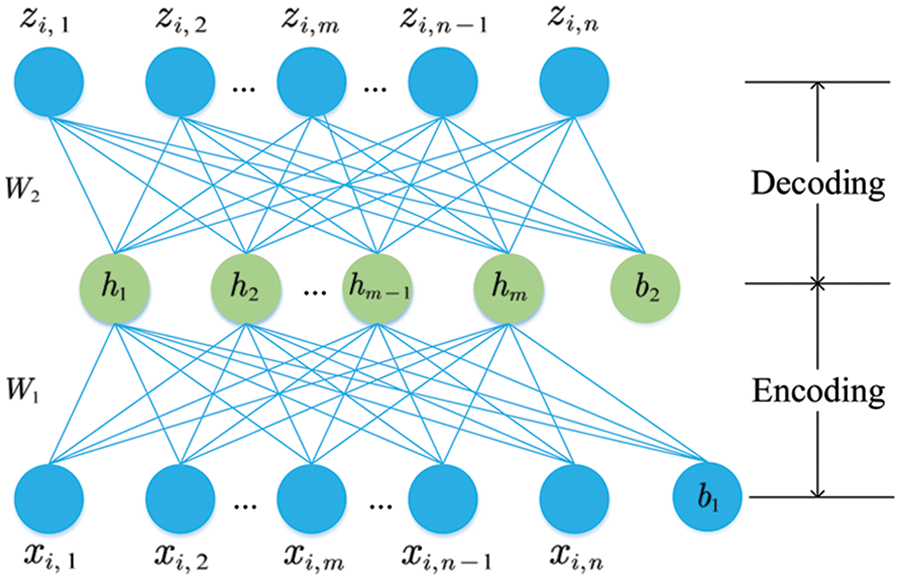
Figure 2: Two phases of the AE training
The error between the input and the reconstructed features can be measured by the mean square error (MSE). Due to the characteristics of high-dimensionality and small sample-size of the FC data, we also used the Kullback-Leibler (KL) divergence to constrain the sparsity of the hidden-layer activation neurons of AE and added the L-2 regularization term to further avoid overfitting. The total loss function in the unsupervised training process can be defined as,
where
In the network training, we firstly used greedy algorithm for unsupervised training of AEs. As shown in Fig. 1b, we trained 4 AEs, each of which was trained independently, with the hidden layer of the current AE became the input in the next AE training. The back-propagation algorithm was used to minimize the loss function in Eq. (2) to obtain the optimal AE parameters, so that the network continuously learned a more generalized abstract feature representation for the FC patterns.
To further enhance the learning and classification performance and improve the model interpretability, we conducted supervised learning to fine-tune the overall network in addition to the unsupervised training process. As shown in Fig. 1c, the pre-trained AEs were stacked to generate the initial DNN and a MSA module was introduced between the hidden layers of the backbone network. More details about the MSA module will be described in the next section. In the supervised training step, an additional layer (labels) was added on the top of the DNN model, and the cross-entropy loss function was used for the supervised fine-tuning of the overall network:
where
In this study, in order to reduce the information loss due to the sharp dimensional reduction between layers, we used denoising AE with sparse penalty in the first AE, and used denoising AE in the other three AEs to increase the robustness of our model. In the supervised training process, we used the Adam optimization algorithm to update the model parameters and employed the learning rate decay strategy in the optimization. The configuration of the backbone DNN is summarized in Tab. 2.

3.5 Multi-Scale Attention (MSA) Module
The attention mechanism simulates the perceptual process of human visual system, which will concentrate on the features with obvious inter-group differences and suppress the features that do not contribute significantly to the classification. For the FC pattern classification, the sample-size of fMRI data is relatively smaller in compare with the massive natural image data, the traditional deep network structure alone may not focus well on the FCs with more significant changes, and thus limits the further improvement of model performance. Therefore, we introduced a flexible MSA module in our DNN model to achieve the purpose of focusing on more discriminative FC features by automatically adjusting the attention weights. This module would further enhance the interpretability of the model, and ensure the sparsity of the network weights.
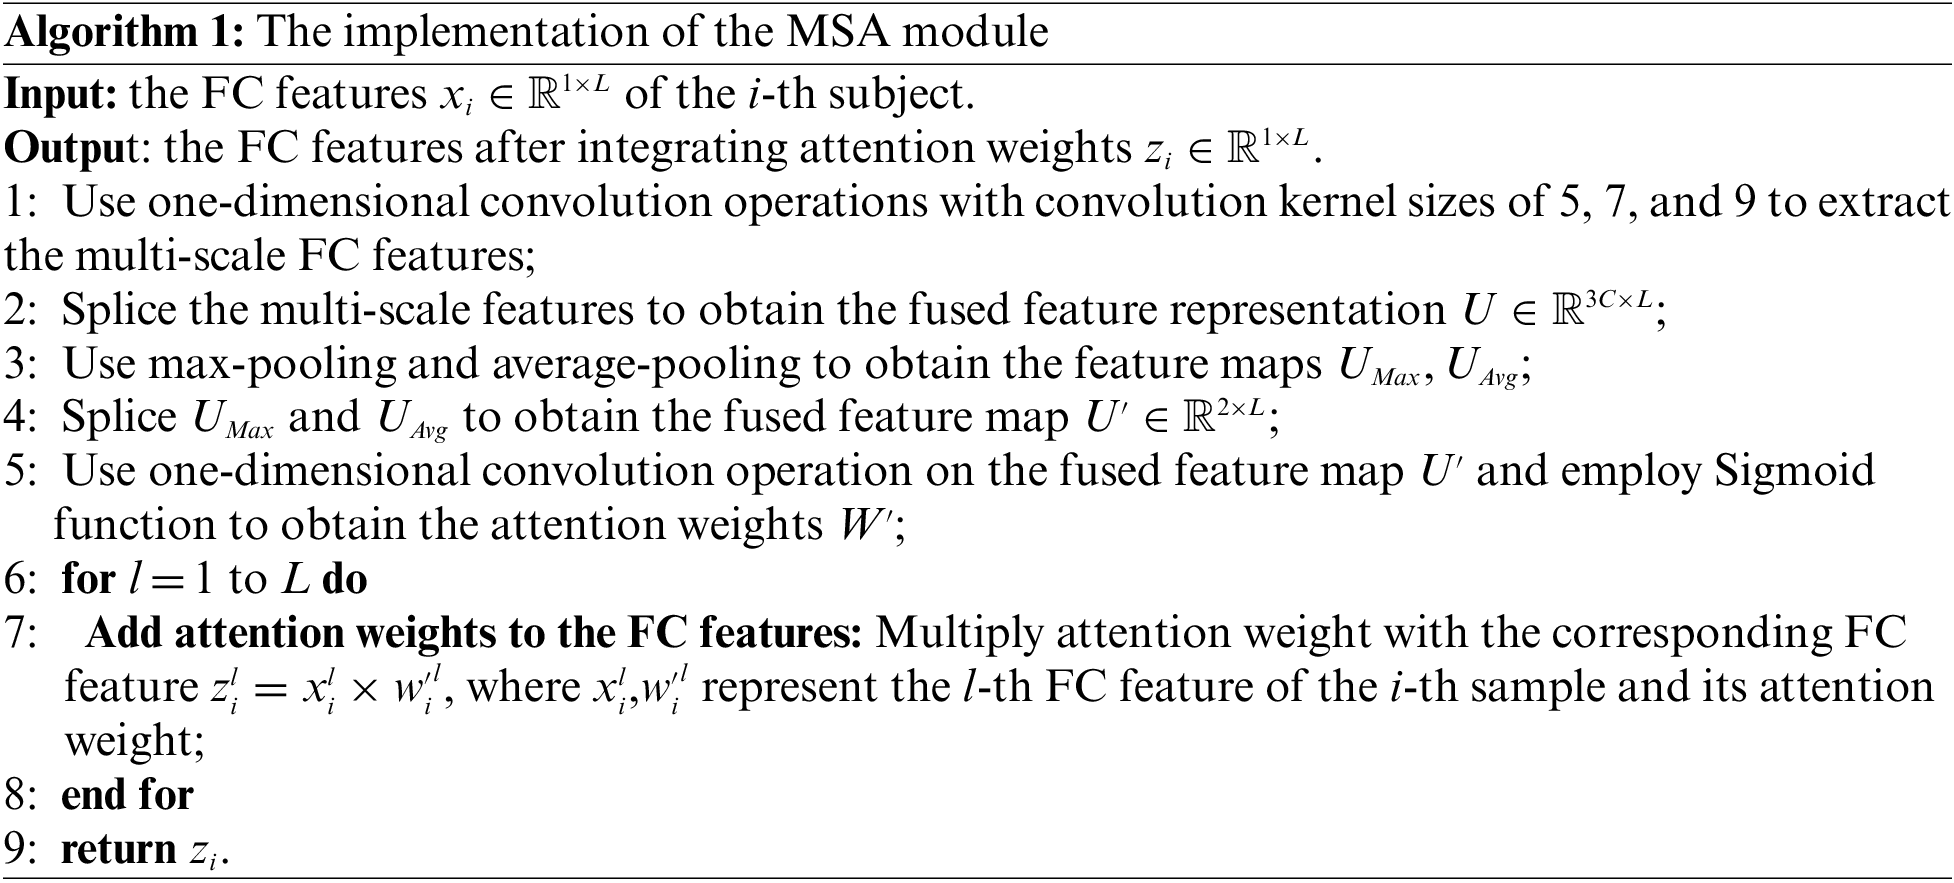
The basic configuration of the MSA module is shown in Fig. 3. Let the input feature be
where
where
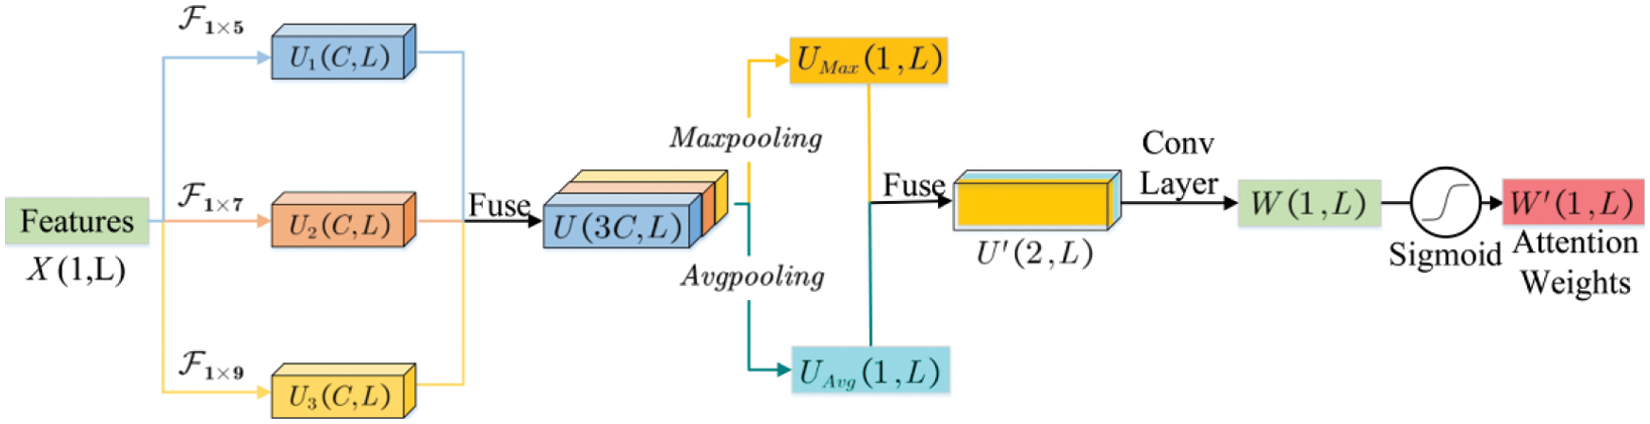
Figure 3: The illustration of the MSA module
3.6 Important Functional Connections Analysis
In order to identify the important FCs that best discriminate between ASD and HC subjects, we conducted saliency map analysis to find the FC features with the most significant contribution to the classification. The main idea of saliency map is to calculate the partial derivatives of the classification results to the FC features, obtain the gradients of classification results for each FC, and then obtain the importance of the FC during the classification process. Thus, we performed back propagation and obtained the derivative gradients to indicate the contribution of the input FC features to the classification. Assuming the FC between the i-th and j-th ROIs is denoted as
In this study, we conducted systematic experiments on the large aggregate ABIDE dataset to evaluate the classification performance of the proposed model. We employed two cross-validation schemes in our experiments. The first one is the classical 10-fold cross-validation which was performed similarly as those were implemented in previous studies; and the other one is the leave-one-site-out cross-validation which more closely emulated real clinical settings. Briefly, in 10-fold cross-validation, we randomly divided the data into ten subsets with similar size, in which the proportion of ASD patients and HC subjects in each subset was approximately equal. In each fold, we took 9 subsets data as the training set and the remaining one subset as the test set. The similar training process was carried out ten times until each subset was taken as test set once. We compared our model with several classical methods, including SVM, LR, RF, one-dimensional convolution neural network (1D-CNN) and stacked auto-decoders (SAEs). These methods were widely employed in recent studies on FC-based brain disease classification, with the first three are classical machine learning methods and the last two are deep learning methods. In addition to the classical 10-fold cross-validation, we conducted leave-one-site-out cross-validation to verify the model generalization to inter-site variability [30]. In this scheme, we left out the data of one site as the test data each time, and the data of the remaining sites were used as the training set. Data from different acquisition sites may be collected with different acquisition protocols (such as scanner type, collecting parameters, participant recruitment requirements, etc.). Therefore, the leave-one-site-out cross-validation emulated the conditions in real clinical settings more closely, and imposed higher requirements for the model generalization. Results are summarized in the subsections. The classification performance is evaluated by the accuracy, specificity, sensitivity, precision, and F1-score based on the results of cross-validation.
4.1 Classification Results of 10-Fold Cross-Validation
To evaluate the classification performance of the proposed model, we firstly performed classical 10-fold cross-validation experiments similarly as those were implemented in previous studies of ASD classification. We compared our model with SVM, RF, LR, 1D-CNN and SAEs, which were classical methods in the FC pattern classification. The results (accuracy, specificity, sensitivity, precision, and F1-score) of different methods are summarized in Fig. 4. As the results shown, the proposed MSA-DNN obtained the best classification performance on all evaluation measures. In consistent with previous studies, the present work also primarily relied on prediction accuracy to assess the performance. Compared with the competing methods, the MSA-DNN achieved an average accuracy of 70.5%, which was 5.2%, 7.1%, 4.4%, 8.7%, and 3.6% higher than that of SVM, RF, LR, 1D-CNN, and SAEs. For specificity, sensitivity, prevision, and F1-score, our MSA-DNN also revealed obvious advantages than other methods. In addition, the standard errors of MSA-DNN were generally lower than those of the comparison methods, suggesting better robustness of our model in the classification process. These results indicate that the proposed MSA-DNN show better classification performance on the FC patterns, which further superior to the classical classification methods.
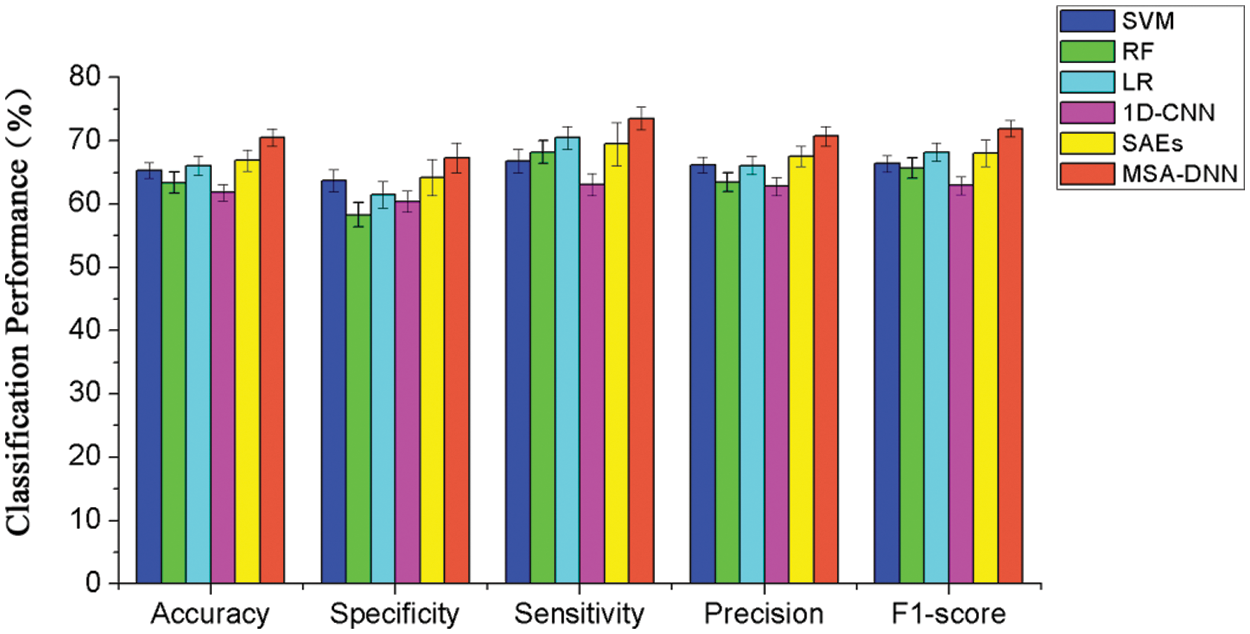
Figure 4: Classification performance comparisons between the proposed model and competing methods using 10-fold cross-validation
4.2 Classification Results of Leave-One-Site-Out Cross-Validation
To evaluate the classifier performance across sites, we further performed a leave-one-site-out cross-validation experiment. In this process, we left out the data of one site as the testing set, and used the data of the remaining sites in the training process. This scenario emulated the clinical settings more closely, and the results reflected the applicability of our model to new, different sites. The classification results of leave-one-site-out cross-validation are summarized in Tab. 3. As the results shown, our model obtained an average accuracy of 67.2% on the entire dataset, suggesting the robust inter-site prediction of our model for new site data. Together with the results from 10-fold cross-validation, our results indicate the effectiveness of the proposed model.

4.3 Important FCs for ASD Classification
At last, we identified important FCs that best discriminate between ASD patients and healthy controls. These FCs may serve as potential biomarkers for the ASD diagnosis. We analyzed the importance of the FC features and obtained the top 20 FCs that contribute mostly to the ASD classification. To better visualize these important FCs, we separately illustrated them in the connectogram representation (Fig. 5a) and mapped them onto the cortical surface (Fig. 5b). Different colors are used to indicate different modules (the frontal, temporal, occipital, parietal lobes, cerebellum, vermis, and subcortical nuclei). Lines of the intra-module connections are represented by the same color as the located module, while the inter-module connections are represented by gray lines.
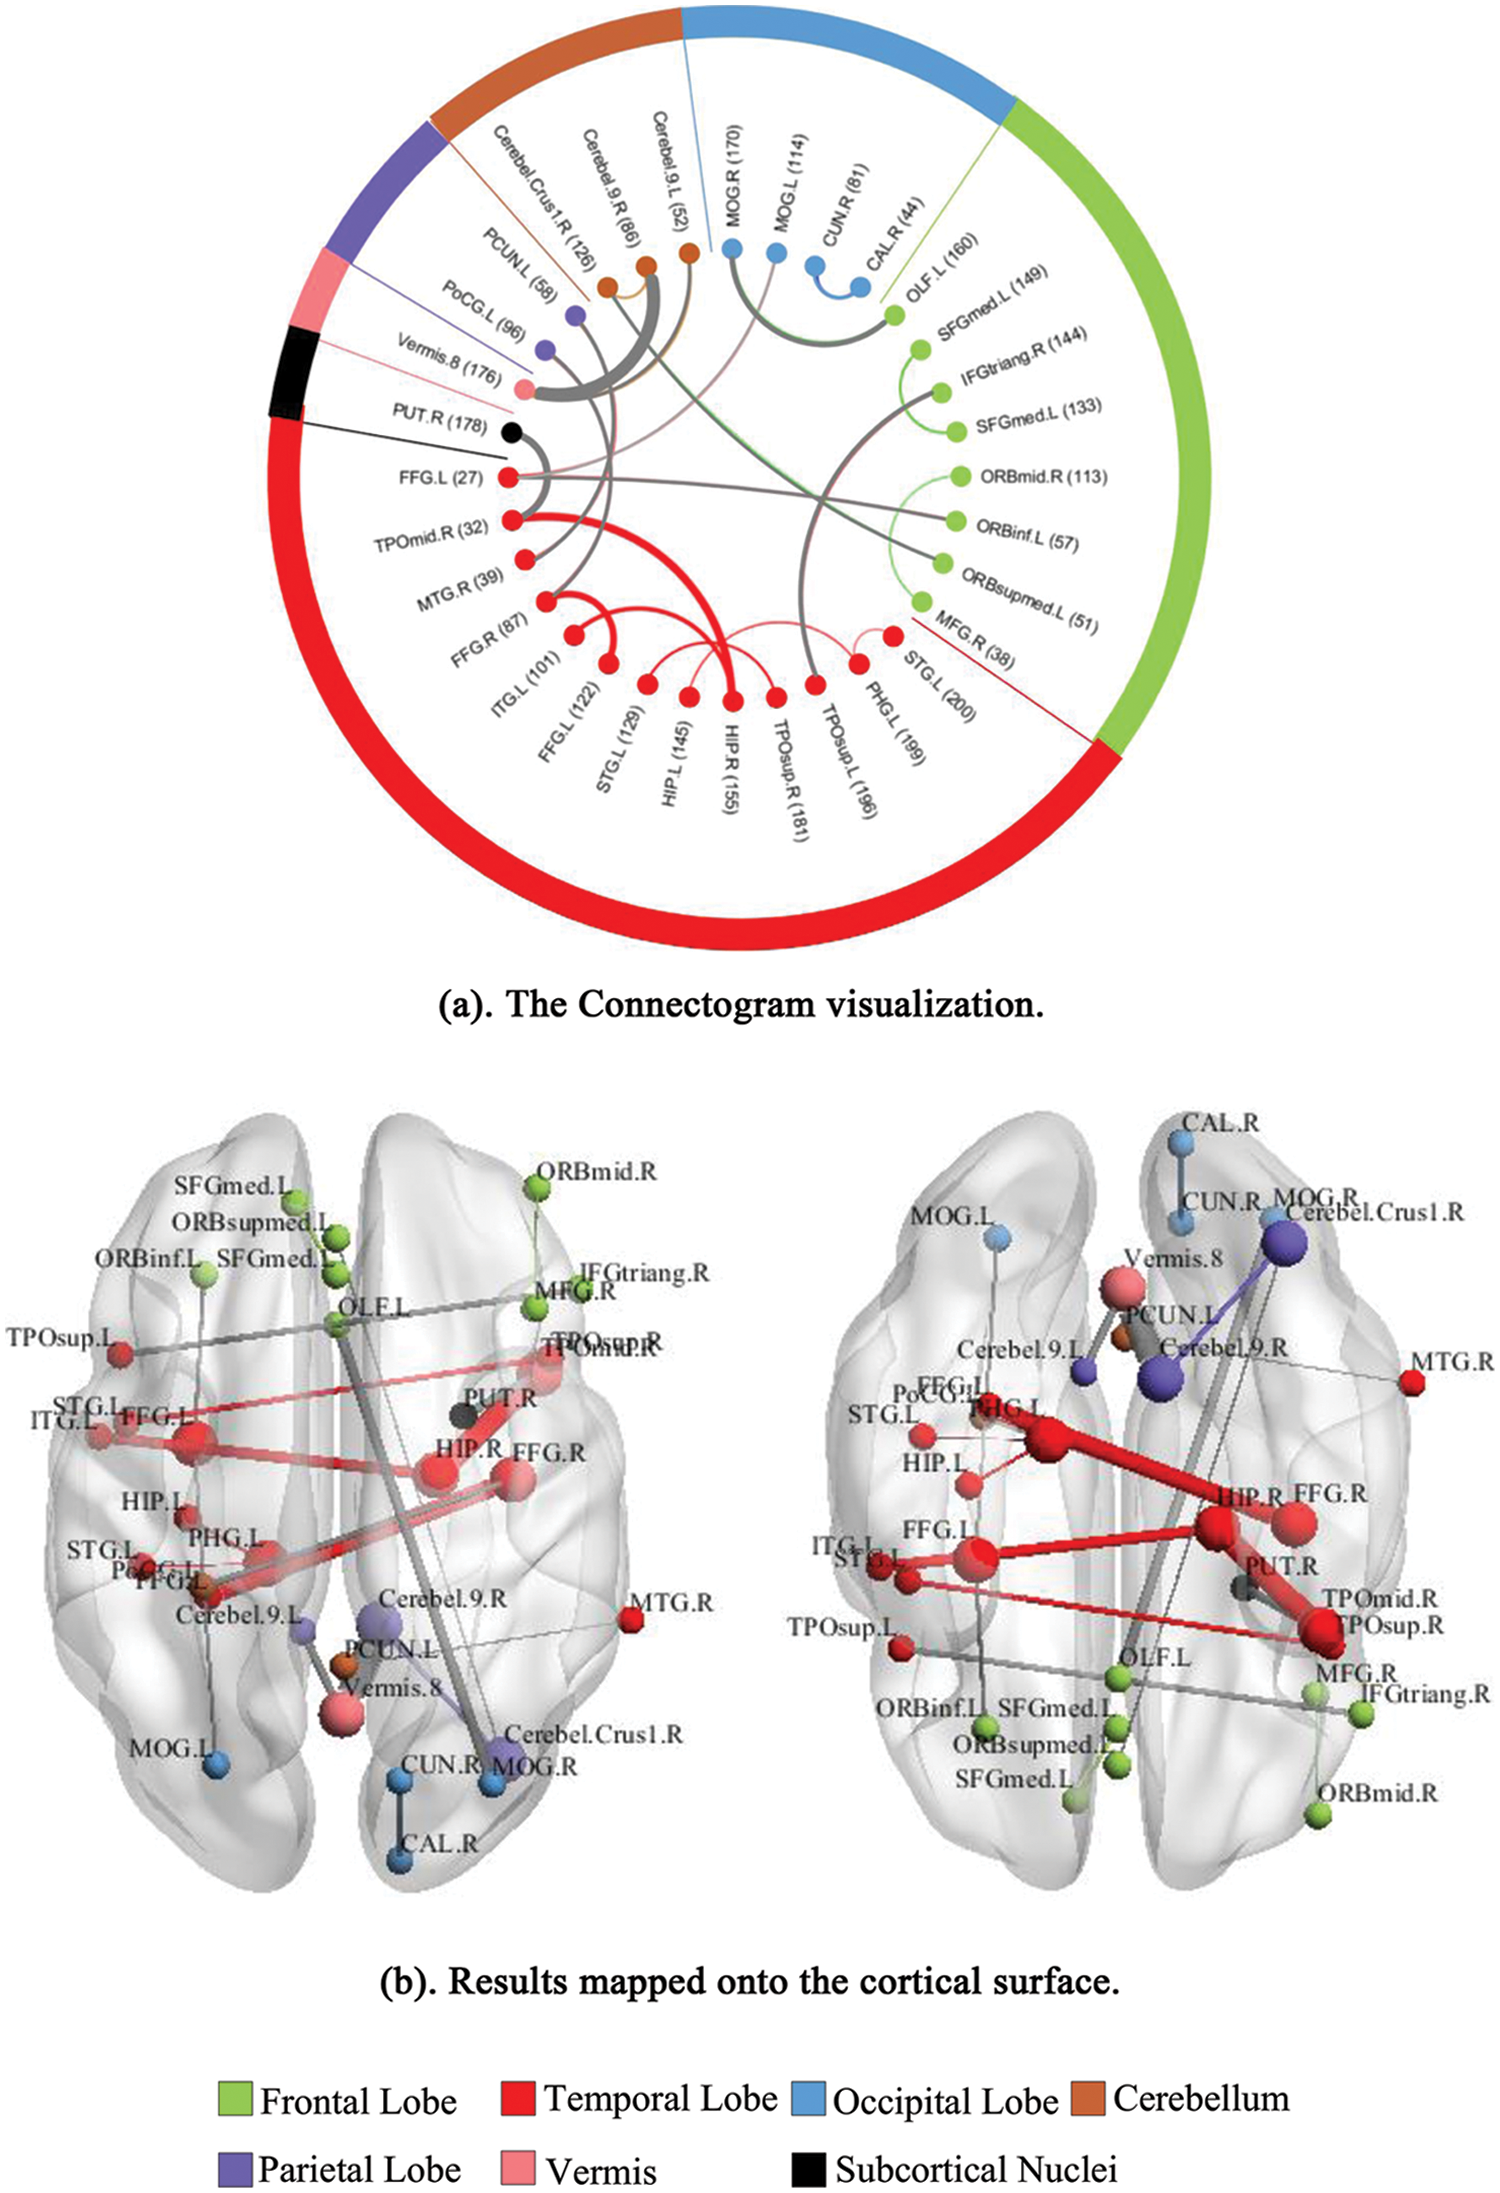
Figure 5: Visualization of the top 20 discriminative FCs for ASD classification. (a) The Connectogram visualization. (b) Results mapped onto the cortical surface. The coordinates of each node are according to the CC200 atlas, and the brain regions are scaled by the number of their connections
This study proposed a novel MSA-DNN model to classify the FC patterns for the ASD diagnosis. The model employed AE as basic unit to build the backbone classification network, and added MSA module in the hidden layers to enhance the interpretability and sparsity of the DNN model. Both unsupervised and supervised learning processes were conducted to improve the model performance. Systematic experiments were carried out on the large ABIDE dataset, which aggregated fMRI data of ASD patients and healthy controls from worldwide multi-sites. Results of both 10-fold cross-validation and leave-one-site-out cross-validation experiments demonstrated the robust generalization of the proposed model. We also identified the important FCs associated with ASD classification that can likely serve as the diagnostic biomarkers.
Due to the high acquisition cost of fMRI data, training DNN models on the FC patterns commonly encounter the problem of high dimensional features in relatively smaller samples. To solve this problem, we proposed a novel MSA-DNN model to classify the FC patterns. The model built a fully connected backbone DNN and combined both unsupervised and supervised training processes. For the backbone network, we built the DNN based on AEs to project high-dimensional FC features into a lower-dimensional feature space. In order to further ensure the sparsity of the model weights to avoid overfitting, a flexible MSA module was proposed and added between the hidden layers of the backbone DNN. The MSA module extracted multi-scale features of the FC patterns and added attention weights to the FC features. This ensured that more important FC features were continuously emphasized and less important FC features were continuously suppressed. The attention mechanism has been demonstrated utility in computer vision studies, which can be considered as a useful means to enhance the representation power towards the most informative features in a computationally efficient manner [31]. Recent studies have shown promising findings for the combination of spatial and channel attention as well as modeling channel-wise relationships, which fuse the features extracted by multiple convolution kernels with different sizes to improve the feature representation power [32,33]. Motivated by these studies, in this work, we conducted multiple convolution operations to extract multi-scale FC features and obtained the attention weights for each FC. The proposed MSA module is simple and flexible, and can be easily embedded into other classification networks.
Moreover, using larger dataset is usually considered as a promising solution to the challenges of reproducibility and statistical power, which would further benefit to promote clinically useful imaging diagnosis and biomarker studies [34]. Large multi-sites datasets are associated with inter-site variability owing to some potential sources of variations across different acquisition sites, such as the scanner type, imaging acquisition parameters, and subject recruitment strategies [16,35]. Such site-related variation in aggregate dataset closely emulates the conditions in real clinical settings. In this study, the experiments on the whole ABIDE dataset reflect how our model generalizes to a large dataset with site-related variability. Results show that the proposed MSA-DNN achieve robust classification performance for both 10-fold cross-validation and leave-one-site-out cross-validation experiments. For 10-fold cross-validation, our MSA-DNN obtained the best classification results on all evaluation measures than the competing methods, suggesting robust generalization of our model on large-scale dataset. In addition, the experiments of leave-one-site-out cross-validation, which left out the data of one entire site as test data, further reveal reliable prediction performance of our model to new, different sites. This scenario evaluates the performance of our model under simulated clinical conditions and suggest the potential of our model for clinical application. Together, our results indicate the effectiveness of the proposed model on large-scale dataset and suggest robust generalization of our model for site-related variability.
Furthermore, identifying discriminative FC features would be benefit to study which brain regions are related to the specific behaviors of ASD, thus provide potential biomarkers for the ASD diagnosis. In this work, we found that brain areas including the cerebellum, hippocampus, fusiform gyrus, temporal pole, middle temporal gyrus, superior temporal gyrus, cuneus, and occipital cortex, are highly important in the ASD classification. As shown in Fig. 5, the discriminative FCs are mostly associated with these regions. The cerebellar area is an important regulatory center for human movement, which is vital to balance the human body. Previous studies on ASD have found that the abnormalities in movement and language tasks for ASD patients may be caused by the abnormal activations in cerebellar area [36,37]. It has also been proved that the FCs in cerebellar are much weaker than those in other regions for ASD patients [38]. In this study, we found that 4 of the top 20 discriminative FCs were related to the cerebellar. Together with the previous findings, we suggest that increasing attention for the functional and structural properties of cerebellar can be paid in future studies. In addition, the temporal-lobe areas including the temporal pole, middle temporal gyrus, and superior temporal gyrus are also involved in the discriminative FCs. Among them, the superior temporal gyrus is considered as an important area for processing auditory and language information [39]. It was found that the abnormal behaviors of ASD patients are related to this brain area [40,41]. Moreover, the injury of middle temporal gyrus may cause disorders in facial expressions and gestures for ASD patients. In clinical trials, patients with ASD often show problems in face recognition, which may be due to the inactivation of related neurons in fusiform gyrus and occipital cortex [42]. Furthermore, as a core processing unit for memory coding and object recognition, the hippocampus plays an important role in high-level cognition. In this study, we found that 3 of the 20 discriminative FCs are associated with hippocampus. These FCs may be an important cause for the differences in the memory tasks between ASD patients and healthy controls. Besides, previous studies have also pointed out that differences in the visual cortex exist between ASD patients and healthy subjects, and the visual processing in human brain is related to the calcarine, cuneus, and occipital cortex. Overall, our results are in line with previous findings, and provide additional support that these important regions and FCs may serve as potential biomarkers for the ASD detection.
This study applied deep learning methods in the brain disease diagnosis. The limitation and future work for this study are summarized as follows. Firstly, considering the complexity of brain diseases and the potential individual differences, the functional interactions may be various across different subjects, which makes the data distributions of the FC patterns much more difficult to model. The use of large aggregate datasets is commonly cited as a promising solution for reproducibility and statistical power. While this study validated the effectiveness of the proposed model on large-scale ABIDE dataset, features identified may still be biased and necessitate further verify on more participants. Moreover, although the MSA module enhances the sparsity of the model weights and alleviates overfitting to some extent, the AE-based backbone DNN still needs to learn a large number of parameters. In view of the promising results obtained from multiple modality data fusion method in recent computer-aided medicine studies [27,43], the fusion of structure MRI features and FC patterns as well as introducing multi-task learning strategy may further promote the model training and enhance the classification performance. This possibility will be further explored in the future work.
In this study, we proposed a novel MSA-DNN model to classify the FC patterns for ASD detection. The model built a DNN based on AEs for FC feature dimensionality reduction and learning, and combined both unsupervised and supervised training processes to improve the effectiveness of feature learning. A flexible MSA module was added between the hidden layers of the DNN model, which further ensured the sparsity of the model weights and improved the model interpretability. Systematic experiments on the large multi-sites ABIDE dataset demonstrate the effectiveness of the proposed model. We also identified important FCs as biomarkers associated with ASD classification. To sum, our study provides an effective framework to learn and classify FC patterns for ASD diagnosis, and can be further extended to the imaging diagnosis of other brain diseases.
Acknowledgement: Multi-sites fMRI data were downloaded from the ABIDE dataset. We sincerely thank ABIDE for the publicly access and download of data for further research.
Funding Statement: This work was supported by the National Natural Science Foundation of China (No. 61906006).
Conflicts of Interest: We declare that we have no actual or potential conflict of interest including any financial, personal or other relationships with other people or organizations that can inappropriately influence our work.
1. C. Ecker, A. Marquand, J. Mourao-Miranda, P. Johnston, E. M. Daly et al., “Describing the brain in autism in five dimensions—Magnetic resonance imaging-assisted diagnosis of autism spectrum disorder using a multiparameter classification approach,” Journal of Neuroscience, vol. 30, no. 32, pp. 10612–10623, 2010. [Google Scholar]
2. C. S. Monk, S. J. Peltier, J. L. Wiggins, S. J. Weng, M. Carrasco et al., “Abnormalities of intrinsic functional connectivity in autism spectrum disorders,” NeuroImage, vol. 47, no. 2, pp. 746–772, 2009. [Google Scholar]
3. M. E. Lynall, D. S. Bassett, R. Kerwin, P. J. Mckenna, M. Kitzbichler et al., “Functional connectivity and brain networks in schizophrenia,” Journal of Neuroscience, vol. 30, no. 32, pp. 10612–10623, 2010. [Google Scholar]
4. J. Liu, J. Wang, Z. Tang, B. Hu, F. X. Wu et al., “Improving Alzheimer’s disease classification by combining multiple measures,” IEEE/ACM Transactions on Computational Biology and Bioinformatics, vol. 15, no. 5, pp. 1649–1659, 2018. [Google Scholar]
5. C. P. Chen, C. L. Keown, A. Jahedi, A. Nair, M. E. Pflieger et al., “Diagnostic classification of intrinsic functional connectivity highlights somatosensory, default mode, and visual regions in autism,” Neuroimage Clinical, vol. 8, pp. 238–245, 2015. [Google Scholar]
6. X. Guo, K. C. Dominick, A. A. Minai, H. Li, C. A. Erickson et al., “Diagnosing autism spectrum disorder from brain resting-state functional connectivity patterns using a deep neural network with a novel feature selection method,” Frontiers in Neuroscience, vol. 11, pp. 460, 2017. [Google Scholar]
7. Y. Kong, J. Gao, Y. Xu, Y. Pan, J. Wang et al., “Classification of autism spectrum disorder by combining brain connectivity and deep neural network classifier,” Neurocomputing, vol. 324, pp. 63–68, 2019. [Google Scholar]
8. A. S. Heinsfeld, A. R. Franco, R. C. Craddock, A. Buchweitz and F. Meneguzzi, “Identification of autism spectrum disorder using deep learning and the ABIDE dataset,” NeuroImage: Clinical, vol. 17, pp. 16–23, 2018. [Google Scholar]
9. J. Hu, L. Shen, S. Albanie, G. Sun and E. Wu, “Squeeze-and-excitation networks,” IEEE Transactions on Pattern Analysis and Machine Intelligence, vol. 42, no. 8, pp. 2011–2023, 2020. [Google Scholar]
10. F. Wang, M. Jiang, Q. Chen, S. Yang and X. Tang, “Residual attention network for image classification,” in IEEE Conf. on Computer Vision and Pattern Recognition, Hawaii, USA, pp. 3156–3164, 2017. [Google Scholar]
11. K. Simonyan, A. Vedaldi and A. Zisserman, “Deep inside convolutional networks: Visualising image classification models and saliency maps,” in Proc. of ICLR, Banff, Canada, 2014. [Google Scholar]
12. G. Mingoia, G. Wagner, K. Langbein, R. Maitra, S. Smesny et al., “Default mode network activity in schizophrenia studied at resting state using probabilistic ICA,” Schizophrenia Research, vol. 138, pp. 143–149, 2012. [Google Scholar]
13. F. Liu, C. Y. Wee, H. F. Chen and D. G. Shen, “Inter-modality relationship constrained multi-modality multi-task feature selection for Alzheimer’s disease and mild cognitive impairment identification,” Neuroimage, vol. 84, pp. 466–475, 2014. [Google Scholar]
14. Z. Yao, B. Hu, Y. Xie, Z. Fang, G. Liu et al., “Resting-state time-varying analysis reveals aberrant variations of functional connectivity in autism,” Frontiers in Human Neuroscience, vol. 10, no. 13, pp. 463, 2016. [Google Scholar]
15. X. F. Geng, J. H. Xu, B. L. Liu and Y. G. Shi, “Multivariate classification of major depressive disorder using the effective connectivity and functional connectivity,” Frontiers in Neuroscience, vol. 12, no. 38, pp. 1–16, 2018. [Google Scholar]
16. J. A. Nielsen, B. A. Zielinski, P. T. Fletcher, A. L. Alexander, N. Lange et al., “Multisite functional connectivity MRI classification of autism: ABIDE results,” Frontiers in Human Neuroscience, vol. 7, no. 1, pp. 599, 2013. [Google Scholar]
17. L. Q. Uddin, K. Supekar, C. J. Lynch, A. Khouzam, J. Phillips et al., “Salience network–based classification and prediction of symptom severity in children with autism,” JAMA Psychiatry, vol. 70, pp. 869–879, 2013. [Google Scholar]
18. M. J. Rosa, L. Portugal, J. Shawe-Taylor and J. Mourao-Miranda, “Sparse network-based models for patient classification using fMRI,” in Proc. of IEEE Int. Workshop on Pattern Recognition in Neuroimaging, Philadelphia, USA, 2013. [Google Scholar]
19. H. Chen, X. Duan, F. Lu, X. Ma, Y. Zhang et al., “Multivariate classification of autism spectrum disorder using frequency-specific resting-state functional connectivity—A multi-center study,” Progress in Neuro-Psychopharmacology & Biological Psychiatry, vol. 64, pp. 1–9, 2016. [Google Scholar]
20. R. Farkh, M. T. Quasim, K. A. Jaloud, S. Alhuwaumel and S. T. Siddiqui, “Computer vision-control-based CNN-PID for mobile robot,” Computers, Materials & Continua, vol. 68, no. 1, pp. 1065–1079, 2021. [Google Scholar]
21. S. Tu, M. Waqas, S. U. Rahman, T. Mir, Z. Haim et al., “Social phenomena and fog computing networks: A novel perspective for future networks,” IEEE Transactions on Computational Social Systems, vol. 9, no. 1, pp. 32–44, 2021. [Google Scholar]
22. S. Tu, M. Waqas, S. U. Rahman, T. Mir, G. Abbas et al., “Reinforcement learning assisted impersonation attack detection in device-to-device communications,” IEEE Transactions on Vehicular Technology, vol. 70, no. 2, pp. 1474–1479, 2021. [Google Scholar]
23. J. Wan, M. Waqas, S. Tu, S. M. Hussain, A. Shah et al., “An efficient impersonation attack detection method in fog computing,” Computers, Materials & Continua, vol. 68, no. 1, pp. 267–281, 2021. [Google Scholar]
24. P. N. Srinivasu, A. K. Bhoi, R. H. Jhaveri, G. T. Reddy and M. Bilal,“Probabilistic deep Q network for real-time path planning in censorious robotic procedures using force sensors,” Journal of Real-Time Image Processing, vol. 18, pp. 1773–1785, 2021. [Google Scholar]
25. T. R. Gadekallu, N. Khare, S. Bhattacharya, S. Singh, P. K. R. Maddikunta et al., “Deep neural networks to predict diabetic retinopathy,” Journal of Ambient Intelligence and Humanized Computing, vol. 13, pp. 1–14, 2020. [Google Scholar]
26. T. R. Gadekallu, N. Khare, S. Bhattacharya, S. Singh, P. K. R. Maddikunta et al., “Early detection of diabetic retinopathy using PCA-firefly based deep learning model,” Electronics, vol. 9, no. 2, pp. 274, 2020. [Google Scholar]
27. N. A. El-Hag, A. Sedik, G. M. El-Banby, W. El-Shafai, A. A. M. Khalaf et al., “Utilization of image interpolation and fusion in brain tumor segmentation,” International Journal Numerical Methods Biomedical Engngineering, vol. 37, no. 8, pp. 1--26, 2021. [Google Scholar]
28. J. Kim, V. D. Calhoun, E. Shim and J. H. Lee, “Deep neural network with weight sparsity control and pre-training extracts hierarchical features and enhances classification performance: Evidence from whole-brain resting-state functional connectivity patterns of schizophrenia,” Neuroimage, vol. 124, pp. 127–146, 2016. [Google Scholar]
29. R. C. Craddock, G. A. James, P. E. Holtzheimer, X. P. Hu and H. S. Mayberg, “A whole brain fMRI atlas generated via spatially constrained spectral clustering,” Human Brain Mapping, vol. 33, pp. 1914–1928, 2012. [Google Scholar]
30. A. Abraham, M. P. Milham, A. D. Martino, R. C. Craddock, D. Samaras et al., “Deriving reproducible biomarkers from multi-site resting-state data: An autism-based example,” NeuroImage, vol. 147, pp. 736–745, 2017. [Google Scholar]
31. A. Vaswani, N. Shazeer, N. Parmar, J. Uszkoreit, L. Jones et al., “Attention is all you need,” in Proc. NIPS, California, USA, pp. 5998–6008, 2017. [Google Scholar]
32. C. Szegedy, W. Liu, Y. Jia, P. Sermanet, S. E. Reed et al., “Going deeper with convolutions,” in Proc. CVPR, Boston, USA, pp. 1–9, 2015. [Google Scholar]
33. S. Gao, M. M. Cheng, K. Zhao, X. Y. Zhang, M. H. Yang et al., “Res2net: A new multi-scale backbone architecture,” IEEE Transactions on Pattern Analysis and Machine Intelligence, vol. 43, pp. 652–662, 2021. [Google Scholar]
34. K. S. Button, J. P. A. Ioannidis, C. Mokrysz, B. A. Nosek, J. Flint et al., “Power failure: Why small sample size undermines the reliability of neuroscience,” Nature Reviews Neuroscience, vol. 13, no. 5, pp. 365–376, 2013. [Google Scholar]
35. K. Dadi, M. Rahim, A. Abraham, D. Chyzhyk, M. Milham et al., “Benchmarking functional connectome-based predictive models for resting-state fMRI,” NeuroImage, vol. 192, pp. 115–134, 2019. [Google Scholar]
36. S. H. Mostofsky, S. K. Powell, D. J. Simmonds, M. C. Goldberg, B. Caffo et al., “Decreased connectivity and cerebellar activity in autism during motor task performance,” Brain, vol. 132, no. 9, pp. 2413–2425, 2009. [Google Scholar]
37. M. Verly, J. Verhoeven, I. Zink, D. Mantini, R. Peeters et al., “Altered functional connectivity of the language network in ASD: Role of classical language areas and cerebellum,”NeuroImage: Clinical, vol. 4, pp. 374–382, 2014. [Google Scholar]
38. Z. Long, X. Duan, D. Mantini and H. Chen, “Alteration of functional connectivity in autism spectrum disorder: Effect of age and anatomical distance,” Scientific Reports, vol. 6, no. 1, pp. 1–8, 2016. [Google Scholar]
39. J. D. Lewis, R. J. Theilmann, J. Townsend and A. C. Evans, “Network efficiency in autism spectrum disorder and its relation to brain overgrowth,” Frontiers in Human Neuroscience, vol. 7, pp. 845, 2013. [Google Scholar]
40. S. A. Green, J. Rudie, N. Colich, J. J. Wood, D. Shirinyan et al., “Overreactive brain responses to sensory stimuli in youth with autism spectrum disorders,” Journal of the American Academy of Child & Adolescent Psychiatry, vol. 52, pp. 1158–1172, 2013. [Google Scholar]
41. K. O’connor, “Auditory processing in autism spectrum disorder: A review,” Neuroscience & Biobehavioral Reviews, vol. 36, no. 2, pp. 836–854, 2012. [Google Scholar]
42. V. Subbaraju, M. B. Suresh, S. Sundaram and S. Narasimhan, “Identifying differences in brain activities and an accurate detection of autism spectrum disorder using resting state functional-magnetic resonance imaging: A spatial filtering approach,” Medical Image Analysis, vol. 35, pp. 375–389, 2017. [Google Scholar]
43. M. Rakić, M. Cabezas, K. Kushibar, A. Oliver and X. Llado, “Improving the detection of autism spectrum disorder by combining structural and functional MRI information,” NeuroImage: Clinical, vol. 25, pp. 102181, 2020. [Google Scholar]
 | This work is licensed under a Creative Commons Attribution 4.0 International License, which permits unrestricted use, distribution, and reproduction in any medium, provided the original work is properly cited. |