DOI:10.32604/cmc.2022.027044
| Computers, Materials & Continua DOI:10.32604/cmc.2022.027044 | |
| Article |
Mathematical Modelling of Rotavirus Disease Through Efficient Methods
Department of Mathematics, Govt. Maulana Zafar Ali Khan Graduate College Wazirabad, Punjab Higher Education Department (PHED), Lahore, 54000, Pakistan
*Corresponding Author: Ali Raza. Email: alimustasamcheema@gmail.com
Received: 09 January 2022; Accepted: 17 February 2022
Abstract: The design of evolutionary approaches has a vital role in the recent development of scientific literature. To tackle highly nonlinear complex problems, nonlinear ordinary differential equations, partial differential equations, stochastic differential equations, and many more may called computational algorithms. The rotavirus causes may include severe diarrhea, vomiting, and fever leading to rapid dehydration. By the report of the World Health Organization (WHO), approximately 600,000 children die worldwide each year, 80 percent of whom live in developing countries. Two million children are hospitalized each year. In Asia, up to 45 percent of the children hospitalized for diarrhea may be infected with rotavirus. The rotavirus model is categorized into five-compartment like susceptible (S), breastfeeding (M), vaccinated (V), infected (I), and recovered children (R). Positivity, boundedness, equilibria, reproduction number, and stability results are part of the qualitative analysis of the model. After that, the design of the evolutionary approaches on the model predicts the efficiency, visualization, long-term behavior of the disease, and best results of the rotavirus disease. In the end, evolutionary computations are an appropriate tool for double-checking the qualitative examination of the model.
Keywords: Rotavirus disease; epidemic model; methods; comparison analysis
Rotavirus is a double-stranded RNA virus. Rotavirus is the most common cause of diarrhea. Its spread is contagious and affects every child before the age of five. Rotavirus is round in shape when observed under a microscope. Rotavirus produces inflammation in the small bowel, especially in the stomach and intestine. Diarrhea is most common in South Asia and Africa. In 2004, 2.5 billion cases of diarrhea were reported, resulting in 1.5 million deaths. More than half of the patients were from South Asia and Africa. Diarrhea is still a problem in the developing world. In America, the death rate from diarrhea is 10% merely while in South Asia and Africa, the death rate is 31.3%. In Pakistan, many children suffering from diarrhea are 27.7% in 2018. All the children were under five years of age. Burnett et al. presented a cost-effective vaccine to prevent the rotavirus disease [1]. In 2020, Ahmed et al. developed a mathematical analysis of epidemic modeling of diarrhea like rotavirus [2]. Lin et al. investigated the causes of diarrheal infectious disease rotavirus (Rotarix and Rotateq) in 2014 [3]. In 2019, Payne et al. presented a rotavirus vaccine to understand their effectiveness and recommend US infant immunization [4]. Omondi et al. presented a mathematical model to explore the co-infection of malaria and rotavirus [5]. In 2009, Effeltrerre et al. studied the dynamics of rotavirus to check the indirect effect of vaccination [6]. Chan et al. presented epidemiology in 1998 of rotavirus infection to calculate and estimate the burden of disease under five years of age in Hong Kong [7]. Linhares et al. investigated a rotavirus infection that affects children before five in Brazil by a longitudinal study in 2009 [8]. In 2010, Atchison et al. developed a determined age-structure model to investigate the transmission and effect of rotavirus vaccination in England and Wales [9]. In 2013, Arnold et al. presented a theory of rotavirus-like infections [10]. In 2020, Shuaib et al. developed a mathematical analysis to study the effect of rotavirus on childhood mortality and diarrheal disease [11]. Guzel et al. presented a met-analysis in 2020 regarding awareness programs and preventive policies of rotavirus infection in younger children in Turkey [12]. In 2020, Folorunso et al. investigated oral rotavirus vaccine in developed countries and its strategic preventive [13]. Bibera et al. studied the evolution of the rotavirus vaccine [14]. In 2020, Ilmi et al. investigated the dynamics of the rotavirus epidemic model with the effect of crowding infective individuals [15]. In 2018, Shumetie et al. suggested improving child care to protect their children of a mother from diarrheal morbidity and rotavirus vaccination [16]. Bennett studied the rotavirus epidemic model with the well-known assumption of mathematics [17]. In 2016, Namawejje presented a mathematical model to check the affected regions of rotavirus and illustrate the effects on children and treatment [18]. Omondi et al. studied a mathematical analysis and simulation of rotavirus to check the quality of vaccination in 2015, whether it’s working or not on the infection [19]. The paper’s strategy is as follows: Section 2 describes the model’s design and qualitative analysis. Section 3 and 4 presented the model’s reproduction number and stability results, respectively. Section 5 investigated the structure of evolutionary approaches and their efficiency with comparative analysis. In the end, remarks and the conclusion of the paper are presented.
For any time, the whole population
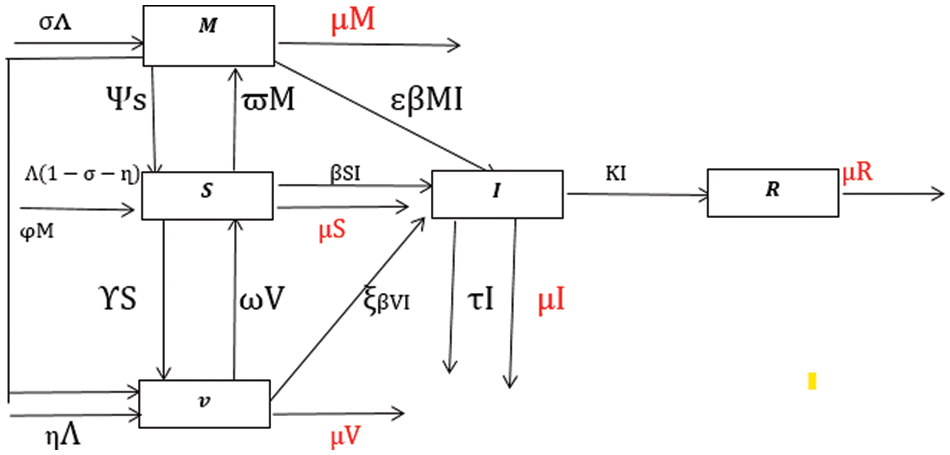
Figure 1: Flow transmission of rotavirus disease [11]
The fixed ratios of the model are presented as follows:
Here, we can observe from the system Eqs. (1)–(5), there is no term
with nonnegative conditions
And
Theorem 1: The system results (6)–(9) with given initial conditions are positive for all
Proof: By letting the Eq. (6),
Similarly, for Eqs. (7)–(9), we have
Theorem 2: The solutions
Proof: By considering the population function is as follows:
For large t→∞
The system (6)–(9) admits two types of equilibria as follows: rotavirus free equilibrium (RFE-
rotavirus endemic equilibrium (REE-
By using the next-generation matrix method, we calculate two types of matrices one is transition matrix, and the second is transmission matrix as follows:
After substituting the rotavirus free equilibrium, so we have
Where
The spectral radius of the
Theorem 3: The rotavirus-free equilibrium =
Proof: The Jacobian matrix at the rotavirus-free equilibrium is as follows:
By applying Routh-Hurwitz Criterion for 3rd order,
Theorem 4: The rotavirus endemic equilibrium = (
Proof: The Jacobian matrix at the rotavirus endemic equilibrium is as follows:
By applying Routh-Hurwitz Criterion for 4th order, if
To analyze the behavior of the continuous model (6)–(9), we use the evolutionary approaches such as Euler, Runge Kutta, and the nonstandard finite difference is as follows:
The system (6)–(9) is selected under Euler computation, as follows:
where, the difference of two consective values of time by
The system (6)–(9) is defined under Runge Kutta computation, as follows:
Stage 1
Stage 2
Stage 3
Stage 4
Final stage
where, the difference of two consective values of time by
5.3 Nonstandard Finite Difference Approach
The system (6)–(9) is defined under NSFD computation, as follows:
where, the difference of two consective values of time by
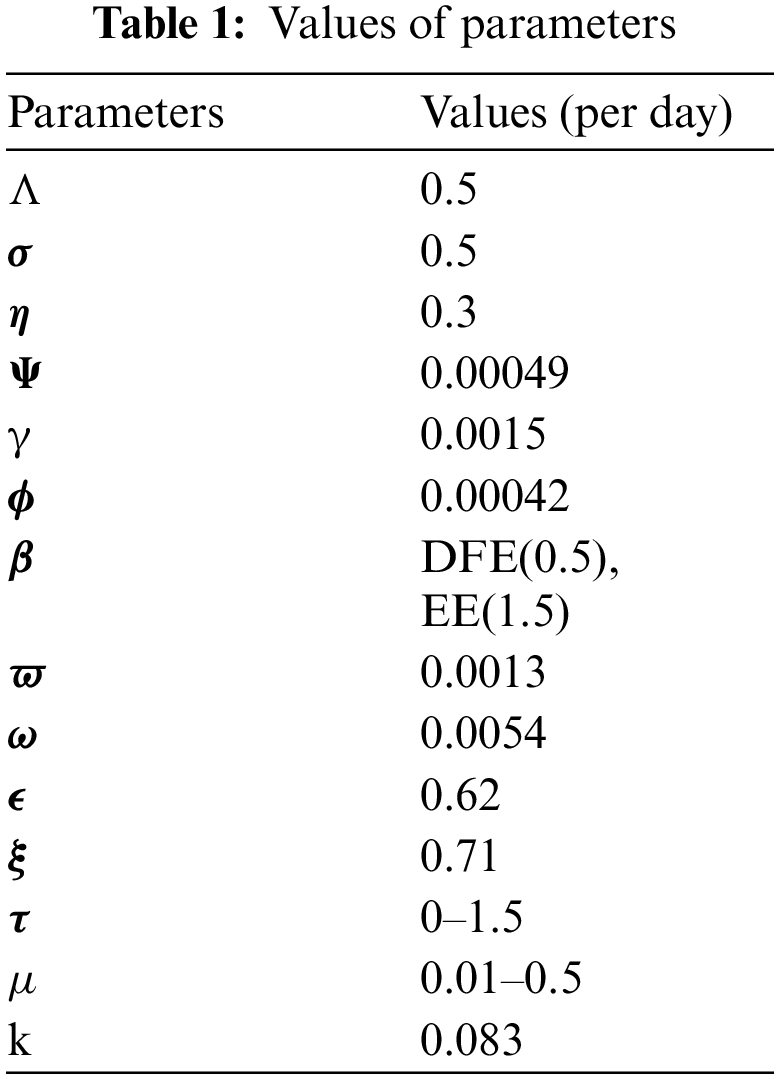
By using the parameters’ values presented in Tab. 1, we approximate the continuous model through the evolutionary approaches as follows:
We analyze the dynamics of rotavirus disease via evolutionary approaches. Fig. 2 predicts the behavior of the continuous model by using the command build algorithm ODE-45 to solve the system of differential equations. Figs. 3a–3d indicates the solution of the model through the Euler approach at both equilibria, such as virus-free and virus existing. Unfortunately, when we try to predict the long-term behavior of the disease in the population, they show negative and unboundedness (exceeding the result from the total population). In the field of epidemiology, these results have no physical relevance. Figs. 4a–4d, the well-known approach like Runge Kutta of order four implemented on the continuous model. No doubt, Runge Kutta has the best convergence compared to the Euler approach. But, Runge Kutta has the same issues when predicting long-term behavior, such as negativity, inconsistency, and many more. We construct the nonstandard finite difference approach on the model to overcome these issues. Our proposed construction always gives a positive solution, bounded, and dynamically consistent at any step size. This method predicts the long-term disease behavior and restores the fundamental properties of epidemiological modeling, as shown in Figs. 5a–5b. To analyze the efficiency of the approaches, we draw a comparison of existing methods with the proposed system, as shown in Figs. 6a–6d. In the end, our proposed policy, nonstandard finite difference, could be more effective in all other types of modeling. Furthermore, flexible tool on behalf of dynamical properties like stability, positivity, and boundedness displays the particular behavior of the continuous model.
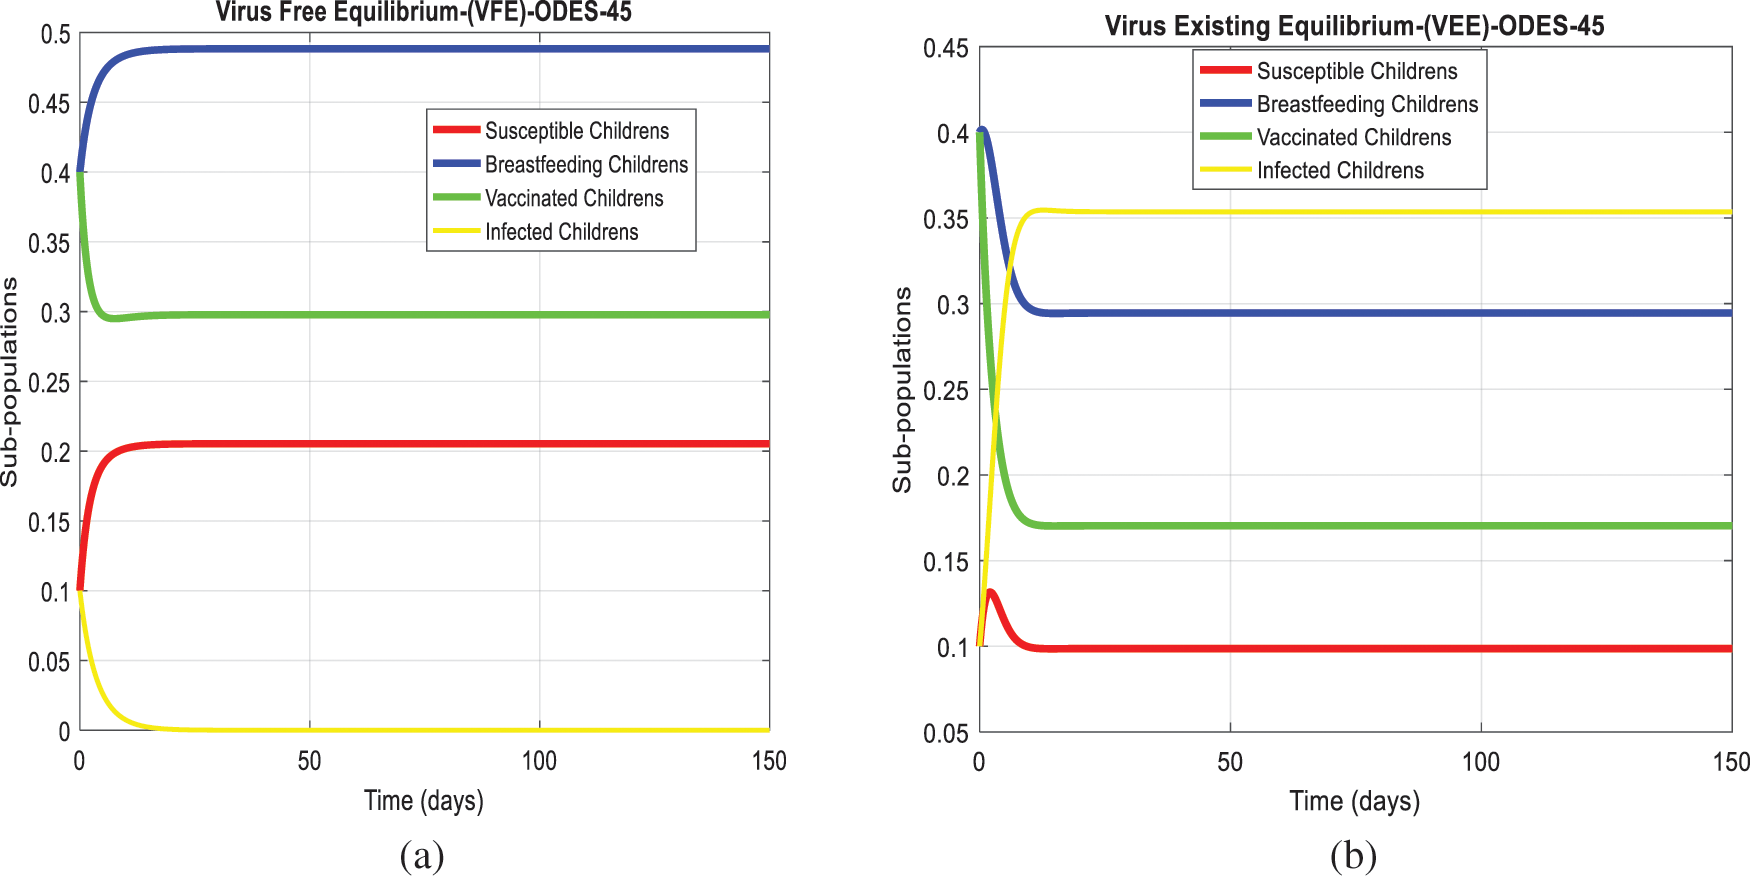
Figure 2: The graphical behavior of the continuous model at both equilibria of the rotavirus disease (a) Subpopulations for rota VFE at any time t (b) Subpopulations for rota VEE at any time t
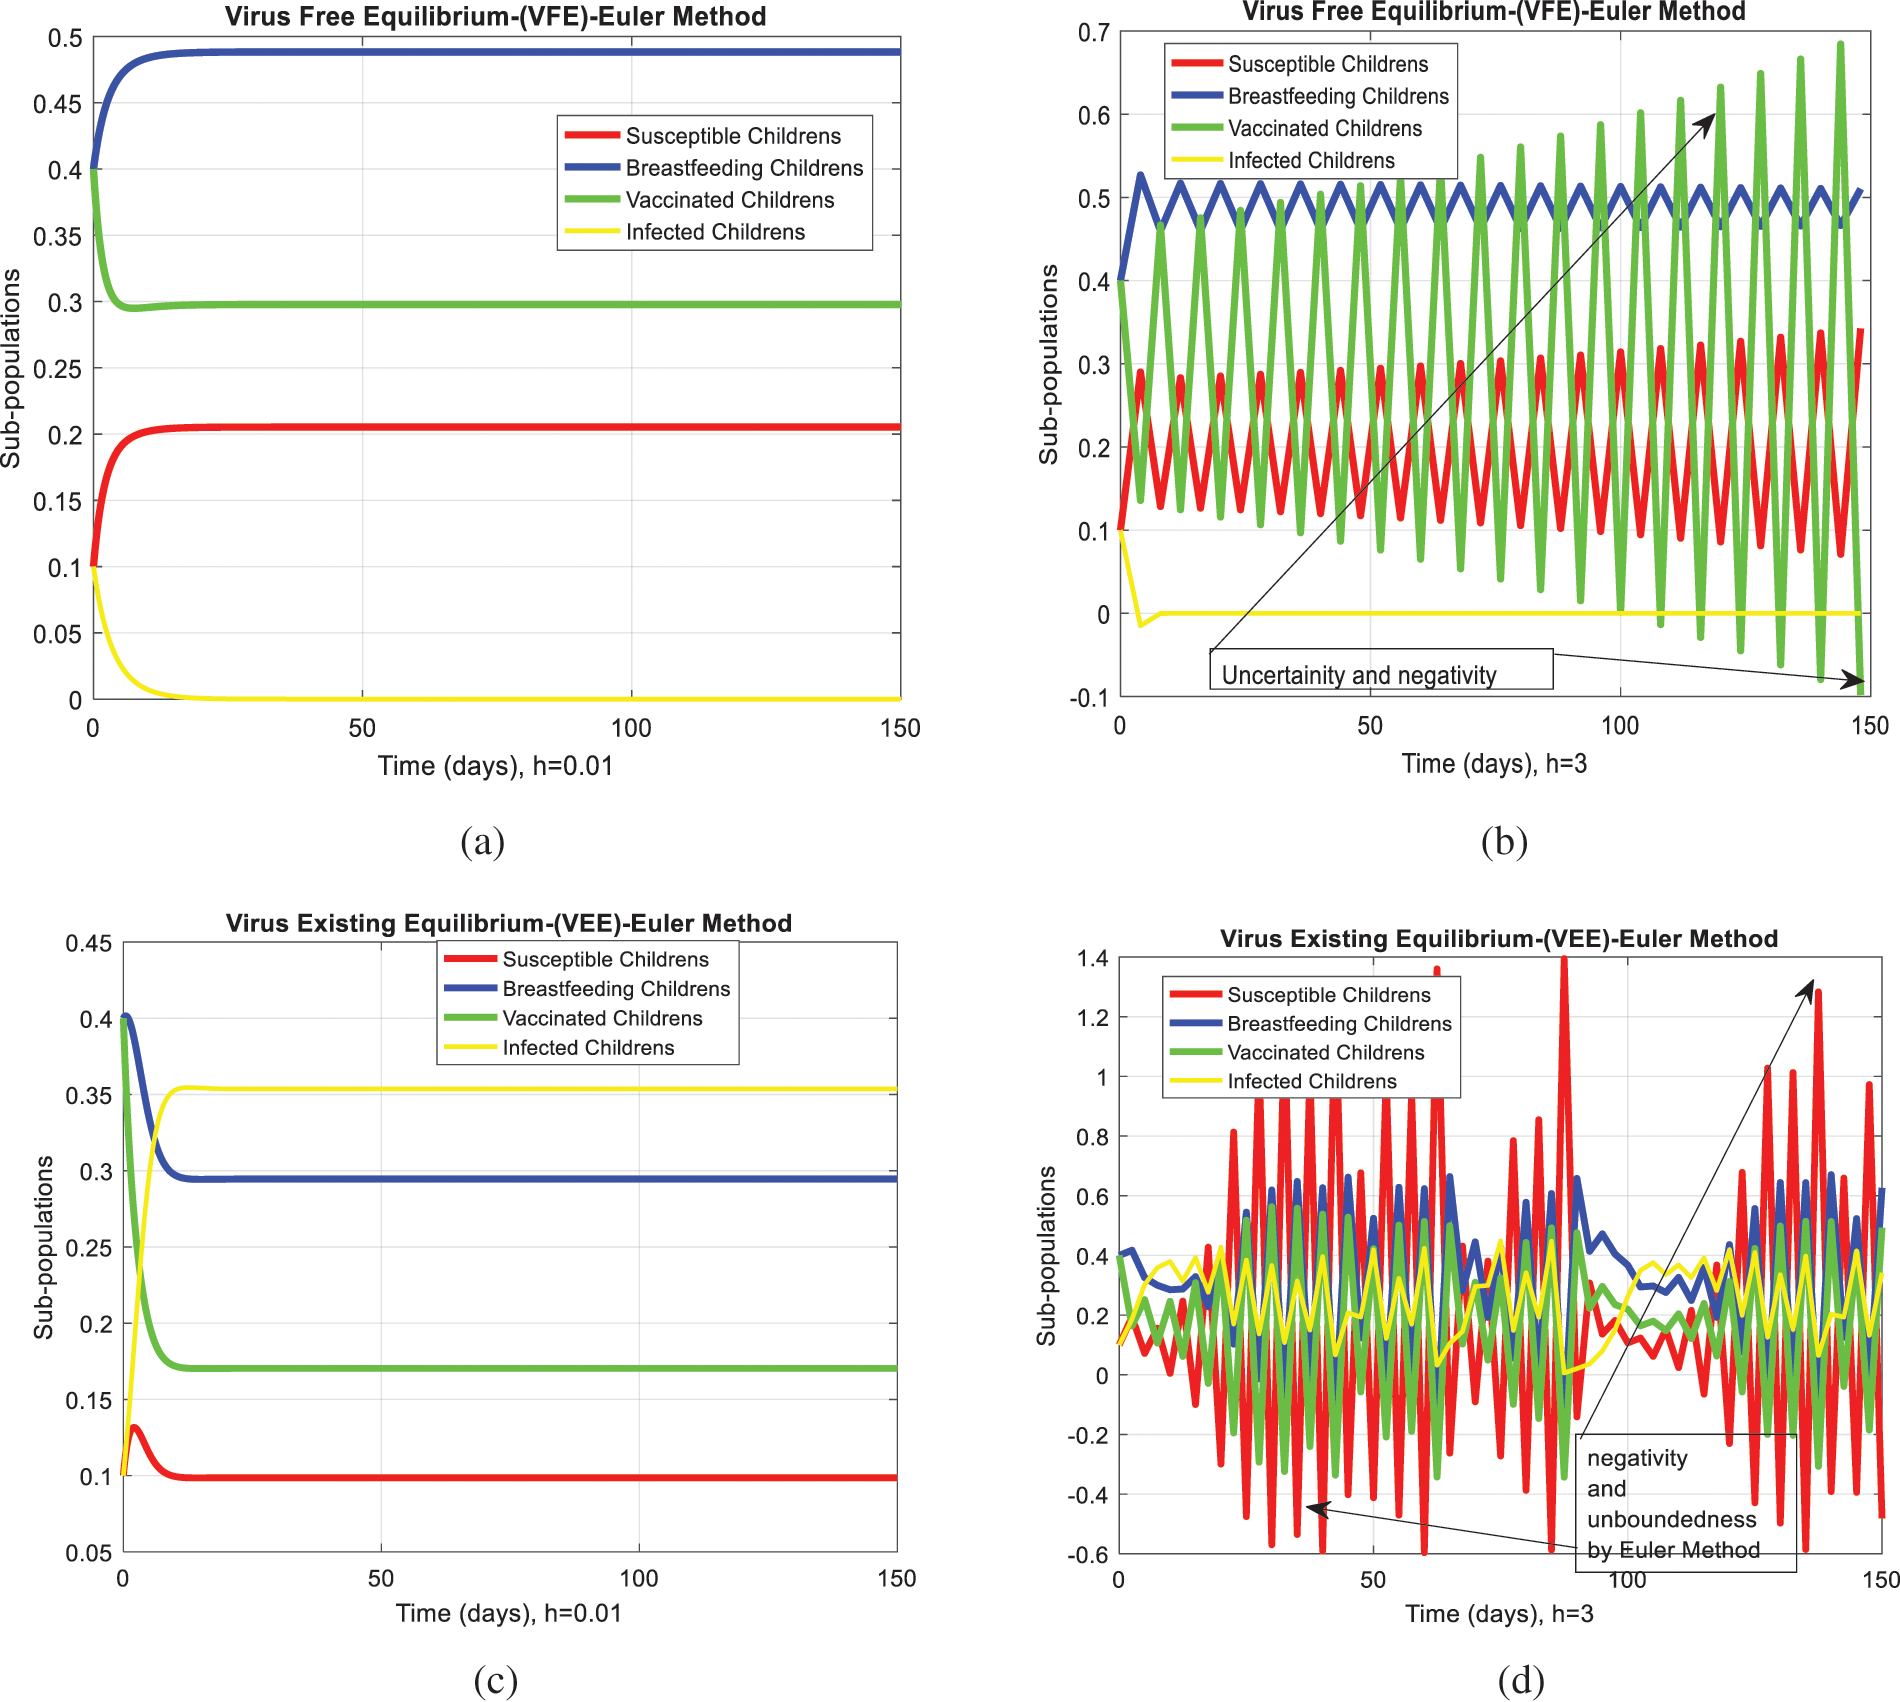
Figure 3: Euler computation for the behavior of the continuous model at both equilibria of the rotavirus disease (a) convergent behavior for VFE at
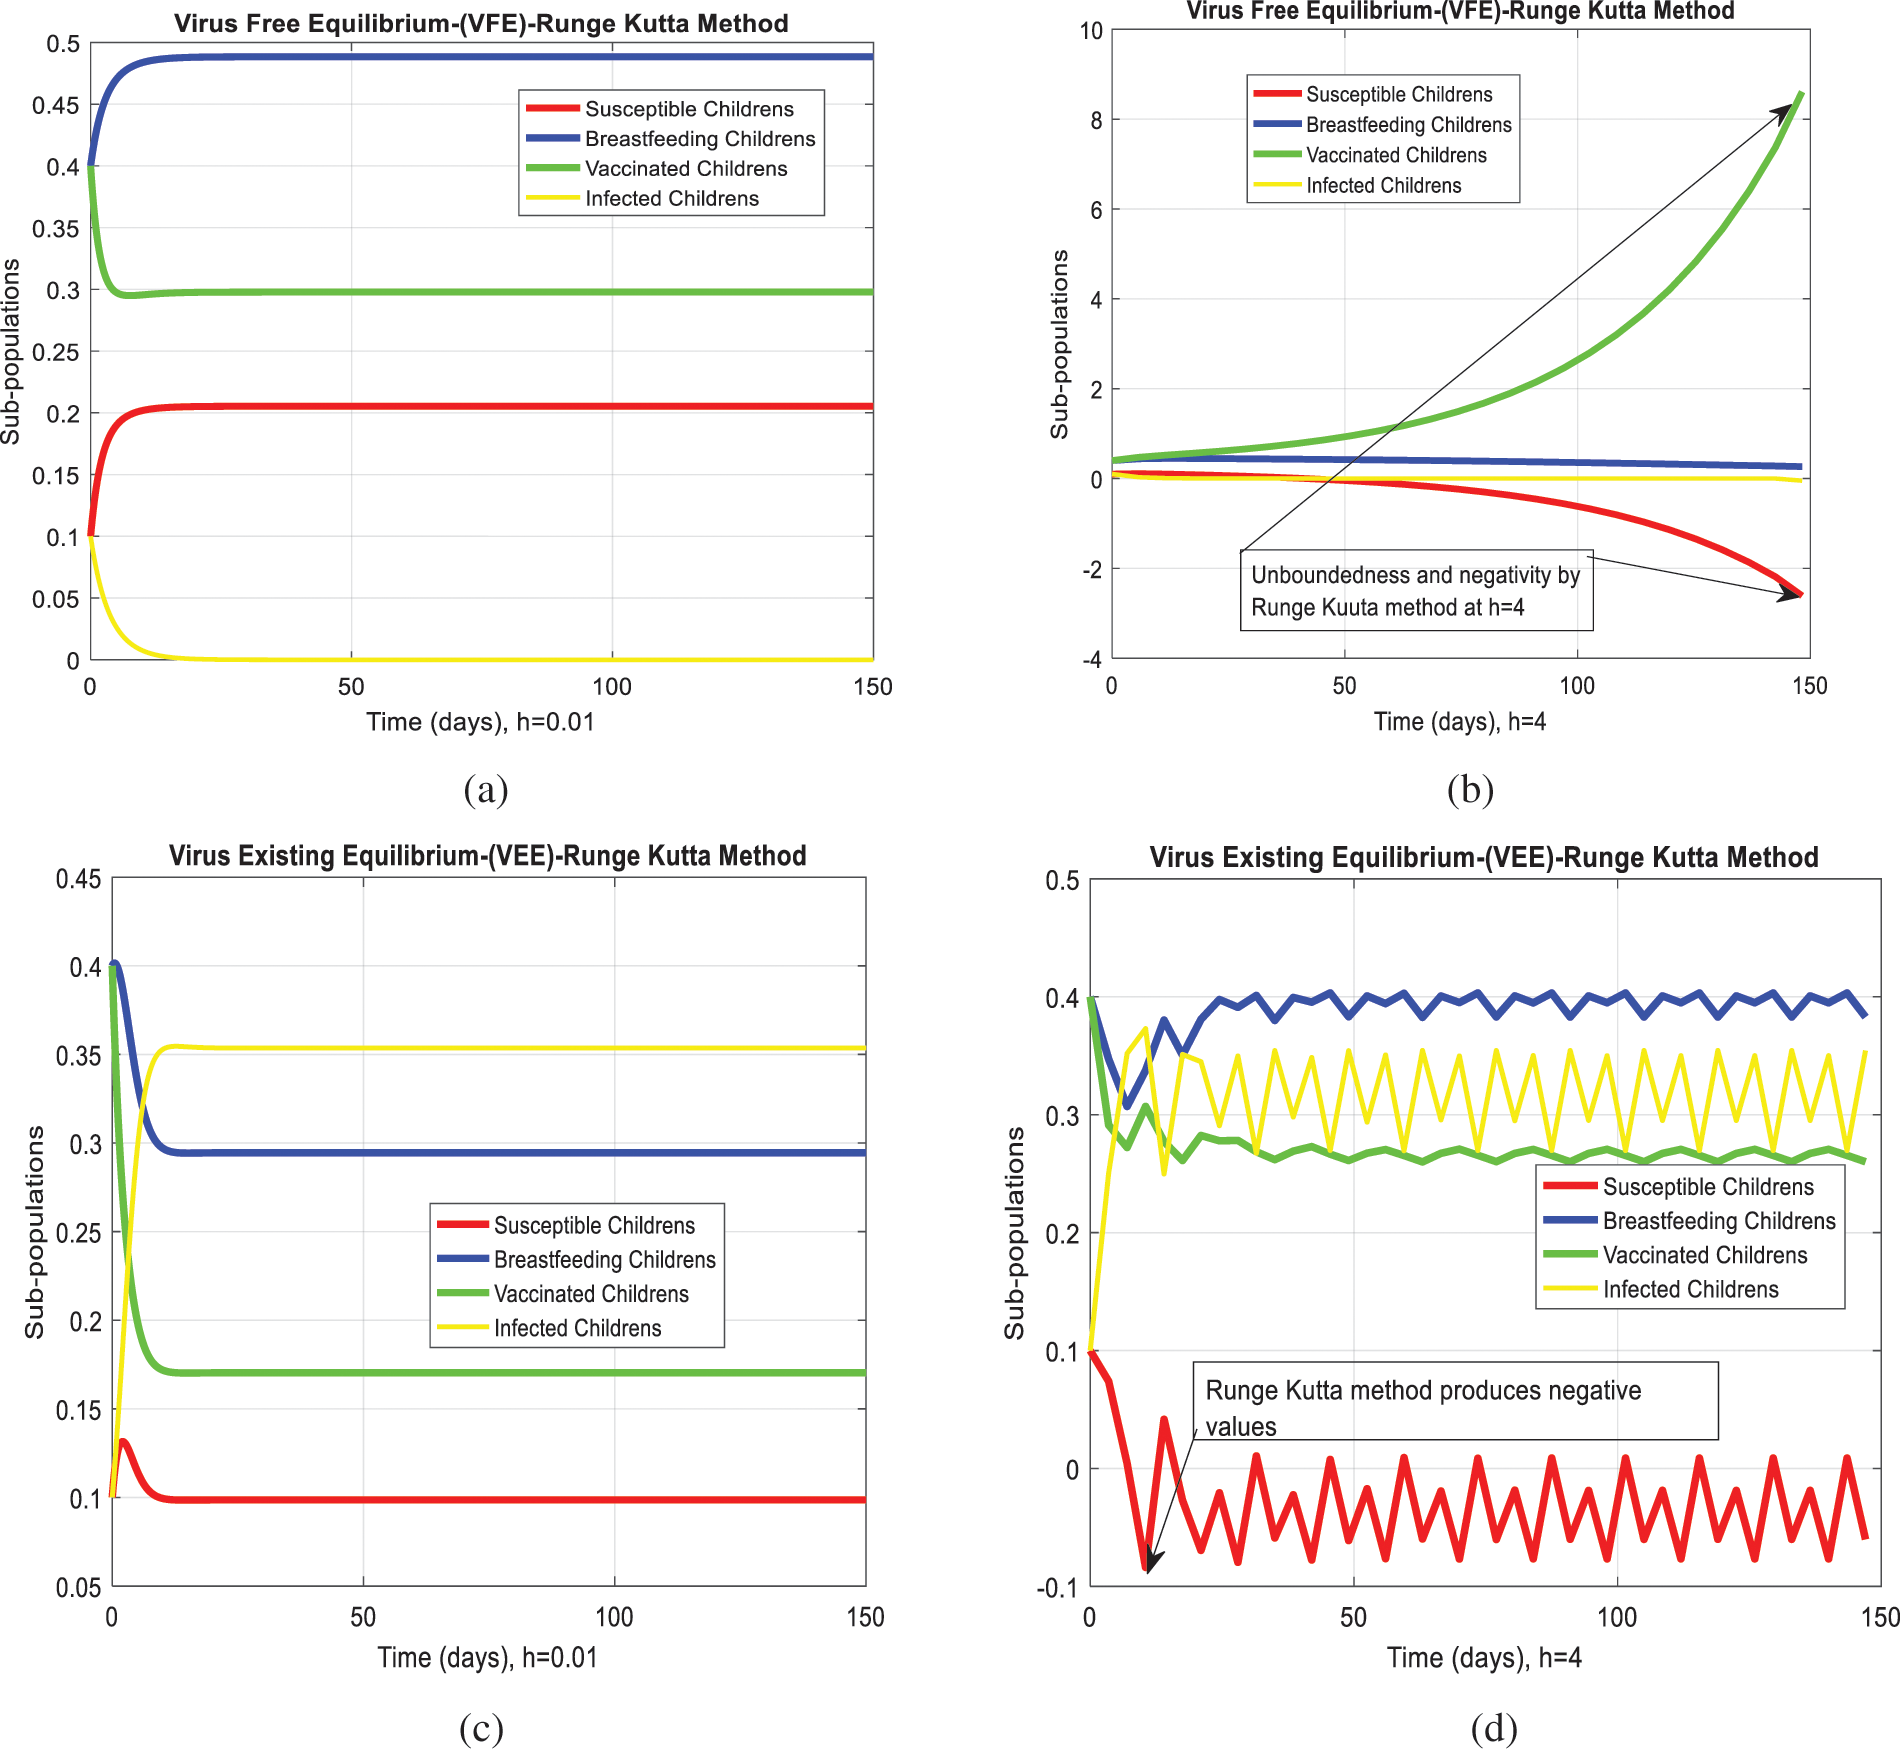
Figure 4: Runge Kutta computation for the behavior of the continuous model at both equilibria of the rotavirus disease (a) At
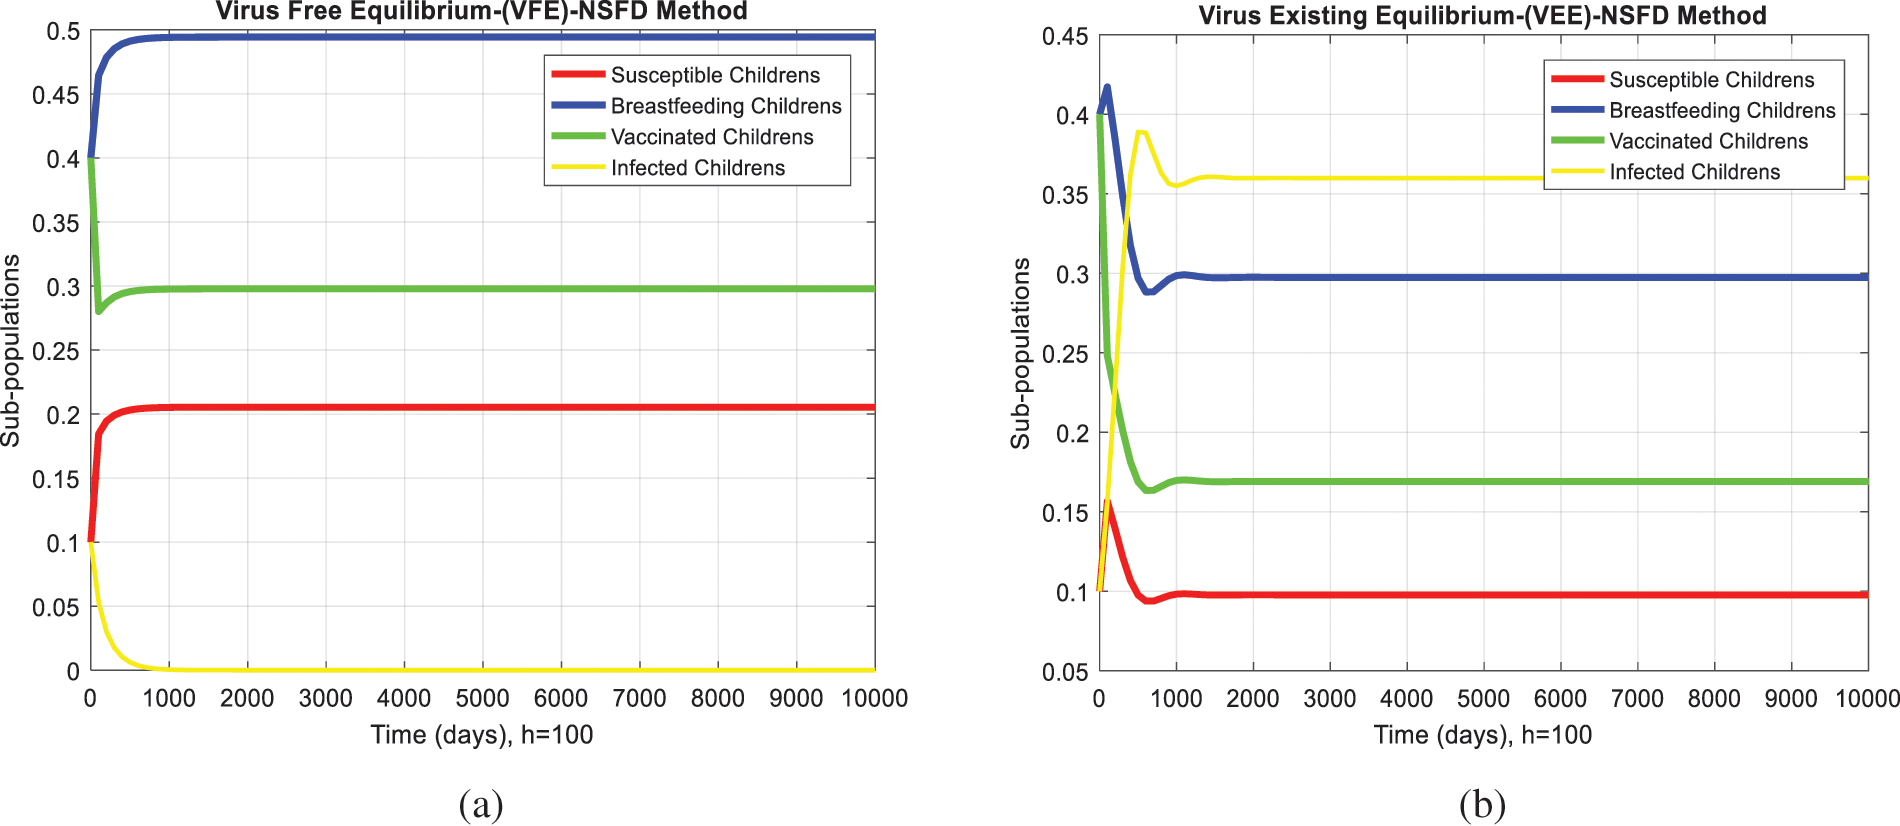
Figure 5: NSFD computation for the behavior of the continuous model at both equilibria of the rotavirus disease (a) Sub-populations at VEE when
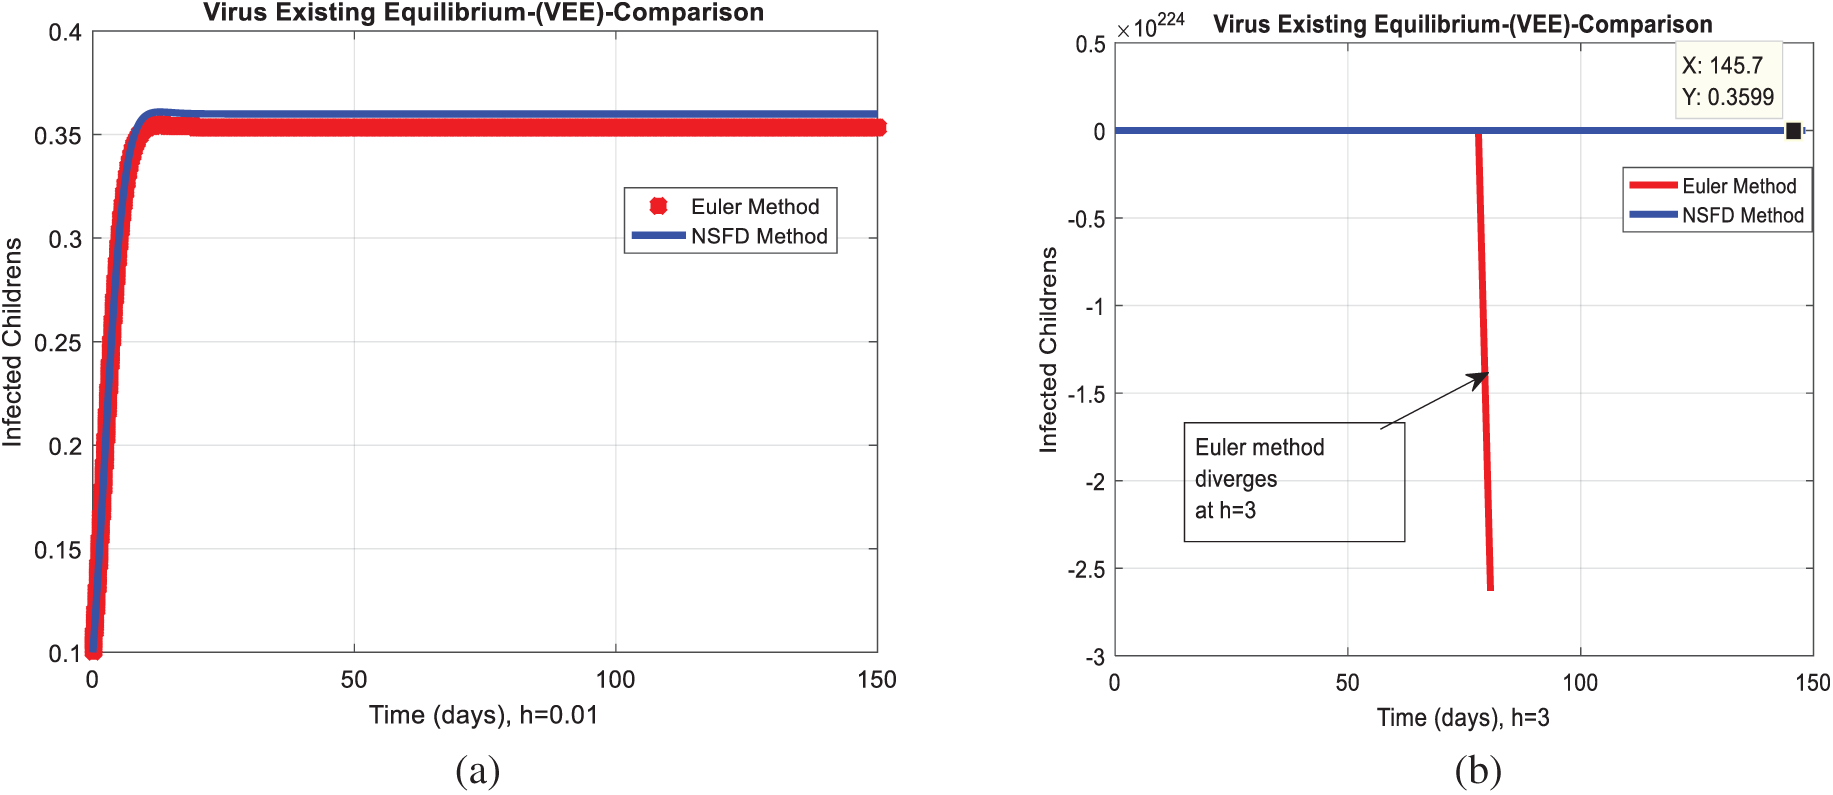
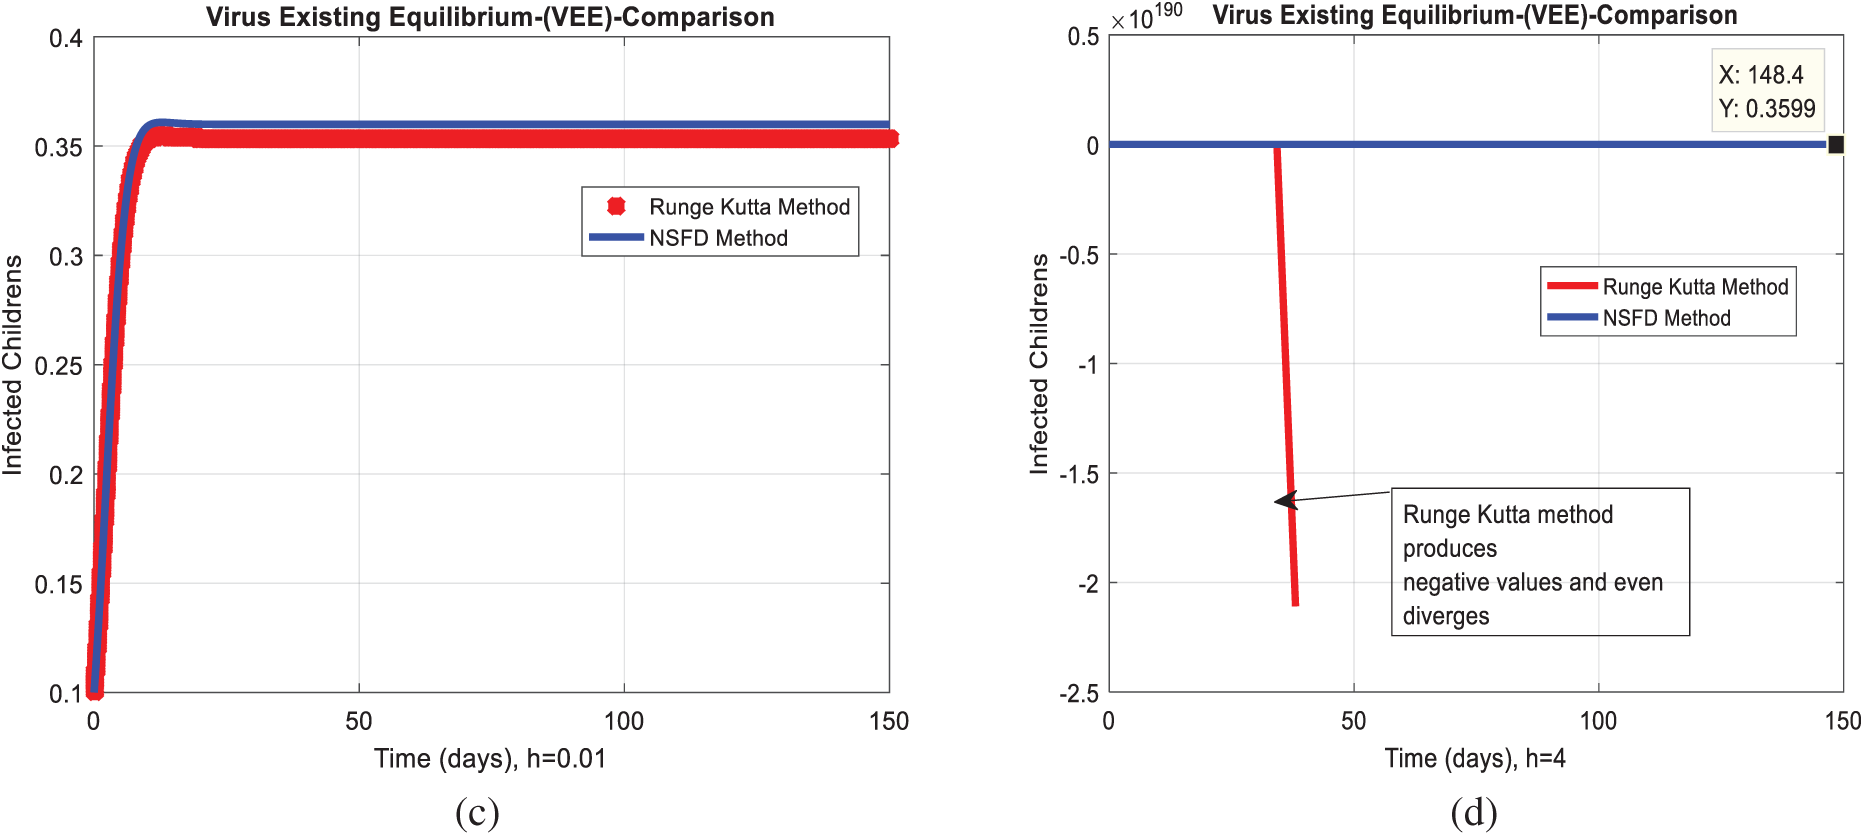
Figure 6: Combined graphical behaviors of NSFD with Euler and Runge Kutta computations at different time-step sizes (a) Infected children for VFE at
Acknowledgement: Thanks, our families and colleagues who supported us morally.
Funding Statement: The author received no specific funding for this study.
Conflicts of Interest: The author declare that they have no conflicts of interest to report regarding the present study.
1. E. Burnett, U. D. Parashar and J. E. Tate, “Real-world effectiveness of rotavirus vaccines, 2006-19: A literature review and meta-analysis,” Lancet Global Health, vol. 8, no. 9, pp. 195–202, 2020. [Google Scholar]
2. S. Ahmad, A. Ullah, M. Arfan and K. Shah, “On analysis of the fractional mathematical model of rotavirus epidemic with the effects of breastfeeding and vaccination under Atangana-Baleanu (AB) derivative,” Chaos, Solitons & Fractals, vol. 140, no. 1, pp. 1–12, 2020. [Google Scholar]
3. C. L. Lin, S. C. Chen, S. Y. Liu and K. T. Chen, “Disease caused by rotavirus infection,” Open Virology Journal, vol. 8, no. 1, pp. 14–19, 2014. [Google Scholar]
4. D. C. Payne, J. A. Englund, G. A. Weinberg, N. B. Halasa, J. A. Boom et al., “Association of rotavirus vaccination with inpatient and emergency department visits among children seeking care for acute gastroenteritis, 2010-2016,” JAMA Network Open, vol. 2, no. 9, pp. 1– 20, 2019. [Google Scholar]
5. O. L. Omondi, O. E. Achieng, T. A. Mwende and G. O. Lawi, “Modeling malaria and rotavirus co-infection,” Neural, Parallel, and Scientific Computations, vol. 26, no. 2, pp. 143–168, 2018. [Google Scholar]
6. T. V. Effelterre, M. Soriano-Gabarro, S. Debrus, E. C. Newbern and J. A. Gray, “Mathematical model of the indirect effects of rotavirus vaccination,” Epidemiology & Infection, vol. 138, no. 6, pp. 884–897, 2010. [Google Scholar]
7. P. K. Chan, J. S. Tam, E. A. Nelson, K. S. Fung, F. A. Adeyemi-Doro et al., “Rotavirus infection in Hong Kong: Epidemiology and estimates of disease burden,” Epidemiology & Infection, vol. 120, no. 3, pp. 321–325, 1998. [Google Scholar]
8. A. D. Linhares, Y. B. Gabbay, R. D. Freitas, E. T. D. Rosa, J. D. Mascarenhas et al., “Longitudinal study of rotavirus infections among children from Belém,” Brazil Epidemiology & Infection, vol. 102, no. 1, pp. 129–145, 1989. [Google Scholar]
9. C. Atchison, B. Lopman and W. J. Edmunds, “Modelling the seasonality of rotavirus disease and the impact of vaccination in England and Wales,” Vaccine, vol. 128, no. 18, pp. 3118–3126, 2010. [Google Scholar]
10. M. M. Arnold, A. Sen, H. B. Greenberg and J. T. Patton, “The battle between rotavirus and its host for control of the interferon signaling pathway,” Plos Pathogens, vol. 9, no. 1, pp. 1–12, 2013. [Google Scholar]
11. S. E. Shuaib and P. A. Riyapan, “Mathematical model to study the effects of breastfeeding and vaccination on rotavirus epidemics,” Journal of Mathematical & Fundamental Sciences, vol. 52, no. 1, pp. 43–65, 2020. [Google Scholar]
12. M. Güzel, O. Akpınar and M. B. Kılıç, “Prevalence of rotavirus-associated acute gastroenteritis cases in early childhood in turkey: Meta-analysis,” Children, vol. 7, no. 10, pp. 1–159, 2020. [Google Scholar]
13. O. S. Folorunso and O. M. Sebolai, “Overview of the development, impacts, and challenges of live-attenuated oral rotavirus vaccines,” Vaccine, vol. 8, no. 3, pp. 1–10, 2020. [Google Scholar]
14. G. L. Bibera, J. Chen, P. Pereira and B. Benninghoff, “Dynamics of G2P strain evolution and rotavirus vaccination: A review of evidence for rotarix,” Vaccine, vol. 38, no. 35, pp. 5591–5600, 2020. [Google Scholar]
15. N. B. Ilmi, I. Darti and A. Suryanto, “Dynamical analysis of a rotavirus infection model with vaccination and saturation incidence rate,” International Journal of Physics Conference Series, vol. 1562, no. 1, pp. 1–19, 2020. [Google Scholar]
16. G. Shumetie, M. Gedefaw, A. Kebede and T. Derso, “Exclusive breastfeeding and rotavirus vaccination are associated with decreased diarrheal morbidity among under-five children in Bahir Dar, northwest Ethiopia,” Public Health Reviews, vol. 39, no. 1, pp. 1–12, 2020. [Google Scholar]
17. A. M. Bennett, “Rotavirus transmission in the context of reduced vaccine effectiveness in low-income countries,” University of Liverpool (United Kingdom), vol. 1, no. 1, pp. 1–29, 2018. [Google Scholar]
18. H. Namawejje, ““Mathematical models for dynamics and control strategies for rotavirus Disease (Doctoral dissertation),” Nelson Mandela African Institution of Science and Technology, vol. 1, no. 1, pp. 1–190, 2016. [Google Scholar]
19. O. L. Omondi, C. Wang, X. Xue and O. G. Lawi, “Modeling the effects of vaccination on rotavirus infection,” Advances in Difference Equations, vol. 382, no. 1, pp. 1–45, 2015. [Google Scholar]
 | This work is licensed under a Creative Commons Attribution 4.0 International License, which permits unrestricted use, distribution, and reproduction in any medium, provided the original work is properly cited. |