DOI:10.32604/cmc.2022.027089
| Computers, Materials & Continua DOI:10.32604/cmc.2022.027089 | |
| Article |
Prediction of Low-Energy Building Energy Consumption Based on Genetic BP Algorithm
1School of Urban Construction, Yangtze University, Jingzhou, 434023, China
2Beijing Sifang Automation Co., Ltd., Beijing, 100085, China
3Australian National University, Canberra, 2600-2601, Australia
*Corresponding Author: Xuehui Gong. Email: 42342496@qq.com
Received: 10 January 2022; Accepted: 11 March 2022
Abstract: Combined with the energy consumption data of individual buildings in the logistics group of Yangtze University, the analysis model scheme of energy consumption of individual buildings in the university is studied by using Back Propagation (BP) neural network to solve nonlinear problems and have the ability of global approximation and generalization. By analyzing the influence of different uses, different building surfaces and different energy-saving schemes on the change of building energy consumption, the grey correlation method is used to determine the main influencing factors affecting each building energy consumption, including uses, building surfaces and energy-saving schemes, which are used as the input of the model and the building energy consumption as the output of the model, so as to establish the building energy consumption analysis model based on BP neural network. However, in practical application, BP neural network has the defects of slow convergence and easy to fall into local minima. In view of this, this paper uses genetic algorithm to optimize the weight and threshold of BP neural network, completes the improvement of various building energy consumption analysis models, and realizes the qualitative analysis of building energy consumption. The model verification results show that the viscosity of the building energy consumption analysis model based on genetic algorithm improved BP neural network algorithm (GABP) in this paper is relatively high, which is more accurate than the results of the traditional BP neural network model, and the relative error of the analysis model is reduced from 11.56% to 8.13%, which proves that the GABP can be better suitable for the study of school building energy consumption analysis model, It is applied to the prediction of building energy consumption, which lays a foundation for the realization of carbon neutralization in the South expansion plan of Yangtze University.
Keywords: Energy consumption analysis model; BP neural network; genetic algorithm
In March 15, 2021, general secretary Xi Jinping proposed that China should strive to achieve “peak carbon dioxide emissions” before 2030, and achieve “carbon neutrality” before 2060, and build a new power system with new energy as the main body in the ninth meeting of the central finance and Economic Committee, and stressed that this is a major strategic decision made by the Communist Party of China Central Committee after deliberation and consideration, which is related to the sustainable development of the Chinese nation and the building of the community of human destiny.
Achieving the goal of “carbon neutrality” cannot be achieved overnight. The development goals of “peak carbon dioxide emissions” and “carbon neutrality” comply with the internal requirements of China's sustainable development, help to build a green, low-carbon and sustainable circular economy, boost green production and lifestyle, and achieve high-quality social development. As the leading unit of science and innovation, colleges and universities are duty bound to “carbon neutrality”. In order to help achieve the goals of “peak carbon dioxide emissions” and “carbon neutrality”, it is necessary to make a “zero carbon” plan for the South expansion of the campus. It is planned to introduce distributed photovoltaic and wind power generation, build distributed building energy storage, use energy-saving building schemes, plan campus green vegetation, lay out in advance for the goal of “carbon neutrality” in the planning stage, and build a zero carbon or even negative carbon campus. Although “carbon neutrality” is a new requirement to achieve environmental protection goals, the research on building energy consumption has always been the focus of research on building energy conservation at home and abroad. Building a building energy consumption analysis model can master the law of building energy consumption, make reasonable predictions, and provide a scientific basis for clean energy planning. Internationally, Azadeh et al., use Integration of artificial neural networks and genetic algorithm to predict electrical energy consumption [1]. In China, Yu et al., use BP neural network algorithm build a residential building energy consumption demand model [2], Xia et al., use BP neural network algorithm build Analysis and prediction of regional electricity consumption [3]. In this paper, the application of building energy consumption analysis model based on Genetic BP neural network technology in building energy consumption analysis is to predict the energy consumption of South expansion and provide data support for clean energy planning.
2 Research on Building Energy Consumption Analysis Model Scheme
Building energy consumption analysis is to objectively investigate and quantitatively analyze the use efficiency and energy consumption level of large public buildings through investigation and itemized measurement, and use scientific methods to determine the building energy consumption demand, which is an important basis to measure the building energy conservation level and the later carbon neutralization compensation demand. What kind of prediction basis is the key to energy consumption analysis. At present, there is no good reference basis for energy consumption analysis. Based on the analysis of the main influencing factors of energy consumption in campus buildings, this paper will find out the relationship between building energy consumption and influencing factors of energy consumption, and use neural network method to design building energy consumption analysis model scheme [4–6].
Building energy consumption analysis model needs a lot of real-time data, and the data used in this paper are from the energy consumption data of logistics group. Under normal circumstances, each of its data is a response to real demand, but the epidemic from January to June 2020 has caused data distortion. This paper eliminates this data in the modeling stage to reduce the impact on modeling distortion.
2.1 Analysis on Key Influencing Factors of Building Energy Consumption
This paper mainly analyzes the building energy consumption in the use process of buildings. The factors affecting the building energy consumption in the use process can be divided into three aspects: external climate conditions, building structure and working state [7,8], that is, whether there is a vacation (the vacation is converted into the proportion of winter and summer vacation per month, which is calculated as 30 days per month). This paper takes the complex building, dormitory building and teaching building of Yangtze University as an example to study the impact of monthly average temperature, building surface and vacation on building energy consumption. The meteorological data comes from the weather network (https://www.tianqi.com/). In order to avoid the complexity of many influencing factors, combined with the actual sample data, this paper analyzes the primary and secondary relationship from the above influencing factors, and finds the influencing factors closest to building energy consumption. In this paper, the grey correlation analysis method is used to measure the correlation degree between many factors:
(1) Select parent and child factors.
In this paper, the monthly building energy consumption is selected as the parent factor, and the monthly average temperature, building surface and the proportion of winter and summer vacation are selected as the sub factors. Therefore, the parent factor sequence is Xo(k) and the sub factor sequence is Xi(k), where k = 1, 2, …, m; i = 1, 2, …, n. m is the number of sample data and n is the number of sub factors.
(2) Raw data preprocessing.
Before calculating the correlation degree, we should deal with the data dimensionless. In this way, some data with small values will not lose their function, and some data with large values will be amplified. The common dimensionless processing methods are: initial value change, mean value change, range change and so on. This paper selects the mean change to process the data dimensionless.
Correlation calculation formula
Among them, Δ Is the absolute difference between the parent sequence and the sub sequence at the same time, Δmax, Δmin is the maximum difference and minimum difference respectively, and a is the resolution coefficient, which is generally between 0 and 1, and 0.5 is taken here.
(3) Grey correlation calculation.
In this paper, the energy consumption data of complex building and dormitory building are analyzed according to the average monthly temperature, building surface and the proportion of non winter and summer vacation.
The correlation degree between each factor and building energy consumption is calculated according to the grey correlation analysis method. The building energy consumption is taken as the parent factor, and the monthly average temperature, building surface and the proportion of non winter and summer vacation are taken as the sub factors. The correlation coefficient between each sub factor and building energy consumption is shown in the Tab. 1 below:
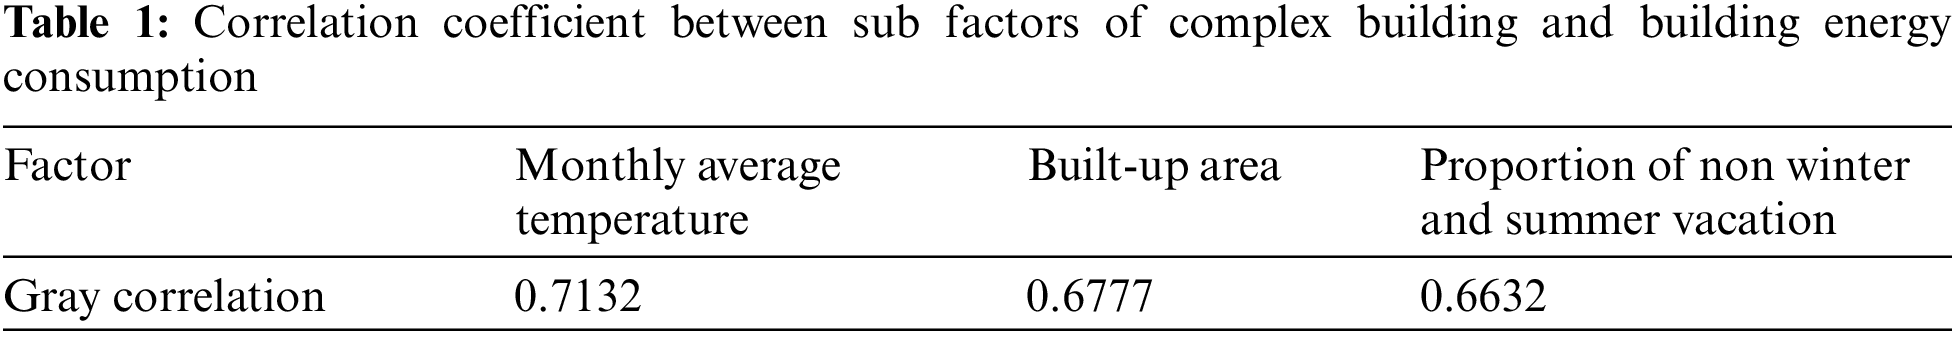
From the above table, we can see that the correlation between various factors and building energy consumption is the proportion of monthly average temperature > building area > non winter and summer vacation from high to low. The correlation coefficient between each factor and power consumption is more than 0.6. Generally speaking, the correlation coefficient is above 0.6, indicating that this factor has a large impact on building energy consumption. Therefore, to sum up, the main factors affecting the energy consumption of public buildings on campus are the average monthly temperature, building surface and the proportion of non winter and summer vacation.
2.2 Scheme Design of Building Energy Consumption Analysis Model
Building energy consumption analysis model has two advantages for building energy conservation and prediction: 1. The development trend of building energy consumption can be predicted through the model and the energy consumption situation can be mastered; 2. The future building energy consumption can be calculated through the model to determine the energy-saving scheme and compensation scheme for the South expansion planning department.
At present, most of the research on building energy consumption models only use energy consumption simulation software to establish basic building models according to the characteristics of building structures. Such building energy consumption models are only a simulation of building energy consumption, lack of research on the actual data of building energy consumption, and are still very different from the actual building energy consumption, The analysis of building energy consumption cannot be accurately carried out according to the actual building energy consumption. With the change of building influencing factors, the building energy consumption data is also changing. The actual building energy consumption is nonlinear, and the change law is difficult to be expressed intuitively by mathematical formula. Artificial neural network (ANN) can establish a model through a large number of real-time data, continuously train and find out the implicit relationship between input and output. It has been applied in a wide range of fields [9].
Therefore, according to the analysis of the main factors affecting building energy consumption, this paper selects the monthly average temperature, building surface and the proportion of non winter and summer vacation as the input of the network, and the output is the building energy value. Combined with different algorithms, this paper establishes the building energy analysis model, so as to master the change law of building energy consumption. Finally, through the future monthly average temperature, building surface and the proportion of non winter and summer vacation as inputs, the future building energy consumption is predicted, which provides a basis for building energy analysis.
In summary, this paper takes the monthly average temperature, building surface and the proportion of non winter and summer vacation as the input of the energy consumption analysis model and the building energy consumption as the output, and designs the building energy consumption analysis model scheme.
2.3 Feasibility Analysis of Building Energy Consumption Analysis Model Scheme
Building energy consumption changes nonlinearly with the change of factors, which is difficult to be expressed by mathematical expression. Neural network can find out the input-output relationship by training and learning a large amount of data. Neural network can store and process information in a distributed way. It has the functions of memory, learning, association and recognition, and has the characteristics of good organization, adaptability and fault tolerance. Neural network has global approximation ability. For nonlinear problems, neural network can realize arbitrary approximation as long as it has a hidden layer. Neural network also has good generalization ability, and has been widely used in industrial fields. Therefore, it is reasonable to establish the building energy consumption analysis model based on neural network and other algorithms. Considering the advantages of building energy-saving technology and neural network, taking the average monthly temperature, building surface and the proportion of non winter and summer vacation as the input of the model and building energy as the output of the model, the energy consumption analysis model scheme of campus public buildings designed in this paper is feasible [10,11].
3 Construction of Building Energy Consumption Analysis Model Based on BP Neural Network
At present, most of the research on building energy consumption model is only energy consumption simulation software, lack of research on the actual data of building energy consumption, and cannot accurately analyze and predict building energy consumption. With the change of energy consumption influencing factors, building energy consumption data are also changing. The relationship between building energy consumption and its influencing factors is a complex nonlinear process, so it is difficult to analyze their relationship directly from the mechanism. Neural network is an excellent intelligent learning method, which can mine the implicit relationship between process parameters and approach the process mechanism by learning and modeling the process data without fully understanding the process mechanism. In this chapter, the three influencing factors of building energy consumption, such as monthly average temperature, building surface and the proportion of non winter and summer vacation, are taken as the input, and the building energy consumption is taken as the output. The building energy consumption analysis model based on BP neural network is established by using BP neural network. Through the energy consumption analysis model, three building energy consumption influencing factors such as building surface are used to predict the building energy consumption value, and the scientificity of the building energy consumption analysis model based on BP neural network is verified.
BP algorithm is also called error back propagation algorithm. Its algorithm process is generally forward propagation and error back propagation. The input signal passes through the hidden layer from the input layer to the output layer. BP network has global approximation ability. For complex nonlinear problems, any approximation can be realized as long as there is a hidden layer [12]. The structure of BP network model is shown in the Fig. 1 below.
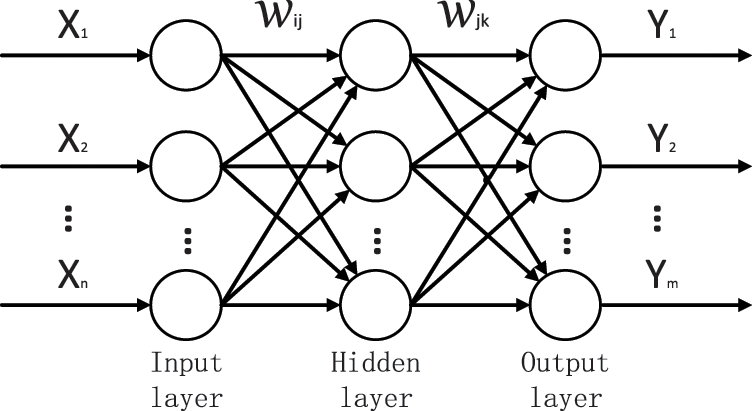
Figure 1: BP network model
In the figure, X1, X2, …, Xn are the inputs of the three-layer BP neural network, Y1, Y2, …, Ym are the outputs of the BP neural network, H1, H2, …, Hm are the expected outputs, n is the number of nodes in the input layer, Wij and Wjk are the weights of the neural network, m is the number of nodes in the output layer, and there are hidden layer nodes l and the threshold of the hidden layer that are not marked in the figure θ, Threshold d of the output layer.
1) Forward propagation of network
①Input of hidden layer:
②Output of hidden layer:
③Define the error function as:
Error back propagation of network
It can be seen from the above three formulas
We derive the output node and its threshold through the error function:
the output node error be
It can be
Since the weight and threshold correction of the output layer are directly proportional to the error function and decrease along the gradient, the weight and threshold correction formulas of the output layer are respectively (in the following formulas) η Learning rate for network:
Similarly, the weight and threshold correction formulas of the hidden layer are respectively:
3.2 Data Selection and Normalization
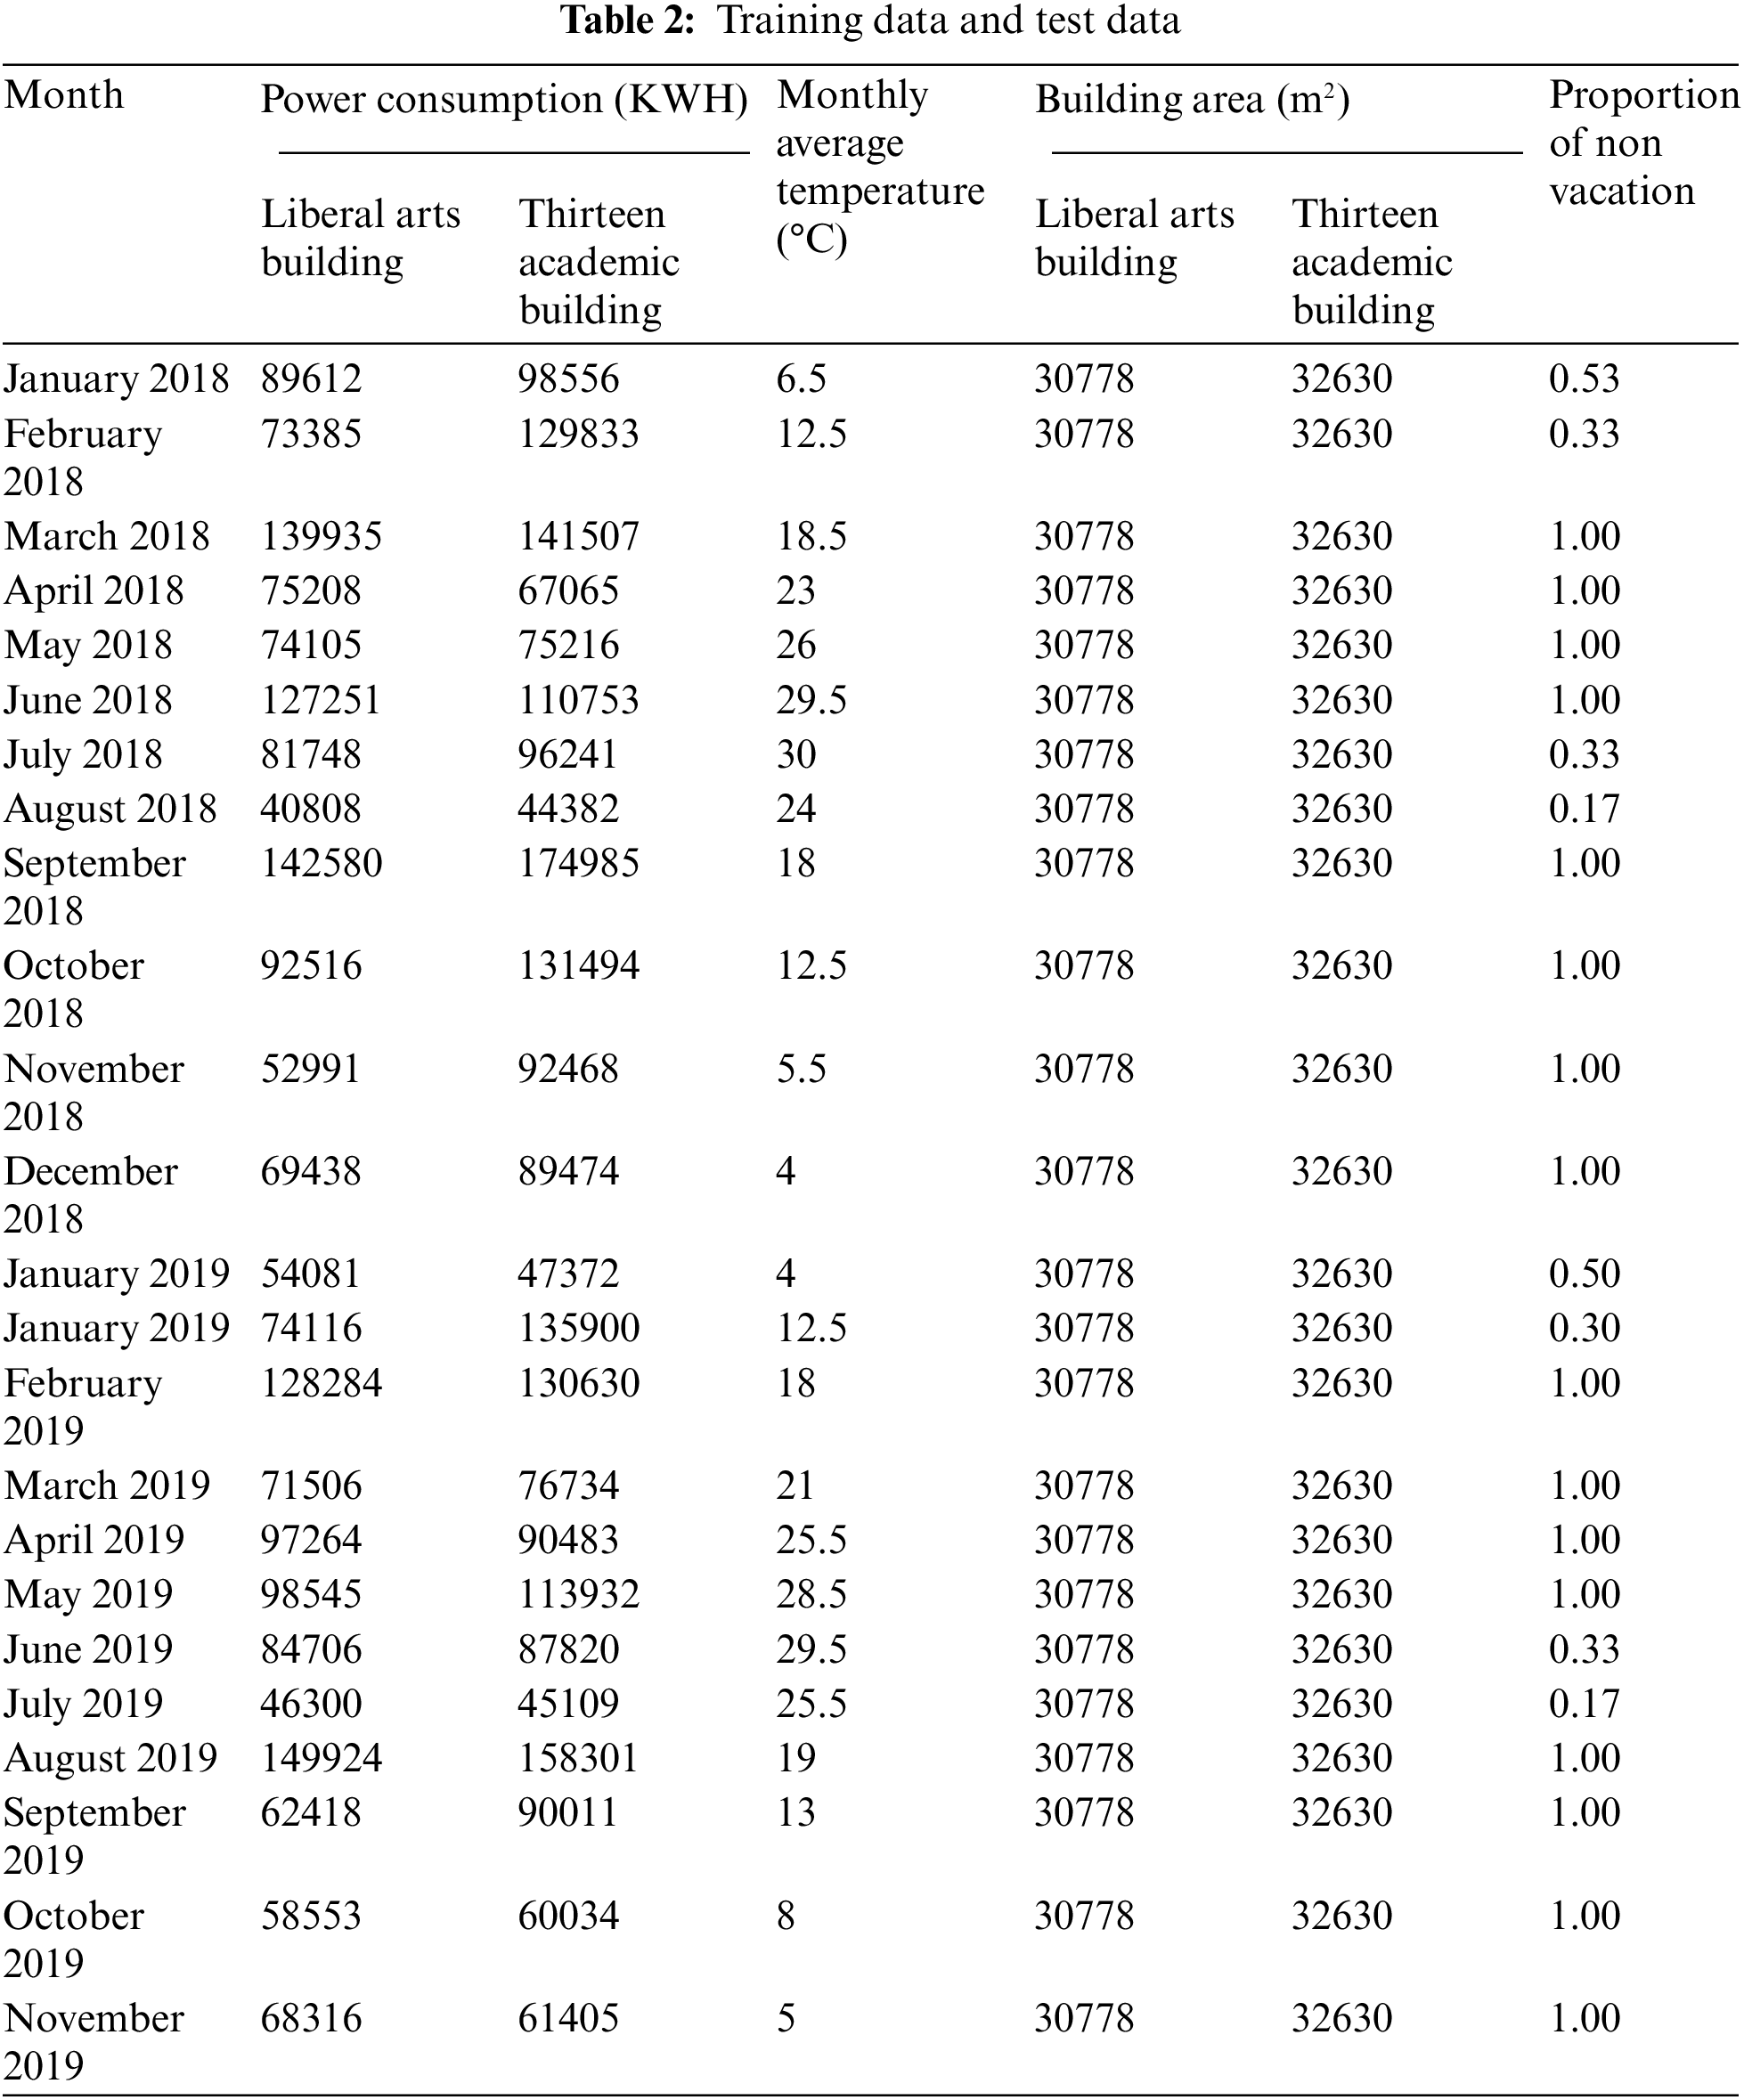
Select the power consumption data of recent three years, and take the data of the previous three years (excluding the data of 2020) from the comprehensive building, teaching building and dormitory building respectively, of which 42 groups are used as the training data and the remaining 6 groups are used as the test data. Training data and test data are as Tab. 2 below:
In BP neural network learning, we also need to normalize the sample data, that is, the input data of the network and the corresponding expected output value, reduce them to the [0, 1] interval, and convert the predicted value between 0 and 1 into the actual value after network learning and training. The normalization formula is shown in the following:
where x is the normalized data, X is the sample data,
3.3 Structure Setting of BP Neural Network
According to the analysis of the main factors affecting building energy consumption, this paper selects building surface, season and vacation as the input of the network, and the output is the building energy value. Then the input vector of the network is:
The output vector of the network is:
where S is the construction surface, C is the season, H is the vacation, and m is the number of samples.
In order to make BP neural network have good generalization ability, this paper selects the hidden layer of the network as one layer according to the simple structure and strong generalization ability. Therefore, the structure of building energy consumption analysis model is shown in the Fig. 2 below.
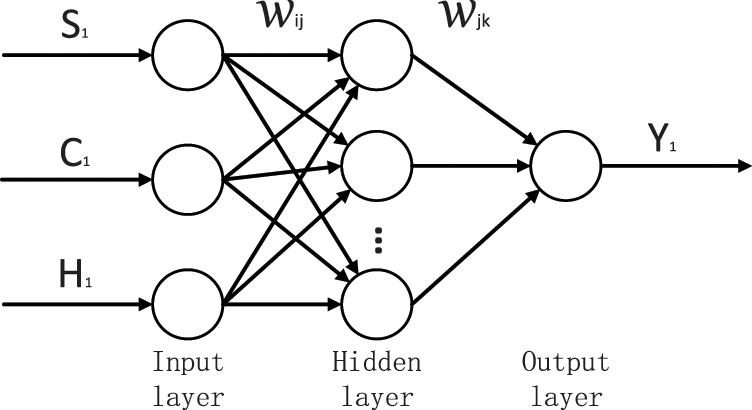
Figure 2: The input and output of BP neural network
Determination of structural parameters of BP neural network:
(1) Selection of activation function and learning function
The activation function of the output node of BP neural network is also different in application: if it is used for classification, the sigmoid function is generally used; If used for function approximation, linear functions should be used. In this paper, the concept of function approximation is used to approach the calculation of energy consumption to a function. Therefore, the output of linear function is also selected in this paper. Sigmoid function is selected as the activation function for the hidden layer. The learning function of this paper selects the gradient descent BP algorithm function.
(2) Input and output node selection
According to the analysis of the factors affecting energy consumption, we know that the influencing factors of building energy consumption studied in this paper are related to building surface, season and vacation. Therefore, we take the building surface, season and vacation as three input variables and one output variable as the building energy value of the neural network. Therefore, there are 3 input nodes and 1 output node.
(3) Selection of hidden nodes
If the number of hidden layer nodes is too small, the prediction error will become larger, and the mapping relationship of BP neural network cannot be accurately reflected; If the number of nodes is too large, the network training time will increase. This paper selects the best number of hidden layer nodes, refers to the following formula, and adopts the trial-and-error method to find the best number of nodes.
In the above formula, a is a constant between 0 and 10, n is the number of output layer nodes, b is the number of hidden layer nodes, and M is the number of input layer nodes. In this paper, n = 1, m = 3. The trial results are shown in the Tab. 3 below.
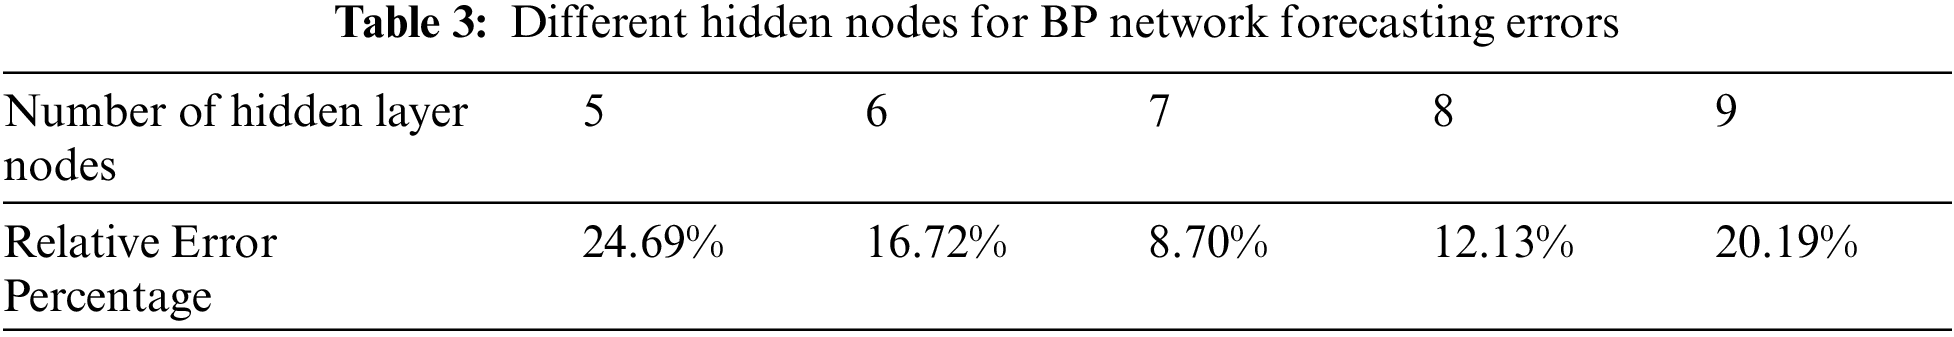
By analyzing the BP network prediction error of different hidden layer nodes in the above table, we determine that the number of hidden layers in this paper is 7. Then the network structure is 3–7–1.
(4) The Determination of Learning rate η
η Too small, too slow to converge, η Too large will lead to non-convergence of the algorithm. Generally, a small learning rate is selected to ensure the stability of the system, and the selection range is between 0.01 and 0.7,η Is 0.01.
(5) Determination of network objectives and training times
In this paper, a small network target and a large number of training times are tentatively determined to train the network. Observe whether the training error curve decreases or decreases very slowly, it indicates that the network has converged. Through many times of network training, this paper takes the training times as 2000 times, and the network target is 0.001.
The flow of BP neural network algorithm:
(1) Network initialization. Determine the number of network input layer nodes 3, hidden layer nodes 7 and output layer nodes 1, and initialize the connection weight and threshold Wij, Wjk, θ And d are given random numbers in an interval (−1, 1), the error function Ek is set, and the calculation target value and maximum learning times are given.
(2) Input 42 learning samples in turn, select the input sample x, and provide the expected output value H to the network.
(3) According to the input sample x, connect the weight Wij and the threshold θ, The output of hidden layer is calculated by transfer function
(4) The output Oj of the hidden layer is used to connect the weight Wjk and the threshold d, and the output of the output layer is calculated by using the transfer function
(5) Compare the network predicted output value Yk with the expected output value Hk, and correct the error in the output layer according to the prediction error indicator
(6) The correction error of hidden layer is calculated
(7) Correct the connection weight and threshold of each layer according to the weight correction formula.
(8) Randomly select the next learning sample and return to step (3) to complete the training of 42 samples.
(9) Randomly select a mode from 42 learning samples and return to step (3) until the global error function E is less than the set value ε or the number of learning times is greater than the set maximum number of times M, the algorithm ends.
3.4 Result Analysis of BP Neural Network Model
Analysis of BP neural network model results this paper uses relative error a, root mean square error RMS and average relative error mean to evaluate the prediction results of energy consumption analysis model. The specific formula is as follows:
Based on the BP neural network energy consumption analysis model, according to the analysis of the building energy consumption of the complex building, teaching building and dormitory building of Yangtze University from 2018 to 2019, six test samples are selected in this paper. The learning rate of the network is 0.01, the learning goal is 0.001, and the network structure is 3–7–1. The training curve of the network is shown in the figure below. After 53 times of training, the target value is reached, the training sample error diagram is shown in Fig. 3, and the energy consumption prediction results and errors of the network are shown in Fig. 4.
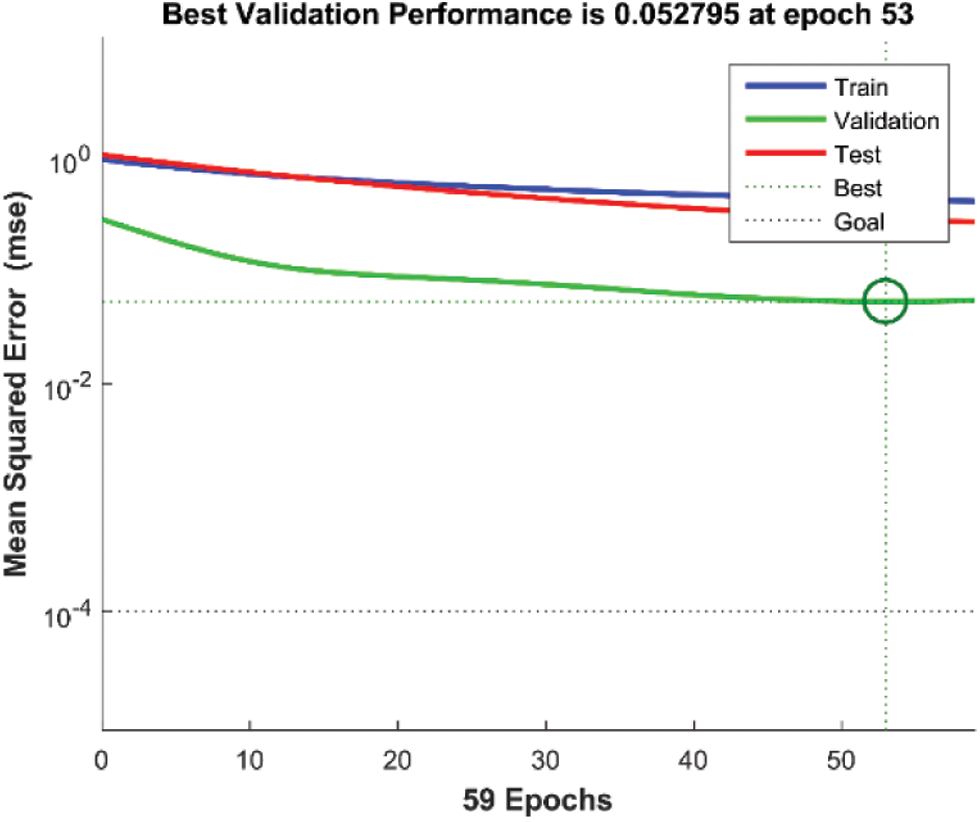
Figure 3: The training curve of BP neural network
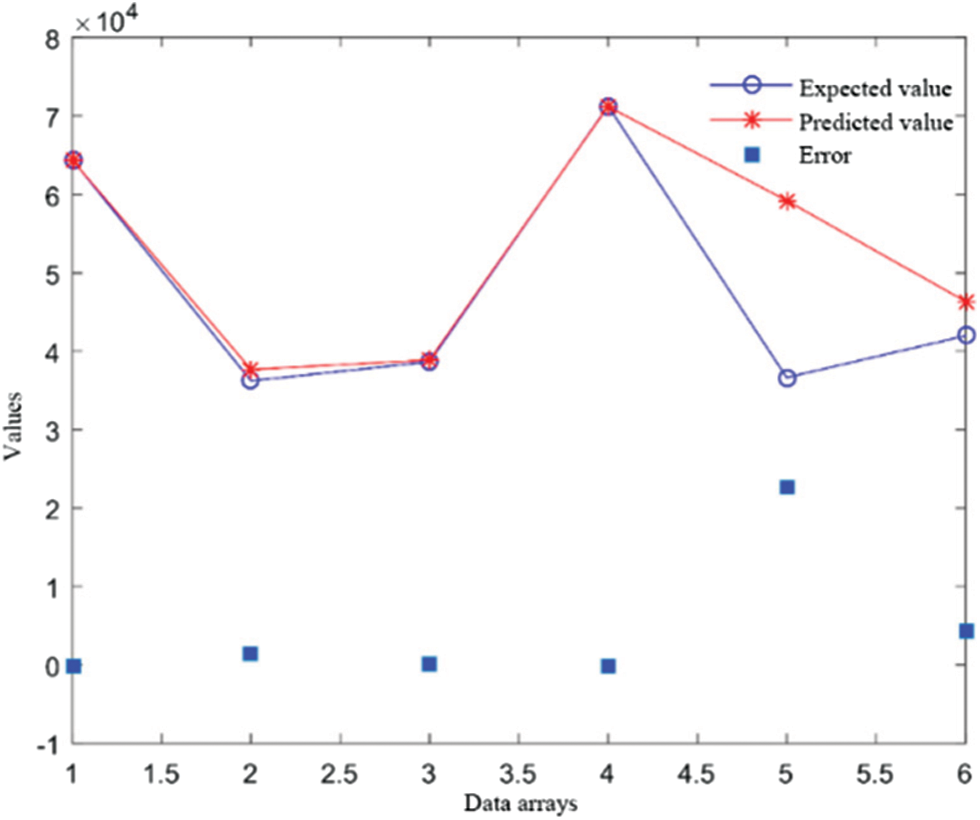
Figure 4: The comparison between predictive value and actual value of BP neural network for building energy consumption
As can be seen from the above figure, the average relative error of energy consumption data predicted by BP neural network model is 8.70%. Therefore, the building energy consumption analysis model based on BP neural network is feasible and scientific.
4 Improvement of Building Energy Consumption Analysis Model and its Application in Energy Consumption Prediction
Because BP algorithm has some defects:
1. The learning convergence speed is slow. The reasons for its slowness are: ① The selection of learning rate is small. Although the network error will be small, the network training speed will be slow; ② number of hidden layers. Through experiments, it is found that the learning speed of multiple hidden layers is slower than that of a single hidden layer; ③ when the BP algorithm performs weight correction, there is no connection between the hidden layers, and it takes a long time for each hidden node to receive error signals continuously.
2. The objective function has local minima. The reasons why it falls into local small are: ① the nonlinear function approximated by the network itself has many minima; ② improper selection of initial weight will also produce local minimum problem. The general methods to improve BP algorithm are: momentum addition method, variable step size method, simulated annealing method and so on. In this chapter, the global optimization ability of genetic algorithms (GA) is used to optimize the weight and threshold of BP network to avoid local minima [13].
4.1 Genetic Algorithm Optimization Method
Genetic algorithms (GA) are proposed by Professor J. Holland of Michigan University in the United States. It is a method to search the optimal solution. In the process of optimization, the evolution of the whole population is always maintained, which is to search and optimize in the population, so it can effectively avoid falling into local minima. The flow diagram of genetic algorithm is shown in Fig. 5, the optimization steps of genetic algorithm are as follows:
(1) First encode the variables;
(2) Population initialization;
(3) Calculate individual fitness value;
(4) Select operation;
(5) Cross operation;
(6) Mutation operation. After steps (4), (5) and (6), the next generation group is obtained;
(7) It is judged that a certain stop condition is satisfied. If t ≤ g, turn to step (3), and if t > G, go to the next step;
(8) The optimal solution of the chromosome with the best fitness value in the population of the problem is output.
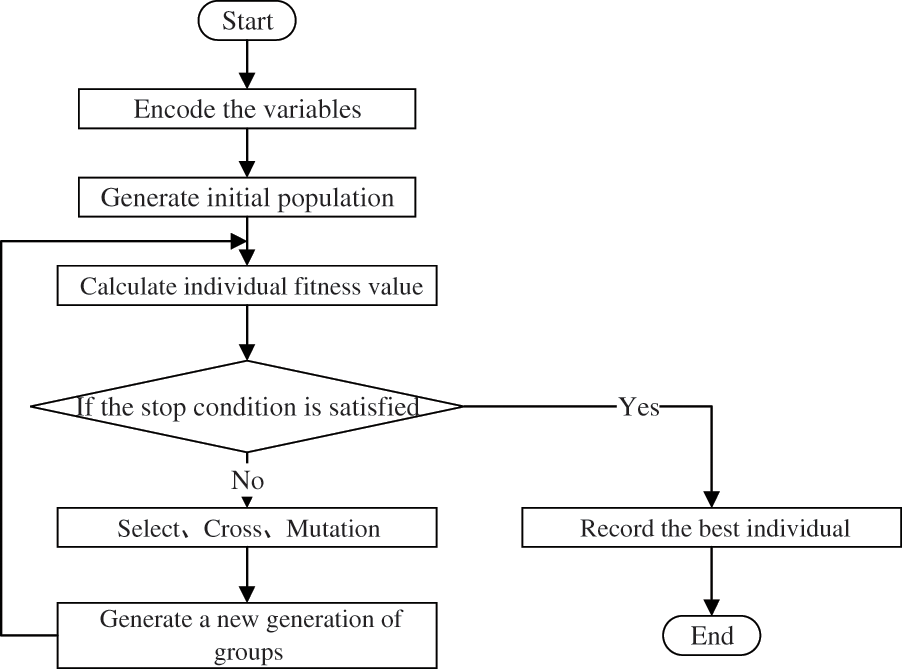
Figure 5: The flow diagram of genetic algorithm
4.2 Parameter Selection and Process of Genetic BP Algorithm
(1) Determine the encoding length. This paper mainly uses genetic algorithm to optimize the initial weight and threshold of the network, and uses the individual coding method of binary coding to encode all the weight and threshold of the BP neural network. The network structure selected in this paper is 3–7–1, so there are 3 × 7 + 7 × 1 = 28 weights, 7 + 1 = 8 threshold values, and the individual coding length is (28 + 8) × 10 = 360, 10 is the weight threshold binary word length.
(2) Generate the initial population. Since this paper has no prior knowledge of the solution of the problem, this paper adopts a completely random method to generate the initial population. When the initial population size is small, the population diversity will be reduced; When the initial population size is large, although it is easy to find the global optimal solution, it increases the complexity of calculation. Therefore, M is generally taken as 20∼100. The population size selected in this paper is 50.
(3) Fitness function. Fitness is helpful to find the optimal solution in optimization calculation. The individual fitness value f in this paper selects the average relative error of the training data of the network, and the calculation formula is:
(4) Select the action. This paper selects roulette method, that is, the probability of inheritance to the next generation population is directly proportional to the individual fitness. The formula is as follows:
(5) Cross operation. Since the individuals in this paper are binary coded, the crossover method is adopted, that is, if the individual
In this paper, the crossover probability is 0.9.
(6) Mutation operation. The four most commonly used mutation operators for real number coding in genetic algorithm are uniform mutation operator, boundary mutation operator, non-uniform mutation operator and Gaussian mutation operator. Because the weight and threshold of neural network are optimized, the non-uniform mutation operator is selected in this paper. Select the j-th gene of individual
(7) Calculate individual fitness value. Until the individual has evolved t generation, repeat the selection, crossover and mutation operations to output the best individual. Generally, t is taken as 100∼500. In this paper, t is 100.
(8) After the evolution, the best fitness value is selected, and the individual corresponding to the best fitness value is the optimal weight and threshold in the neural network training in this paper.
4.3 Analysis of Model Validation Results
Based on the energy consumption analysis model of genetic BP neural network. The relative error of energy consumption prediction of BP network optimized by GA is shown in Fig. 6 below.
As can be seen from the above figure, the average relative error of energy consumption data after GABP neural network model training is 8.13%, and the prediction error of BP network is 11.56%. Compared with the BP neural network model, the GABP neural network model greatly improves the accuracy and feasibility of the analysis model. Therefore, the genetic BP neural network in this paper is suitable for the study of the energy consumption analysis model of large public buildings in Yangtze University. Based on the building energy consumption analysis model, we can predict the energy consumption of the South expansion building, predict the future energy consumption, and provide the planning basis for the school's carbon neutralization.
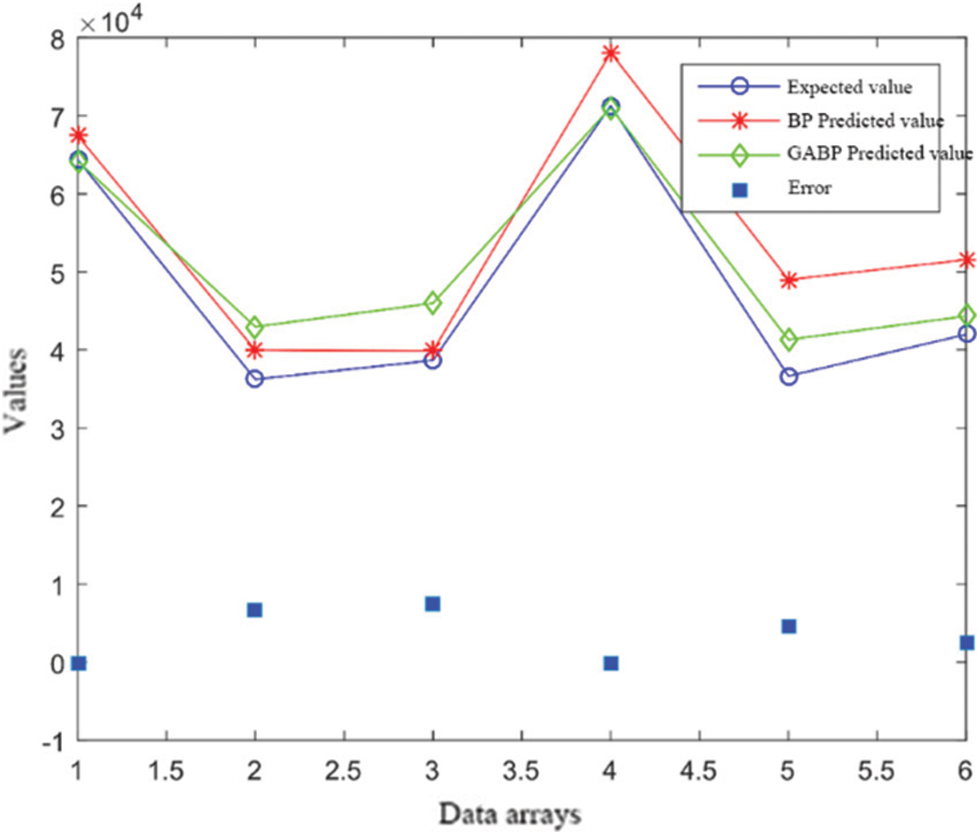
Figure 6: The contrast of p1imary training data and forecast data
Based on the existing power consumption data of logistics group. Based on neural network, by analyzing the influencing factors of building energy consumption, the scheme design of analysis model of comprehensive building, teaching building and dormitory building is carried out. The energy consumption analysis model of BP neural network is established and its feasibility is verified. In view of the slow convergence of BP neural network and easy to fall into local minimum, genetic algorithm is used to optimize BP neural network. Compared with BP neural network analysis model, it shows that the energy consumption analysis model based on Genetic BP neural network is more accurate and scientific [14–17]. It provides a theoretical and practical basis for the South expansion and carbon neutralization planning of the school.
Acknowledgement: This study was supported by the Yangtze University Innovation and Entrepreneurship Course Construction. Website: http://cxcy.yangtzeu.edu.cn/info/1013/1307.htm.
Funding Statement: The authors received the sources of funding of a project, The Name: Special Project for Innovation and Entrepreneurship Education Reform in Hubei Province Colleges and Universities (2020), Item Number: 136/5013602701.
Conflicts of Interest: The authors declare that they have no conflicts of interest to report regarding the present study.
1. A. Azadeh, S. F. Ghaderi and S. Tarverdian, “Integration of artificial neural networks and genetic algorithm to predict electrical energy consumption,” Applied Mathematics & Computation, vol. 186, no. 2, pp. 1731–1741, 2017. [Google Scholar]
2. W. Yu, B. Li and Y. Lei, “Analysis of a residential building energy consumption demand model,” Energies, vol. 4, no. 3, pp. 475–487, 2011. [Google Scholar]
3. P. P. Xia, A. H. Xu and T. Lian, “Analysis and prediction of regional electricity consumption based on BP neural network,” Journal of Quantum Computing, vol. 2, no. 1, pp. 25–32, 2020. [Google Scholar]
4. Z. Q. Yu and H. Yu, “Genetic evolutionary training in neural control neural network control,” in Neural Network Control, 1st ed., vol. 8. Xi'an, China: Xi'an University of Electronic Science and Technology Press, pp. 215–260, 2009. [Google Scholar]
5. M. A. Haq and M. Abdul, “Dnnbot: Deep neural network-based botnet detection and classification,” Computers, Materials & Continua, vol. 71, no. 1, pp. 1729–1750, 2022. [Google Scholar]
6. N. Venkateswaran and K. Umadevi, “Hybridized wrapper filter using deep neural network for intrusion detection,” Computer Systems Science and Engineering, vol. 42, no. 1, pp. 1–14, 2022. [Google Scholar]
7. X. Y. Sun, “Analysis of the influence of different glass types on the energy consumption of residential air conditioning heating,” Power Generation & Air Condition, vol. 36, no. 4, pp. 23–30, 2015. [Google Scholar]
8. M. H. Li and L. Min, “Prediction of public building energy consumption by using artificial fish-swarm algorithm,” in Chinese Automation Congress, WuHan, China, pp. 203–210, 2016. [Google Scholar]
9. N. C. Seong, J. H. Kim and W. Choi, “Development of optimization algorithms for building energy model using artificial neural networks,” Journal of the Korean Society of Living Environmental System, vol. 24, no. 1, pp. 29–36, 2017. [Google Scholar]
10. J. Li and Y. Lu, “Using BP neural networks for the simulation of energy consumption,” in 2014 IEEE Int. Conf. on Systems, Man, and Cybernetics, San Diego, CA, USA, pp. 392–410, 2014. [Google Scholar]
11. K. Li, C. Hu and G. Liu, “Building's electricity consumption prediction using optimized artificial neural networks and principal component analysis,” Energy & Buildings, vol. 108, no. 12, pp. 106–113, 2015. [Google Scholar]
12. H. Zhou, Y. J. Chen and S. M. Zhang, “Ship trajectory prediction based on BP neural network,” Journal on Artificial Intelligence, vol. 1, no. 1, pp. 29–36, 2019. [Google Scholar]
13. Y. Yang, Y. Chen and J. Shi, “An improved grey neural network forecasting method based on genetic algorithm for oil consumption of China,” Journal of Renewable & Sustainable Energy, vol. 8, no. 2, pp. 332–343, 2016. [Google Scholar]
14. Q. Wang and X. Wang, “Parameter's optimization of the heating furnace control systems based on BP neural network improved by genetic algorithm,” Journal of Internet of Things, vol. 2, no. 2, pp. 75–80, 2020. [Google Scholar]
15. A. Tk, A. Ks, B. Mhh, C. Ka, D. Gtr et al., “Eters: A comprehensive energy aware trust-based efficient routing scheme for adversial wsns.” Future Generation Computer Systems, vol. 125, no. 12, pp. 921–943, 2021. [Google Scholar]
16. C. Iwendi, P. K. R. Maddikunta, T. R. Gadekallu, K. Lakshmanna, A. K. Bashir et al., “A metaheuristic optimization approach for energy efficiency in the iot networks.” Software: Practice and Experience, vol. 11, no. 2, pp. 921–943, 2020. [Google Scholar]
17. S. Agrawal, S. Sarkar, G. Srivastava, P. Maddikunta, and T. R. Gadekallu, “Genetically optimized prediction of remaining useful life,” Sustainable Computing: Informatics and Systems, vol. 31, no. 11, pp. 1749–1786. 2021. [Google Scholar]
 | This work is licensed under a Creative Commons Attribution 4.0 International License, which permits unrestricted use, distribution, and reproduction in any medium, provided the original work is properly cited. |