DOI:10.32604/cmc.2022.027111
| Computers, Materials & Continua DOI:10.32604/cmc.2022.027111 | |
| Article |
Breast Cancer Detection in Saudi Arabian Women Using Hybrid Machine Learning on Mammographic Images
1Division of Radiology, Department of Medicine, Medical College, Najran University, Najran, 61441, Kingdom of Saudi Arabia
2Department of Computer Science, COMSATS University Islamabad, Sahiwal Campus, Sahiwal, 57000, Pakistan
3Department of Radiology, College of Medicine, Qassim University, Buraidah, 52571, Kingdom of Saudi Arabia
4Department of Radiology, King Fahad Specialist Hospital, Buraydah, 52571, Kingdom of Saudi Arabia
5Electrical Engineering Department, College of Engineering, Najran University, Najran, 61441, Kingdom of Saudi Arabia
6Radiology Department, Human Medicine College, Zagazig University, Zagazig, 44631, Egypt
7Department of Surgery, College of Medicine, Najran University, Najran, 61441, Kingdom of Saudi Arabia
8Department of Computer Science, Bahauddin Zakariya University, Multan, 66000, Pakistan
9Radiological Sciences Department, College of Applied Medical Sciences, Najran University, Najran, 61441, Kingdom of Saudi Arabia
*Corresponding Author: Khalaf Alshamrani. Email: kaalshamrani@nu.edu.sa
Received: 11 January 2022; Accepted: 08 March 2022
Abstract: Breast cancer (BC) is the most common cause of women’s deaths worldwide. The mammography technique is the most important modality for the detection of BC. To detect abnormalities in mammographic images, the Breast Imaging Reporting and Data System (BI-RADs) is used as a baseline. The correct allocation of BI-RADs categories for mammographic images is always an interesting task, even for specialists. In this work, to detect and classify the mammogram images in BI-RADs, a novel hybrid model is presented using a convolutional neural network (CNN) with the integration of a support vector machine (SVM). The dataset used in this research was collected from different hospitals in the Qassim health cluster of Saudi Arabia. The collection of all categories of BI-RADs is one of the major contributions of this paper. Another significant contribution is the development of a hybrid approach through the integration of CNN and SVM. The proposed hybrid approach uses three CNN models to obtain ensemble CNN model results. This ensemble model saves the values to integrate them with SVM. The proposed system achieved a classification accuracy, sensitivity, specificity, precision, and F1-score of 93.6%, 94.8%, 96.9%, 96.6%, and 95.7%, respectively. The proposed model achieved better performance compared to previously available methods.
Keywords: Breast cancer; CNN; SVM; BIRADS; classification
Breast cancer (BC) is considered the most fatal disease and is considered one of the major causes of death among females [1]. BC spreads widely in women over the age of 30. Family history, older age, and consuming lots of fats are influencing factors for BC [2]. Radiologists evaluate mammograms regularly using the Breast Imaging Reporting and Data System (BI-RADs) [3,4]. The BI-RADs mammography includes qualitative data to illustrate the shape, margin, and density of the mass, as well as microcalcifications, architectural distortion, and association features. Based on these characteristics, radiologists consign the mass lesion to one of the following BI-RADs categories: BI-RADs-2, benign; BI-RADs-3, probably benign; BI-RADs-4, suspicious; BI-RADs-5, highly suggestive of malignancy. As a result, radiologists advise annual screening for BI-RADs- 2, a short-interval follow-up in 6 months for BI-RADs-3, and biopsy for BI-RADs-4 and BI-RADs-5 [5].
Currently, many types of cancers are spreading around the world. According to the Global Cancer Observatory (GCO) 2020 [6] statistical reports, the ratios of the estimated new cases of breast cancer for females in the world, in Asia, and in Saudi Arabia are 24.5%, 22.9%, and 29%, respectively. On the other hand, the death ratios in the world, in Asia, and in Saudi Arabia are 15.5%, 14.4%, and 20.4%, respectively. As compared to other cancers, the estimated reported new cases and death cases of breast cancer are 29% and 20.4% in Saudi Arabia, as shown in Fig. 1. The estimated proportion of new breast cancer cases represents an alarming situation in Saudi Arabia. Therefore, strong assessment and controlling mechanisms must be introduced to reduce their effects.
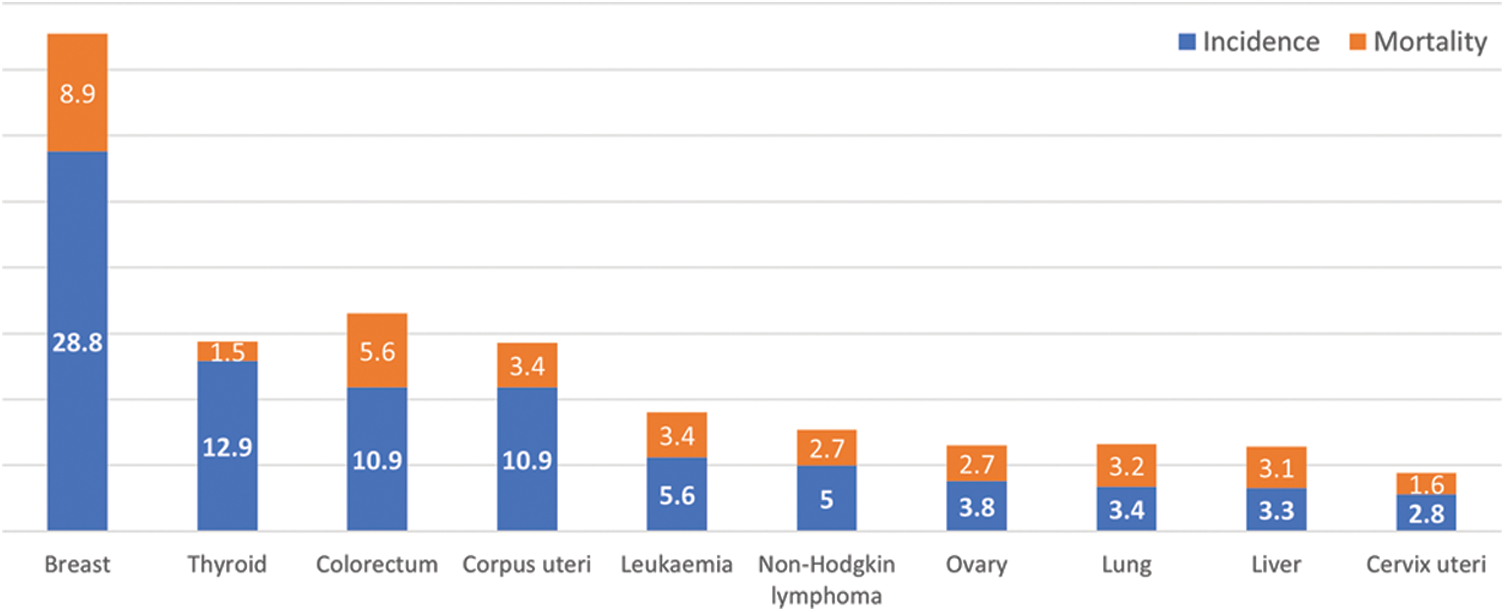
Figure 1: Estimated age-standardized incidence and mortality rates (as per 100,000) of all cancers in 2020, saudi arabia
Research associated with BC has accelerated in the recent decade as it is considered the most fatal disease. Many imaging methods can be used to screen and diagnose malignancy at an early stage [7]. The survival rate of BC in developed countries is high compared to underdeveloped countries, as there is a lack of early detection programs; thus, the patient is diagnosed at a late stage of the cancer, which complicates cures and causes a high mortality rate [8]. To overcome this, an early detection program for BC must be established, and women must be educated in self-examination. In some cases, when the disease is diagnosed at an early stage, the likelihood of full recovery is increased. However, in other cases, when the disease is recognized at a later stage, where it has already metastasized to different organs, the probability of full recovery is decreased, and it becomes a challenge for the medical team [9].
In the last few decades, the mammogram was used to detect the abnormal growth of cells in the case of breast cancer [10]. Females suffering from BC may show architectural distortion, microcalcification, mass, and asymmetries in the breast on mammogram images [11].
Many imaging techniques such as mammography, ultrasound, and MRI are available to detect cancer. Mammography is the best technique to help diagnose the disease, which uses low-energy X-rays for diagnosis and screening purposes. Early detection of BC may help to save human lives [12]. Mammography utilizes ionizing radiation, and the breast is compressed to get images of flattened tissues for early detection and to get rid of blurry images. However, the density of masses in the tissues due to breast thickness in younger women is an obstacle in detecting tumors, and the mammogram has low sensitivity in such cases [13]. The breast images obtained from mammography are processed by eliminating normal and background areas from the mammogram so that the focus remains restricted to the affected tissue only, as depicted in Fig. 2. The quality of the image and intensity of the pixel are crucial in identifying the disease. A higher pixel intensity of malignant tissue helps in detecting tumors [14].
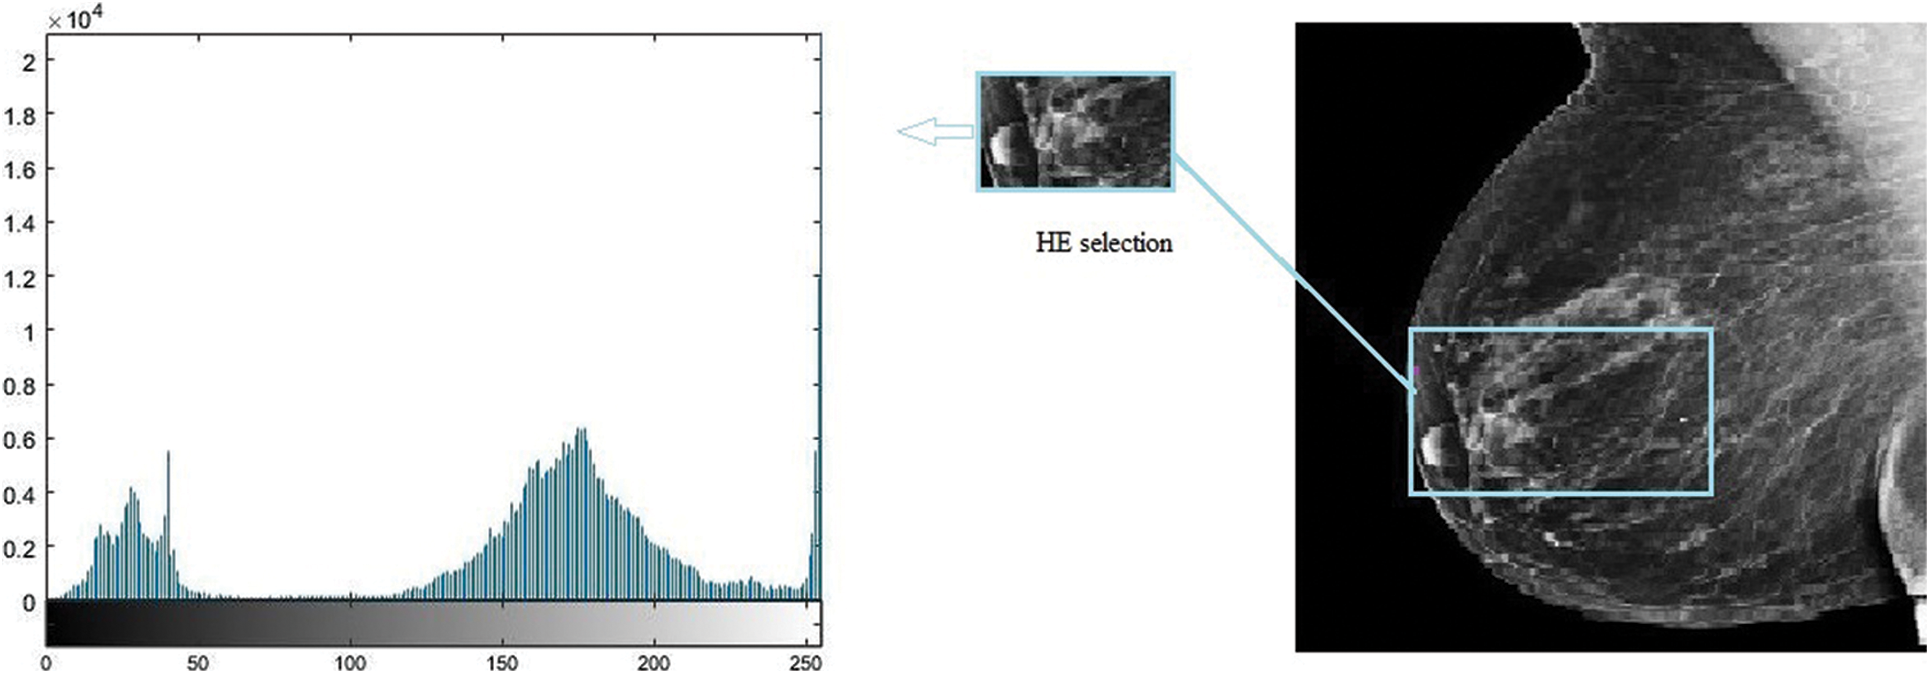
Figure 2: Histogram equalizer
Different image processing techniques are applied during mammographic examination for feature extraction and image format conversion to refine the dataset and enhance the study. In this regard, neural networks provide an alternative for best feature extraction. Nonlinear processing layers are introduced in deep learning with machine learning and artificial intelligence combined to extract information from the dataset [15]. On mammogram images, dense breasts conceal the malignant cells; in such cases, it becomes difficult for mammography to detect tumors, leading to false negatives [16,17].
In image classification, CNN has become very popular in recent years; in this paper, an automatic BC detection method is presented using CNN with the integration of an SVM [18]. The proposed method can be promising for supporting radiologists in accurate patient detection according to spontaneously allocated BI-RADs classes in mammography images [19]. The key objective is to make mammographic terminology clearer and more consistent among radiologists and referring doctors. CNN effectively encapsulates spatial and temporal dependencies and differentiates images by assigning weights and biases. Moreover, the approach in this study uses three models (models 1, 2, and 3) to get ensemble model results. They have different CNN structures with various layers, parametric functionalities, learning rates, strides, and filter sizes. All models are combined to obtain a metric used as an input for the ensemble model. The ensemble model saves the values to integrate them with SVM. This ensembled-based integration approach was selected to allow a fair comparison of the proposed method with benchmark papers. Thus, the contributions of this paper are as follows:
• The availability of authentic data for various BI-RADs is a key challenge, and the prime contribution of this paper is the data collection of BC patients for BI-RADs-1 to BI-RADs-5 from the Qassim region of Saudi Arabia.
• The second contribution is the development of the CNN-based ensemble approach with the integration of SVM for BC classification.
• Most published studies are limited to certain BI-RADs and did not consider all BI-RADs. Thus, another significant contribution of this paper is the classification of all possible BI-RADs for evaluation purposes.
In recent years, many approaches based on different algorithms have been recommended for BC detection. Some of the proposed methods are discussed below.
Ng et al. [20], in BC detection, obtained microwave images and applied gelatin oil technology to improve the efficiency of the obtained images. The images of breasts containing malignant cells were originally obtained using an ultrawideband (UWB) antenna. Kennedy et al. [21] offered an amalgam technique combining both thermography and mammography. When experiments were conducted using thermography and mammography, the accuracy was 83% and 90%, respectively, whereas the combined approach achieved an accuracy of 95%. Al-Antari et al. [22] performed a fourfold cross-validation test on the proposed full-resolution convolutional network using a computer-aided design framework (CAD). The dataset obtained from an open-source database named INbreast database was used to evaluate the performance of the suggested framework. To test the efficiency, mass detection accuracy, Matthew’s correlation coefficient, and F1-score were applied, which generated scores of 98.96%, 97.62%, and 99.24%, respectively.
The feature extraction technique in image processing plays a significant part in classification as it clarifies the area of interest in an image. Pramanik et al. [23], for thermogram BC detection, utilized a small-scale dataset comprising 40 normal and 60 abnormal images. As an evolution of their proposed method, a dataset of 100 images was obtained from the public database DMR. A feature extraction method based on local texture named block variance (BV) was proposed. A hybrid method was used for classification, including the gradient descent training rule and a feedforward neural network. The results showed a very low false positive rate (0.1). Acharya et al. [24] proposed a method examining a small dataset comprising 50 images obtained from thermography. The features were extracted from these images, and SVM was applied to detect BC; the proposed method achieved 90.84% specificity. Jamil et al. [25] compared two neural networks: radial basis function and backpropagation neural network. The comparison revealed more efficient results when implementing the backpropagation neural network.
Samala et al. [26] utilized a deep neural network for digital breast tomosynthesis through multistage transfer learning. To obtain digital breast tomosynthesis (DBT) data, mammography images were captured from a database named imageNet. The dataset was then enhanced via different transfer processes. Both mammography datasets and DBT were optimized to obtain better accuracy by comparing the CNNs. For BC detection using a thermogram in the classification phase of images obtained from thermograms, Sathish et al. [27] uses spatial and spectral features and performed a comparison of the ensemble of bagged trees algorithm and AdaBoost. The comparative study showed that the ensemble of bagged trees algorithm performed better. Its accuracy, specificity, and sensitivity were 87%, 90.60%, and 83%, respectively. Another study was proposed using a small dataset by Gogoi et al. [28] implementing singular value decomposition (SVD). A thermogram was used to distinguish the regularity and irregularity of images. The accuracy was 98%, but the use of a small dataset was not enough to justify the results.
To overcome classification issues, a novel fuzzy approach was proposed by Swarnalatha et al. [29]. The medical image classification method implemented a fuzzy approach using bit plane. Chunks of images were obtained from filtering on the basis of a bit plane. A fuzzy approach was used to refine the images, which generated a more efficient result in contrast to other available methods.
Chen et al. [30] proposed a method to improve the bit plane slicing feature by implementing a CNN classifier to accurately detect BC. Bit plane images were effectively segmented into eight images using a CNN classifier. Each segment provided a different level of information. On different bit planes, the fusion features were deeply evaluated simultaneously. Classification and recognition were also applied using the CNN classifier. The proposed method considerably improved both the classification and the recognition of medical images.
Kumar et al. [31] presented a method involving a dual-layered CNN model. The recommended method was applied to the ImageNet dataset. In the dual-layered model, the first layer identified the affected region, while the second layer segmented the images and was also used for false positive reduction. In a comparison analysis, DL-CNN outperformed previous methodologies. For BC detection and classification, Shamy et al. [32] performed the experimentation in three stages and proposed a K-means Gaussian mixture established on a CNN. The region of interest was identified in the first stage. An optimized feature selection algorithm was implemented at the region of interest to optimize the features and texture extraction. In the last stage, classification of normal and abnormal images was achieved using the CNN. The proposed neural network approach provided good accuracy of the learning algorithm. The analysis exhibited that the outcome of the proposed method took less processing time and improved breast cancer detection.
Gaber et al. [33] proposed a method for malignant and benign classification and automatic segmentation. The identification of malignant and benign images was based on an SVM classifier. The sensitivity and accuracy of the proposed method were as high as 88.41%. For early detection and diagnosis of BC, Zheng et al. [34] proposed the deep learning based AdaBoost algorithm. An evaluation of the proposed method was carried out using neural networks, which greatly enhanced the efficiency of the proposed method. An ensemble classifier was assembled using the AdaBoost algorithm for prediction. The results showed that the deep learning classifier was superior in performance to other classifiers. The convolutional neural network helped boost the accuracy.
The proposed methodology is outlined in this section. The novel hybrid method consists of a CNN-based approach with the integration of SVM in the last layer. The proposed technique was executed on the computer system with GPU 4GB, Core i7, 10th generation with RAM 32GB. The steps to integrate the whole model with the SVM are given below.
Every oscillation or accidental variation that occurs in measured signals is referred to as noise in general. There is some noise in mammography images, and image processing activities are plagued by noise, which is especially problematic for identifying edges within images that necessitate differentiation. The influence of higher-frequency pixels, including noise, is amplified by differentiation of a histogram equalizer (HE), as shown in Fig. 2. Because this method underpins a significant portion of our work, it was preferable to use a median filter as a preprocessing step before image segmentation. This allowed assembling all regions in ascending order, before choosing the central element from the ordered elements, and substituting the central pixel using a locality with size A × B. The median filter substitutes the designated pixel with the median of its neighbors, as shown in Eq. (1), where Δ defines the location of A × B around the central neighbor, and y, z are the image’s intendant points.
The term “image segmentation” denotes the procedure of distributing an image into parts with parallel traits and features. The basic goal of segmentation is to make the image easier to understand by presenting it logically. A segmentation approach was applied to the mammography images at the preprocessing stage to identify homogeneous regions, thereby identifying the ROI for further processing, as shown in Fig. 3. Many mammography image segmentation techniques may overlook some regions of the periphery. The perceptibility of the peripheral area in mammography images was improved using a strategy based on filtered region growing segmentation in this paper. In a previous study, we discovered that the strategy was effective [35].
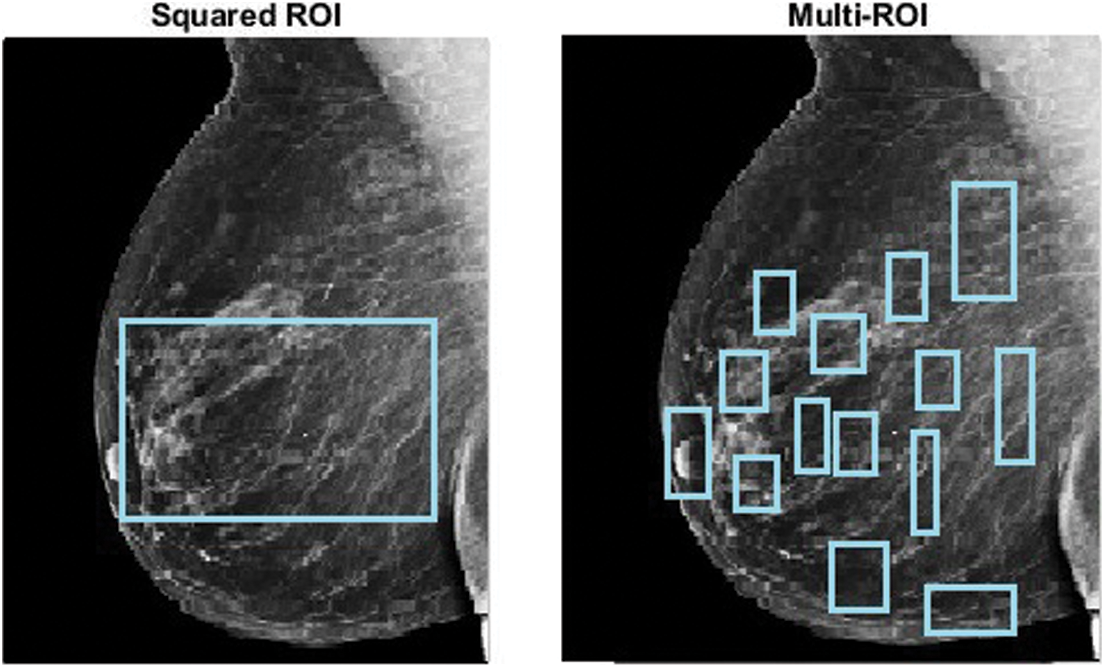
Figure 3: ROI extraction
One example of an image augmentation technique is adaptive contrast enhancement. This strategy can improve the image’s native distinctiveness while also retrieving additional data. It can be used to boost contrast in both natural and medical images; however, it can also add substantial noise. In this study, contrast-limited adaptive histogram equalization (CLAHE) [36], a kind of adaptive histogram equalization (AHE), was used to improve picture distinction. A comparison of the original image and the enhanced image after CLAHE is presented in Fig. 4.
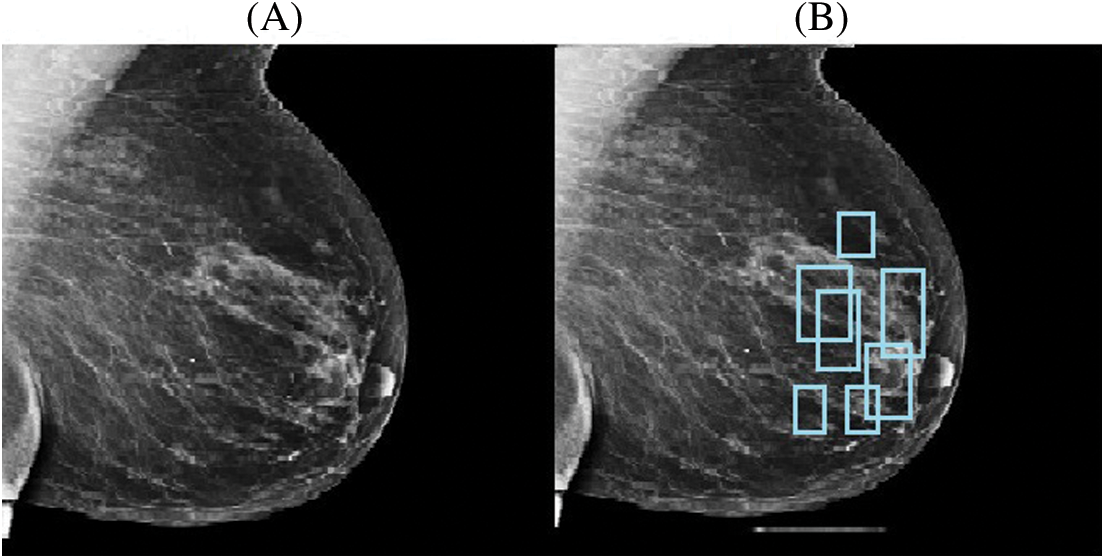
Figure 4: Original image (A) and CLAHE resultant image (B)
Feature extraction can be completed using several different methods. In mammography, various features can be used to classify the characteristics of breast cancer. Due to their superior performance, convolutional neural networks (CNN) have received substantial attention in recent years. Although studies have demonstrated the durability of CNN models in various applications, architectural considerations such as kernel size, stride, padding, and the number of filter channels have an impact on accuracy. The sizes of feature maps in CNN layers are influenced by these hyperparameters. As a result, the amount of time taken for learning and the precision of classification are both affected [37,38]. Thus, this paper employed a CNN due to its success in image classification and image examination. A CNN consists of different layers, as explained below and shown in Fig. 7.
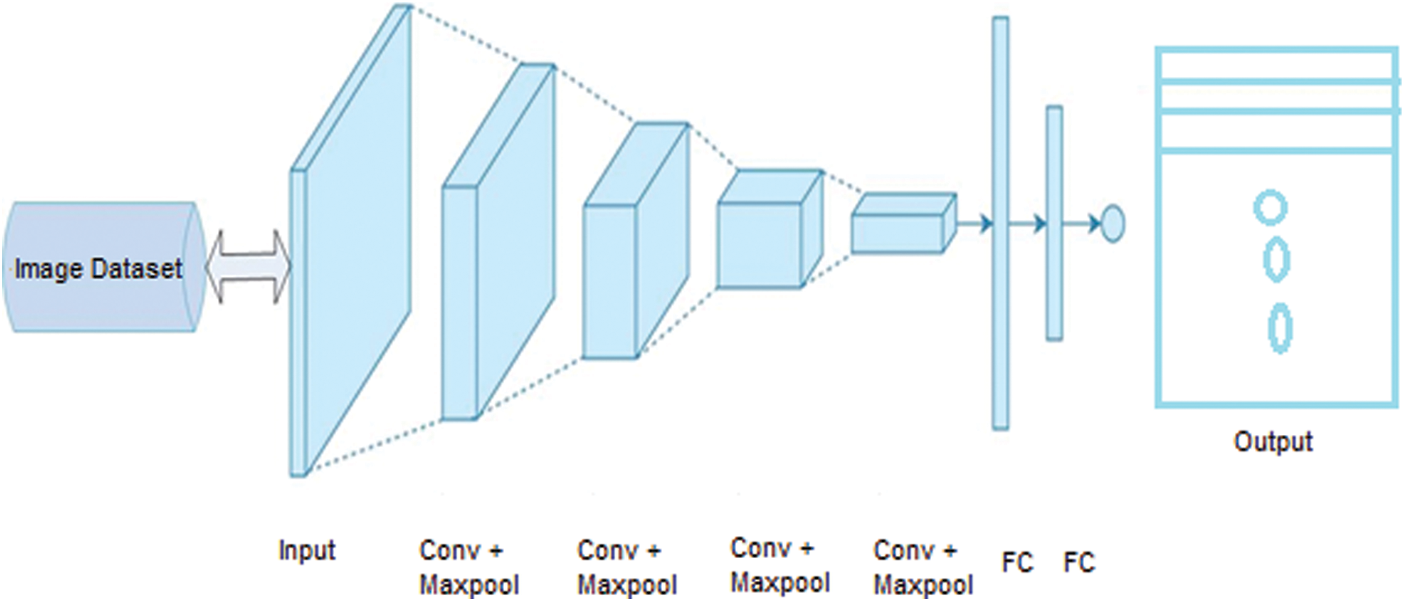
Figure 7: CNN architecture with fundamental layers
• Image Input Layer: This layer takes an image as input for the network and applies normalization. It specifies the image size by using the input size argument. The size of the image corresponds with width, height, and some number of color channels.
• Convolutional Layer: The convolutional layer is used for feature extraction, which is the fundamental element of convolutional neural networks [39]. This layer contains different filters to extract features. The output and size of this layer are calculated using Eq. (2) and Eq. (3), respectively, where
• Batch Normalization Layer: This layer provides CNN with zero inputs as mean or variance, thus strengthening the network [40].
• Nonlinear or ReLU Layer: Following the batch normalization layer, the nonlinear layer processes the nonlinear values of the dataset, as well as the input images [41]. In this layer, all negative and odd values are changed to zero, as shown in Fig. 5. The ReLU output is calculated as shown in Eq. (4), where u is the given input.
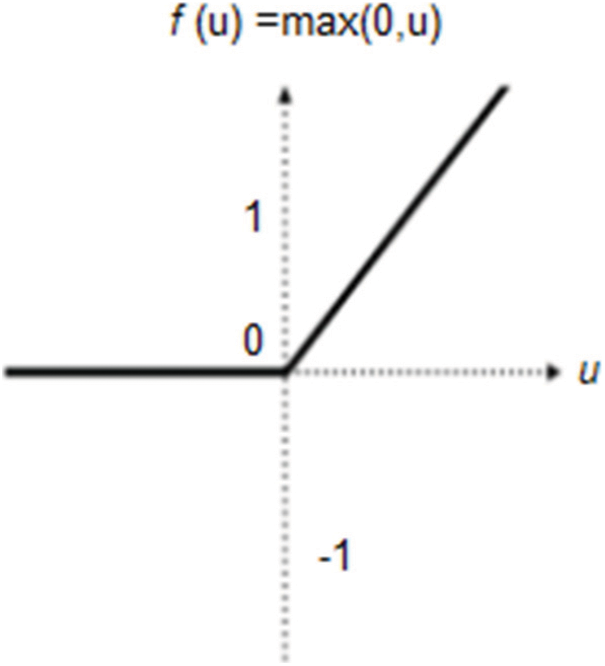
Figure 5: ReLU layer description
• Pooling Layer: The pooling layer is frequently used after every convolutional layer in a convolutional neural network. This layer handles the parameters and is responsible for overfitting. Various pooling layers perform different functions (e.g., max pooling, min pooling, and average pooling); the most frequently used layer is max pooling [42], as shown in Fig. 6. The size and output of the pooling layer are calculated using Eq. (5) and Eq. (6), respectively, where x is the output, and R denotes the pooling region.
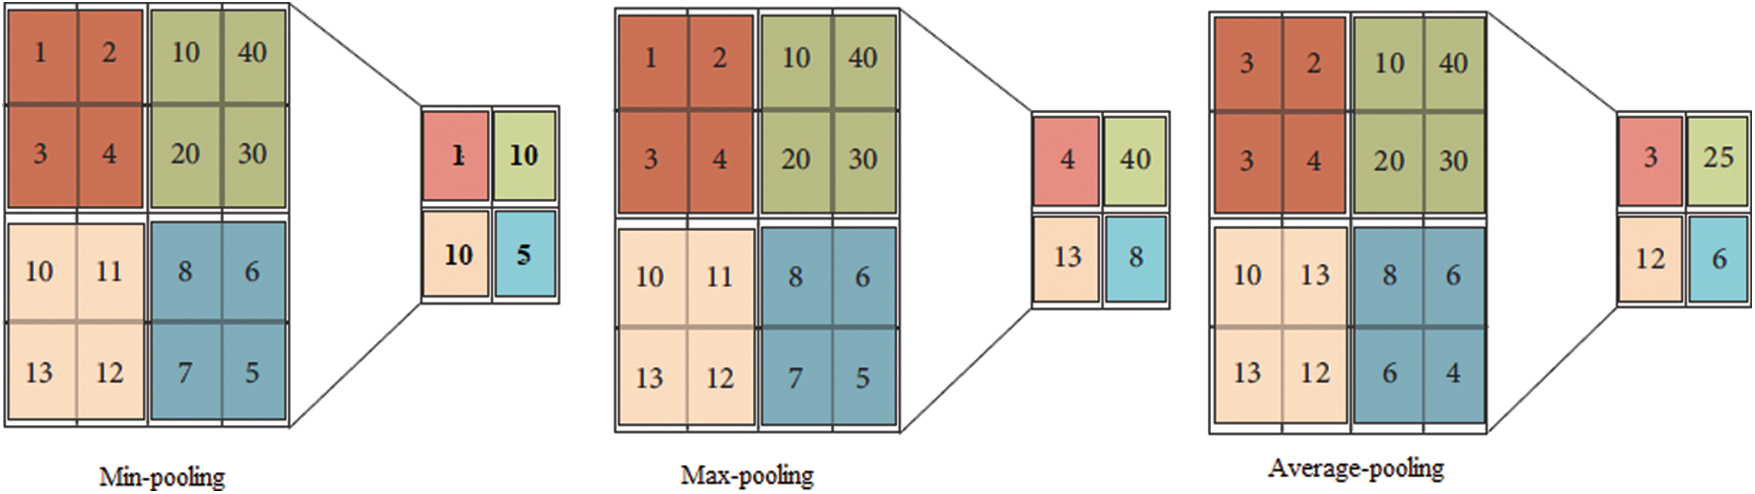
Figure 6: Pooling layer output description
• Softmax Layer: This layer processes data from the pooling layer and the convolutional layer for the classification layer on CNN, which are then used as the initial input for the CNN [43].
• Fully Connected Layer: This is a fully connected layer that applies the real classification. It takes the input from all layers and passes it through the network. A completely interconnected layer is consistently the last layer of a neural organization. This kind of layer obtains an information vector and generates a yield vector. This last, completely associated layer characterizes and returns a vector of size N, where N is the number of classes in our picture arrangement task. Every component of the vector shows the likelihood that the information picture has a place within a class. However, to learn more about the odds of classification, the fully interconnected layer duplicates each information component according to its weighting before appliation. The convolutional neural network estimates weight in the same way as the convolutional layer: in the preparation stage, with the inclination proliferating in reverse [44]. The completely linked layer decides the connection between the features in the picture and a class. Similar to activating neurons in the human brain, a neural network is the hardware and/or software program consisting of all layers. Basic neural networks are not ideal for image processing. Thus, images should be fed as lower-resolution bits. A CNN contains its own “neurons” that are structured similarly to those in the frontal lobe, i.e., the region in the brains of humans and other animals that processes visual objects. To avoid a picture processing issue with basic neural networks, layers of neurons are designed in such a way that they span the full visual field.
• Classification Layer: This layer computes the actual class entropy loss for multiple class problems. It matches the features with their relevant class [45].
After their extraction, the features are mapped according to a group of specific categories. Moreover, the ROI features, in terms of dimensionality and grouping, are used to create a map of similar and dissimilar features, while the CNN layers help to classify them. The softmax layer formats the feature data for classification purposes, while the fully connected layer applies the actual classification.
3.4 Proposed Convolutional Neural Network (CNN) Approach with SVM Integration
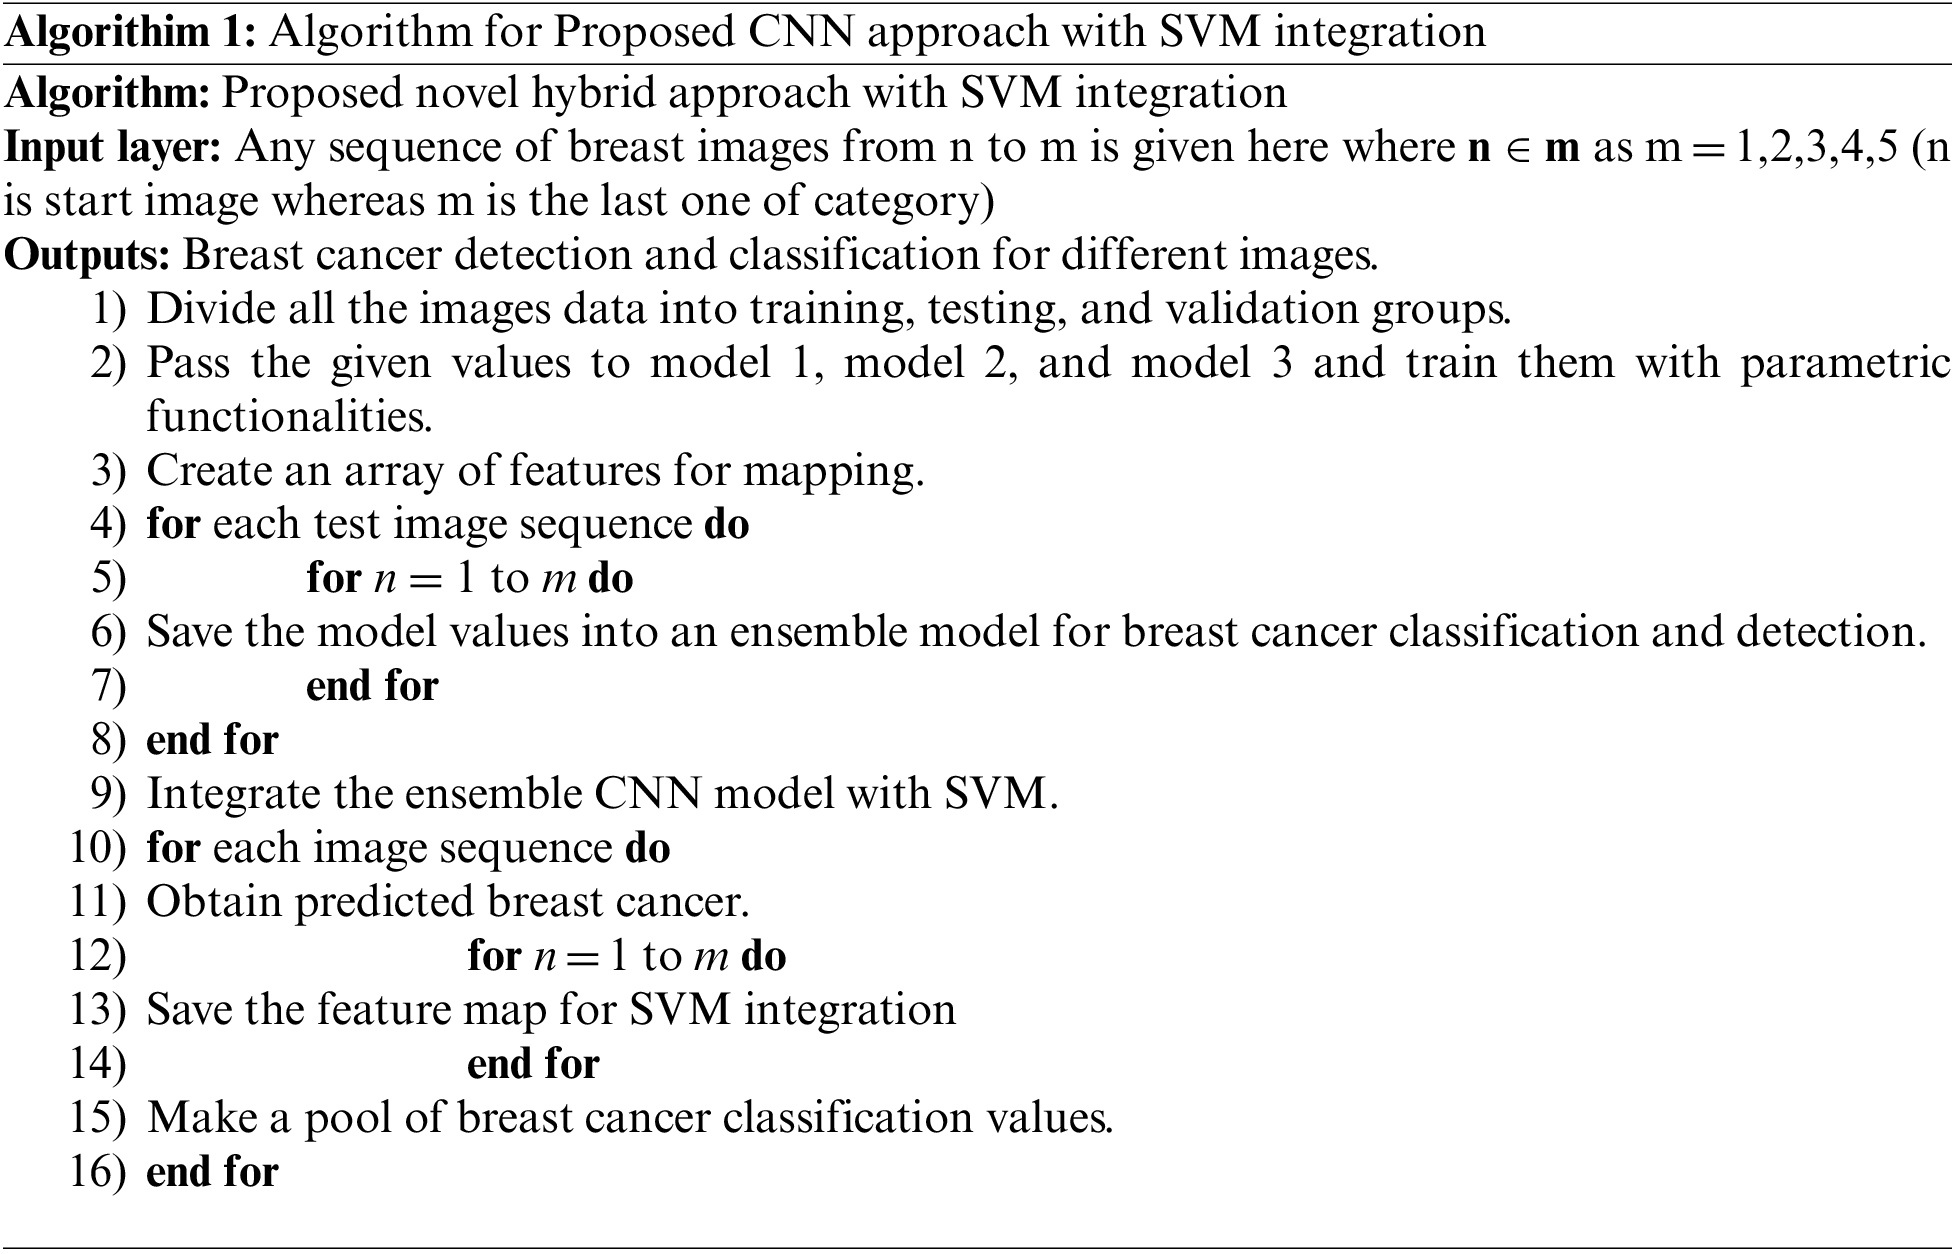
The proposed novel hybrid approach with SVM integration consists of a multi-model structure with a convolutional neural network. Moreover, this approach uses three models (models 1, 2, and 3) to get ensemble model results. These models have different structures with various layers, parametric functionalities, learning rates, strides, and filter sizes, as explained in Tab. 1 and Fig. 9. All these models are combined to establish a metric used as the input for the ensemble CNN model. The ensemble model saves the values as the results to integrate them with SVM. The process of SVM integration is defined in Algorithm 1.

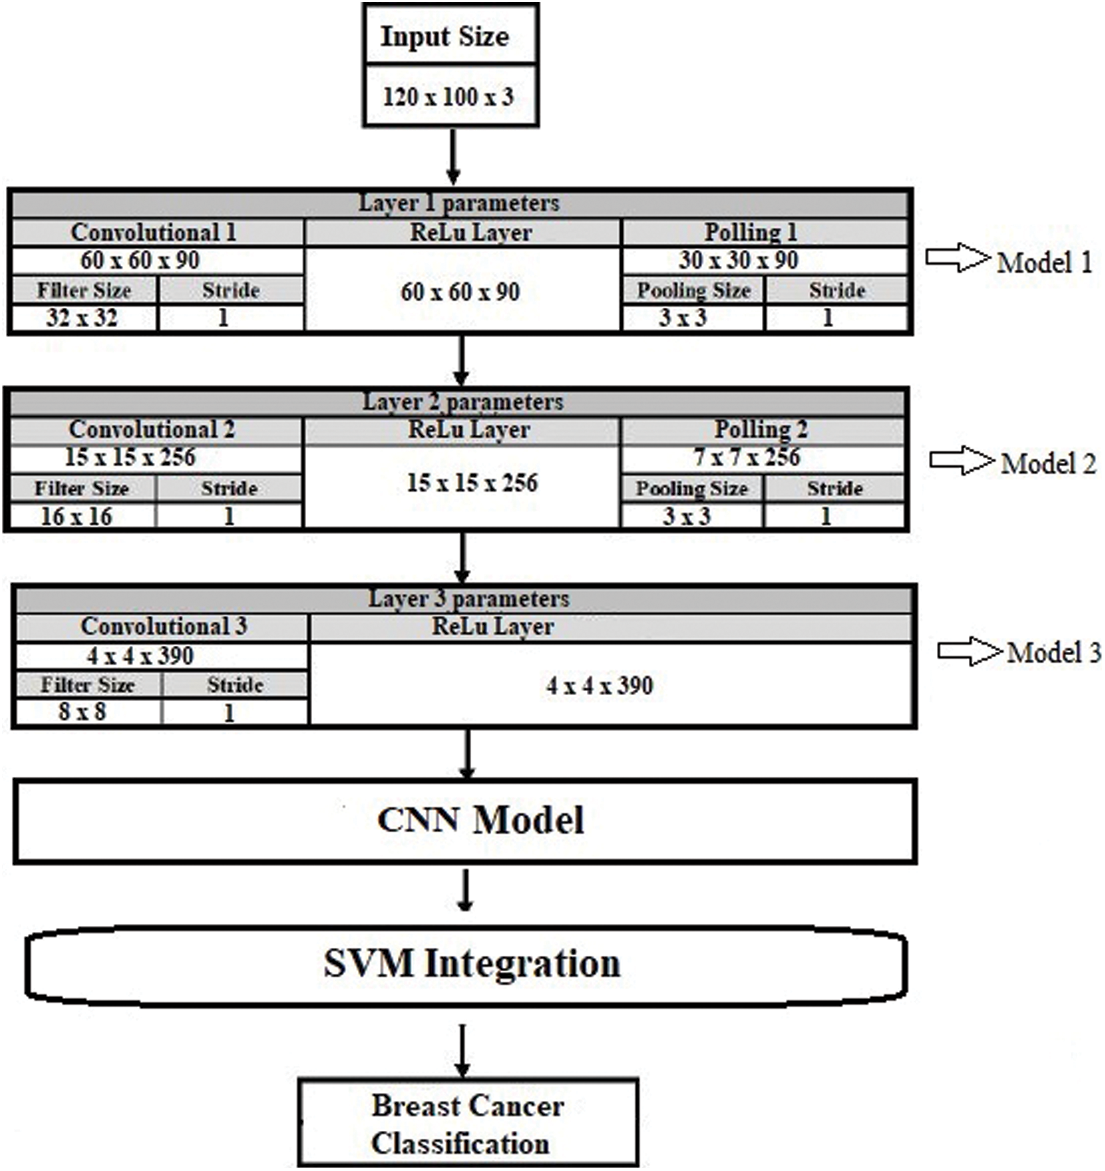
Figure 9: Proposed model architecture
The SVM is a supervised machine learning classifier that analyzes data for classification and regression purposes. Supervised learning classifiers provide data for both input and output, which can be used for the classification of breast cancer [46]. An SVM creates a learning model in which fresh instances are assigned to one of two groups of BC with positive and negative hyperplanes, as shown in Fig. 8.
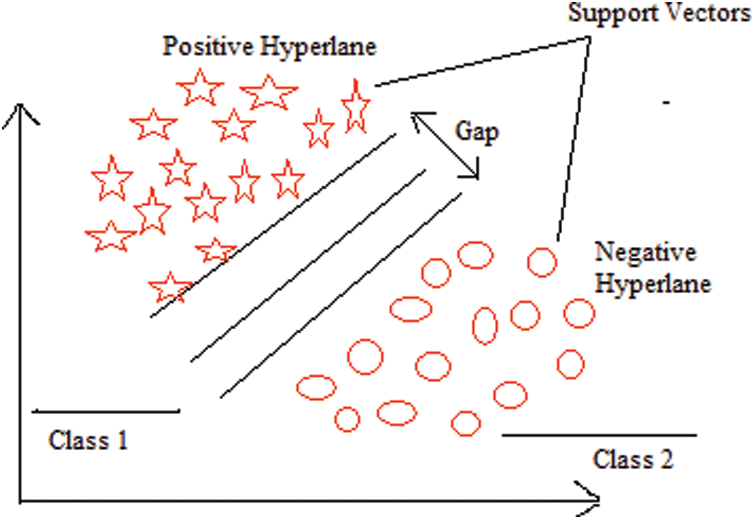
Figure 8: SVM architecture
SVMs are sometimes referred to as non-probabilistic binary linear classifiers because of their functions. They represent a commonly used machine learning technique that has been extensively applied in a variety of domains, including the analysis of gene expression data. For a binary classification problem, the SVM seeks to discover an ideal hyperplane that divides the data into two classes, as indicated by a subset of samples called support vectors [47]. By altering the data with mapping kernel functions, SVM can tackle nonlinearly separable situations. Radial basis, polynomial, and linear functions are among the functions that can be used. The value of hyperplane separation can be expressed as shown in Eq. (7), where Wv is the weighted vector, Fv is the feature vector, and B is the bias.
Accordingly, the point nearest to the hyperplane is determined using Eq. (8).
The separating hyperplane equations for the two classes are given in Eq. (9) and Eq. (10), where
4.1 Dataset Description and Preprocessing
The dataset used for this research was collected from different hospitals in the Qassim health cluster of Saudi Arabia by radiologists and validated by breast imaging radiologists.
The dataset consisted of a total of 12,476 images; some samples are shown in Fig. 10. In the preprocessing phase, noise was removed from the images, the images were resized, and duplicates were removed. Overall, the dataset was separated into testing, training, and validation sets in proportions of 20%, 70%, and 10%, respectively. The details of the dataset are given in Tab. 2, along with the distribution. The proportions of each category are shown in Fig. 11.
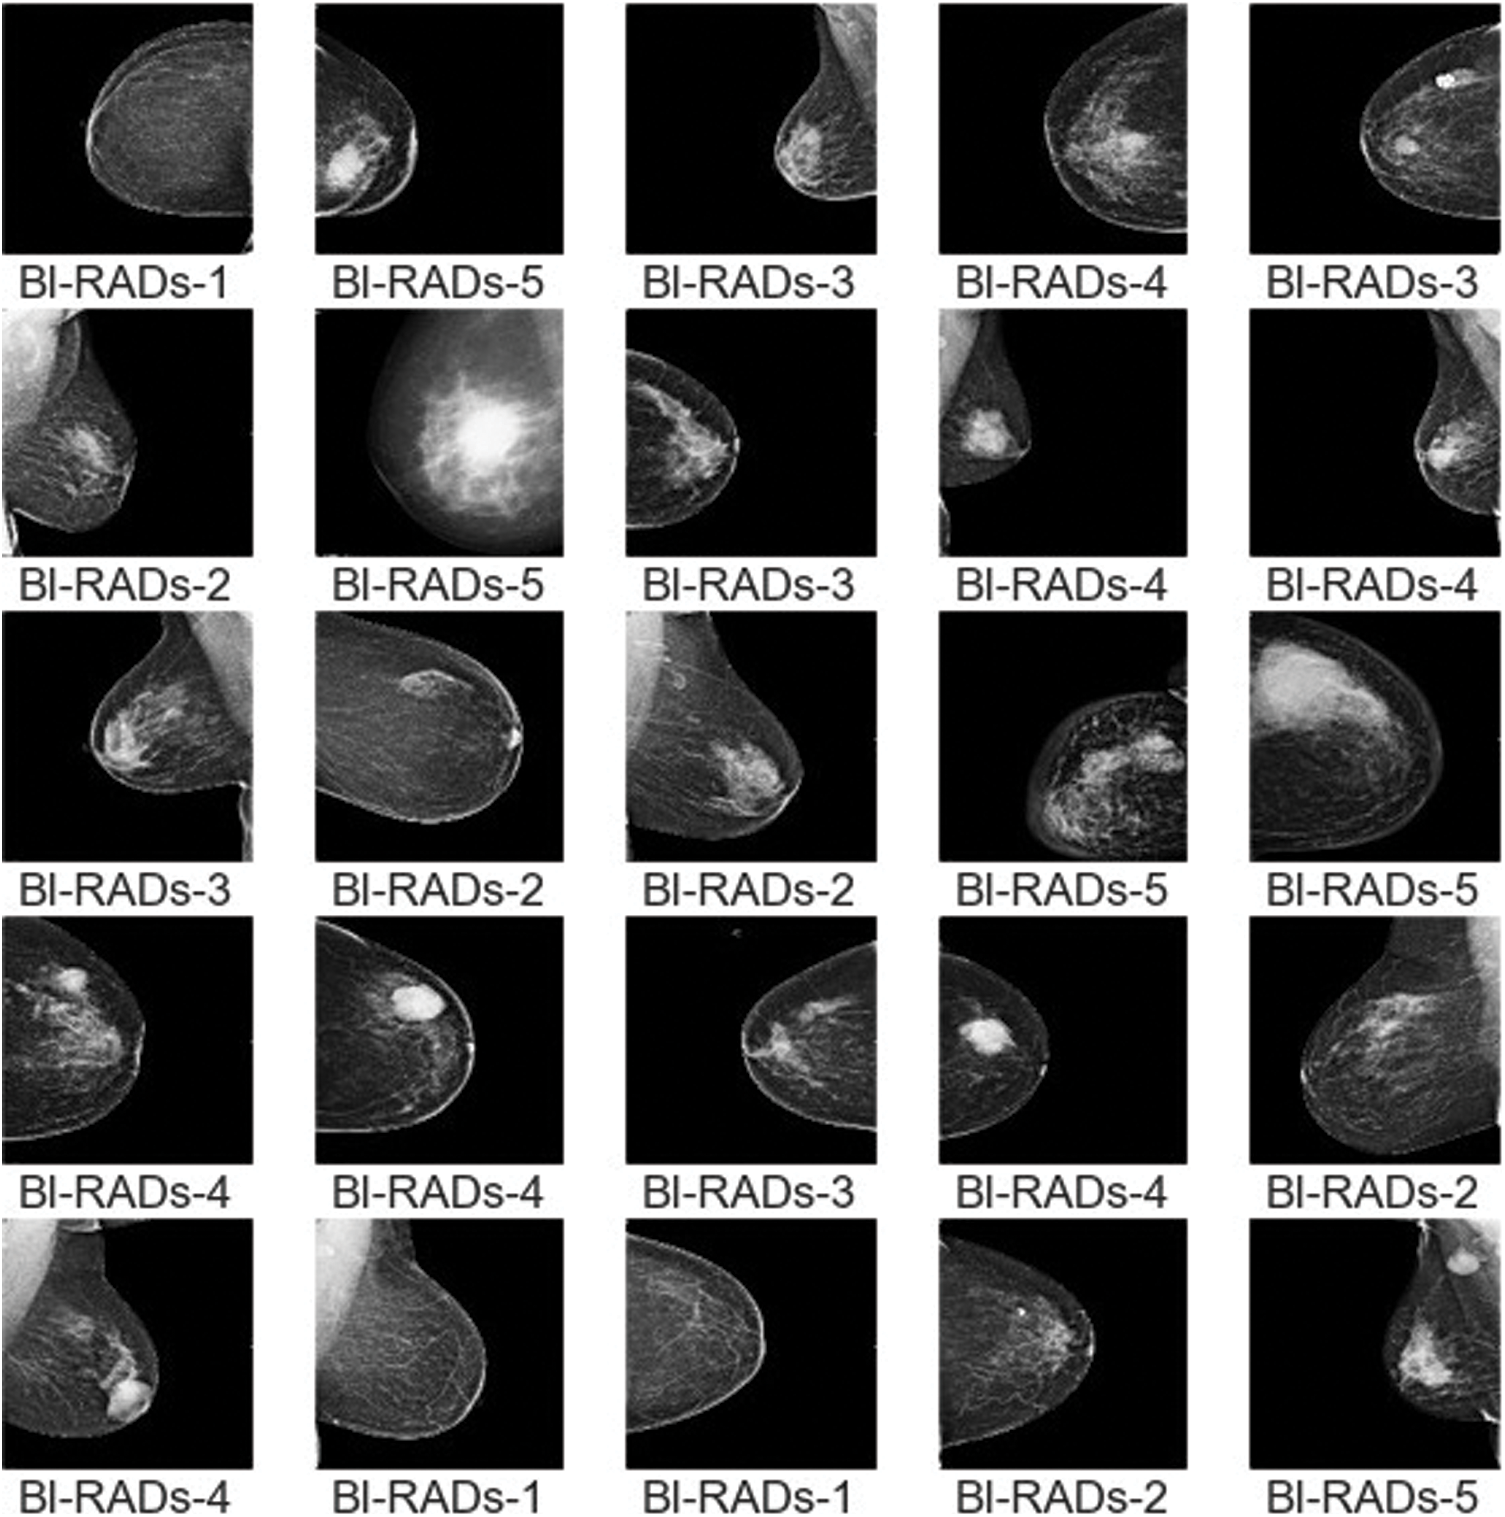
Figure 10: Sample images of BI-RADs

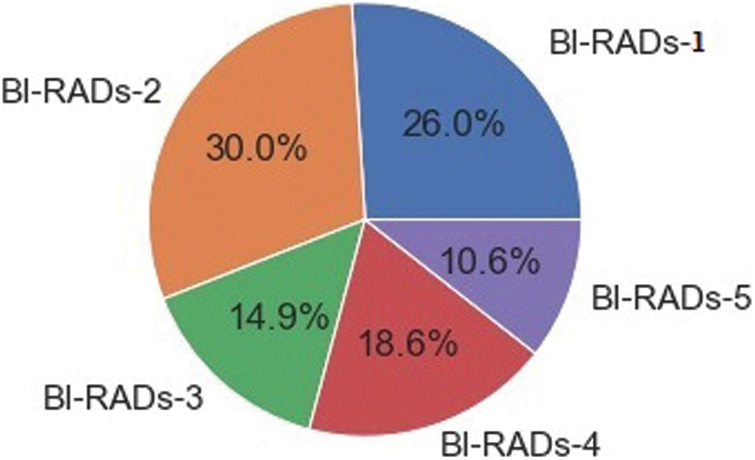
Figure 11: Proportion of BI-RADs image categories
The confusion matrix, accuracy, receiver operating curve (ROC), precision, and F1-score are some techniques used to evaluate a classifier.
• Confusion Matrix (CM): This is a specific table that represents the classifier’s performance. It is usually referred to as an error matrix in the field of machine learning. Dependent on the data type, an image region can be positive or negative. The judgment of the observed result can also be true or false. As a result, one of four options is considered: true positive (Tp), true negative (Tn), false positive (Fp), and false negative (Fn). The diagonal of the CM denotes a correct decision. Tab. 3 shows a case of a CM for the classification of two classes. A five-class CM is shown in Fig. 14.

• Accuracy: The accuracy of a classifier’s prediction specifies the classifier’s overall performance capability, as expressed in Eq. (11).
• Receiver Operating Curve (ROC): ROC analysis is a renowned task detection calculation approach. The analysis was first utilized in medical decision making. It is a graph of operational points that depicts the true positive rate (Tpr) as a function of the false positive rate (Fpr); it is also known as sensitivity (recall) and specificity, as expressed in Eq. (12) and Eq. (13), respectively.
• Precision: The proportion of correctly predicted with respect to all anticipated annotations is known as precision, as expressed in Eq. (14). A low FPR correlates with high precision.
• F1-score: The biased average of precision and recall is the F1-score. It is a statistical metric for evaluating the classifier’s performance, which considers both false positives and false negatives, as expressed in Eq. (15).
4.3 Testing and Training Process
To evaluate the statistical metrics, training and testing processes were applied using five BI-RADs classes. To train the model, 70% of the dataset was used. The preprocessed dataset was used as an input into the CNN with different parametric configurations. The resultant metrics were saved in another model known as the resultant model. The resultant model values were used as an input into the SVM classifier. The whole process involved multiple configuration settings. On the other hand, the testing process used 20% of the dataset, and the resultant metrics were integrated with SVM to test the results. The BI-RADs were classified into five classes: BI-RADs-1, BI-RADs-2, BI-RADs-3, BI-RADs-4, and BI-RADs-5. The resultant confusion matrix for the statistical evaluation of the training and testing process is shown in Fig. 13. The features from the whole dataset and its subspaces are shown in Fig. 12 as a principal component analysis (PCA) projection to decrease the dimensionality of the dataset. The PCA graph shows the individual class distribution ratios of the dataset. In Fig. 14, the blue dotted line shows the training accuracy and loss, while the red dotted line shows the validation accuracy and loss.
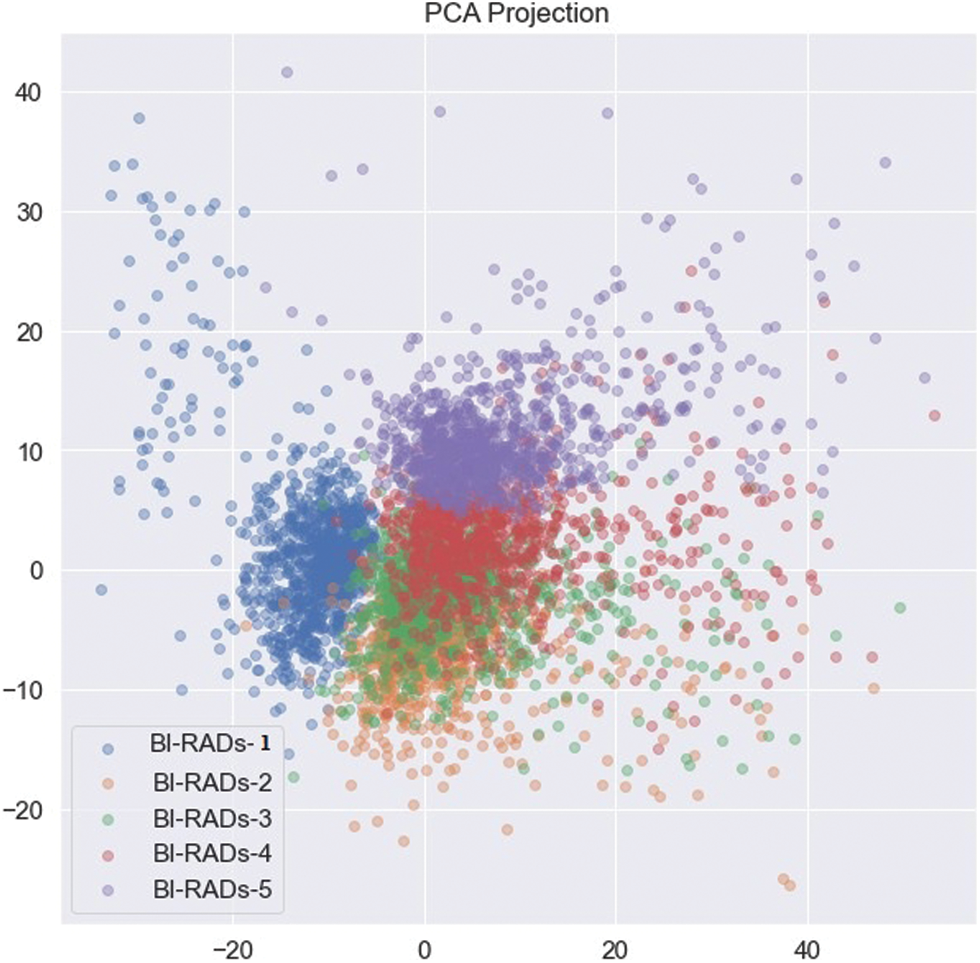
Figure 12: PCA projection of BI-RADs categories
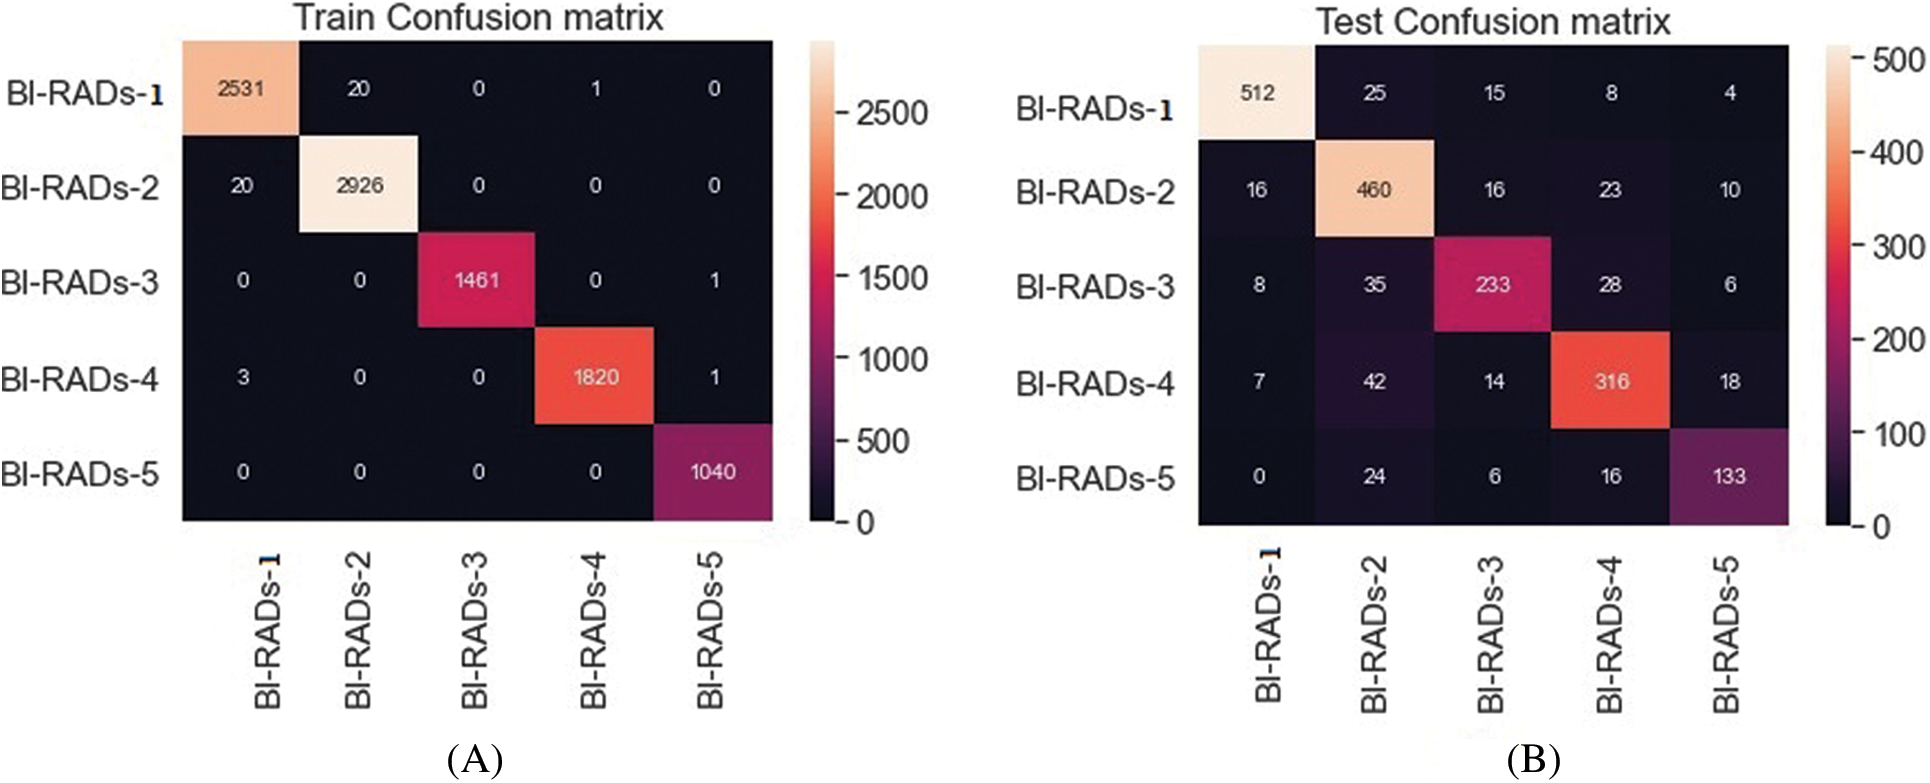
Figure 13: Five class training (A) and testing (B) process
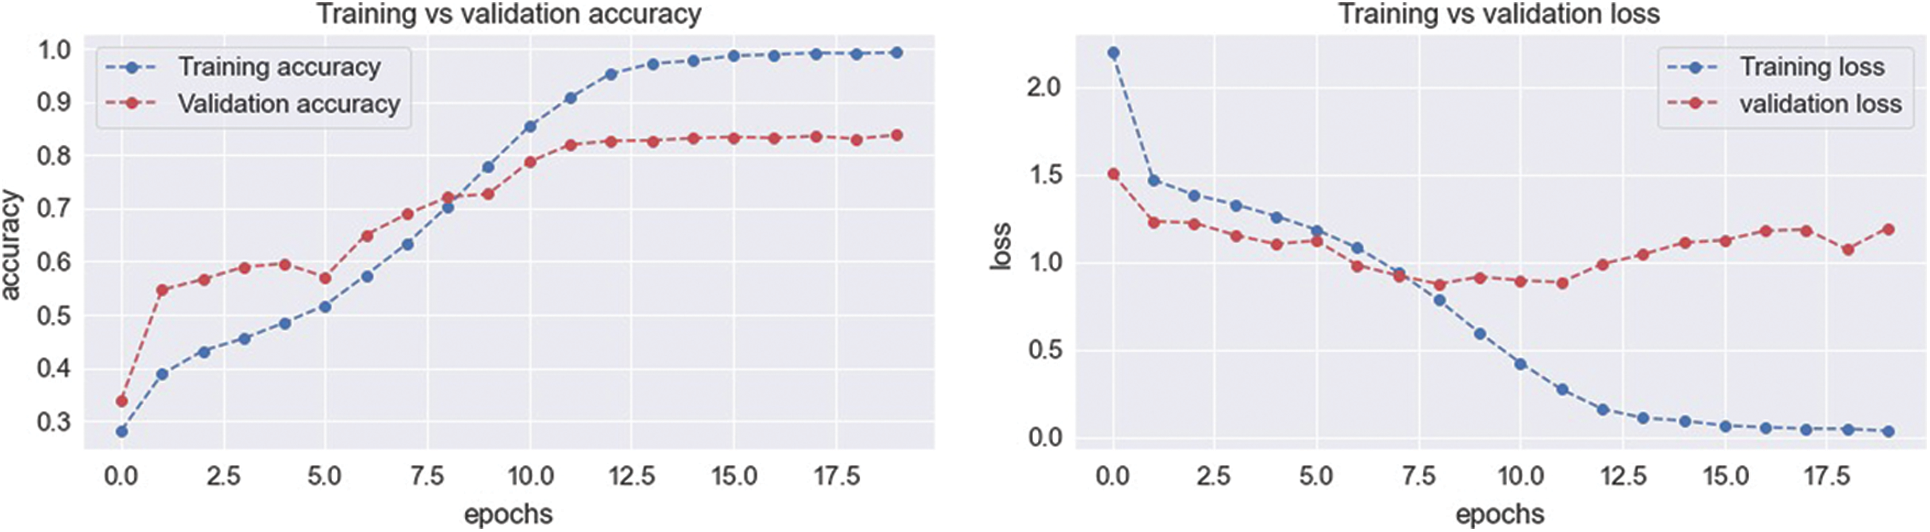
Figure 14: Training and validation process accuracy and loss
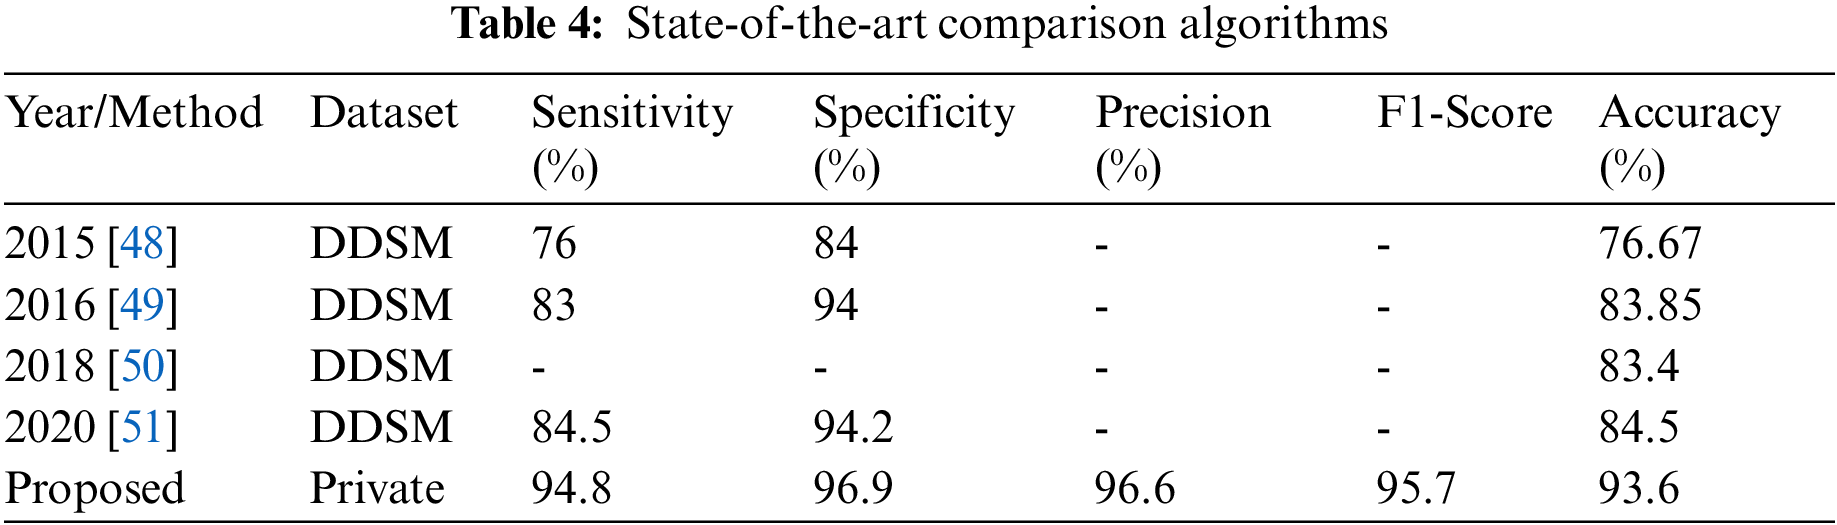
Tab. 4 provides a comparison of the results with methods from the literature. The proposed ensemble CNN with SVM integration was most suitable for BI-RADs classification of breast masses in mammography in terms of accuracy (93.6%), sensitivity (94.8%), specificity (96.9%), precision (96.6%), and F1-score (95.7%). Thus, the proposed method is promising for supporting radiologists in accurate patient detection according to spontaneously allocated BI-RADs classes. It exhibited the best results in terms of overall accuracy and other average statistical values, as revealed in Tab. 4.
A novel hybrid approach with SVM integration consisting of a multi-model CNN was proposed to classify images into BI-RADs classes (B1, negative; B2, benign; B3, probably benign; B4, suspicious; B5, highly suggestive of malignancy). The data were collected from the Qassim region in Saudi Arabia. Initially, the region of interest included calcification asymmetry or architectural distortion regions, which were enhanced using different ROI and segmentation techniques. The proposed system achieved a classification accuracy, sensitivity, specificity, precision, and F1-score of 93.6%, 94.8%, 96.9%, 96.6%, and 95.7%, respectively. A comparison of the proposed hybrid approach with other published studies revealed a significant improvement in performance. It is foreseen that the proposed system can not only help in the mammographic assessment of breast cancer BI-RADs, but also be used for general classification in other medical applications.
Funding Statement: Authors would like to acknowledge the support of the Deputy for Research and Innovation- Ministry of Education, Kingdom of Saudi Arabia for this research through a project grant (NU/IFC/ENT/01/009) under the institutional Funding Committee at Najran University, Kingdom of Saudi Arabia.
Conflicts of Interest: The authors declare that they have no conflicts of interest to report regarding the present study.
1. S. Sharma, A. Aggarwal and T. Choudhury, “Breast cancer detection using machine learning algorithms,” in Proc. 2018 Int. Conf. on Computational Techniques, Electronics and Mechanical Systems, Belgaum, India, pp. 114–118, 2018. [Google Scholar]
2. D. Bazazeh and R. Shubair, “Comparative study of machine learning algorithms for breast cancer detection and diagnosis,” in Proc. 2016 5th Int. Conf. on Electronic Devices, Systems and Applications (ICEDSA), Ras Al Khaimah, United Arab Emirates, pp. 1–4, 2016. [Google Scholar]
3. H. Chen, M. Han, H. Jing, Z. Liu, H. Shang et al., “Dependability of automated breast ultrasound (ABUS) in assessing breast imaging reporting and data system (BI-RADS) category and size of malignant breast lesions compared with handheld ultrasound (HHUS) and mammography (MG),” International Journal of General Medicine, vol. 14, no. 1, pp. 9193–9202, 2021. [Google Scholar]
4. J. Brettes, “Presentation of the French translation of the breast imaging reporting system and data system (BI-RADS),” Gynecologie, Obstetrique & Fertilite, vol. 33, no. 10, pp. 839–841, 2005. [Google Scholar]
5. F. Jacques, C. Murielle, S. Isabelle, P. Donald, P. Marion et al., “Cancer statistics for the year 2020: Anoverview,” International Journal of Cancer, vol. 149, no. 4, pp. 778–789, 2021. [Google Scholar]
6. L. Lévy, M. Suissa, J. Bokobsa, H. Tristant, J. Chiche et al., “Presentation of the French translation of the breast imaging reporting system and data system (BI-RADS),” Gynecologie, Obstetrique & Fertilite, vol. 33, no. 5, pp. 338–347, 2005. [Google Scholar]
7. M. H. Yap, G. Pons, J. Marti, S. Ganau, M. Sentis et al., “Automated breast ultrasound lesions detection using convolutional neural networks,” IEEE Journal of Biomedical and Health Informatics, vol. 22, no. 4, pp. 1218–1226, 2018. [Google Scholar]
8. M. P. Coleman, M. Quaresma, F. Berrino, J. -M. Lutz, R. De Angelis et al., “Cancer survival in five continents: A worldwide population-based study (CONCORD),” The Lancet Oncology, vol. 9, no. 8, pp. 730–756, 2008. [Google Scholar]
9. H. Fang, H. Fan, S. Lin, Z. Qing and F. R. Sheykhahmad, “Automatic breast cancer detection based on optimized neural network using whale optimization algorithm,” International Journal of Imaging Systems and Technology, vol. 31, no. 1, pp. 425–438, 2021. [Google Scholar]
10. A. Alarabeyyat, “Breast cancer detection using k-nearest neighbor machine learning algorithm,” in Proc. 2016 9th Int. Conf. on Developments in eSystems Engineering (DeSE), Liverpool, UK, pp. 35–39, 2016. [Google Scholar]
11. F. Alfayez, M. W. A. El-Soud and T. Gaber, “Thermogram breast cancer detection: A comparative study of two machine learning techniques,” Applied Sciences, vol. 10, no. 2, pp. 551–570, 2020. [Google Scholar]
12. F. M. Tabrizi, S. Vahdati, S. Khanahmadi and S. Barjasteh, “Determinants of breast cancer screening by mammography in women referred to health centers of urmia, Iran,” Asian Pacific Journal of Cancer Prevention, vol. 19, no. 4, pp. 997–1003, 2018. [Google Scholar]
13. D. Wang, A. Khosla, R. Gargeya, H. Irshad and A. H. Beck, “Deep learning for identifying metastatic breast cancer,” arXiv:1606.05718 [q-bio.QM], 2016 (available at https://arxiv.org/abs/1606.05718). [Google Scholar]
14. N. Dhungel, G. Carneiro and A. P. Bradley, “Automated mass detection in mammograms using cascaded deep learning and random forests,” in Proc. 2015 Int. Conf. on Digital Image Computing: Techniques and Applications (DICTA), Adelaide, SA, Australia, pp. 1–8, 2015. [Google Scholar]
15. S. Albarqouni, C. Baur, F. Achilles, V. Belagiannis, S. Demirci et al., “AggNet: Deep learning from crowds for mitosis detection in breast cancer histology images,” IEEE Transactions on Medical Imaging, vol. 35, no. 5, pp. 1313–1321, 2016. [Google Scholar]
16. T. Z. Tan, C. Quek, G. S. Ng and E. Y. K. Ng, “A novel cognitive interpretation of breast cancer thermography with complementary learning fuzzy neural memory structure,” Expert Systems with Applications, vol. 33, no. 3, pp. 652–666, 2007. [Google Scholar]
17. M. Etehadtavakol and E. Y. K. Ng, “Breast thermography as a potential non-contact method in the early detection of cancer: A review,” Journal of Mechanics in Medicine and Biology, vol. 13, no. 02, pp. 1–20, 2013. [Google Scholar]
18. O. O. Soliman, N. H. Sweilam and D. M. Shawky, “Automatic breast cancer detection using digital thermal images,” in Proc. 2018 9th Cairo Int. Biomedical Engineering Conf. (CIBEC), Cairo, Egypt, pp. 110–113, 2018. [Google Scholar]
19. S. Sengan, V. Priya, A. Syed Musthafa, L. Ravi, S. Palani et al., “A fuzzy based high-resolution multi-view deep CNN for breast cancer diagnosis through SVM classifier on visual analysis,” Journal of Intelligent & Fuzzy Systems, vol. 2020, no. 1, pp. 1–14, 2020. [Google Scholar]
20. E. Y. K. Ng and E. C. Kee, “Advanced integrated technique in breast cancer thermography,” Journal of Medical Engineering & Technology, vol. 32, no. 2, pp. 103–114, 2008. [Google Scholar]
21. D. A. Kennedy, T. Lee and D. Seely, “A comparative review of thermography as a breast cancer screening technique,” Integrative Cancer Therapies, vol. 8, no. 1, pp. 9–16, 2009. [Google Scholar]
22. M. A. Al-Antari, M. A. Al-Masni, M. -T. Choi, S. -M. Han and T. -S. Kim, “A fully integrated computer-aided diagnosis system for digital X-ray mammograms via deep learning detection, segmentation, and classification,” International Journal of Medical Informatics, vol. 117, no. 1, pp. 44–54, 2018. [Google Scholar]
23. S. Pramanik, D. Bhattacharjee and M. Nasipuri, “Texture analysis of breast thermogram for differentiation of malignant and benign breast,” in Proc. 2016 Int. Conf. on Advances in Computing, Communications and Informatics (ICACCI), Jaipur, India, pp. 8–14, 2016. [Google Scholar]
24. U. R. Acharya, E. Y. K. Ng, J. -H. Tan and S. V. Sree, “Thermography based breast cancer detection using texture features and support vector machine,” Journal of Medical Systems, vol. 36, no. 3, pp. 1503–1510, 2012. [Google Scholar]
25. S. Jamil, M. S. Abbas, M. Umair, F. Habib, F. et al., “A novel deep neural network CanNet for malignant detection,” in Proc. 2020 Int. Conf. on Information Science and Communication Technology (ICISCT), Karachi, Pakistan, pp. 568–572, 2020. [Google Scholar]
26. R. K. Samala, H. -P. Chan, L. Hadjiiski, M. A. Helvie, C. D. Richter et al., “Breast cancer diagnosis in digital breast tomosynthesis: Effects of training sample size on multi-stage transfer learning using deep neural nets,” IEEE Transactions on Medical Imaging, vol. 38, no. 3, pp. 686–696, 2019. [Google Scholar]
27. D. Sathish and S. Kamath, “Detection of breast thermograms using ensemble classifiers,” Journal of Telecommunication,” Electronic and Computer Engineering (JTEC), vol. 10, no. 3, pp. 35–39, 2018. [Google Scholar]
28. U. R. Gogoi, M. K. Bhowmik, D. Bhattacharjee and A. K. Ghosh, “Singular value based characterization and analysis of thermal patches for early breast abnormality detection,” Australasian Physical & Engineering Sciences in Medicine, vol. 41, no. 4, pp. 861–879, 2018. [Google Scholar]
29. P. Swarnalatha and B. Tripathy, “A novel fuzzy c-means approach with bit plane algorithm for classification of medical images,” in Proc. 2013 IEEE Int. Conf. ON Emerging Trends in Computing, Communication and Nanotechnology (ICECCN), Tirunelveli, India, pp. 360–365, 2013. [Google Scholar]
30. G. Chen, Y. Chen, Z. Yuan, X. Lu, X. Zhu et al., “Breast cancer image classification based on CNN and bit-plane slicing,” in Proc. 2019 Int. Conf. on Medical Imaging Physics and Engineering (ICMIPE), Shenzhen, China, pp. 1–4, 2019. [Google Scholar]
31. M. N. Kumar, A. Jatti and C. Narayanappa, “Probable region identification and segmentation in breast cancer using the DL-CNN,” in Proc. 2019 Int. Conf. on Smart Systems and Inventive Technology (ICSSIT), Tirunelveli, India, pp. 1144–1149, 2019. [Google Scholar]
32. S. Shamy and J. Dheeba, “A research on detection and classification of breast cancer using k-means GMM & CNN algorithms,” International Journal of Engineering and Advanced Technology, vol. 8, no. 1, pp. 501–505, 2019. [Google Scholar]
33. T. Gaber, G. Ismail, A. Anter, M. Soliman, M. Ali et al., “Thermogram breast cancer prediction approach based on neutrosophic sets and fuzzy c-means algorithm,” in Proc. 2015 37th Annual Int. Conf. of the IEEE Engineering in Medicine and Biology Society (EMBC), Milan, pp. 4254–4257, 2015. [Google Scholar]
34. J. Zheng, D. Lin, Z. Gao, S. Wang, M. He et al., “Deep learning assisted efficient AdaBoost algorithm for breast cancer detection and early diagnosis,” IEEE Access, vol. 8, no. 1, pp. 96946–96954, 2020. [Google Scholar]
35. N. F. Abubacker, A. Azman and M. A. A. Murad, “An improved peripheral enhancement of mammogram images by using filtered region growing segmentation,” Journal of Theoretical & Applied Information Technology, vol. 95, no. 14, pp. 1–11, 2017. [Google Scholar]
36. T. Namikawa, T. Sato and K. Hanazaki, “Recent advances in near-infrared fluorescence-guided imaging surgery using indocyanine green,” Surgery Today, vol. 45, no. 12, pp. 1467–1474, 2015. [Google Scholar]
37. Z. Gao, Y. Li, Y. Yang, X. Wang, N. Dong et al., “A GPSO-optimized convolutional neural networks for EEG-based emotion recognition,” Neurocomputing, vol. 380, no. 1, pp. 225–235, 2020. [Google Scholar]
38. R. M. Ghoniem, “A novel bio-inspired deep learning approach for liver cancer diagnosis,” Information, vol. 11, no. 2, pp. 80–115, 2020. [Google Scholar]
39. A. Krizhevsky, I. Sutskever and G. E. Hinton, “ImageNet classification with deep convolutional neural networks,” Communications of the ACM, vol. 60, no. 6, pp. 84–90, 2017. [Google Scholar]
40. Y. Li, N. Wang, J. Shi, J. Liu and X. Hou, “Revisiting batch normalization for practical domain adaptation,” arXiv:1603.04779 [cs.CV], 2016 (available at https://arxiv.org/abs/1603.04779). [Google Scholar]
41. J. Cao, Y. Pang, X. Li and J. Liang, “Randomly translational activation inspired by the input distributions of ReLU,” Neurocomputing, vol. 275, no. 1, pp. 859–868, 2018. [Google Scholar]
42. H. J. Jie and P. Wanda, “RunPool: A dynamic pooling layer for convolution neural network,” International Journal of Computational Intelligence Systems, vol. 13, no. 1, pp. 66–76, 2020. [Google Scholar]
43. B. Yuan, “Efficient hardware architecture of softmax layer in deep neural network,” in Proc. 2016 29th IEEE Int. System-on-Chip Conf. (SOCC), Seattle, WA, USA, pp. 323–326, 2016. [Google Scholar]
44. K. Liu, G. Kang, N. Zhang and B. Hou, “Breast cancer classification based on fully-connected layer first convolutional neural networks,” IEEE Access, vol. 6, no. 1, pp. 23722–23732, 2018. [Google Scholar]
45. O. Deperlioglu, “Classification of phonocardiograms with convolutional neural networks,” BRAIN. Broad Research in Artificial Intelligence and Neuroscience, vol. 9, no. 2, pp. 22–33, 2018. [Google Scholar]
46. J. Luo, Z. Ning, S. Zhang, Q. Feng and Y. Zhang, “Bag of deep features for preoperative prediction of sentinel lymph node metastasis in breast cancer,” Physics in Medicine & Biology, vol. 63, no. 24, pp. 14–23, 2018. [Google Scholar]
47. M. Mohammed, H. Mwambi, I. B. Mboya, M. K. Elbashir and B. Omolo, “A stacking ensemble deep learning approach to cancer type classification based on TCGA data,” Scientific Reports, vol. 11, no. 1, pp. 1–22, 2021. [Google Scholar]
48. G. H. B. Miranda and J. C. Felipe, “Computer-aided diagnosis system based on fuzzy logic for breast cancer categorization,” Computers in Biology and Medicin, vol. 64, no. 1, pp. 334–346, 2015. [Google Scholar]
49. F. Chokri and M. Hayet Farida, “Mammographic mass classification according to Bi-RADS lexicon,” IET Computer Vision, vol. 11, no. 3, pp. 189–198, 2017. [Google Scholar]
50. I. Domingues, P. H. Abreu and J. Santos, “BI-RADs classification of breast cancer: A new pre-processing pipeline for deep models training,” in Proc. 2018 25th IEEE Int. Conf. on Image Processing (ICIP), Athens, Greece, pp. 1378–1382, 2018. [Google Scholar]
51. S. Boumaraf, X. Liu, C. Ferkous and X. Ma, “A new computer-aided diagnosis system with modified genetic feature selection for BI-RADS classification of breast masses in mammograms,” BioMed Research International, vol. 2020, no. 1, pp. 207–223, 2020. [Google Scholar]
 | This work is licensed under a Creative Commons Attribution 4.0 International License, which permits unrestricted use, distribution, and reproduction in any medium, provided the original work is properly cited. |