DOI:10.32604/cmc.2022.027356
| Computers, Materials & Continua DOI:10.32604/cmc.2022.027356 | |
| Article |
Safety Analysis of Riding at Intersection Entrance Using Video Recognition Technology
1College of Landscape Architecture, Central South University of Forestry and Technology, Changsha, Hunan, 410004, China
2College of Logistics and Transportation, Central South University of Forestry and Technology, Changsha, Hunan, 410004, China
3Department of Mathematics and Computer Science, Northeastern State University, Tahlequah, OK, 74464, United States
*Corresponding Author: Xingjian Xue. Email: xbqxbh@163.com
Received: 15 January 2022; Accepted: 04 March 2022
Abstract: To study riding safety at intersection entrance, video recognition technology is used to build vehicle-bicycle conflict models based on the Bayesian method. It is analyzed the relationship among the width of non-motorized lanes at the entrance lane of the intersection, the vehicle-bicycle soft isolation form of the entrance lane of intersection, the traffic volume of right-turning motor vehicles and straight-going non-motor vehicles, the speed of right-turning motor vehicles, and straight-going non-motor vehicles, and the conflict between right-turning motor vehicles and straight-going non-motor vehicles. Due to the traditional statistical methods, to overcome the discreteness of vehicle-bicycle conflict data and the differences of influencing factors, the Bayesian random effect Poisson-log-normal model and random effect negative binomial regression model are established. The results show that the random effect Poisson-log-normal model is better than the negative binomial distribution of random effects; The width of non-motorized lanes, the form of vehicle-bicycle soft isolation, the traffic volume of right-turning motor vehicles, and the coefficients of straight traffic volume obey a normal distribution. Among them, the type of vehicle-bicycle soft isolation facilities and the vehicle-bicycle traffic volumes are significantly positively correlated with the number of vehicle-bicycle conflicts. The width of non-motorized lanes is significantly negatively correlated with the number of vehicle-bicycle conflicts. Peak periods and flat periods, the average speed of right-turning motor vehicles, and the average speed of straight-going non-motor vehicles have no significant influence on the number of vehicle-bicycle conflicts.
Keywords: Video recognition technology; vehicle-bicycle conflict; intersection entrance; random effect poisson-log-normal model; random effect negative binomial regression model
The rise of shared bicycles and the widespread use of electric bicycles have renewed attention to non-motor vehicles. However, the riding safety of non-motor vehicles has always been a key factor restricting their development, and the entrance lanes of intersections are a high-incidence location for vehicle-bicycle conflict. Many non-motorized lanes are protected by physical isolation measures on the road section, with good safety. However, at the entrance of the intersection, due to the need for motor vehicles to turn right, non-motor vehicles to go straight, and pedestrians to cross the street, the isolated measures between the motor vehicle and non-motor vehicle are usually changed to soft isolation measures such as white solid lines and colored paved roads, and even set up mixed carriageways. At the same time, the traffic conditions at intersections are also complicated. The factors such as traffic volume, speed, and proportion of large vehicles [1] will all affect the occurrence of vehicle-bicycle conflict. Therefore, clarifying the quantitative relationship between the number of vehicle-bicycle conflicts and various influencing factors is of great significance to the rational design and management of the riding facilities at the intersection entrance and ensuring riding safety.
The number of traffic conflicts is a type of count data that has the characteristics of non-negative, random, and discrete, and is affected by many factors such as road facilities and traffic organization. The research on the traffic conflict model is still in the initial stage, mainly to establish a linear regression model of the relationship between traffic conflict frequency and traffic volume. Poisson regression model and Negative binomial regression model (NB) are mostly used. The disadvantage of this type of model is that it assumes that the model parameters are fixed and does not take into account the differences of variables under different road conditions, causing that road conditions to not affect the number of conflicts, which is out of line with reality [2,3]. Existing studies have shown that taking into account the differences in the effects of variables and assuming that the variables obey a certain distribution, the heterogeneity of unobserved variables can be captured to a certain extent [4], and the discreteness of traditional traffic conflict models can be overcome. So that the model fits better. Therefore, the random effect Poisson-log-normal model, (REPLN model) and the random effect negative binomial regression model, (RENB model) have been developed in recent years. Previously, the Bayesian method was used less because of the lack of an effective solution method, because traditional simulation methods need to assume that the samples are independent, which is difficult to achieve in Bayesian statistics. Due to the Markov chain having characteristics of an independent state and final convergence, as well as the advantages of the Monte Carlo simulation method in the calculation and time-consuming of model solving, Markov Chain Monte Carlo methods (MCMC) has a wider range of applications. The MCMC method is roughly divided into 5 steps: (1) Randomly generate numbers, i.e., Monte Carlo Simulation; (2) Allow the generated numbers to affect the next generated numbers, i.e., Markov Chain; (3) Determine whether the new numbers generated are “moved in the right direction”, i.e., Acceptance-Rejection Method; (4) Check the convergence to determine when our data can converge to a reasonable distribution. After the convergence point, the randomly generated values become our posterior distribution; (5) Statistical inference, using the last stable sample to statistically infer the samples of the posterior distribution, to get the parameters we are interested in.
This article is based on video detection technology to obtain vehicle-bicycle conflict data [5–7], uses the Bayesian statistical method to establish a random parameter model, and solves it with the MCMC method to quantitatively analyze the number of conflicts between straight-going non-motor vehicles and right-turning motor vehicles and the riding facilities on the entrance road of the intersection and analyze the significant factors that affect the number of conflicts. The remainder of the study is structured as follows. First, we review previous studies on traffic conflicts and riding safety from both the methodological side and the determinants side. Second, we discuss the data used for analysis along with the method of obtaining the data. Third, we develop the REPLN model and the RENB model and provide an in-depth discussion on the relationship between riding safety influencing factors and the number of traffic conflicts on intersection entrances. We conclude the paper by summarizing key findings and demonstrating further research avenues.
The academic world currently does not clearly define what is a traffic conflict. Some studies believe that it should be classified into three categories: traffic accidents, traffic conflicts, and traffic disturbances, while some studies believe that all three of them belong to traffic conflicts of different severity. The relatively widely accepted definition of conflict is “there are two or more road users that are so close to each other in space and time that if their movement remains the same, a collision will occur soon” [8]. Due to the low frequency and sporadic characteristics of accident data, there are great difficulties, limitations, and uncertainties in data collection. Consequently, the number of traffic conflicts is a suitable surrogate indicator [9,10]. Currently, there are two main types of surrogate indicators used to define traffic conflicts: One is based on the proximity of road conflicts in time and space, such as TTC [11–13]、PET [14,15] and other time indicators, braking distance [16], conflict radius [17] and other spatial indicators. The second is based on indicators of risk-averse behaviors, such as the road users’ deceleration, sudden braking, and the degree of frontal turning [18].
The widely used vehicle-bicycle conflict models [19] mainly include traditional regression analysis models and generalized linear models, fuzzy neural network models, probability models, Bayesian hierarchical models, and so on. Cheng et al. [20] used linear and non-linear regression analysis methods to construct a model of the relationship between bicycle traffic volume and the number of vehicle-bicycle conflicts; Bai et al. [21] constructed a generalized linear regression model with fixed effects, random effects, and random parameters; Stipancic et al. [15] divided the traffic conflicts into 3 categories based on the PET value, and establish an ordered logit regression model of 3 conflict categories; Wang et al. [22] judged the probability of right-turning motor vehicles and straight-going non-motor vehicles through the probability model; Gao et al. [23] established a regression model considering the factors of distance, speed, and angle of vehicle-bicycle conflict and explained the number of vehicle-bicycle conflict with the arrivals of straight-going non-motor vehicles and equivalent cars.
The most common vehicle-bicycle interference at intersections is the interference of right-turning motor vehicles on riding [24]. At intersections and roundabouts without signal lights, near sidewalks are high conflict areas [25]. Safety is the most important factor affecting riding [26], followed by comfort [27] The improvement of infrastructure can have a positive impact on the willingness to cycle [28], and can effectively reduce the injury of cyclists [29], especially to maintain the continuity of non-motorized traffic lanes [30]. Cyclists on non-motorized roads with physical separation are mainly affected by the geographical features and the surrounding environment of the road while riding on roads without physical separation is mainly affected by the riding space and traffic conditions [31]. Surveys have shown that the use of physically separated non-motorized lanes makes cyclists feel safer and increases the rate of riding [32,33], Roads with non-motorized lanes have 37% more bicycle traffic than roads without non-motorized lanes [34], colored paved surface will also enhance the positive feeling of the cyclists [35]. In addition, the width of non-motorized lanes is also a very important design element, which is closely related to the probability of vehicle-bicycle conflict [36].
Survey purpose: Select several intersection entrance roads that meet the research needs as the survey location. Use T-Analyst software to collect the trajectory data and conflict data of straight-going non-motor vehicles and right-turning motor vehicles. Analyze the conflict situations of non-motor vehicles and right-turning motor vehicles and the impact of different riding facilities on riding safety.
Survey object: non-motor vehicles include ordinary bicycles and electric-assisted bicycles. Motor vehicles are models within 9 seats.
Survey tools: The tools used in this survey include a high-definition camera (model Go pro6), a 3 m tripod (up to 3.3 m), traffic cones, chalk, and tape measure. Two cameras are placed at each survey point. Camera No. 1 is located at the exit of the intersection directly opposite to the non-motorized lane; Camera No. 2 is located on the sidewalk 45 meters away from the parking line of the intersection entrance road, and the camera is aimed at the adjacent non-motorized lane. The data collection range is the traffic conditions of motor vehicles and non-motor vehicles within 45 meters from the parking line. The viewing angles of the two cameras are shown in Fig. 1. The entire process of video recognition technology to identify vehicle-bicycle conflict and its application in cycling behavior analysis was divided into the following three steps. At first, the corresponding feature points in video and satellite images were used to establish coordinate axes, and the trajectory of a detected object in a video was converted into a three-dimensional-space trajectory after gridding the video image. Second, the 3D frame was set to track the target trajectory and distinguish it from image interference, such as the background. Finally, through learning, comparing, and iterating the trajectory data of moving objects, whether the expected trajectories of two vehicles would lead to a collision and what the severity of the conflict would be based on multiple observation indicators were judged.
Survey time: June 24–28, 2019, a total of 5 working days. The period is:①7:30–8:30,②9:00–10:00,③16:00–17:00,④17:30–18:30; including 2 peak periods and 2 stable periods.
Survey location: Select the intersection entrance road with non-motor vehicle entrance within 25 meters from the intersection parking line. The width of non-motorized lanes includes the most common 1.5 and 2.5 m. There are 3 types of separation between motorized lanes and non-motorized lanes, including mixed traffic, white solid lines, and color paved roads. At first, we conducted an on-site survey of about 21 intersection entrance road locations in Changsha, China, as the basic data for selecting pre-survey locations. Then, we selected 14 sites for pre-survey with a good survey environment, covering 3 types of separation between motorized lanes and non-motorized lanes. Through the pre-survey, we found some other issues that are not suitable for survey. For example, there are security issues on the survey site. Finally, we selected 7 sites for formal survey. In the end, 7 intersections in Changsha, China were selected as the survey objects.
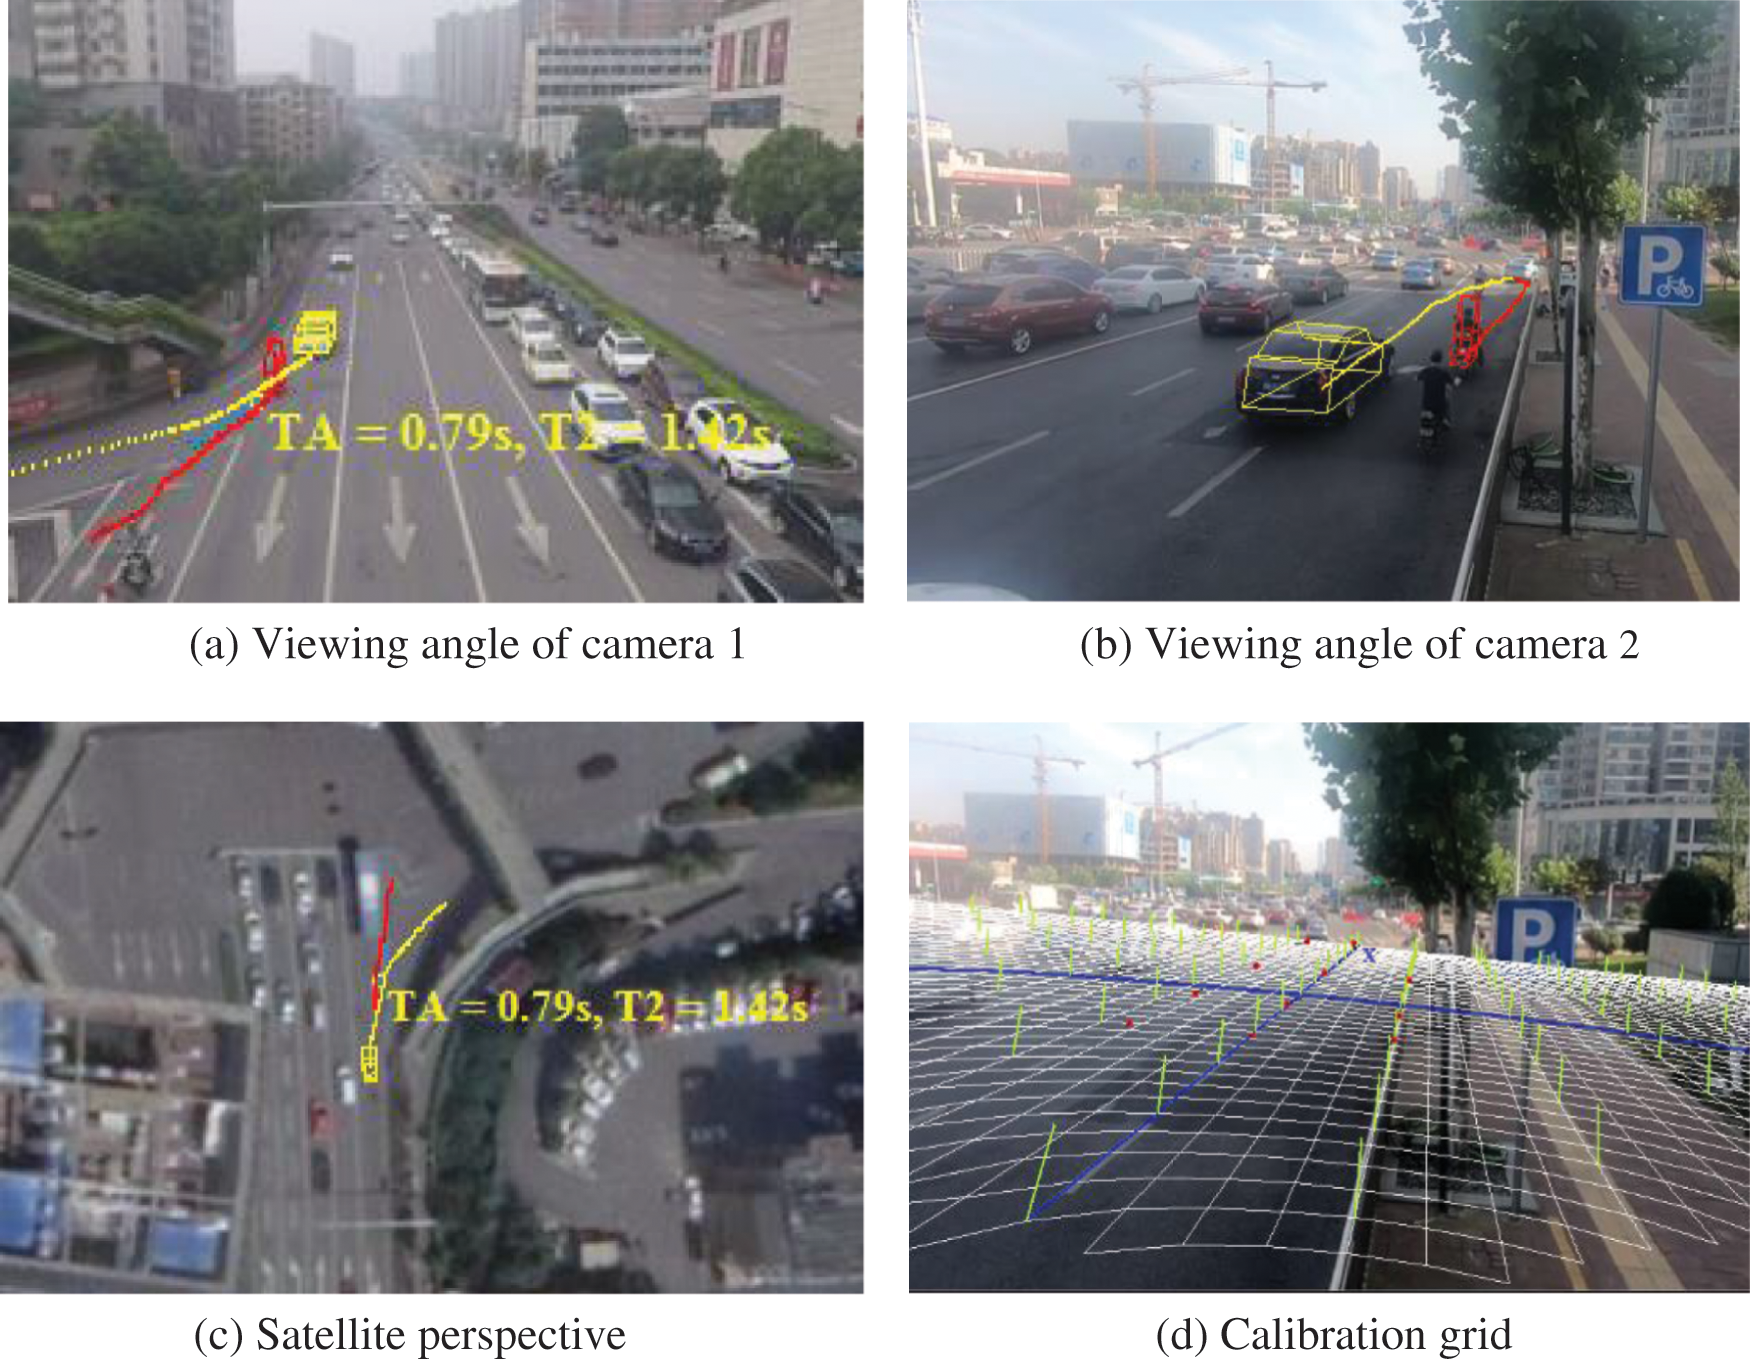
Figure 1: Data acquisition perspective and calibration
The key difficulty in traffic conflict analysis lies in the acquisition of traffic conflict data. The mature video recognition technology has solved the shortcomings of the manual method [37,38], experimental vehicle method, and micro-simulation method. It saves time and effort on collecting data, and the collected data by this method is accurate and rich. This article uses T-analyst and T-Calibration software to track the target’s motion trajectory data. First, the video and satellite map coordinates are calibrated in T-Calibration, and the mapping relationship between the video and the satellite map is established. Then, the trajectory tracking operation is performed in the T-Analyst software, as shown in Fig. 1.
The identification of traffic conflicts is mainly based on TTC (Time-to-Collision) and T2. TTC means that if the two parties in the conflict continue to follow the existing speed and path, the time required for a collision [9], this indicator can only be calculated on the premise that the collision will occur. T2 is used to describe the time required for the second road user to reach the collision point on the premise that the vehicle in front “has not left the conflict zone” [39]. In this article, the conflict of TTC and T2 less than 4 s is included in the scope of the study, and a total of 1096 vehicle-bicycle conflict cases of straight-right are extracted [40].
Through a large amount of video analysis, vehicle-bicycle conflicts were summarized as eight typical vehicle-bicycle conflicts according to the three elements of conflict direction, conflict-active party, and conflict reason, as shown in Fig. 2.
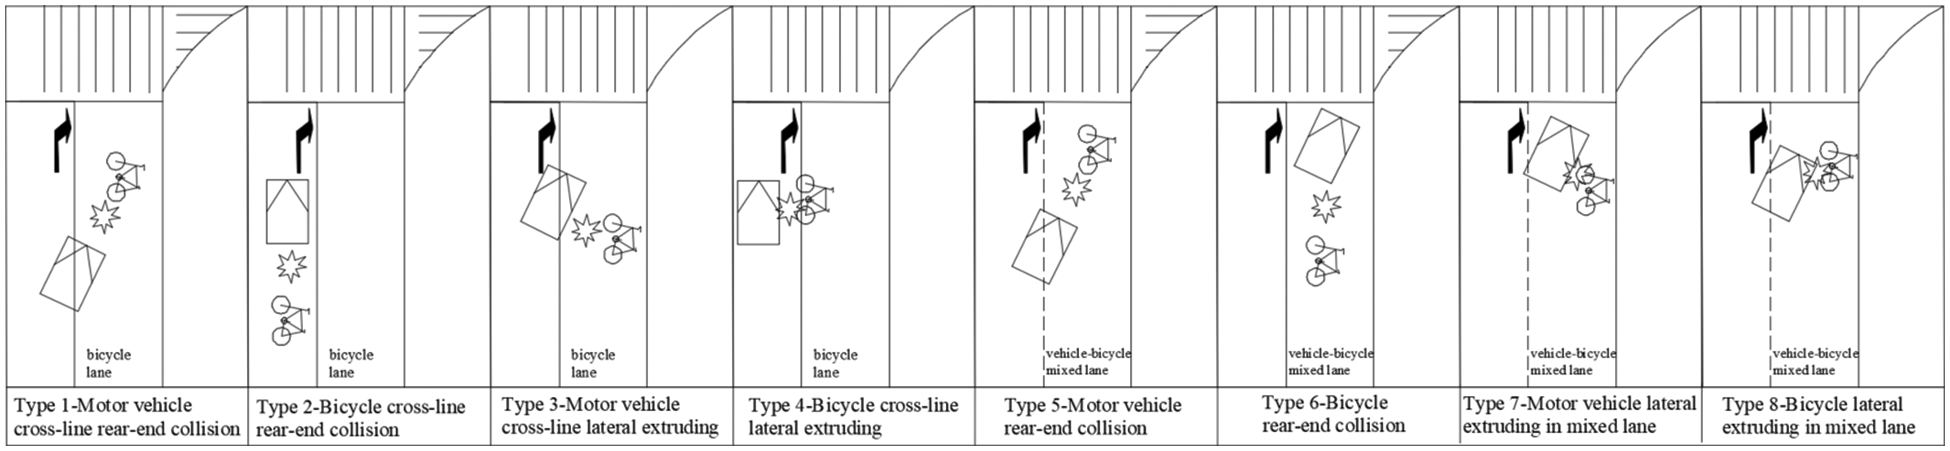
Figure 2: Illustration of eight typical vehicle-bicycle conflicts
3.2 Straight-Ahead Cyclists and Right-Turning Motor Vehicles Conflicts Modelling
This article constructs the random effect Poisson-log-normal model and the random effect negative binomial regression model (RENB model) to analyze the vehicle-bicycle conflict, the MCMC (Markov chain Monte Carlo methods) method is used to estimate the model parameters. Since the vehicle-bicycle conflict model parameters do not have a prior distribution of reliable data sources, the model parameters in this article adopt an uninformed prior distribution. The REPLN model is:
In the formula,
The model parameters are set using non-information distribution, as shown in formulas (6) and (7) the model’s coefficient
The distributions of each parameter are as follows:
The RENB model is:
In the formula,
3.2.2 Model Goodness of Fit Judgment
The fit judgment of the model is mainly carried out from two aspects, one is the judgment of the convergence of the model, and the other is the comparison of the pros and cons of the model. Model convergence is mainly judged based on the following two criteria: (1) If there are more than two iteration chains constructed by the model, iterative chains cross each other to represent model convergence; (2) If the variability within and between chains is stable and its ratio (Gelman-Rubin statistic) is close to 1, it indicates that it has converged. In practical application, the boundary is 1.2. The model’s goodness of fit comparison can use the Deviance information criterion (DIC), DIC is expressed as
The
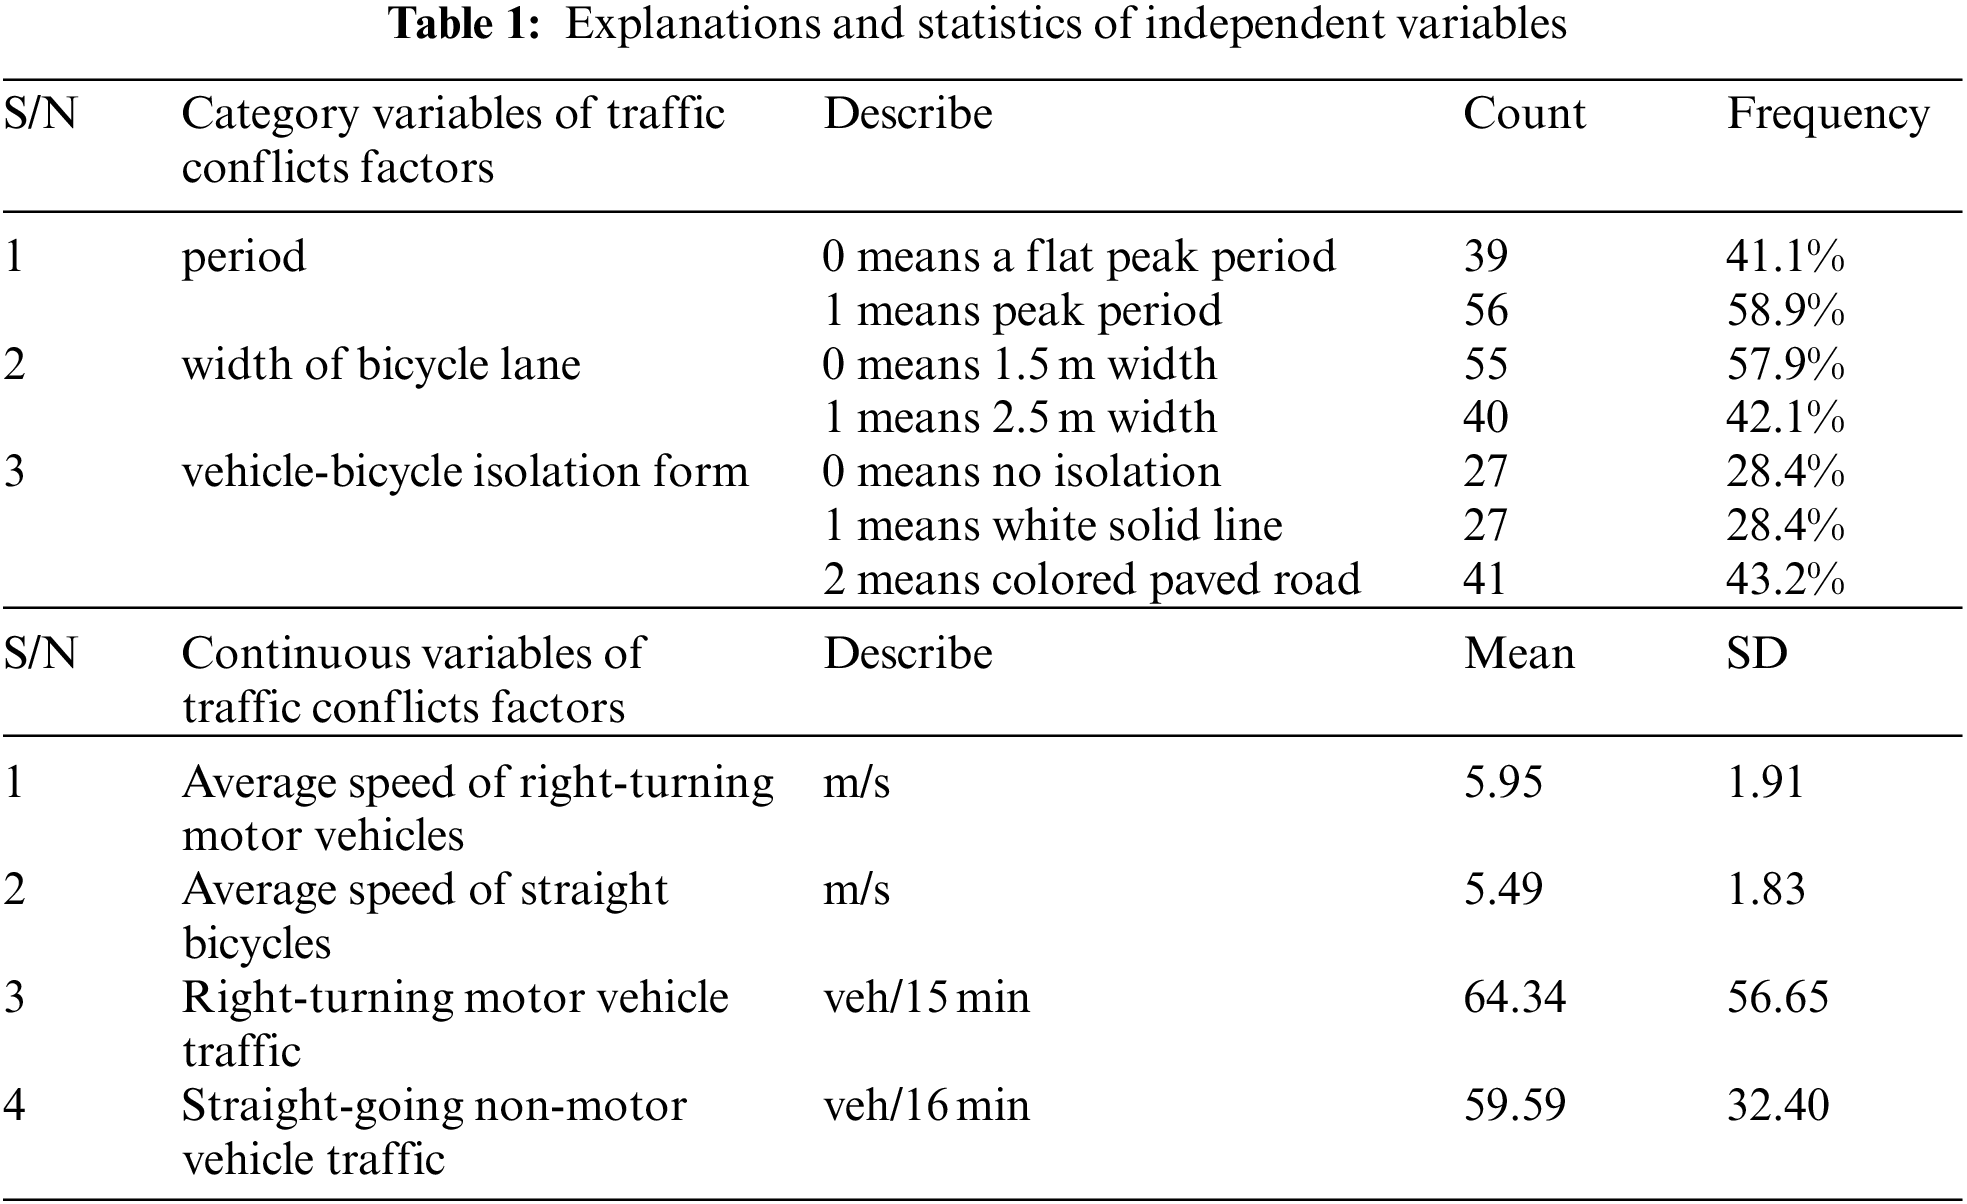
To study the influence of different factors on vehicle-bicycle conflicts, 7 intersections in Changsha City were selected for traffic conflict data collection. The independent variables of the model are divided into categorical variables and continuous variables. The categorical variables include three indicators: period, the width of non-motorized lanes, and vehicle-bicycle soft isolation measures. Continuous variables include two indicators of speed and volume. The variable description is shown in Tab. 1.
This article uses Openbugs3.2.3 to estimate the model parameters, constructs two MCMC chains iterated 20000 times, anneals top 4000 samples, uses the remaining iterative samples to infer the posterior distribution of the model parameters, and obtains the estimated results of the REPLN model and RENB model parameters. By observing the historical iteration graph of the model in this article, the two MCMC chains interact with each other and the BGR value is less than 1.2. As shown in Figs. 3 and 4, the model algorithm in this paper is convergent.
The estimated results of the model are shown in Tab. 2. By comparing DIC, it can be seen that the DIC value of the REPLN model is 27.6 lower than that of the RENB model, indicating that the fitting effect of the REPLN model is better than that of the RENB model.
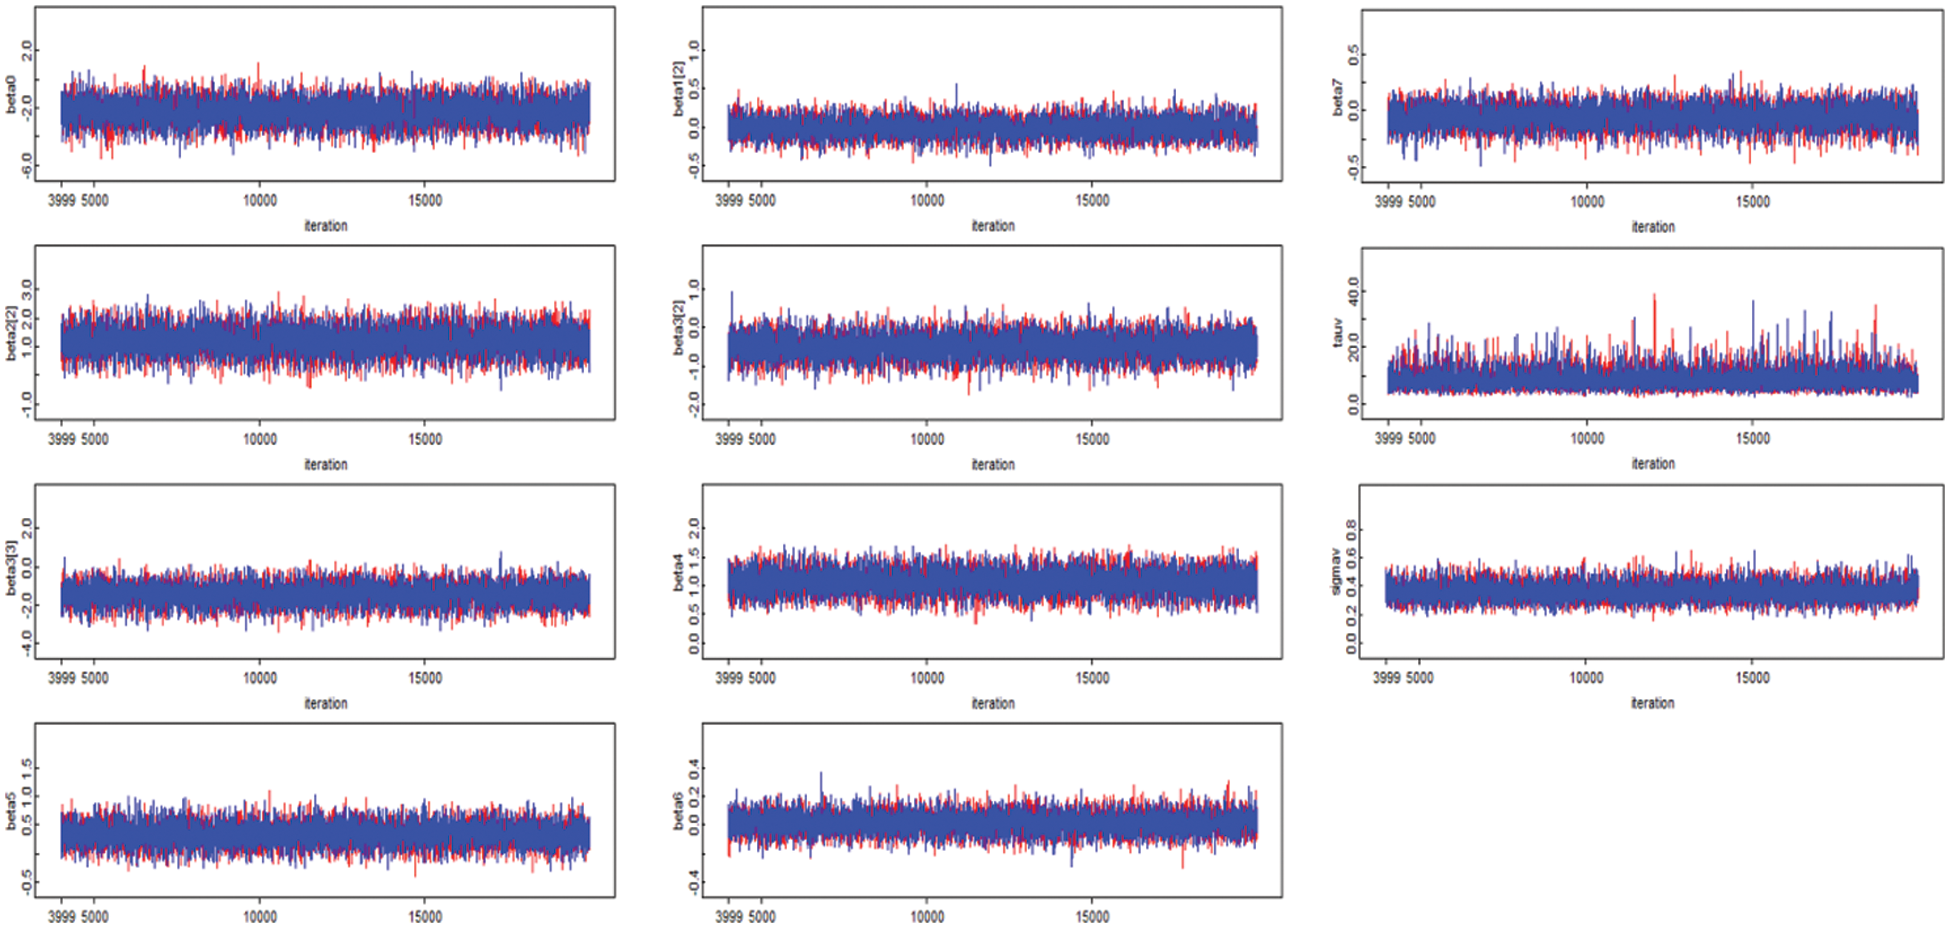
Figure 3: Model parameter history iteration graph
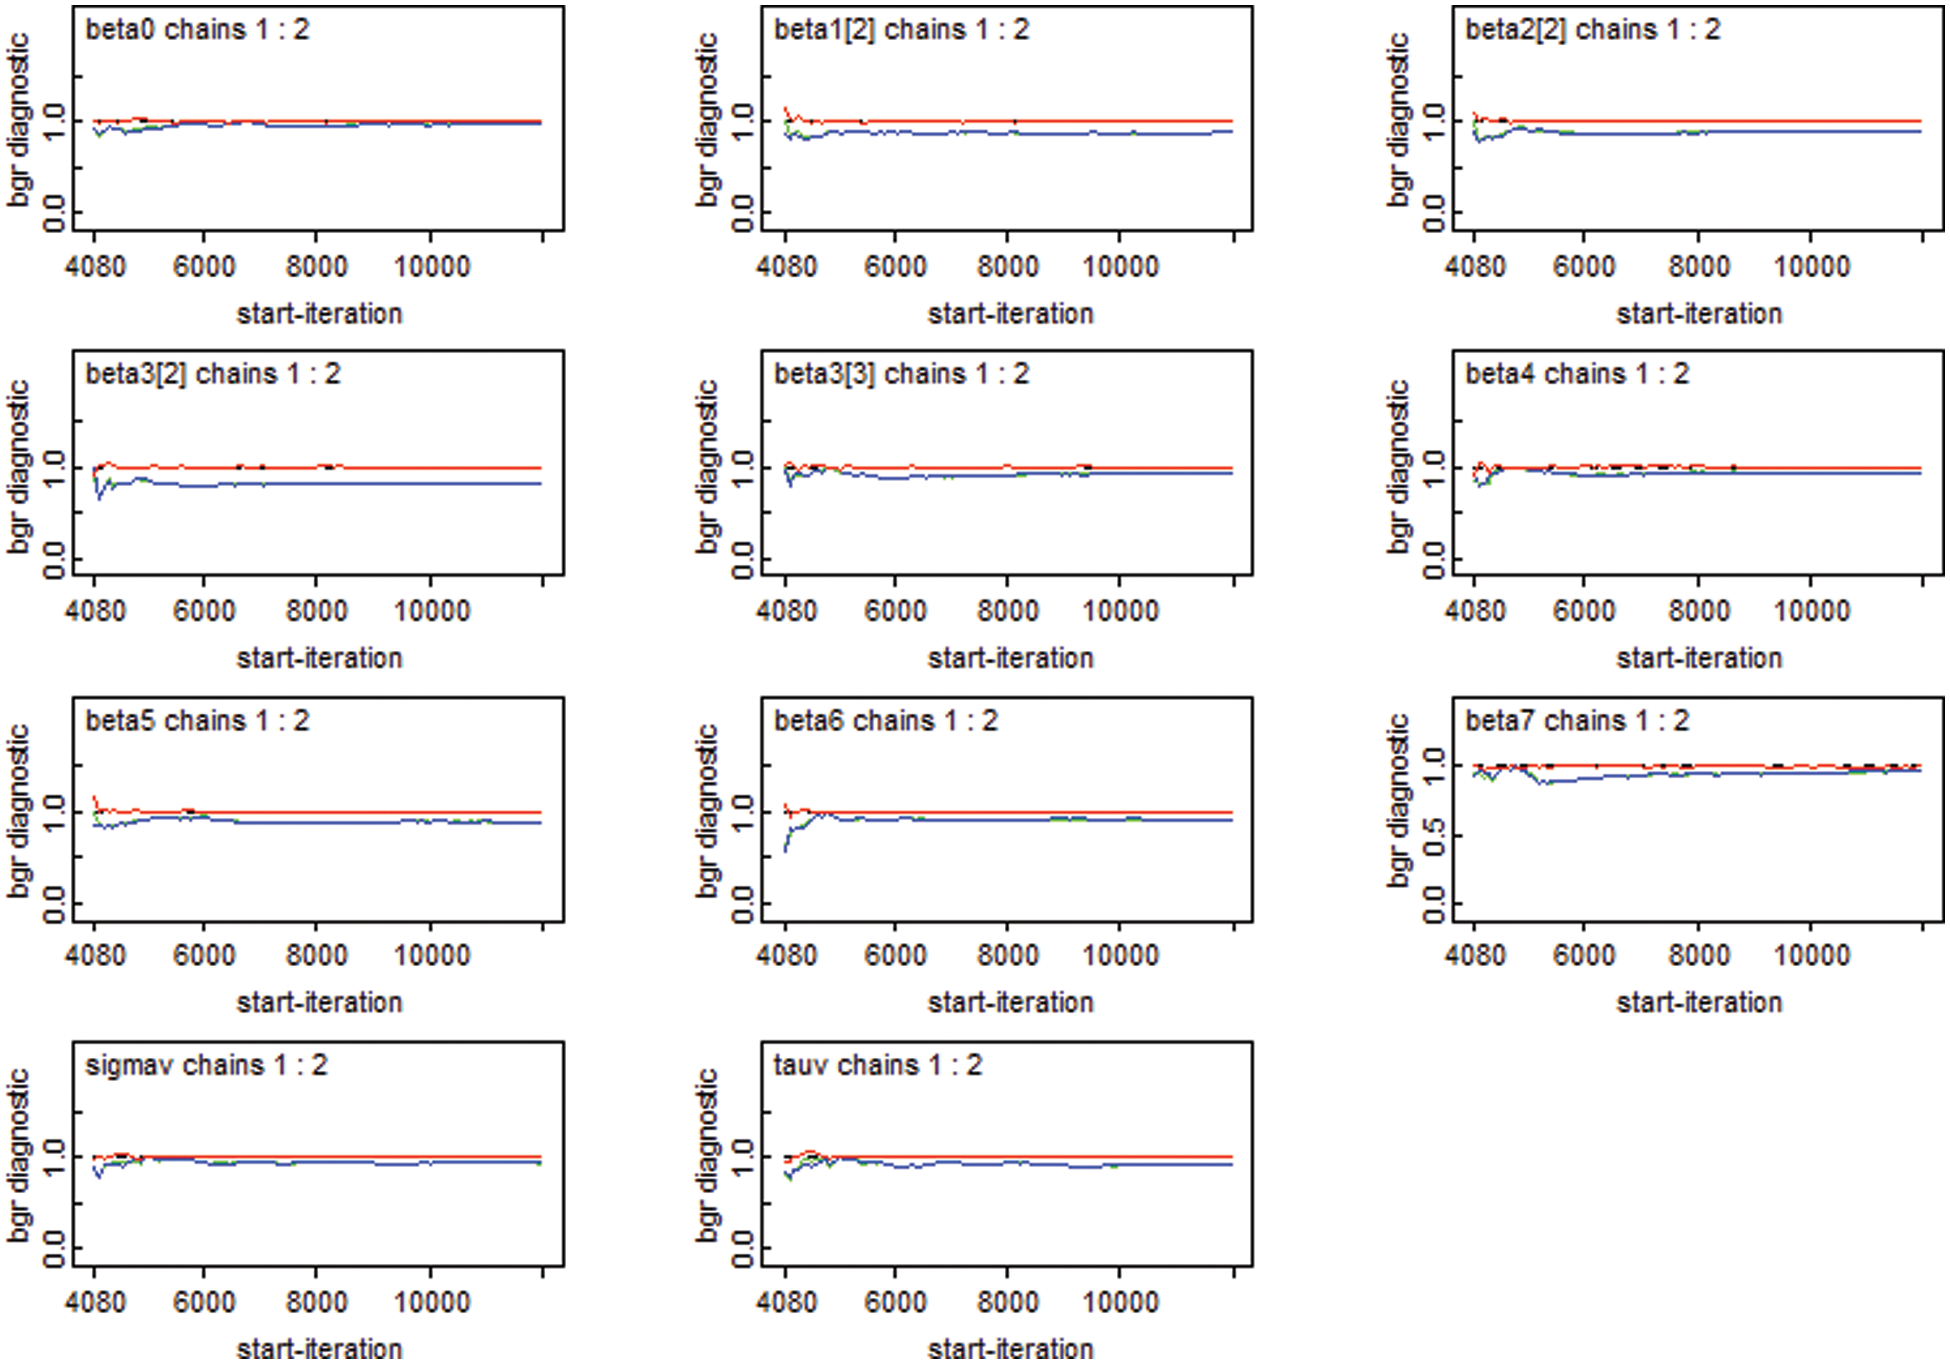
Figure 4: Model parameter BGR diagram
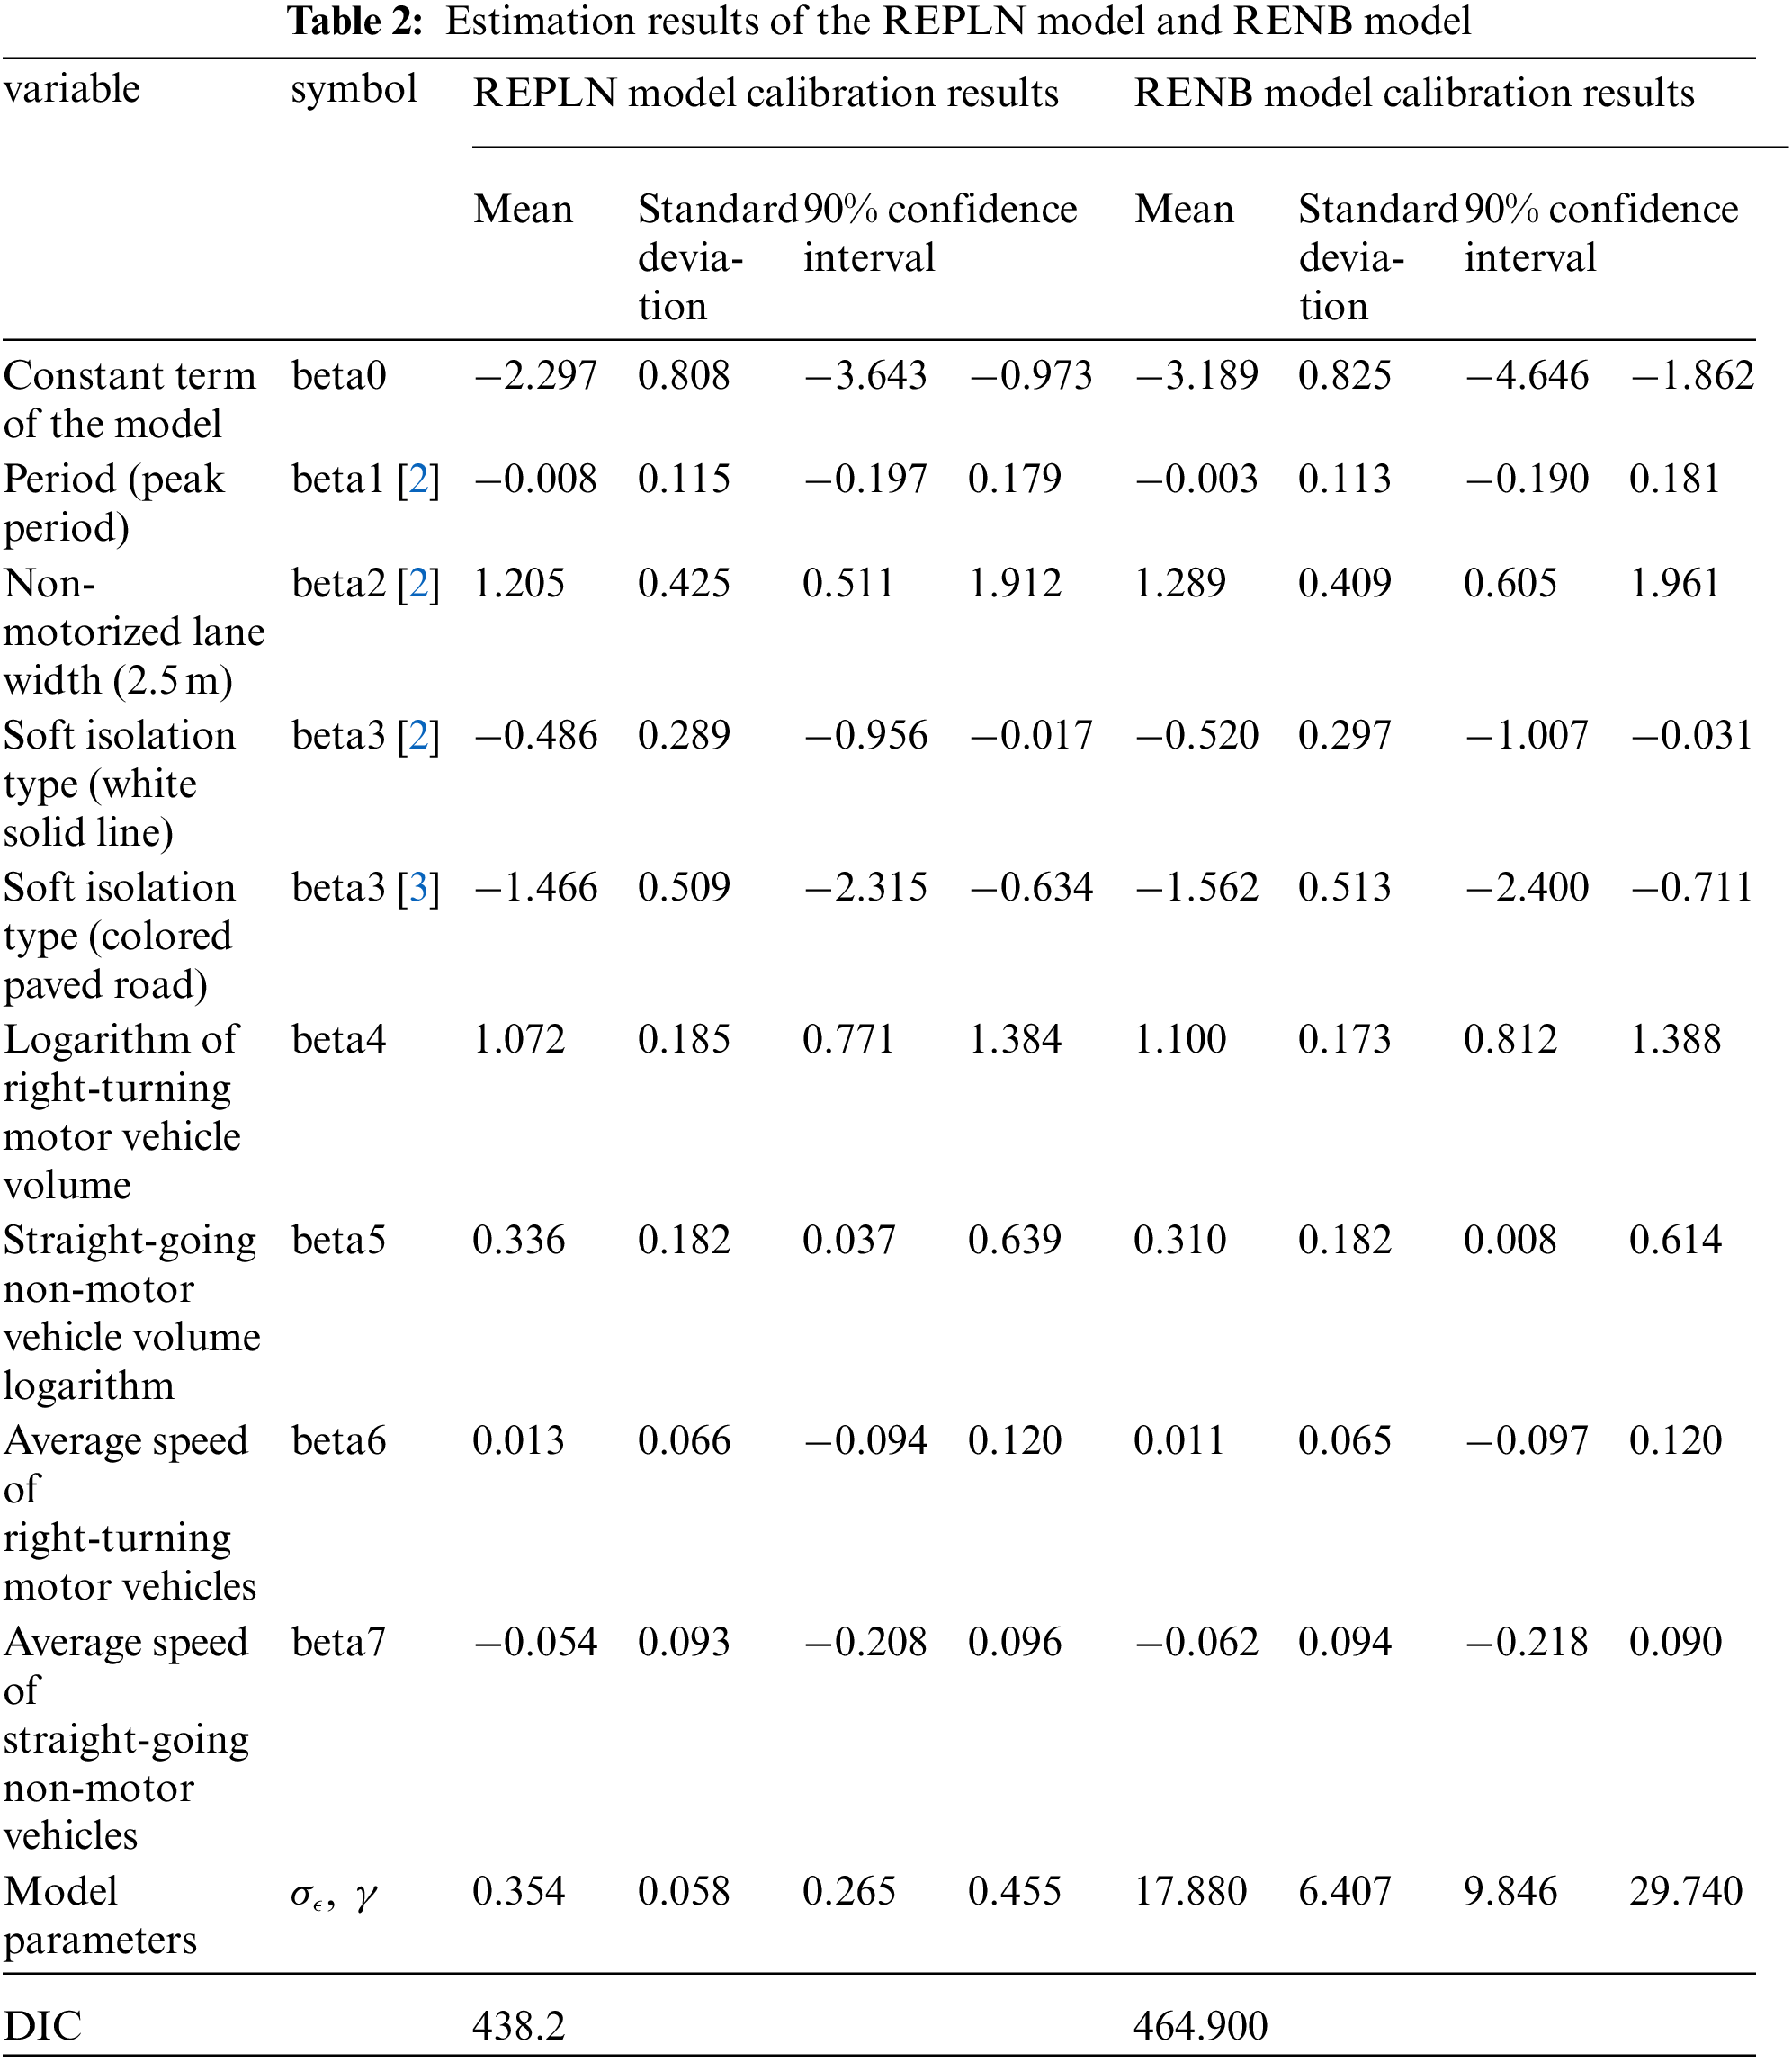
The calibration of the REPLN model and the RENB model both show that the types of vehicle-bicycle soft isolation facilities, right-turning motor vehicles, and straight-going non-motorized traffic are significantly positively correlated with the number of vehicle-bicycle conflicts. And there is a significant negative correlation between the width of the non-motorized lane at the entrance of the intersection and the number of vehicle-bicycle conflicts. The peak periods and flat periods, the average speed of right-turning motor vehicles, and the average speed of straight-going non-motor vehicles have no significant influence on the number of vehicle-bicycle conflicts.
(1) The factor of non-motorized lane width. The calculation results of the REPLN model show that, compared with a 1.5-meter-wide non-motorized lane, when the width of a 2.5-meter-wide non-motorized lane increases by 1%, the vehicle-bicycle conflict will increase by (e1.205) %, which is 3.337%. Wider non-motorized lanes increase traffic capacity and reduce non-motor vehicle internal conflicts. The greater volumes and faster speed of non-motor vehicles make motor vehicles more willing to take cautious avoidance measures when dealing with vehicle-bicycle conflicts, thereby reducing the number of conflicts. However, we have also found in our observations that when the lane width is 2.5 m, the proportion of right-turning motor vehicles driving on the lane is higher, which reduces the difference in the number of conflicts between the two non-motorized lanes widths. If we can establish a stronger consciousness of the way right for drivers, it is expected that the reduction in the number of conflicts brought about by the increase in lane width will be more significant.
(2) The factor of facilities of vehicle-bicycle soft isolation. Compared with mixed traffic, whether it is a white solid line or a colored paved road, the vehicle-bicycle soft isolation measures can significantly reduce vehicle-bicycle conflicts. Compared with the white solid line, the colored paved road is more significant in reducing the number of vehicle-bicycle conflicts. The colored pavement makes the non-motorized lane and the motorized lane in sharp contrast, which is more likely to attract the attention of motor vehicle drivers, thereby prompting them to adopt more cautious driving behaviors. However, it is also found in the observation that there is little difference in the effect of a continuously paved colored pavement and a partially colored pavement at a key location. From the perspective of cost, it is more reasonable to choose partially colored pavement.
(3) The factor of volume. When the traffic volume of right-turning motor vehicles increases by 1%, the corresponding vehicle-bicycle conflicts volume increases by 1.072%. When the straight-going non-motor vehicle traffic volume increases by 1%, the corresponding vehicle-bicycle conflicts volume increases by 0.336%. It can be seen that the factor of motor vehicles plays a more significant role in vehicle-bicycle conflicts. On the one hand, motor vehicles have larger models and can pass through fewer gaps, and there is a greater chance to have conflicts, while non-motor vehicles are just the opposite. On the other hand, the speed change and threat of motor vehicles are greater than that of non-motor vehicles, and its impact is greater than that of non-motor vehicles on motor vehicles.
(4) The factor of speed. From the direct observation and analysis of the video, the speed factor is not significant. The main reason for the non-significant number of vehicle-bicycle conflicts between the right-turning motor vehicle and the straight-going non-motor vehicle is that when the traffic volume at the entrance of the intersection is large, the right-turning motor vehicles and straight-going non-motor vehicles are fully decelerated and coordinated, the speed difference between them is small; And when the volume is small, the speed difference is large, but due to the sufficient crossing gap, the probability of vehicle-bicycle conflict is low; Therefore, The impact of the vehicle-bicycle speed difference on the number of vehicle-bicycle conflicts is not significant.
Considering the difference in the role of traffic variables in different traffic environments, using video recognition technology to obtain vehicle-bicycle conflict data, using Bayesian method, constructing REPLN vehicle-bicycle conflict model and RENB vehicle-bicycle conflict traffic conflict model. The results show that the two models can fit the vehicle-bicycle conflict data well, and the comparison results of the models show that the goodness of fit of REPLN is better than RENB. The estimation results of the REPLN vehicle-bicycle conflict model show that the width of non-motorized lanes, the form of vehicle-bicycle soft isolation facilitates, the coefficients of right-turning traffic volume, and straight-going volume follow a normal distribution. The types of vehicle-bicycle soft isolation facilities, right-turning motor vehicles, and straight-going non-motorized traffic are all significantly positively correlated with the number of vehicle-bicycle conflicts. The width of the non-motorized lanes at the intersection entrance lanes and the number of vehicle-bicycle conflicts are significantly negatively correlated. Peak periods and flat periods, the average speed of right-turning motor vehicles, and the average speed of straight-going non-motor vehicles have no significant impact on the number of vehicle-bicycle conflicts. Since the vehicle-bicycle conflict is affected by many factors, more parameters can be incorporated into the model for research in the future. In addition, the difference between working days and non-working days is also worth studying.
Acknowledgement: The author thanks the Hunan Big Data Engineering Technology Research Center of Natural Protected Areas Landscape Resources, Central South University of Forestry and Technology.
Funding Statement: This work was supported in part by the Ministry of Education of the People’s Republic of China Project of Humanities and Social Sciences under Grant No. 19YJCZH208, author X. X, http://www.moe.gov.cn/; in part by the Social Sciences Federation Think Tank Project of Hunan Province under Grant No. ZK2019025, author X. X, http://www.hnsk.gov.cn/; in part by the Education Bureau Research Foundation Project of Hunan Province under Grant No. 20A531, author X. X, http://jyt.hunan.gov.cn/; in part by the Science and Technology Project of Changsha City, under Grant No. kq2004092, author X. X, http://kjj.changsha.gov.cn/; in part by Key Subjects of the State Forestry Bureau in China under Grant No. [2016]21, author X. X, http://www.forestry.gov.cn/; and in part by “Double First-Class” Cultivation Discipline of Hunan Province in China under Grant No. [2018]469, author X. X, http://jyt.hunan.gov.cn/.
Conflicts of Interest: The authors declare that there are no conflicts of interest regarding the publication of this paper.
1. L. Zheng and T. Sayed, “A full Bayes approach for traffic conflict-based before-after safety evaluation using extreme value theory,” Accident Analysis & Prevention, vol. 131, no. 10, pp. 308–315, 2019. [Google Scholar]
2. M. Moomen, M. Rezapour, M. Raja and K. Ksaibati, “Predicting downgrade crash frequency with the random-parameters negative binomial model: Insights into the impacts of geometric variables on downgrade crashes in wyoming,” IATSS Research, vol. 44, no. 2, pp. 94–102, 2020. [Google Scholar]
3. Y. Guo, Y. Wu, J. Lu and J. Zhou, “Modeling the unobserved heterogeneity in e-bike collision severity using full Bayesian random parameters multinomial logit regression,” Sustainability, vol. 11, no. 7, pp. 2071–2071, 2019. [Google Scholar]
4. Q. Hou, A. P. Tarko and X. Meng, “Investigating factors of crash frequency with random effects and random parameters models: New insights from Chinese freeway study,” Accident Analysis & Prevention, vol. 120, no. 10, pp. 1–12, 2018. [Google Scholar]
5. Q. Zhou, J. Qin, X. Xiang, Y. Tan and N. Xiong, “ “Algorithm of helmet wearing detection based on AT-YOLO deep mode,” Computers, Materials & Continua, vol. 69, no. 1, pp. 159–174, 2021. [Google Scholar]
6. Z. Liu, X. Xiang, J. Qin, Y. Tan, Q. Zhang and N. Xiong, “ “Image recognition of citrus diseases based on deep learning,” Computers, Materials & Continua, vol. 66, no. 1, pp. 457–466, 2021. [Google Scholar]
7. J. Tan, R. Duan, J. Qin, X. Xiang and Y. Tan, “ “Feature fusion multi-view hashing based on random kernel canonical correlation analysis,” Computers, Materials & Continua, vol. 63, no. 2, pp. 675–689, 2020. [Google Scholar]
8. J. W. Doran and D. M. Linn, “Proceedings of the first workshop on traffic conflicts: (Held September 1977 in Oslo.) institute of transport economics, Oslo, Norway, 1977.138 pp.,” Accident Analysis & Prevention, vol. 11, no. 4, pp. 317–318, 1979. [Google Scholar]
9. C. Johnsson, A. Laureshyn and T. D. Ceunynck, “In search of surrogate safety indicators for vulnerable road users: A review of surrogate safety indicators,” Transport Reviews, vol. 38, no. 6, pp. 765–785, 2018. [Google Scholar]
10. A. P. Tarko, “Surrogate measures safety,” Transport and Sustainability, vol. 11, no. 4, pp. 383–405, 2018. [Google Scholar]
11. W. V. Haperen, S. Daniels, T. D. Ceunynck, N. Saunierc, T. Brijs et al., “Yielding behavior and traffic conflicts at cyclist crossing facilities on channelized right-turn lanes,” Transportation Research Part F: Traffic Psychology and Behaviour, vol. 55, no. 5, pp. 272–281, 2018. [Google Scholar]
12. L. Zheng, T. Sayed and M. Essa, “Bayesian hierarchical modeling of the non-stationary traffic conflict extremes for crash estimation,” Analytic Methods in Accident Research, vol. 23, no. 9, pp. 100100–100100, 2019. [Google Scholar]
13. Y. Guo, T. Sayed and M. H. Zaki, “Evaluating the safety impacts of powered two wheelers on a shared roadway in China using automated video analysis,” Journal of Transportation Safety & Security, vol. 11, no. 4, pp. 414–429, 2018. [Google Scholar]
14. L. Zheng and K. Ismail, “A generalized exponential link function to map a conflict indicator into severity index within safety continuum framework,” Accident Analysis & Prevention, vol. 102, no. 5, pp. 23–30, 2017. [Google Scholar]
15. J. Stipancic, S. Zangenehpour, L. Miranda-Moreno, N. Saunier and M. Granié, “Investigating the gender differences on bicycle-vehicle conflicts at urban intersections using an ordered logit methodology,” Accident Analysis & Prevention, vol. 97, no. 10, pp. 19–27, 2016. [Google Scholar]
16. Y. Ci, L. Wu, X. Li and Z. Liu, “Traffic conflict probability distribution for non-motor vehicles at curb parking area,” Journal of Harbin Institute of Technology, vol. 47, no. 2, pp. 46–49, 2015. [Google Scholar]
17. Y. Wang, F. Xing and W. Guo, “Research on mixed traffic conflict at signalized intersection,” Chinese Safety Science Journal, vol. 26, no. 6, pp. 47–51, 2016. [Google Scholar]
18. A. Laureshyn, T. D. Ceunyncka, C. Karlssona, A. Svenssona and S. Daniels, “In search of the severity dimension of traffic events extended delta-V as a traffic conflict indicator,” Accident Analysis & Prevention, vol. 98, no. 1, pp. 46–56, 2017. [Google Scholar]
19. X. Xue, Z. Wang, L. Ge, L. Deng, R. Song et al., “Video recognition for analyzing the characteristics of vehicle-bicycle conflict,” Computers Materials & Continua, vol. 69, no. 2, pp. 2779–2791, 2021. [Google Scholar]
20. G. Cheng, W. Wang and H. Xu, “Analysis on automobile-bicycle conflict and calculation method for the width of bicycle lane on urban road,” Journal of Harbin Institute of Technology, vol. 51, no. 9, pp. 130–136, 2019. [Google Scholar]
21. L. Bai, P. Liu, Y. Guo and C. Xu, “Understanding factors affecting frequency of traffic conflicts between electric bicycles and motorized vehicles at signalized intersections,” Transportation Research Record, vol. 2514, no. 1, pp. 68–78, 2015. [Google Scholar]
22. F. Wang, K. Tang, K. Li, Z. Liu and L. Zhu, “A Group-based signal timing optimization model considering safety for signalized intersections with mixed traffic flows,” Journal of Advanced Transportation, vol. 2019, no. 1, pp. 1–13, 2019. [Google Scholar]
23. Z. Gao, L. Ma and X. Yan, “Research on models for traffic conflicts involving non-motor vehicles at city intersection and their severity,” China Safety Science Journal, vol. 27, no. 3, pp. 31–36, 2017. [Google Scholar]
24. T. S. Buch and S. U. Jensen, “Incidents between straight-ahead cyclists and right-turning motor vehicles at signalized junctions,” Accident Analysis & Prevention, vol. 105, no. 8, pp. 44–51, 2017. [Google Scholar]
25. A. P. Silvano, H. N. Koutsopoulos and X. Ma, “Analysis of vehicle-bicycle interactions at unsignalized crossings: A probabilistic approach and application,” Accident Analysis & Prevention, vol. 97, no. 10, pp. 38–48, 2016. [Google Scholar]
26. J. Puchera, J. Dillb and S. Handyc, “Infrastructure, programs, and policies to increase bicycling: An international review,” Preventive Medicine, vol. 50, no. 1, pp. 106–125, 2010. [Google Scholar]
27. W. Zhu, B. Zhai and D. Jian, “Evaluating the bicycle travel environment in a changing bicycle culture: Case study of shanghai, China,” Journal of Urban Planning and Development, vol. 143, no. 3, pp. 05017001, 2017. [Google Scholar]
28. C. A. Mulvaney, S. Smith, M. C. Watson, J. Parkin, C. Coupland et al., “Cycling infrastructure for reducing cycling injuries in cyclists,” Injury Prevention, vol. 22, no. 2, pp. 108, 2016. [Google Scholar]
29. J. Digioia, K. E. Watkins, Y. Xu, M. Rodgers and R. Guensler, “Safety impacts of bicycle infrastructure: A critical review,” Journal of Safety Research, vol. 61, no. 6, pp. 105–119, 2017. [Google Scholar]
30. F. E. Pedroso, F. Angriman, A. L. Bellows and K. Taylor, “Bicycle use and cyclist safety following Boston’s bicycle infrastructure expansion, 2009–2012,” American Journal of Public Health, vol. 106, no. 12, pp. 2171–2177, 2016. [Google Scholar]
31. Z. Li, W. Wang, P. Liu and D. R. Ragland, “Physical environments influencing bicyclists’ perception of comfort on separated and on-street bicycle facilities,” Transportation Research Part D: Transport and Environment, vol. 17, no. 3, pp. 256–261, 2012. [Google Scholar]
32. B. Blanc and M. Figliozzi, “Modeling the impacts of facility type, trip characteristics, and trip stressors on cyclists’ comfort levels utilizing crowdsourced data,” Transportation Research Record, vol. 2587, no. 1, pp. 100–108, 2016. [Google Scholar]
33. N. Foster, C. M. Monsere, J. Dill and K. Clifton, “Level-of-service model for protected bike lanes,” Transportation Research Record, vol. 2520, no. 1, pp. 90–99, 2015. [Google Scholar]
34. S. Hankey, G. Lindsey, X. Wang, J. Borah, K. Hoff et al., “Estimating use of non-motorized infrastructure: Models of bicycle and pedestrian traffic in Minneapolis, MN,” Landscape and Urban Planning, vol. 107, no. 3, pp. 307–316, 2012. [Google Scholar]
35. P. Vera-Villarroel, D. Contreras, S. Lillo, C. Beyle, A. Segovia et al., “Perception of safety and liking associated to the color intervention of bike lanes: Contribution from the behavioural sciences to urban design and wellbeing,” Plos One, vol. 11, no. 8, pp. 1–15, 2016. [Google Scholar]
36. R. Zhang, Y. Chang and P. Zhang, “Research on the automobile-bicycle conflict probability of the entrance and exit of road section,” Highway, vol. 63, no. 6, pp. 193–200, 2018. [Google Scholar]
37. Y. Luo, J. Qin, X. Xiang and Y. Tan, “Coverless image steganography based on multi-object recognition,” IEEE Transactions on Circuits and Systems for Video Technology, vol. 31, no. 7, pp. 2779–2791, 2021. [Google Scholar]
38. Q. Liu, X. Xiang, J. Qin, Y. Tan, J. Tan and Y. Lou, “ “Coverless steganography based on image retrieval of DenseNet features and DWT sequence mapping,” Knowledge-Based Systems, vol. 2020, no. 192, pp. 105375–105389, 2020. [Google Scholar]
39. A. Laureshyn, H. Ardö, A. Svensson and T. Jonsson, “Application of automated video analysis for behavioural studies: Concept and experience,” IET Intelligent Transport Systems, vol. 3, no. 3, pp. 345–357, 2009. [Google Scholar]
40. Y. Guo, T. Sayed and M. H. Zaki, “Exploring evasive action-based indicators for PTW conflicts in shared traffic facility environments,” Journal of Transportation Engineering, Part A: Systems, vol. 144, no. 11, pp. 1–10, 2018. [Google Scholar]
 | This work is licensed under a Creative Commons Attribution 4.0 International License, which permits unrestricted use, distribution, and reproduction in any medium, provided the original work is properly cited. |