DOI:10.32604/cmc.2022.027369
| Computers, Materials & Continua DOI:10.32604/cmc.2022.027369 | |
| Article |
Feature Subset Selection with Artificial Intelligence-Based Classification Model for Biomedical Data
1Department of Industrial Engineering, College of Engineering at Alqunfudah, Umm Al-Qura University, Saudi Arabia
2Department of Computer Science, College of Computing and Information Technology, Taif University, Taif, 21944, Saudi Arabia
3Department of Information Systems, College of Science & Art at Mahayil, King Khalid University, Mahayil, 62529, Saudi Arabia
4Department of Computer and Self Development, Preparatory Year Deanship, Prince Sattam bin Abdulaziz University, AlKharj, 62529, Saudi Arabia
*Corresponding Author: Anwer Mustafa Hilal. Email: a.hilal@psau.edu.sa
Received: 15 January 2022; Accepted: 08 March 2022
Abstract: Recently, medical data classification becomes a hot research topic among healthcare professionals and research communities, which assist in the disease diagnosis and decision making process. The latest developments of artificial intelligence (AI) approaches paves a way for the design of effective medical data classification models. At the same time, the existence of numerous features in the medical dataset poses a curse of dimensionality problem. For resolving the issues, this article introduces a novel feature subset selection with artificial intelligence based classification model for biomedical data (FSS-AICBD) technique. The FSS-AICBD technique intends to derive a useful set of features and thereby improve the classifier results. Primarily, the FSS-AICBD technique undergoes min-max normalization technique to prevent data complexity. In addition, the information gain (IG) approach is applied for the optimal selection of feature subsets. Also, group search optimizer (GSO) with deep belief network (DBN) model is utilized for biomedical data classification where the hyperparameters of the DBN model can be optimally tuned by the GSO algorithm. The choice of IG and GSO approaches results in promising medical data classification results. The experimental result analysis of the FSS-AICBD technique takes place using different benchmark healthcare datasets. The simulation results reported the enhanced outcomes of the FSS-AICBD technique interms of several measures.
Keywords: Medical data classification; feature selection; deep learning; healthcare sector; artificial intelligence
Computational intelligent system research for medical application is one of the most important and stimulating fields. Generally, a clinician collects their information on the basis of confirmed diagnoses and the patient’s symptoms. In another word, predictive significance of symptoms towards diagnostic accuracy and some diseases of a person is heavily reliant on a physician’s knowledge [1]. Since treatment therapy and medical knowledge rapidly progresses, it is difficult for a clinician to possess current development and knowledge in medical settings [2]. Alternatively, with the emergence of computing technology, now it is relatively easy to store and acquire lots of data digitally, for example in devoted dataset of electronic patient records [3]. Intrinsically, the positioning of computerized medicinal decision support system (DSS) becomes a feasible method for helping physicians to accurately and swiftly identify individual patients [4]. Nonetheless, several problems should be resolved beforehand an effective medicinal DSS could be and deployed developed that includes decision making in the existence of imprecision and uncertainty [5].
FS is extremely helpful in the fields of healthcare and medical data analysis [6]. In medicinal data sets, features usually describe the susceptibility to particular diseases. Feature is the medical data or some symptoms that are interconnected to the specific disease condition. In fields such as screening, diagnosis, prognosis, and so on. The decision-making process is performed by the machine learning (ML) related classification method. Several kinds of research [7] have described the efficacy of this algorithm to forecast diseases includes hepatitis, hepatocellular carcinoma cancer, cardiovascular, and so on. Besides, the researches have highlighted that machine learning and data mining algorithm plays the most important role in identifying hidden patterns and in disease diagnosis over distinct diseases, where the diseases could be forecasted at an early stage, also it tries to minimize the treatment cost and time.
Feature selection (FS) techniques are categorized as semi-supervised, supervised, and unsupervised models based on the absence or presence of classes [8]. Supervised FS methods include wrapper, embedded, and filter techniques. Filter models don’t utilize classification [9]. These techniques evaluate the consequence of features by observing the inherent property of the information. In the study, each feature is ranked and scored according to the statistical condition. Computation Intelligence method includes fuzzy logic (FL), artificial neural network (ANN), and genetic algorithm (GA) is inspired study subject because they could handle composite engineering problem that is hard to describe using traditional approaches [10]. In the Computational Intelligence community hybrid approach has received significant interest. The more commonly known methods are the hybridization amongst GA and Fuzzy Logic (FL) which results in genetic fuzzy system (GFS). Fundamentally, GFS is an augmented fuzzy system that consists of genetic programming, evolutionary strategy, and GA amongst evolutionary algorithm (EA) through a learning procedure acquired from GA and evolutionary computations.
This article introduces a novel feature subset selection with artificial intelligence based classification model for biomedical data (FSS-AICBD) technique. The FSS-AICBD technique undergoes min-max normalization technique to prevent data complexity. In addition, the information gain (IG) approach is applied for the optimal selection of feature subsets. Also, group search optimizer (GSO) with deep belief network (DBN) model is utilized for biomedical data classification where the hyperparameters of the DBN model can be optimally tuned by the GSO algorithm. The choice of IG and GSO approaches results in promising medical data classification results. The experimental result analysis of the FSS-AICBD technique takes place using different benchmark healthcare datasets.
Dash [11] suggested a hybridized harmony search and Pareto optimization method for FS in higher dimension data classification issues. Initially, an adoptive harmony searching method for gene selection with possibility distribution factors for optimum gene ranking is carried out. Further, it can be advanced by a bi-objective Pareto based FS algorithm for selecting lower number of topmost ranked genes. In [12], a four-stage hybrid ensemble FS approach was presented. At first, the dataset is separated by the cross-validation process. Next, in the filter phase, different filter models based on weighted scores were ensembled for generating a feature ranking. Then, consecutive FS method is employed as a wrapper model for obtaining an optimum set of features. Lastly, the resultant set is processed for succeeding classification tasks.
In [13], proposed a rough set theory (RST) based on the heterogeneous EFS approach (R-HEFS) to select high relevant and lesser redundant characteristics at the aggregation time of various feature set through the feature-significance measures, feature-class and-feature rough dependence. In R-HEFS five innovative RST based filter methodologies have been applied as a base feature selector. Yang et al. [14] introduced an enhanced classification method for disease prediction based traditional Iterative Dichotomiser 3 (Id3) approach. The enhanced Id3 approach overcoming multiple value bias challenges when selecting split or test characteristics resolves the problem of numerical feature discretization and store the classification method employing rules through a heuristic approach for memory savings and easier understanding.
Mohapatra et al. [15] project two varieties of kernel ridge regression (KRR), such as radial basis kernel ridge regression (RKRR) and wavelet kernel ridge regression (WKRR) for classifying microarray medicinal databases. It consists of redundant and irrelevant genes that cause higher number of gene expressions that is smaller sample size and dimensionality. In order to resolve the curse of dimensionality of the microarray dataset, modified cat swarm optimization (MCSO), a nature stimulated evolutionary method is utilized for selecting the appropriate feature from the dataset. In [16], a memetic approach-based support vector machine (SVM) called M-SVM is introduced for concurrent FS and optimization of SVM parameters. The memetic approach is a fusion of local search method with global optimization framework and social engineering optimizer (SEO) with emperor penguin optimizer (EPO). The concept of SEO embedding in EPO is to optimize the exploitation ability of EPO.
This article has developed the FSS-AICBD technique that intends to derive a useful set of features and thereby improve the classifier results. Firstly, the FSS-AICBD technique undergoes min-max normalization technique to prevent data complexity. Secondly, the IG approach is applied for the optimal selection of feature subsets. Thirdly, GSA with DBN model is utilized for biomedical data classification where the hyperparameters of the DBN model can be optimally tuned by the GSO algorithm. Fig. 1 demonstrates the workflow of proposed method.
3.1 Data Normalization Process
At the initial stage, the input biomedical data are normalized in the range of [0,1] by the use of min-max normalization approach. It offers several benefits such as avoiding features in high numeric values by handling the low numeric values and preventing complications at the time of processing. Besides, the scaling of the attribute values helps to considerably boost the classification performance of the DBN model.
where
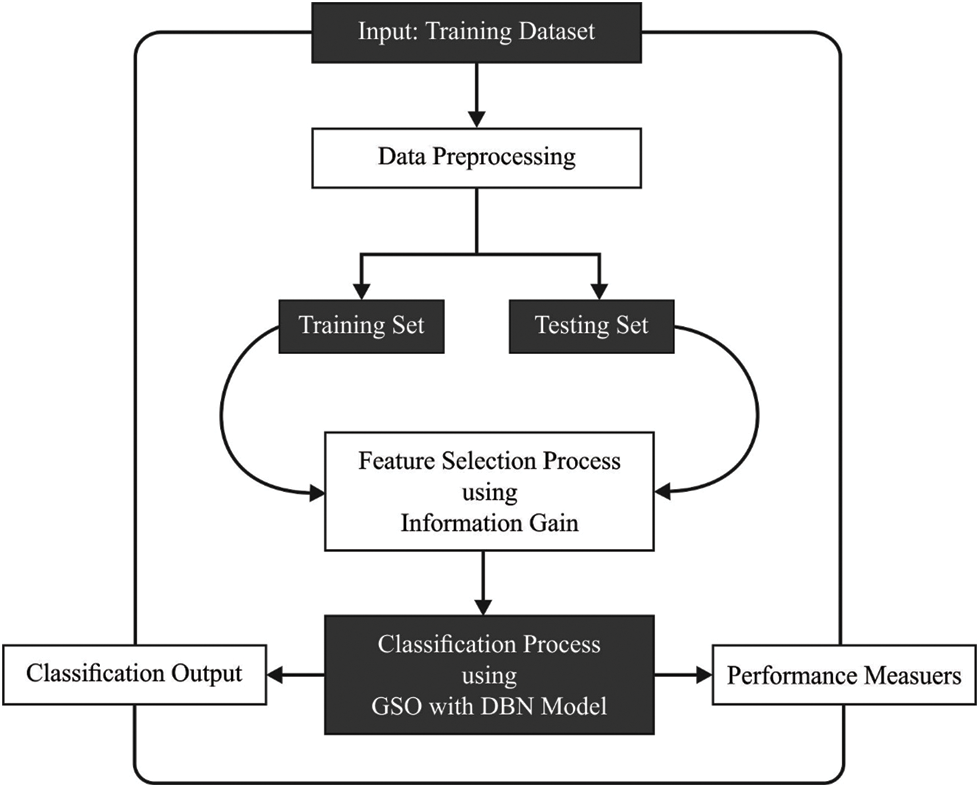
Figure 1: Workflow of proposed model
3.2 Information Gain Based Feature Selection Process
Next to the data normalization process, the IG based FS technique gets executed to choose optimal feature subsets. The IG [17] is generally utilized on higher dimension data for evaluating the efficiency of attributes from classifier. An IG based FS procedures the worth of attribute by computing the IG of attribute in terms of target class variable. Specifically, IG calculates the count data needed for predicting the objective class variable with knowledge of the presence/absence of attributes.
Assume that distinct arbitrary variables y have 2 feasible resultants. The binary entropy function H, stated in Shannon unit, for instance, logarithmic base 2 has demonstrated as Eq. (2), where
During the procedure of decision making, entropy quantifies the uncertainty of all attributes. The predictable data required for classifying instance y dependent upon separating by a has been estimated as provided in Eq. (3).
Specifically, the IG to attribute (a) is provided in Eq. (4), in which marginal entropy was demonstrated as
3.3 DBN Based Classification Process
During the classification task, the chosen features are passed into the DBN model [17] to classify the medical data. The DBN is a kind of DL model, which comprises of s number of restricted Boltzmann machine (RBM) and backpropagation neural network (BPNN) [17] that utilizes an unsupervised greedy learning model for adjusting the link weight of every RBM layer and supervised learning process for optimizing the network variables. Every RBM model comprises a visible layer
Consider
where
where
where
3.4 GSO Algorithm Based Hyperparameter Tuning Process
Finally, the hyperparameter tuning of the DBN model takes place via the GSO algorithm [18,19]. The GSO technique was implemented by utilizing a group of candidate agents (population) that is called a group, and all the agents are called members [18]. During the obtainable investigation space (
As 3 dimensions, when
• The producer is examined at zero and after examine together with stochastic testing 3 places from the checking place: One case at zero rates:
One point from the right hand faction hypercube
One point from the left hand faction hypercube
where
• The producers then work for obtaining the near optimum place with near optimum FF. When the optimum place is a FF value than their novel place, afterward it travels near this place. Otherwise, it is delayed in their place and directs their caption to distinct arbitrarily generate place.
• When the producer could not attain an optimum search space then
In all iterations, many group agents were selected as scroungers. The scrounger is enduring searching to optimum fitness for meeting the fitness function (FF) defined as producer. During the GSO technique, space copying, which is one of the famous scrounging performances from sparrow was utilized [20]. At the
where
and continues to novel place as:
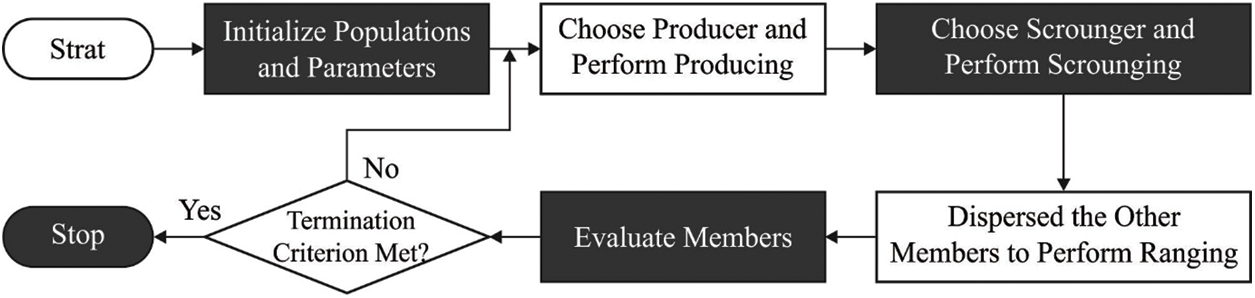
Figure 2: Flowchart of GSO Algorithm
For enhancing the chance of determining the maximized resources (FF), animals utilize several techniques for limiting their exploration to successful patches. One vital technique was altering the subsequent as to piece if their termination was detection. This technique was executed by GSO technique for controlling the restricted exploration region: If the agent is far on the exploration region, it is returned near the feasible exploration region by ordering the value which disrupted bounds to their past preference.
The GSO algorithm determines a FF for attaining enhanced classifier results. It computes a positive number representing the enhanced outcomes of the candidate solution. Here, the FF can be treated as a way of minimizing the classification error rate, as defined below. The solution with minimum error value can be treated as optimum solution and the poor solution is the one that achieves a maximum error rate.
The performance validation of the FSS-AICBD technique is carried out using three benchmark datasets namely Leukemia, Colon tumor, and ovarian cancer [20–22]. The first leukaemia dataset has 7129 features with 72 samples. The second colon tumor dataset has 2000 features with 62 samples. Thirdly, the ovarian cancer dataset has 15154 features with 253 samples. Tab. 1 and Fig. 3 provide the FS results of the proposed IG with the existing correlation based FS (CFS) technique under various iterations on leukaemia dataset.
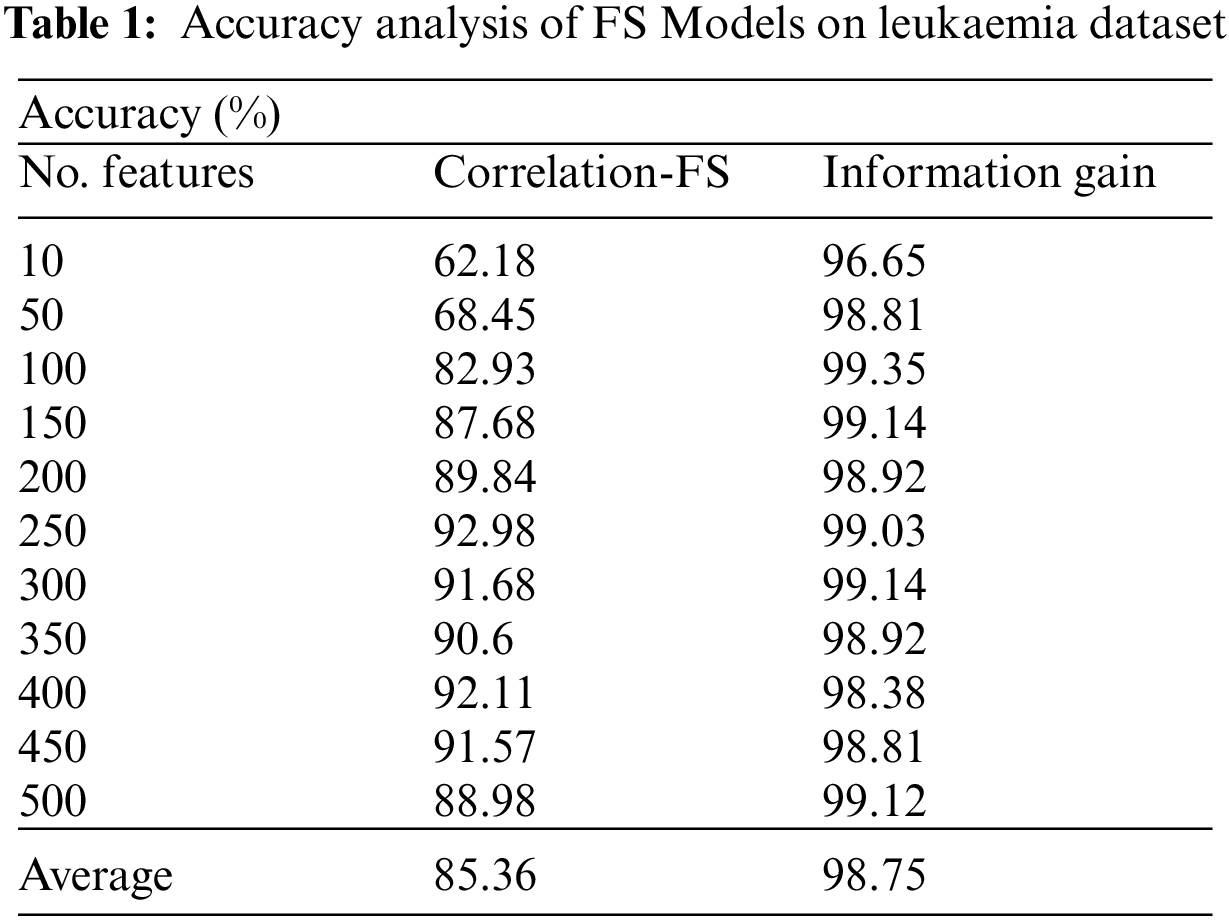
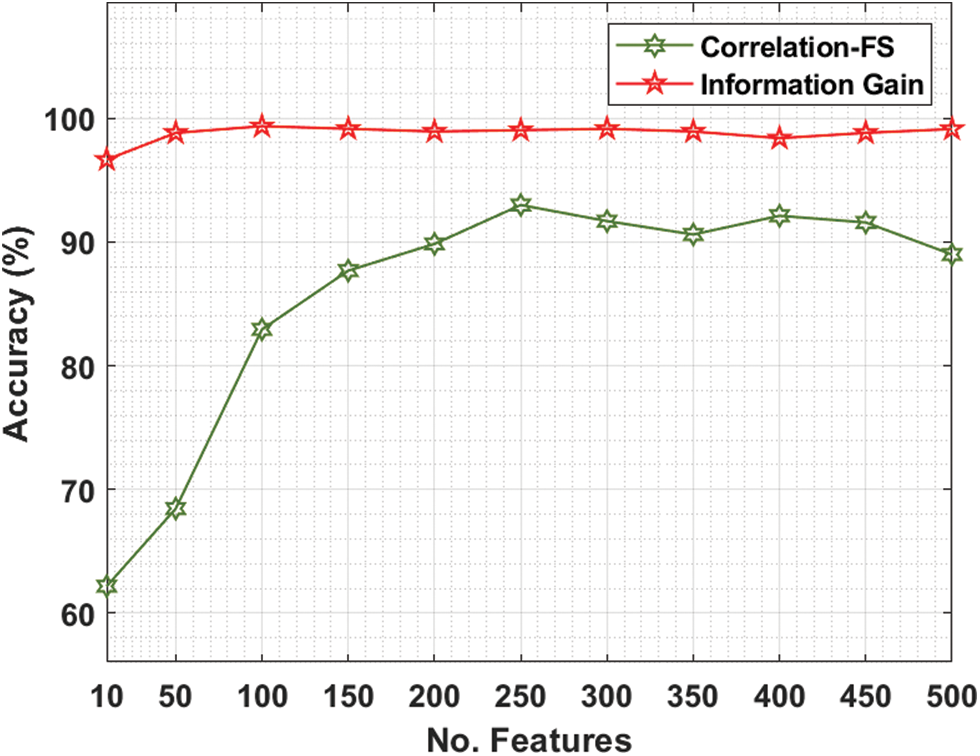
Figure 3: Comparative accuracy analysis of FS Models on leukaemia dataset
For instance, with 10 features, the IG technique has obtained higher accuracy of 96.65% whereas the CFS technique has attained lower accuracy of 62.18%. Similarly, with 100 features, the IG technique has achieved increased accuracy of 99.35% whereas the CFS technique has resulted in reduced accuracy of 82.93%. Likewise, with 200 features, the IG technique has gained improved accuracy of 98.92% whereas the CFS technique has accomplished decreased accuracy of 89.84%. Also, with 400 features, the IG technique has offered superior accuracy of 98.81% whereas the CFS technique has resulted in inferior accuracy of 91.57%.
Fig. 4 offers the comparative analysis of the FSS-AICBD with recent models [16] under leukaemia dataset. The results show that the FSS-AICBD technique has outperformed the other methods under all iterations. For instance, with 10 iterations, the FSS-AICBD technique has offered higher accuracy of 96.73% whereas the PSO-SVM, EPO-SVM, and M-SVM techniques have provided lower accuracy of 87.12%, 94.03%, and 94.93% respectively. Eventually, with 50 iterations, the FSS-AICBD technique has gained improved accuracy of 99.68% whereas the PSO-SVM, EPO-SVM, and M-SVM techniques have resulted in reduced accuracy of 95.26%, 96.04%, and 98.86% respectively. Lastly, with 100 iterations, the FSS-AICBD technique has depicted maximum accuracy of 99.68% whereas the PSO-SVM, EPO-SVM, and M-SVM techniques have exhibited minimum accuracy of 95.22%, 96%, and 98.86% respectively.
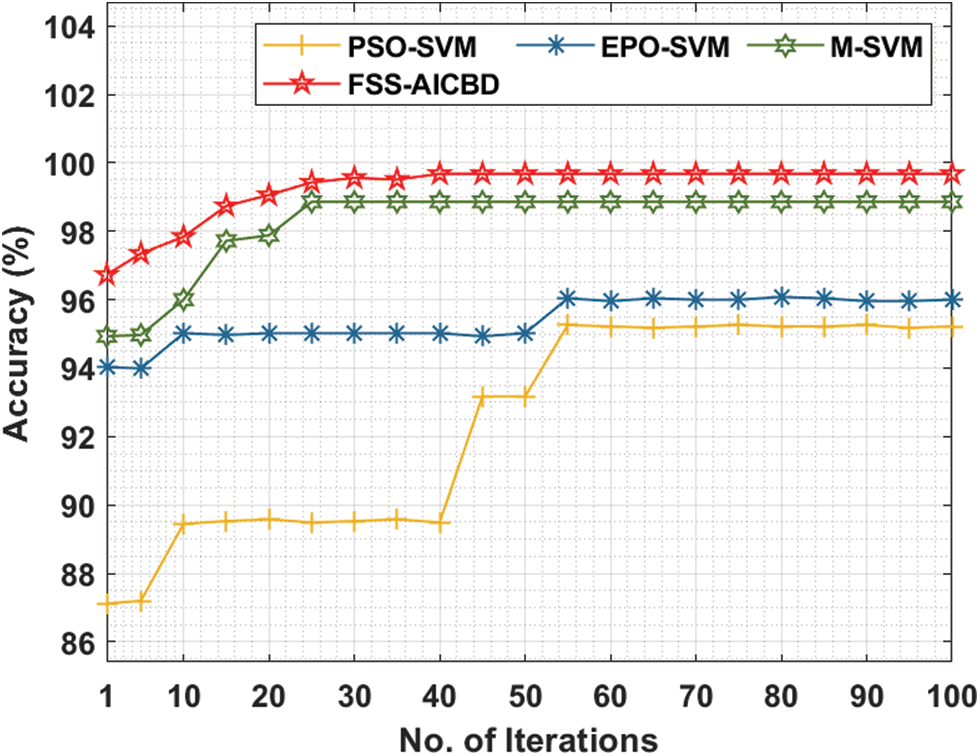
Figure 4: Accuracy analysis of FSS-AICBD with recent methods on leukaemia dataset
Tab. 2 and Fig. 5 offer the FS results of the presented IG with CFS technique under various features on colon tumor dataset. For instance, with 10 features, the IG technique has provided increased accuracy of 96.00% whereas the CFS technique has achieved reduced accuracy of 66.66%. Along with that, with 100 features, the IG technique has reached maximum accuracy of 96.06% whereas the CFS technique has gained minimum accuracy of 75.92%. In line with, with 200 features, the IG technique has resulted in enhanced accuracy of 96.59% whereas the CFS technique has provided decreased accuracy of 79.68%. Eventually, with 400 features, the IG technique has offered greater accuracy of 96.24% whereas the CFS technique has resulted in lesser accuracy of 82.36%.
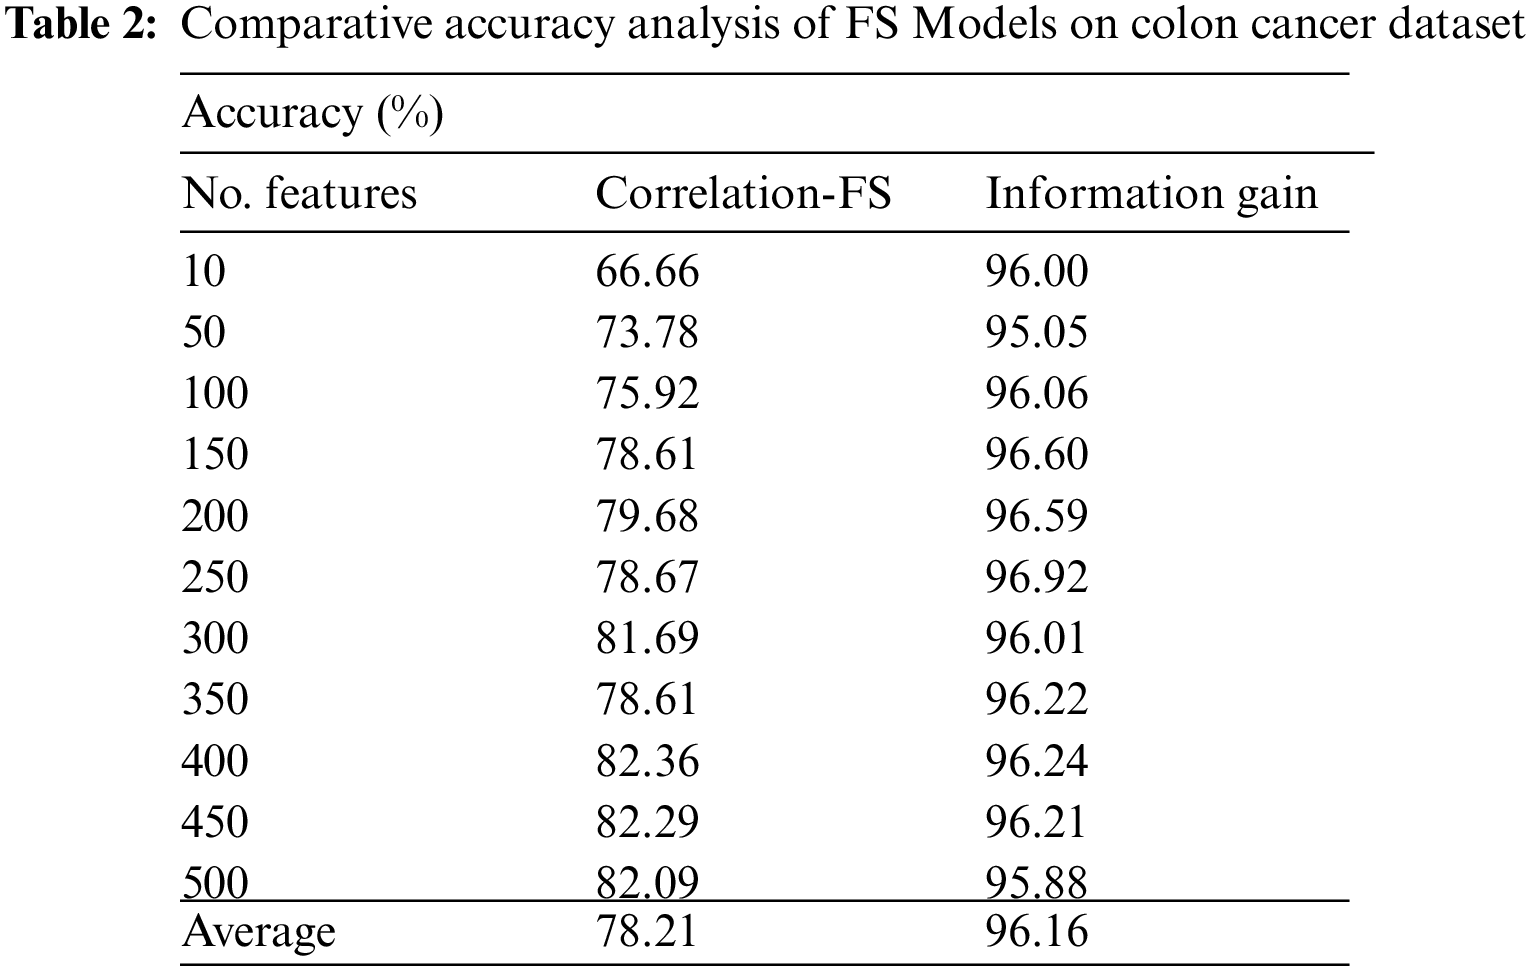
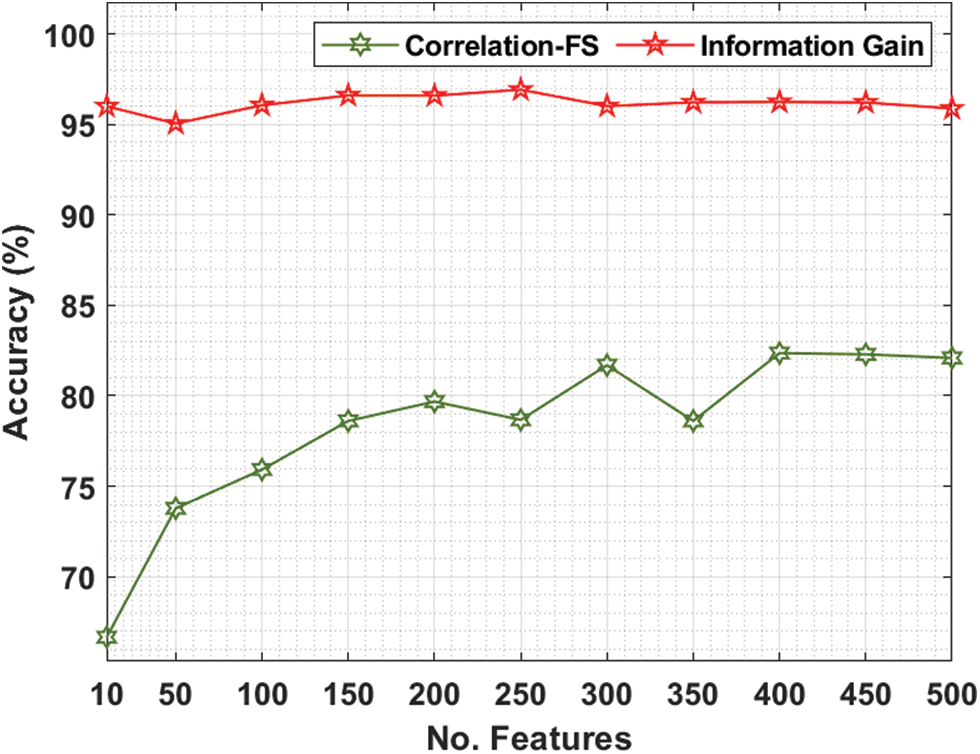
Figure 5: Accuracy analysis of FS Models on colon cancer dataset
Fig. 6 provides the comparative analysis of the FSS-AICBD with existing methods under colon cancer dataset. The outcomes demonstrated that the FSS-AICBD approach has outperformed the other techniques under all iterations. For instance, with 10 iterations, the FSS-AICBD system has offered increased accuracy of 98.99% whereas the PSO-SVM, EPO-SVM, and M-SVM approaches have provided lower accuracy of 88.12%, 90.15%, and 97.45% respectively. At the same time, with 50 iterations, the FSS-AICBD method has reached higher accuracy of 99.68% whereas the PSO-SVM, EPO-SVM, and M-SVM techniques have resulted in reduced accuracy of 92.50%, 94.73%, and 98.83% correspondingly. At last, with 100 iterations, the FSS-AICBD technique has depicted maximum accuracy of 99.68% whereas the PSO-SVM, EPO-SVM, and M-SVM methodologies have demonstrated minimal accuracy of 92.50%, 94.73%, and 98.83% correspondingly.
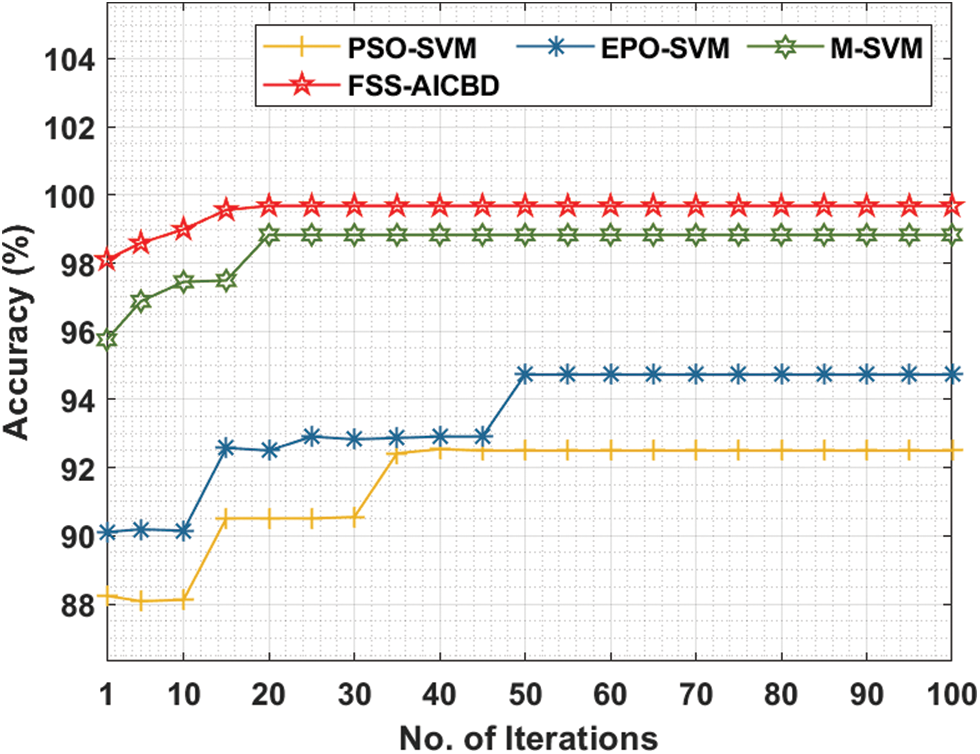
Figure 6: Comparative accuracy analysis of FS Models on colon cancer dataset
Tab. 3 and Fig. 7 offer the FS results of the proposed IG with existing CFS technique under various iterations under Ovarian cancer dataset. For instance, with 10 features, the IG technique has gotten greater accuracy of 98.54% whereas the CFS technique has reached lower accuracy of 95.56%. In the same way, with 100 features, the IG technique has realized increased accuracy of 99.98% whereas the CFS technique has resulted in compact accuracy of 97.35%. Meanwhile, with 200 features, the IG technique has extended improved accuracy of 99.99% whereas the CFS technique has accomplished decreased accuracy of 97.28%. Furthermore, with 400 features, the IG technique has offered superior accuracy of 99.94% whereas the CFS technique has resulted in inferior accuracy of 97.28%.
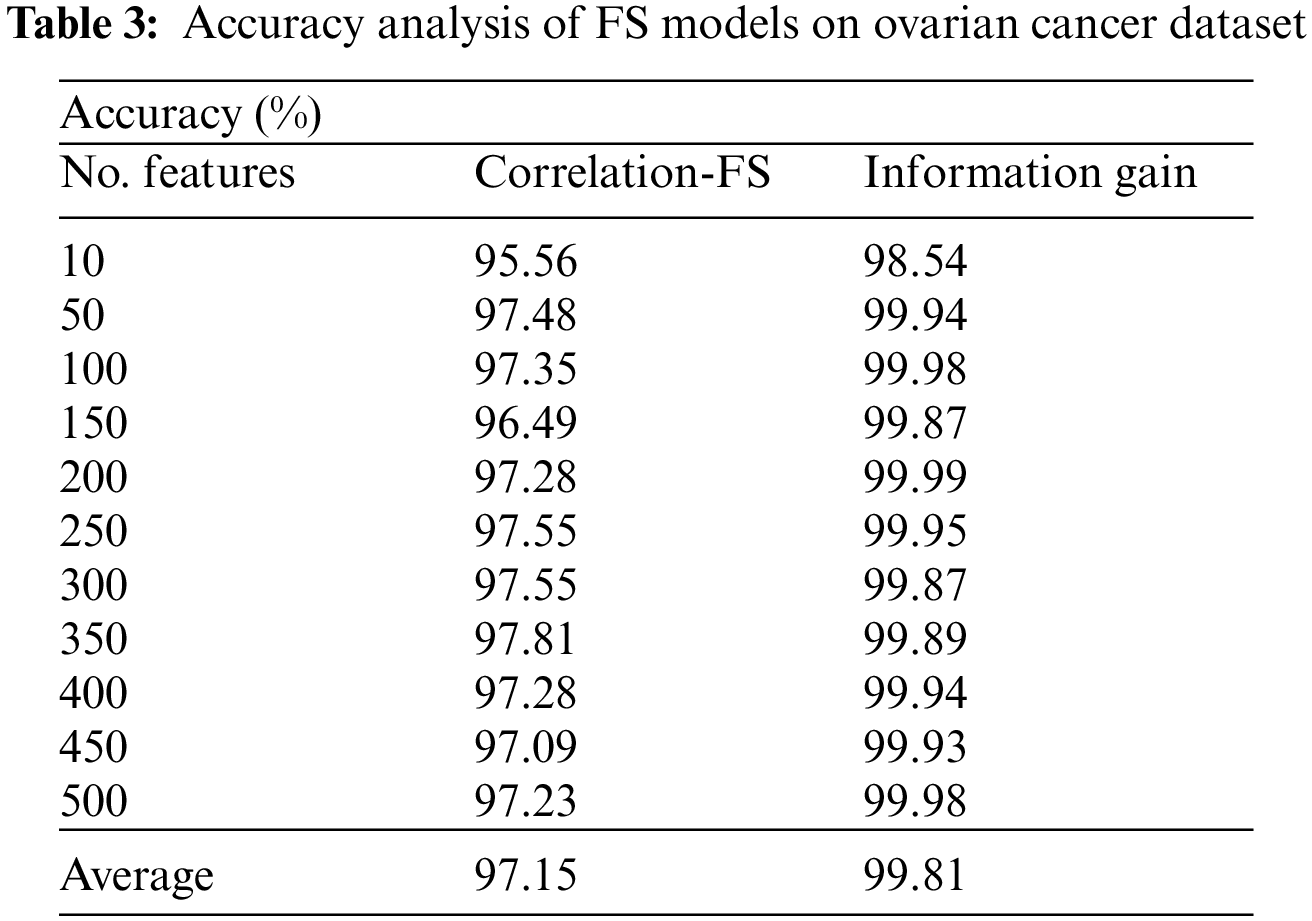
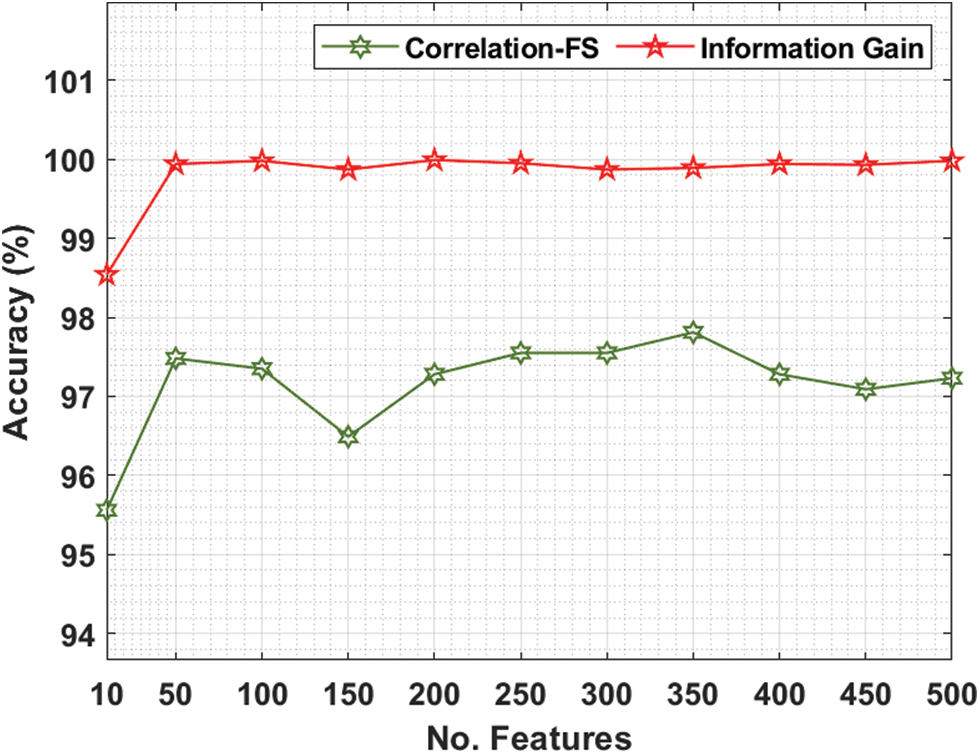
Figure 7: Comparative accuracy analysis of FS Models on ovarian cancer dataset
Fig. 8 gives the comparative analysis of the FSS-AICBD with recent algorithms under ovarian cancer dataset. The outcomes exhibited that the FSS-AICBD technique has showcased the other techniques under all iterations.
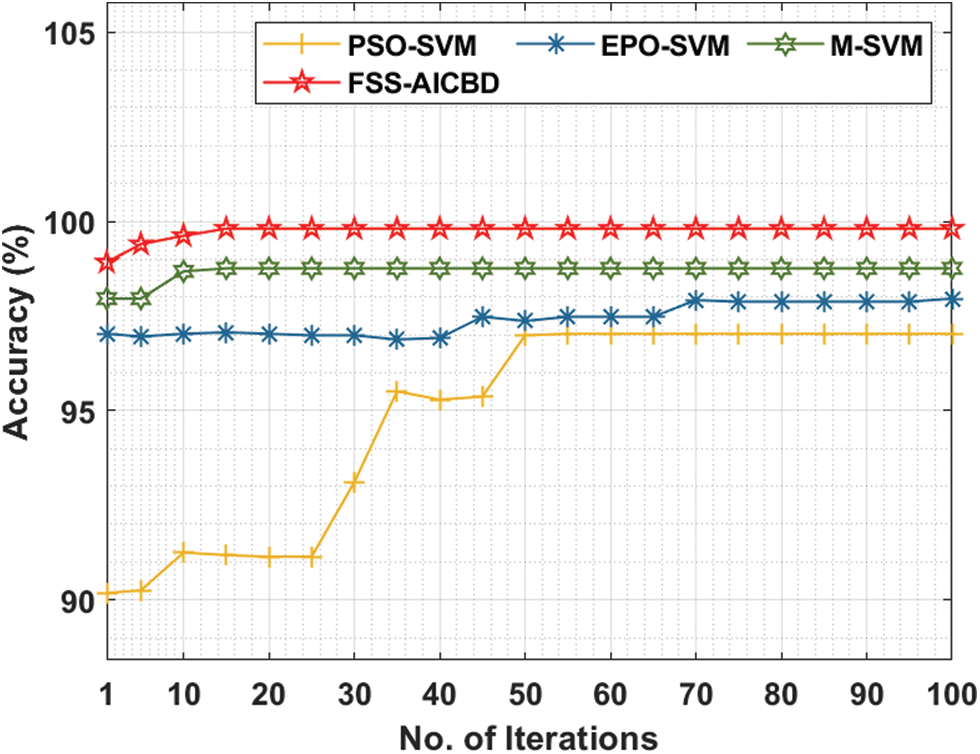
Figure 8: Accuracy analysis of FSS-AICBD with recent methods on ovarian cancer dataset
For instance, with 10 iterations, the FSS-AICBD technique has obtainable higher accuracy of 99.62% whereas the PSO-SVM, EPO-SVM, and M-SVM techniques have provided lower accuracy of 91.25%, 97.03%, and 98.68% correspondingly. Followed by, with 50 iterations, the FSS-AICBD approach has gained enhanced accuracy of 99.81% whereas the PSO-SVM, EPO-SVM, and M-SVM methodologies have resulted to lower accuracy of 96.99%, 97.37%, and 98.76% correspondingly. Finally, with 100 iterations, the FSS-AICBD technique has depicted increased accuracy of 99.81% whereas the PSO-SVM, EPO-SVM, and M-SVM systems have demonstrated reduced accuracy of 97.03%, 97.96%, and 98.76% correspondingly.
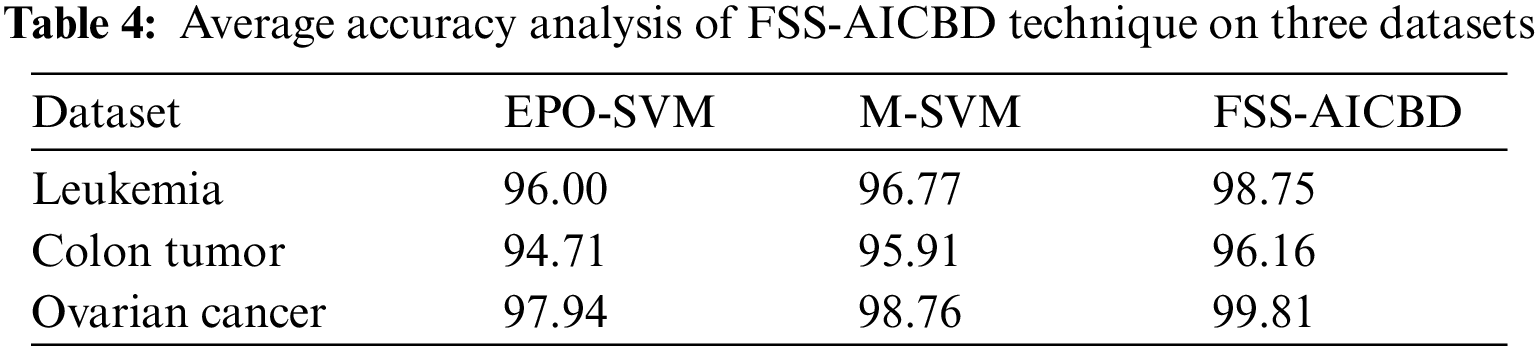
Tab. 4 portrays the average accuracy analysis of the FSS-AICBD technique with recent methods on three test datasets. The results revealed that the FSS-AICBD technique has obtained increasing values of average accuracy compared to other techniques. For instance, on Leukemia dataset, the FSS-AICBD technique has reached higher average accuracy of 98.75% whereas the EPO-SVM and M-SVM techniques have accomplished lower average accuracy of 96% and 96.77% respectively. Likewise, on Ovarian Cancer dataset, the FSS-AICBD technique has obtained increased average accuracy of 97.94% whereas the EPO-SVM and M-SVM techniques have attained reduced average accuracy of 98.76% and 99.81% respectively.
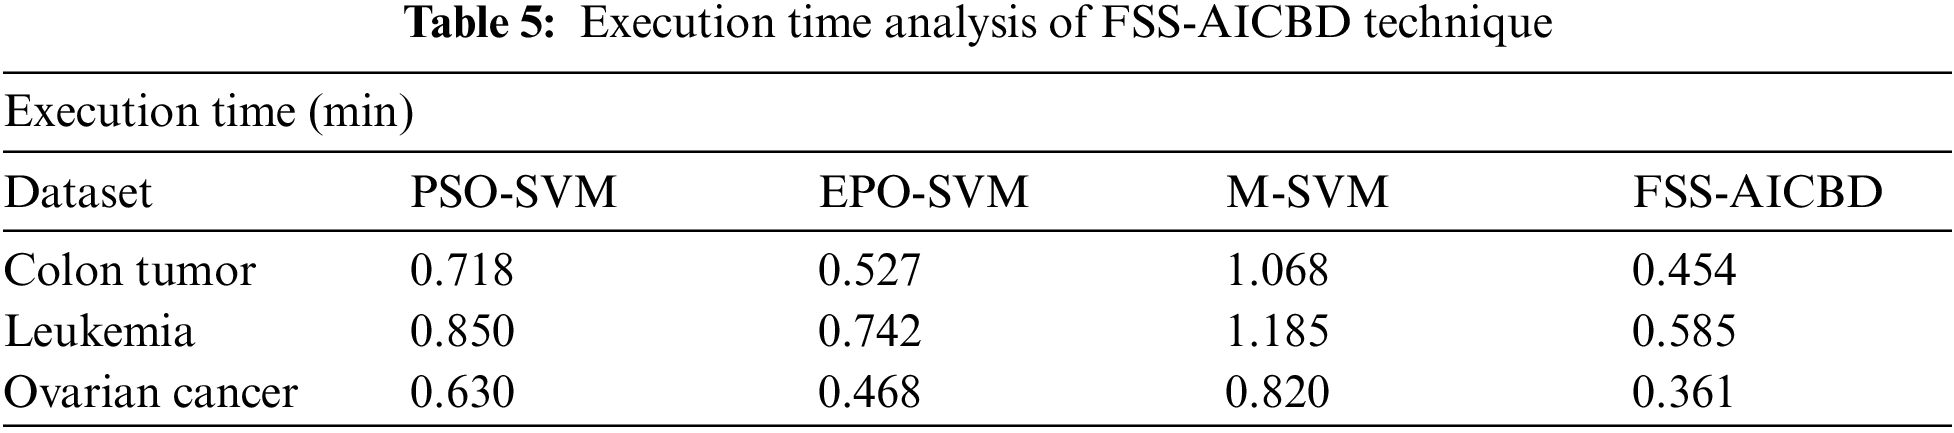
Finally, the ET analysis of the FSS-AICBD technique with existing techniques on three test datasets is offered in Tab. 5. The results revealed that the FSS-AICBD technique has reached effective outcomes with the least ET values. For instance, on Leukemia dataset, the FSS-AICBD technique has obtained reduced ET of 0.454 min whereas the PSO-SVM, EPO-SVM, and M-SVM techniques have resulted to increased ET of 0.718 min, 0.527 min, and 1.068 min respectively. Furthermore, on Ovarian Cancer dataset, the FSS-AICBD technique has accomplished minimum ET of 0.361 min whereas the PSO-SVM, EPO-SVM, and M-SVM techniques have attained maximum ET of 0.630 min, 0.468 min, and 0.820 min respectively. By looking into the abovementioned tables and figures, it is ensured that the FSS-AICBD technique has resulted in enhanced performance on all the test datasets.
This article has developed the FSS-AICBD technique that intends to derive a useful set of features and thereby improve the classifier results. Primarily, the FSS-AICBD technique undergoes min-max normalization technique to prevent data complexity. Besides, the IG approach is applied for the optimal selection of feature subsets. Moreover, GSA with DBN model is utilized for biomedical data classification where the hyperparameters of the DBN model can be optimally tuned by the GSO algorithm. The choice of IG and GSO approaches results in promising medical data classification results. The experimental result analysis of the FSS-AICBD technique takes place using different benchmark healthcare datasets. The simulation results reported the enhanced outcomes of the FSS-AICBD technique interms of several measures. As a part of future scope, the metaheuristic based dimensionality reduction approach can be involved to increase the classifier accuracy.
Funding Statement: The authors extend their appreciation to the Deanship of Scientific Research at King Khalid University for funding this work under grant number (RGP 2/180/43). Taif University Researchers Supporting Project number (TURSP-2020/346), Taif University, Taif, Saudi Arabia. The authors would like to thank the Deanship of Scientific Research at Umm Al-Qura University for supporting this work by Grant Code: 22UQU4340237DSR02.
Conflicts of Interest: The authors declare that they have no conflicts of interest to report regarding the present study.
1. S. K. Baliarsingh, S. Vipsita, K. Muhammad, B. Dash and S. Bakshi, “Analysis of high-dimensional genomic data employing a novel bio-inspired algorithm,” Applied Soft Computing, vol. 77, pp. 520–532, 2019. [Google Scholar]
2. M. Dashtban and M. Balafar, “Gene selection for microarray cancer classification using a new evolutionary method employing artificial intelligence concepts,” Genomics, vol. 109, no. 2, pp. 91–107, 2017. [Google Scholar]
3. A. Yang, X. Jiang, L. Shu and J. Lin, “Bayesian variable selection with sparse and correlation priors for high-dimensional data analysis,” Computational Statistics, vol. 32, no. 1, pp. 127–143, 2017. [Google Scholar]
4. J. Apolloni, G. Leguizamón and E. Alba, “Two hybrid wrapper-filter feature selection algorithms applied to high-dimensional microarray experiments,” Applied Soft Computing, vol. 38, pp. 922–932, 2016. [Google Scholar]
5. E. M. F. El Houby, “A survey on applying machine learning techniques for management of diseases,” Journal of Applied Biomedicine, vol. 16, no. 3, pp. 165–174, 2018. [Google Scholar]
6. X. R. Zhang, W. F. Zhang, W. Sun, X. M. Sun and S. K. Jha, “A robust 3-D medical watermarking based on wavelet transform for data protection,” Computer Systems Science & Engineering, vol. 41, no. 3, pp. 1043–1056, 2022. [Google Scholar]
7. X. R. Zhang, X. Sun, X. M. Sun, W. Sun and S. K. Jha, “Robust reversible audio watermarking scheme for telemedicine and privacy protection,” Computers, Materials & Continua, vol. 71, no. 2, pp. 3035–3050, 2022. [Google Scholar]
8. N. Singh and P. Singh, “Rule based approach for prediction of chronic kidney disease: A comparative study,” Biomedical and Pharmacology Journal, vol. 10, no. 2, pp. 867–874, 2017. [Google Scholar]
9. V. B. Canedo, N. S. Maroño and A. A. Betanzos, “Distributed feature selection: An application to microarray data classification,” Applied Soft Computing, vol. 30, pp. 136–150, 2015. [Google Scholar]
10. Z. Y. Algamal and M. H. Lee, “A Two-stage sparse logistic regression for optimal gene selection in high-dimensional microarray data classification,” Advances in Data Analysis and Classification, vol. 13, no. 3, pp. 753–771, 2019. [Google Scholar]
11. R. Dash, “An adaptive harmony search approach for gene selection and classification of high dimensional medical data,” Journal of King Saud University - Computer and Information Sciences, vol. 33, no. 2, pp. 195–207, 2021. [Google Scholar]
12. N. Singh and P. Singh, “A hybrid ensemble-filter wrapper feature selection approach for medical data classification,” Chemometrics and Intelligent Laboratory Systems, vol. 217, pp. 104396, 2021. [Google Scholar]
13. R. K. Bania and A. Halder, “R-HEFS: Rough set based heterogeneous ensemble feature selection method for medical data classification,” Artificial Intelligence in Medicine, vol. 114, pp. 102049, 2021. [Google Scholar]
14. S. Yang, J. Z. Guo and J. W. Jin, “An improved Id3 algorithm for medical data classification,” Computers & Electrical Engineering, vol. 65, pp. 474–487, 2018. [Google Scholar]
15. P. Mohapatra, S. Chakravarty and P. K. Dash, “Microarray medical data classification using kernel ridge regression and modified cat swarm optimization based gene selection system,” Swarm and Evolutionary Computation, vol. 28, pp. 144–160, 2016. [Google Scholar]
16. S. K. Baliarsingh, W. Ding, S. Vipsita and S. Bakshi, “A memetic algorithm using emperor penguin and social engineering optimization for medical data classification,” Applied Soft Computing, vol. 85, pp. 105773, 2019. [Google Scholar]
17. D. Gao, Y. Wang, X. Zheng and Q. Yang, “A fault warning method for electric vehicle charging process based on adaptive deep belief network,” World Electric Vehicle Journal, vol. 12, no. 4, pp. 265, 2021. [Google Scholar]
18. S. He, Q. H. Wu and J. R. Saunders, “Group search optimizer: An optimization algorithm inspired by animal searching behavior,” IEEE Transactions on Evolutionary Computation, vol. 13, no. 5, pp. 973–990, 2009. [Google Scholar]
19. L. Abualigah, “Group search optimizer: A nature-inspired meta-heuristic optimization algorithm with its results, variants, and applications,” Neural Computing and Applications, vol. 33, no. 7, pp. 2949–2972, 2021. [Google Scholar]
20. T. R. Golub, D. K. Slonim, P. Tamayo, C. Huard, M. Gaasenbeek et al., “Molecular classification of cancer: Class discovery and class prediction by gene expression monitoring,” Science, vol. 286, no. 5439, pp. 531–537, 1999. [Google Scholar]
21. U. Alon, N. Barkai, D. A. Notterman, K. Gish, S. Y. Barra et al., “Broad patterns of gene expression revealed by clustering analysis of tumor and normal colon tissues probed by oligonucleotide arrays,” Proceedings of the National Academy of Sciences, vol. 96, no. 12, pp. 6745–6750, 1999. [Google Scholar]
22. E. F. Petricoin, A. M. Ardekani, B. A. Hitt, P. J. Levine, V. A. Fusaro et al., “Use of proteomic patterns in serum to identify ovarian cancer,” The Lancet, vol. 359, no. 9306, pp. 572–577, 2002. [Google Scholar]
 | This work is licensed under a Creative Commons Attribution 4.0 International License, which permits unrestricted use, distribution, and reproduction in any medium, provided the original work is properly cited. |