DOI:10.32604/cmc.2022.027611
| Computers, Materials & Continua DOI:10.32604/cmc.2022.027611 | |
| Article |
Wheat Breeding Strategies under Climate Change based on CERES-Wheat Model
1College of Hydrology and Water Resources, Hohai University, Nanjing, 210098, China
2State Key Laboratory of Hydrology-Water Resources and Hydraulic Engineering, Hohai University, Nanjing, 210098, China
3College of Agricultural Science and Engineering, Hohai University, Nanjing, 210098, China
4Institute of Rural Water Conservancy, Jiangxi Academy of Hydro Science, Nanchang, 330029, China
5State Key Laboratory of Hydrology-Water Resources and Hydraulic Engineering, Nanjing Hydraulic Research Institute, Nanjing, 210029, China
6International Agricultural Research and Training Center, Ministry of Agriculture and Forestry, Izmir, 35660, Republic of Turkey
*Corresponding Author: Jintao Cui. Email: cuiluojun@163.com
Received: 21 January 2022; Accepted: 30 March 2022
Abstract: Climate change has inevitably had a negative impact on agricultural production and food security. Crop breeding improvement is an efficient option to adapt to future climate and increase grain production. To study the potential to provide valuable advice for breeding under climate change condition, the crop growth model was used as basis to investigate, the effects of the cultivar genotype parameters of the crop estimation through resource and environment synthesis-wheat (CERES-Wheat) model on yield under different climate scenarios. In this study, solar radiation had a positive effect on the yield of winter wheat, while the effects of daily temperature change conditions on yield were vague, particularly under a change in daily maximum temperature. For the seven cultivar genotype parameters in the CERES-Wheat model, the yield had an approximately linear increasing relationship with kernel number (G1) and kernel size (G2). Vernalization days (P1V) had a fluctuating effect on winter yield without an evident unidirectional tendency. The yield of winter wheat increased with an increase in photoperiodic response (P1D) when P1D values varied from 64.81 to 79.81. Phyllochron interval (PHINT) had a positive impact on the yield of winter wheat. This study presented the potential benefits of the crop growth model to provide directional suggestions for crop breeding.
Keywords: DSSAT; genotype parameters; winter wheat; breeding; climate change
Global warming, an indisputable objective fact, has become a hot issue of universal concern in the 21st century [1–3]. According to the report of the Intergovernmental Panel on climate change (IPCC), the current global average surface temperature has increased by approximately 0.65°C–1.06°C compared with pre-industrialization levels, and it will probably reach 1.5°C between 2030 and 2052 [4,5]. As global climate changes, extreme weather disasters increases in frequency, intensity, and duration [6,7]. Agriculture is one of the most sensitive and vulnerable areas to climate change, and any degree of climate change will bring potential or significant threats to crop growth and agricultural production [8–10]. Therefore, national food security should be ensured by actively coping with challenges in agriculture resulting from climate change [11,12].
Wheat is one of the most important staple crops in China, with a perennial sowing area of over 24 million hm2 [13]. Huaibei Plain is one of the main wheat producing areas in China and plays a unique role in food security. This region is located at the boundary between the subtropical monsoon and temperature monsoon zones, and one of the most vulnerable regions to climate change [14]. Therefore, the influence of climate change on wheat growth and yield in this region should be studied. Numerous studies have shown that climate warming leads to a general shortening of wheat growth period, early green and mature stage, downward trend in grain yield, and average winter wheat yield reduction of 7%–8% [15–17]. In addition, the boundary of different cropping systems has shifted owing to climate warming, and the northern boundary of winter wheat planting has moved approximately15 km north compared with that in the 1960s [18]. To substantially utilize climate resources and mitigate the negative impact of climate change, numerous studies have attempted to adjust the planting dates of wheat, change wheat cultivars, and adopt efficient water and fertilizer management in the field. Furthermore, breeding new wheat varieties with high yield, high quality, and strong stress resistance is an effective method to cope with climate change [1,6,19,20]. However, breeding new varieties, often takes numerous cycles and costs substantial time and money. Moreover, complex interactions often exist between cultivar traits and the environment. Therefore, understanding the relationship between variety traits and meteorological factors and clarifying the direction of variety improvement under climate change are crucial in carrying out effective breeding [21].
Field experiments, statistical analysis and crop growth model simulation are commonly conducted to investigate the effects of climate change on crop growth [22]. However, field experiments can only analyze limited varieties or scenarios, resulting in considerable variability and extensive manpower and material resources, is time consuming, and expensive [23,24]. Statistical analysis is a relatively simple method to link crop yield and climate variables based on historical data, but it lacks mechanical analysis and cannot clearly reflect the response process of crops to climate change [25]. The crop growth model, is essentially a computer program, that can describe the process of crop growth and its relationship with the environment, involving complex biochemical processes, such as photosynthesis and respiration [22]. Numerous factors (i.e., meteorology, soil, management and crop varieties) are considered in simulating crop growth [26]. The crop growth model is considered a powerful tool in studying complex plant processes and their interactions under a changing environment [23]. Decision support system for agrotechnology transfer (DSSAT) has become one of the most widely used crop models in the world after over 40 years of development [26,27]. Numerous studies have shown that DSSAT is feasible in optimizing crop planting data, field irrigation, fertilization strategies, and even in exploring crop growth responses under climate or soil changes [24,28,29]. To the best of our knowledge, only a few studies to date have investigated the responses of winter wheat genotype to changes in climate factors based on the crop estimation through resource and environment synthesis-wheat (CERES-Wheat) model in the DSSAT model. Therefore, the potential of using crop growth models should be explored to provide directional suggestions for optimal breeding under climate change.
The overall aim of this study was to investigate the relationship between wheat cultivar character and climate factors. Specific objectives were to evaluate the effects of wheat cultivar parameters on phenology and yield index under climate change based on the DSSAT model, and identify the primary genotype parameter of wheat for different climate factors. This study may help us assess the potential for wheat breeding to mitigate the negative effect of climate change, and explore the breeding direction based on the crop model, which can guarantee wheat production and food security in the future.
The remainder of this paper is organized as follows. Section 2 introduces the experimental details and the CERES-Wheat model. Next, Section 3 demonstrates the simulation results of this study. Section 4 discusses the research results in detail. Lastly, Section 5 presents the conclusions.
Experiments were conducted at the Lianshui water conservancy scientific research station, in Huai’an, Jiangsu Province, China (33°50′ N, 119°16′ E), from October 2016 to July 2017. The study area has a subtropical, humid climate with an annual mean temperature of 14.4°C, annual evaporation of 1,385.4 mm, sunshine duration of 2,280 h, and average frost-free period of 240 d. Precipitation varies substantially between different years and seasons, and the mean annual precipitation was approximately 979.1 mm, concentrated in the summer and autumn. Soil at the site is loamy clay for the top 0–30 cm soil layer with soil bulk density of 1.42 g/cm3, field capacity of 27.9%, soil organic matter of 2.20%, total nitrogen of 0.98 g/kg, and total phosphorus of 1.12 g/kg.
Winter wheat seed (cultivar huaimai 11) was sown on October 15, 2016, with row spacing of15 cm, sowing depth of 5 cm, and sowing density of 400 grains/m2. Urea was uniformly used as basal fertilizer applied at a rate of 250 kg/hm2 when turning deeply before sowing. During the growth period of winter wheat, weeding and pest control were carried out in time, and other agronomic management measures were consistent with local customs.
CERES-Wheat is one of the wheat growth simulation models, embedded in the DSSAT software package (https://dssat.net/). The model simulates the wheat growth and development process from planting to maturity. The effects of weather, variety, soil, and management measures, such as irrigation and fertilization, are all considered during the growth period. The simulation was based on the crop growth process and involved light interception and photosynthesis dynamics, nutrient absorption and root activity dynamics, dry matter distribution, water absorption and transpiration, growth and respiration, leaf area growth, development, and organ formation. Thus, this model can describe the physiological process of wheat response to soil and environmental conditions. The four sets of model input data when the CERES-Wheat model was used in DSSAT were meteorological data, crop cultivar genotype, soil data and management information. The minimum weather data input includes the daily solar radiation (Rad), the daily minimum and maximum air temperature (Tmax and Tmin, respectively), and daily precipitation. Crop parameters and physiological characteristics are given in the form of genetic coefficient, which describes the physiological processes of each crop variety. The CERES-Wheat has seven cultivar genotype parameters: vernalization days (P1V), photoperiodic response (P1D), grain filling phase (P5), kernel number (G1), kernel size (G2), tiller dry weight (G3), and phyllochron interval (PHINT). Specific definitions of the cultivar parameters are shown in Tab. 1. Soil data input is given as soil characteristic parameters to describe the physical, chemical, and morphological characteristics of the soil surface and layers. The crop management information includes planting density, row spacing, planting depth, planting date, irrigation, fertilization, and application of organic modifiers.
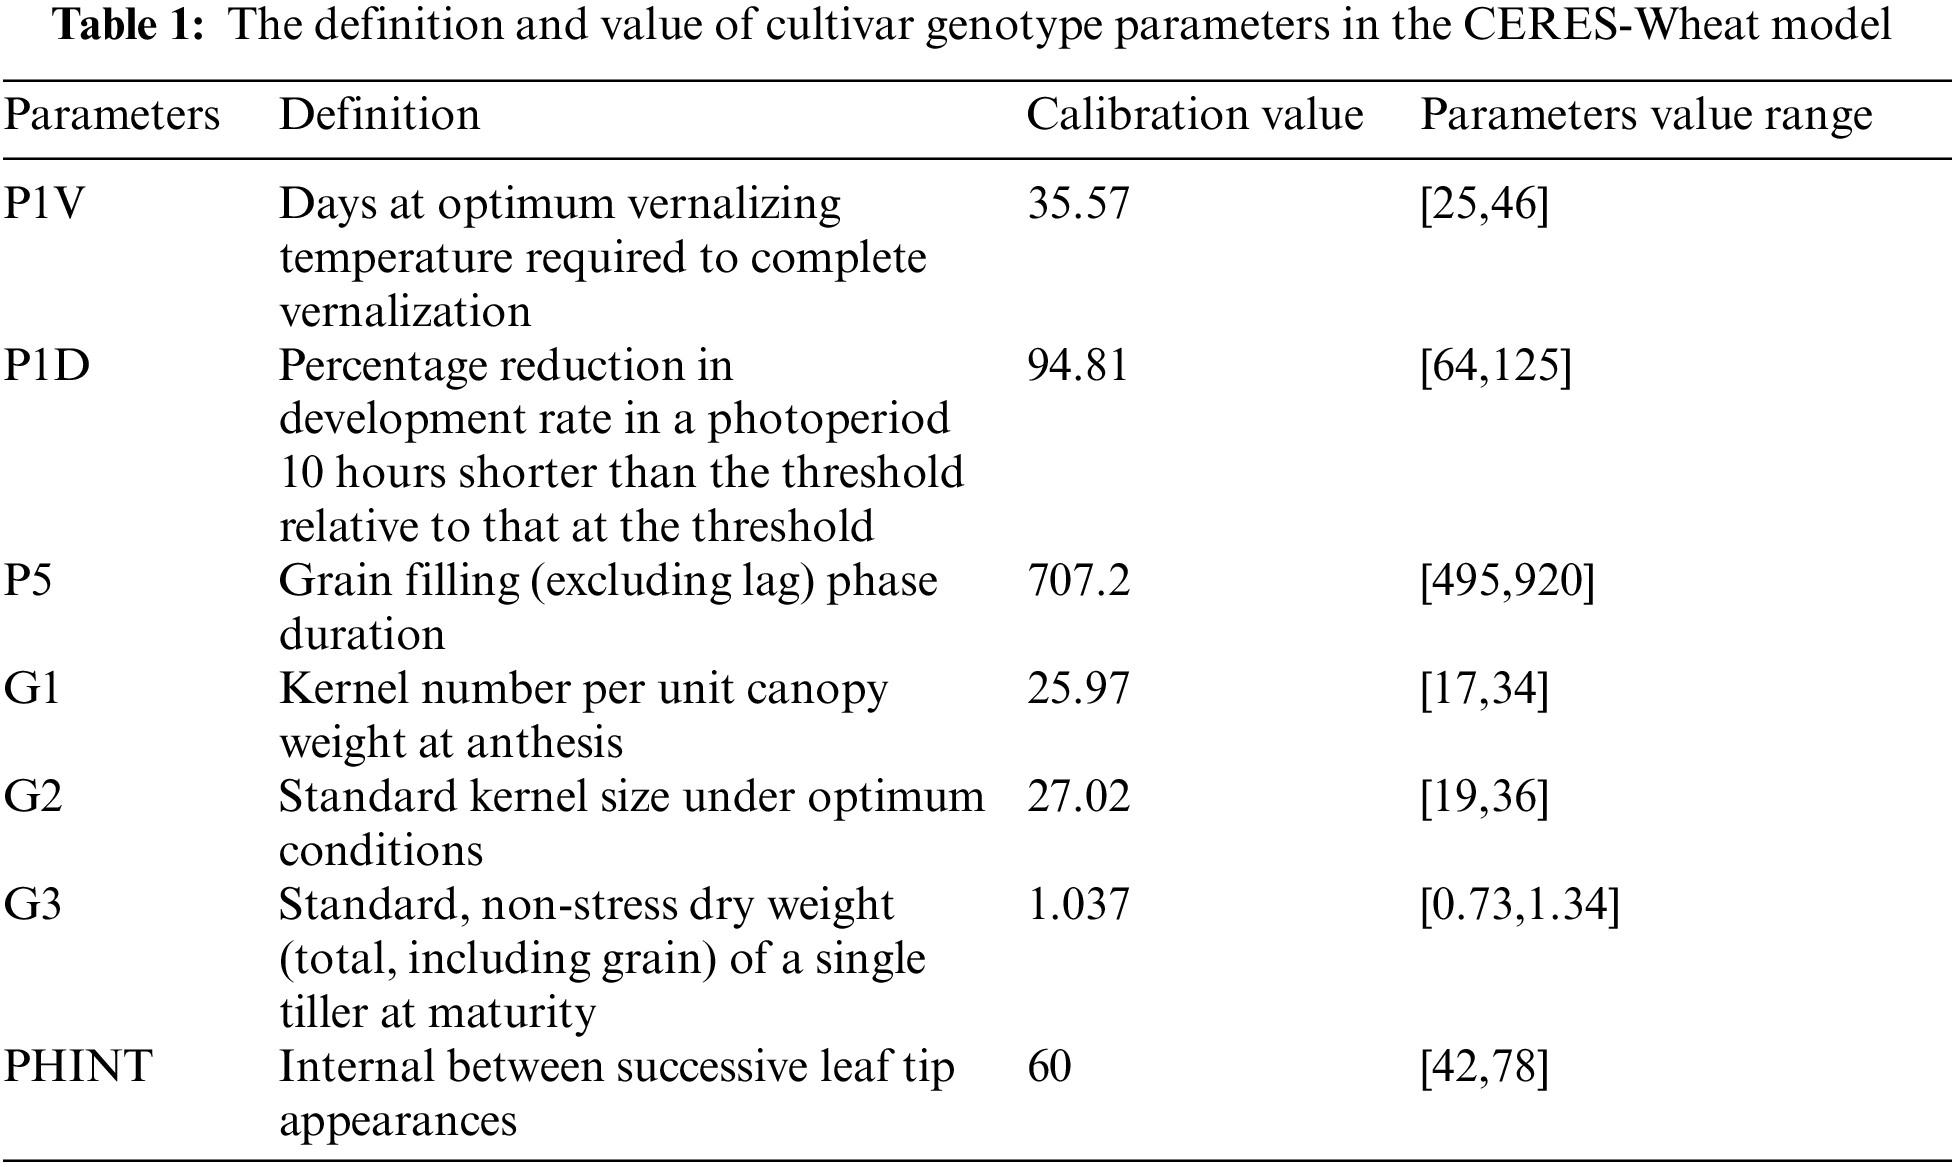
In this study, the weather data required by the model were obtained from the Huai’an station of the China Meteorological data network (Http://data.cma.cn). The solar radiation was calculated according to the number of hours of sunshine using Angstrom’s method [24,30]. The daily temperature, solar radiation and precipitation during winter wheat growth were shown in Fig. 1. The soil input data were obtained from the soil analysis in the experiment field and the default soil data of the same soil type in the model. The plant and management information from the observation records and investigations of the experiment. The cultivar genotype parameters of winter wheat were obtained from the reference [14], which provided the parameters calibration and verification for the huaimai 11 (Tab. 1).
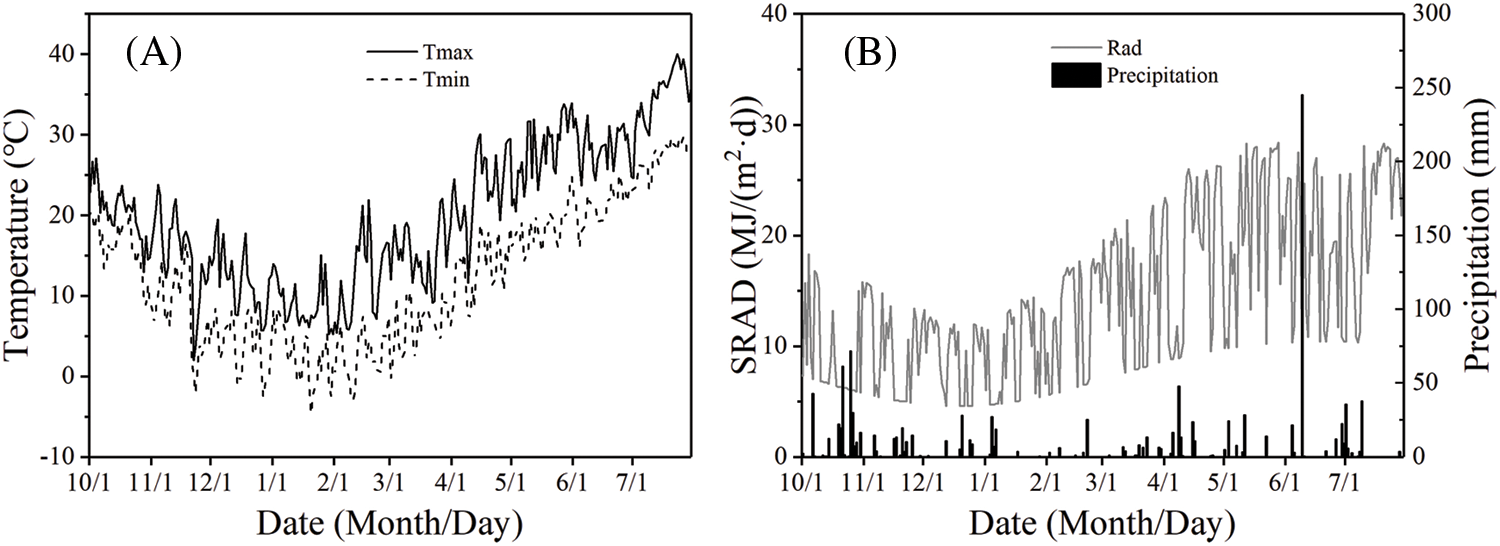
Figure 1: Average daily (A) maximum and minimum temperature (Tmax and Tmin) and (B) soil radiation (Rad) and precipitation in the winter wheat field from October 2016 to July 2017
In this study, the meteorological elements in the growing season of winter wheat from 2016 to 2017 were taken as the baseline. Simulation scenarios for climate change includes daily solar radiation intensity changes (×0.8, ×0.9, ×1.0, ×1.1, ×1.2), daily maximum temperature changes (−0.5°C, +0°C, +0.5°C, +1.0°C, +1.5°C, +2.0°C), daily minimum temperature changes (−2.0°C, −1.5°C, −1.0°C, −0.5°C, +0°C, +0.5°C), and maximum and minimum temperature change with the same daily difference in temperature (−2.0°C, −1.0°C, +0°C, +1.0°C, +2.0°C). The variation range of cultivar parameters was shown in Tab.1. All parameters take five values in the parameter value range according to the equal difference sequence, and form the cultivar parameter set required for the simulation of the model together with other unchanged parameters. Yield at harvest maturity (HWAM) of winter wheat was studied for different cultivar under different climate scenarios.
The yield of winter wheat for all genotype parameters sets increased with an increase in solar radiation intensity (Fig. 2). With an increase in P1V, wheat yield showed a trend of initially reducing, increasing, and reducing thereafter, but the fluctuation range did not exceed 5% (Fig. 2A). Yields of winter wheat were the lowest and highest with a P1V of 30.57 and 40.57, respectively. When P1D values varied from 64.81 to 79.81, wheat yield increased substantially, and the yield increase was more evident when the radiation intensity was lower than when higher (Fig. 2B). In the radiation intensity of the 0.8 × Rad scenario, yield increased by 36.2% with P1D of 79.81 compared with that with P1D of 64.81. When P1D values were between 79.81 and 124.81, the wheat yield fluctuated up and down (Fig. 2B). Yield of winter wheat fluctuated gradually with the P5 change, and the effect of increase was not notable (Fig. 2C). Wheat yield increased approximately linearly with an increase in G1, and fitting slope was higher when radiation intensity was high than low (Fig. 2D). Variation of winter wheat yield with G2 is similar to that of G1 (Fig. 2E). With an increase in G3, wheat yield showed a straight line close to the horizontal, indicating that wheat yield was hardly affected by a change in G3 (Fig. 2F). Under all solar radiation change scenarios, yield of winter wheat showed an increasing trend with an increase in PHINT. Winter wheat yield increased by an average of 4.5% when the value of PHINT increased from 42 to 78 (Fig. 2G).
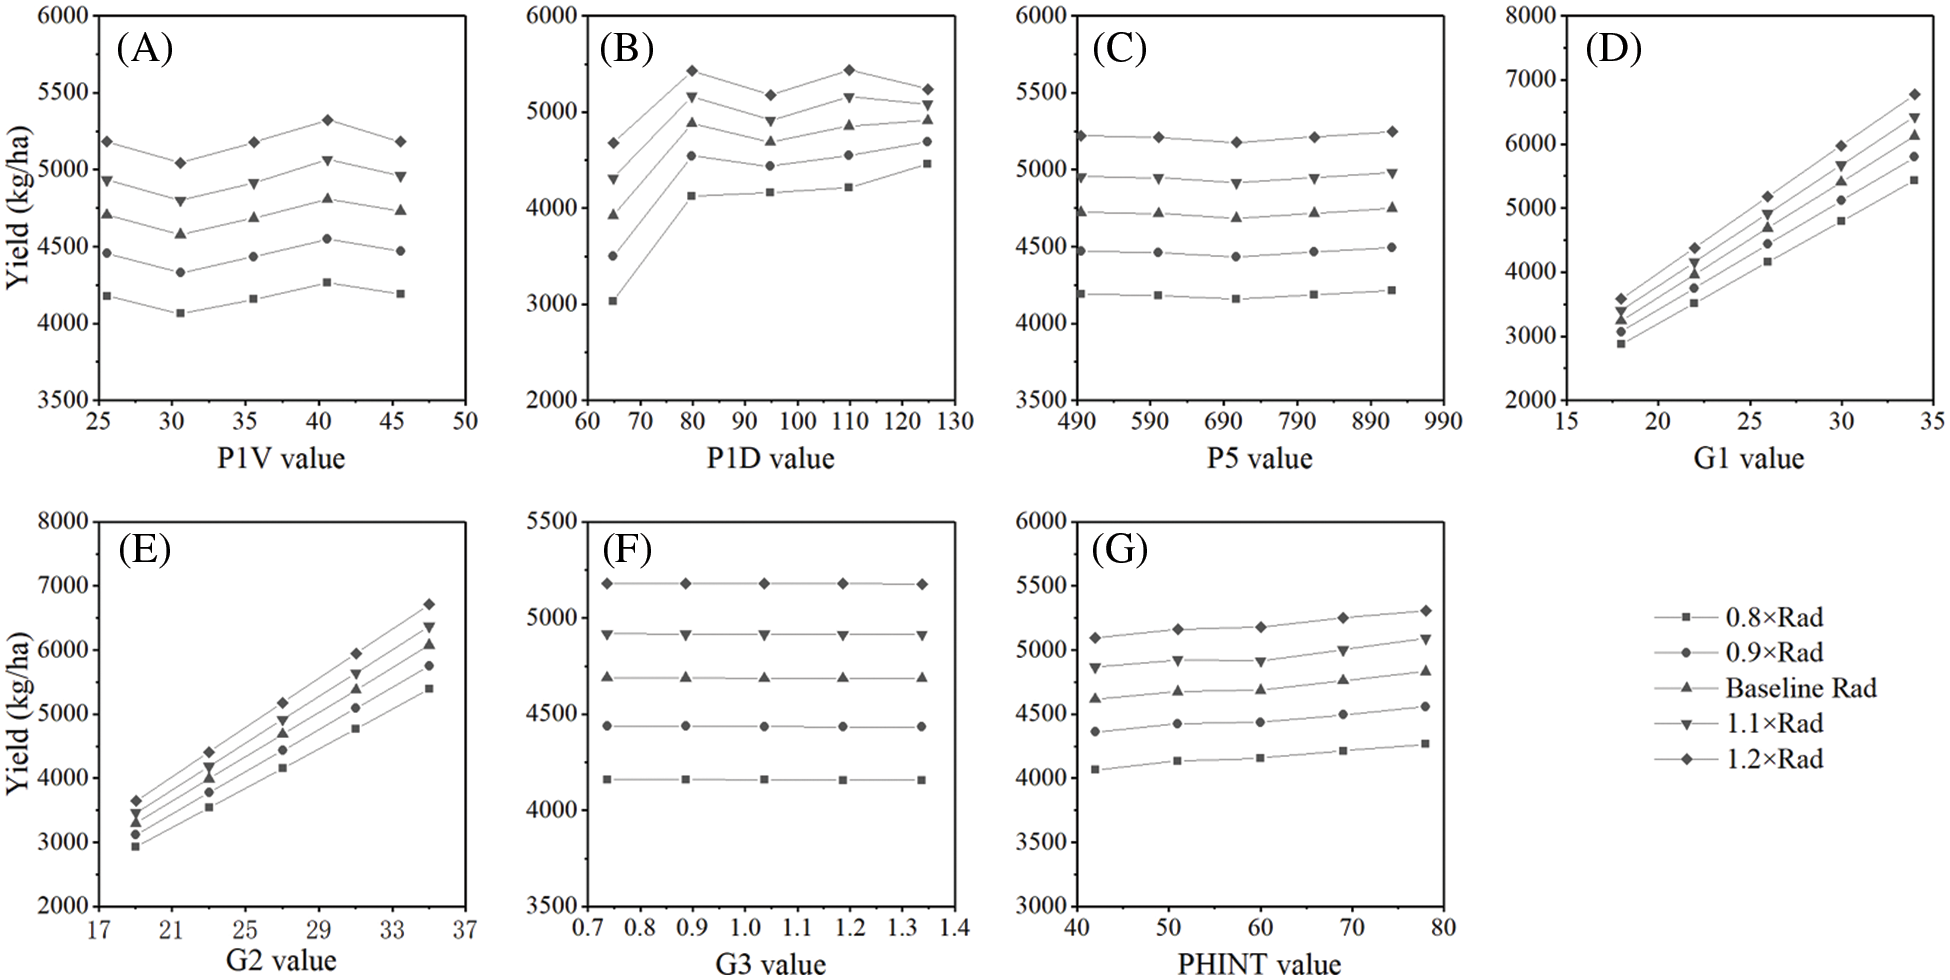
Figure 2: The yield of winter wheat for different cultivar genotypes under daily solar radiation (Rad) change condition
3.2 Daily Maximum Temperature Change
The simulations of winter wheat yield with different cultivar genotypes under different daily maximum temperatures were present in Fig. 3. The yield of wheat fluctuated between 4577 kg/ha and 4982 kg/ha when P1V value increased from 25.57 to 45.57, and the yield of winter wheat did not increase continuously with an increase in daily maximum temperature (Fig. 3A). Under the Tmax + 1.5°C condition, the yield of winter wheat was highest with a PIV of 35.57, reaching 4982 kg/ha. Similar to the change in winter wheat yield for different solar radiations, the yield of winter wheat increased evidently, particularly under the condition of Tmax + 2°C. Yield of winter wheat increased by 46.3%, from 3107 kg/ha to 4544 kg/ha, when the value of P1D changed between 64.81 and 79.81 (Fig. 3B). Yield of winter wheat decreased with an increase in Tmax, and yield decreased by 26.4% in Tmax – 0.5°C compared with that in Tmax + 2°C. However, the yield had minimal fluctuations under different climate scenarios and remained at a high level with a P1D of 124.81. For the effect of the P5 value change, an increase in winter wheat yield was evident in Tmax + 2°C, when P5 value increased from 495.2 to 601.2. Meanwhile, fluctuations did not exceed 4% under other conditions (Fig. 3C). The effects of G1 and G2 on winter wheat yield increased approximately linearly, similar to the results under solar radiation condition (Figs. 3D and 3E). With an increase in G3, wheat yield showed a straight line close to the horizontal, indicating that yield was hardly affected by the change in G3 (Fig. 3F). Under the change in Tmax, winter wheat yield showed an increasing trend with an increase in PHINT, especially in the Tmax + 1.5°C (Fig. 3G). Yield of winter wheat decreased at Tmax + 0.5 and Tmax + 1.0 with the same G3 or PHINT, compared with the baseline Tmax.
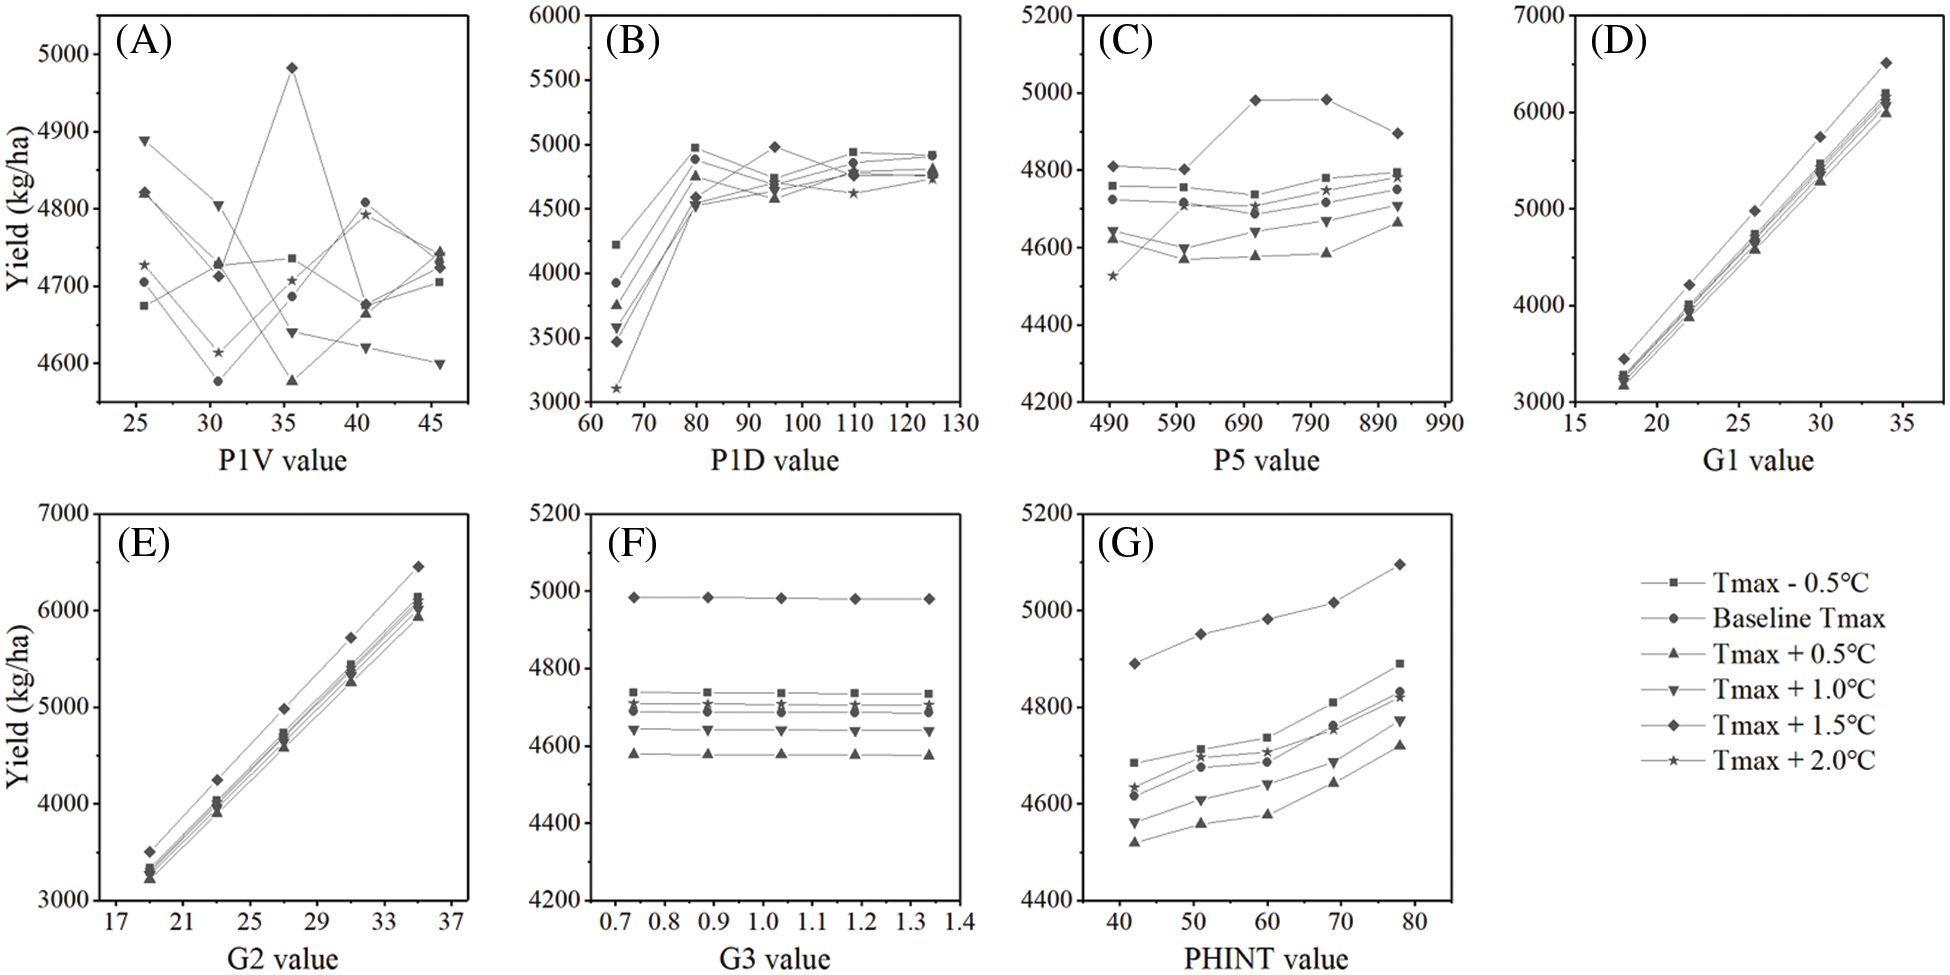
Figure 3: The yield of winter wheat for different cultivar genotypes under daily maximum temperature (Tmax) change condition
3.3 Daily Minimum Temperature Change
For the same cultivar genotypes, the yield of winter wheat generally increased with a decrease in Tmin (Fig. 4). With an increase in P1V, the yield of winter wheat did not increase or decrease exclusively under different Tmin changes (Fig. 4A). When P1V was 35.57, the yield of winter wheat was more sensitive to Tmin change than that of other conditions. When P1D values varied from 64.81 to 79.81, wheat yield increased with an increase in P1D (Fig. 4B). Although the yield would fluctuate after P1D exceeded 79.81, sensitivity to Tmin change would decrease. The wheat yield remained at a high level and fluctuation was small with a P1D of 124.81. A change in P5 value had minimal effect on yield of winter wheat, but a decrease in Tmin was generally conducive to an increase in winter wheat yield. Meanwhile, Tmin + 0.5°C decreased the yield of winter wheat by 157 kg/ha (Fig. 4C). Similar to the analysis results of radiation intensity change to the yield, the effects of G1 and G2 on winter wheat yield increased approximately linearly, and the increasing effect was superior under the condition of Tmin −2°C (Figs. 4D and 4E). Under the condition of Tmin change, wheat yield was hardly affected by G3 change (Fig. 4F). The winter wheat yield showed an increasing trend with an increase in PHINT, but the sensitivity to Tmin varied slightly (Fig. 4G).
Figure 4: The yield of winter wheat for different cultivar genotypes under daily minimum temperature (Tmin) change condition
3.4 Daily Maximum and Minimum Temperature Change
The yield of winter wheat increased with a decrease in Tmax and Tmin for the same cultivar (Fig. 5). Under the Tmax −2°C and Tmin −2°C conditions, the yield of winter wheat decreased with an increase in P1V. Under other conditions, the yield fluctuated slightly (Fig. 5A). When P1D values varied from 64.81 to 79.81, yield increased substantially, except for Tmax −2°C and Tmin −2°C, which showed a decreasing trend (Fig. 5B). When P1D was between 94.81 and 124.81, yield variation of winter wheat was small, thereby indicating that adaptability to climate change was good. Similar to the variation pattern of wheat yield under other climate scenarios, fluctuation range of yield with P5 was mild (Fig. 5C). Wheat yield increased linearly with an increase in G1 and G2, under the Tmax and Tmin change conditions (Figs. 5D and 5E). Winter wheat yield was nearly unaffected by G3 change but mainly affected by temperature change (Fig. 5F). Wheat yield increased slightly with an increase in PHINT, but the degree of yield variation also increased (Fig. 5G).
Figure 5: The yield of winter wheat for different cultivar genotypes under daily difference of temperature change condition
As global demand for food continues to increase, sustainable production of staple crops, such as wheat, has remained a challenge, particularly under climate change [8,9]. Crop production should adapt to future climate change by cultivating crop varieties with strong stress resistance [6]. The crop growth model, which comprehensively considers the complex interaction of crop variety, management, and environmental factors, compensates for the shortcomings of traditional breeding [24]. In this study, the CERES-Wheat model was used as an example to study the yield changes of different wheat cultivars under climate change based on the seven genotypic parameters involved in the model. Given that each parameter representing the growth character of a type of winter wheat, the adaptability of winter wheat varieties to climate change can be indirectly reflected by studying the impact of parameters in the model on yield under different climate conditions. Thus, breeding research based on crop growth model was logically reasonable, which can provide directional opinions for breeding and accelerate the development of high-quality varieties.
Among the seven cultivar genotype parameters of the CERES-Wheat model, G1 and G2 are directly related to yield, representing the number of grains and grain size, respectively. Undoubtedly, wheat yield showed an approximately linear increasing trend with an increase in G1 and G2. The global sensitivity analysis of CERES-Wheat verified that G1 and G2 were sensitive parameters affecting wheat yield [31]. In the field experiment, thousand-grain weight and grain number were also important factors for yield [32,33]. P1V is a parameter related to the vernalization of winter wheat, and the growth and development of winter wheat are calculated in the form of accumulated temperature in the model [27]. Therefore, the correlation between P1V and solar radiation intensity was not high in this study, but wheat yield changes significantly under the scenario of temperature change. The main reason was after vernalization, winter wheat began rapid vegetative growth and subsequent reproductive growth during these phases, wheat was markedly sensitive to temperature. P1D reflects the sensitivity of winter wheat to photoperiod between the emergence and spike differentiation stages, indicating a delayed proportion of lower than the critical day length to development. Vegetative and reproductive growth coexist between emergence and spike differentiation of winter wheat, which mainly completes flower induction and formation [31]. The vegetative growth phase was increased by improving the sensitivity of winter wheat to photoperiod, resulting in an increase in aboveground dry matter accumulation. In the CERES-Wheat model, the duration of grain filling has minimal effect on yield, possibly because P5 mainly affected the maturity stage, and the effect on yield was mainly through interaction with other parameters [31,34]. However, the length of the grain filling phase was important to the formation of yield in the field. When wheat was subjected to various abiotic stresses, it will often shorten the filling time to early mature, resulting in the yield reduction [35,36]. G3 had minimal effect on yield, which was consistent with the results of the sensitivity analysis [31]. PHINT represented the accumulated temperature required for winter wheat to complete the growth of a leaf, thereby improving the growth cycle of leaves and increasing the production of dry matter. The parameter sensitivity analysis of the CERES-Wheat model showed that the contribution of PHINT to the variance of yield change reached 24.2% [34].
Although the process-based crop growth model considered a series of complex physiological and biochemical reactions of crop growth and development in the simulation, these reactions were expressed by different functions that have uncertainties. In addition, there were numerous models to simulate climate change in the future, and each meteorological factor was interrelated with other factors rather than being independent. Moreover, it is not considered the effects of simultaneously changing at least two cultivar genotype parameters, nor the parameters involving other physiological processes rather than cultivar genotype parameters. For any cultivar, field management, such as changing planting dates, irrigation and fertilization systems, could also relatively alleviate climate change stress. Further studies are necessary to establish the optimal approach for breeding based on the crop growth model. Although there were still numerous limitations, the conclusion of this study can reach a consensus that the crop growth model could provide a scientific suggestion for efficient breeding.
The winter wheat was affected by climate change, and the yield was increased with an increase in solar radiation, while the yield increased with a decrease in daily minimum temperature. In the CERES-Wheat model, the winter wheat yield had an approximately linear increasing relationship with the cultivar genotype parameters G1 and G2 under all climate change scenarios. The P1V affected the fluctuation of winter yield, but there was no evident change trend. The winter wheat yield increased with an increase in P1D, in particular, P1D values varied from 64.81 to 79.81. The parameters P5 and G3 had minimal effects on the yield. The yield increased with an increase in PHINT, but the improvement of adaptation to climate change was limited. Although further studies are necessary in mechanistic simulation of crop model and diverse climate change model, this study confirmed that the crop growth model is a potentially powerful tool to provide scientific advice for crop breeding.
Acknowledgement: This research was supported by the National Nature & Science Foundation of China (No. 51879072 and No. 41961124006), the Fundamental Research Funds for the Central Universities (B210202013), Jiangsu postdoctoral research support program, and the project of the Priority Academic Program Development of Jiangsu Higher Education Institutions.
Funding Statement: This research was supported by the National Nature & Science Foundation of China (No. 51879072 and No. 41961124006), the Fundamental Research Funds for the Central Universities (B210202013), Jiangsu postdoctoral research support program, and the project of the Priority Academic Program Development of Jiangsu Higher Education Institutions.
Conflicts of Interest: The authors declare that they have no conflicts of interest to report regarding the present study.
1. A. J. Challinor, J. Watson, D. B. Lobell, S. M. Howden, D. R. Smith et al., “A meta-analysis of crop yield under climate change and adaptation,” Nature Climate Change, vol. 4, no. 4, pp. 287–291, 2014. [Google Scholar]
2. J. Knox, T. Hess, A. Daccache and T. Wheeler, “Climate change impacts on crop productivity in Africa and south Asia,” Environmental Research Letters, vol. 7, no. 0340323, pp. 034032, 2012. [Google Scholar]
3. M. Alzubade, O. Ozcan, N. Musaoglu and M. Turkes, “Observed impacts of climate variability on lulc in the mesopotamia region,” CMC-Computers Materials & Continua, vol. 67, no. 2, pp. 2255–2269, 2021. [Google Scholar]
4. H. Zhu, Z. Jiang and L. Li, “Projection of climate extremes in china, an incremental exercise from CMIP5 to CMIP6,” Science Bulletin, vol. 66, no. 24, pp. 2528–2537, 2021. [Google Scholar]
5. M. A. Haq, “CDLSTM: A novel model for climate change forecasting,” CMC-Computers Materials & Continua, vol. 71, no. 2, pp. 2363–2381, 2022. [Google Scholar]
6. C. Liu, L. Wang, K. Le Cocq, C. Chang, Z. Li et al., “Climate change and environmental impacts on and adaptation strategies for production in wheat-rice rotations in southern China,” Agricultural and Forest Meteorology, vol. 292, no. 1, pp. 108136, 2020. [Google Scholar]
7. D. Conway, E. A. van Garderen, D. Deryng, S. Dorling, T. Krueger et al., “Climate and southern Africa’s water-energy-food nexus,” Nature Climate Change, vol. 5, no. 9, pp. 837–846, 2015. [Google Scholar]
8. H. C. J. Godfray, J. R. Beddington, I. R. Crute, L. Haddad, D. Lawrence et al., “Food security: The challenge of feeding 9 billion people,” Science, vol. 327, no. 5967, pp. 812–818, 2010. [Google Scholar]
9. B. Bajzelj, K. S. Richards, J. M. Allwood, P. Smith, J. S. Dennis et al., “Importance of food-demand management for climate mitigation,” Nature Climate Change, vol. 4, no. 10, pp. 924–929, 2014. [Google Scholar]
10. H. Chen, J. He, W. Wang and X. Chen, “Simulation of maize drought degree in Xi'an city based on cusp catastrophe model,” Water Science and Engineering, vol. 14, no. 01, pp. 28–35, 2021. [Google Scholar]
11. L. Li, L. Sun, J. Guo, S. Li and P. Jiang, “Identification of crop diseases based on improved genetic algorithm and extreme learning machine,” CMC-Computers Materials & Continua, vol. 65, no. 1, pp. 761–775, 2020. [Google Scholar]
12. M. E. D. M. Omar, A. M. A. Moussa and R. Hinkelmann, “Impacts of climate change on water quantity, water salinity, food security, and socioeconomy in Egypt,” Water Science and Engineering, vol. 14, no. 1, pp. 17–27, 2021. [Google Scholar]
13. W. Yu and J. Yang, “Suitable planting region of high-quality wheat and future developing trend in Henan province,” Journal of China Agricultural University, vol. 26, no. 9, pp. 42–51, 2021. [Google Scholar]
14. G. Shao, Z. Wang, X. Wang, S. Tang and H. Yao, “Optimal irrigation schedule based on DSSAT model for winter wheat,” Transactions of the Chinese Society for Agricultural Machinery, vol. 50, no. 10, pp. 289–297, 2019. [Google Scholar]
15. H. Ju, W. Xiong, Y. Xu and E. Lin, “Impacts of climate change on wheat yield in China,” Acta Agronomica Sinica, vol. 31, no. 10, pp. 1340–1343, 2005. [Google Scholar]
16. Z. Shang, D. Jiang and L. He, “The research development about influence of climatic change on wheat production,” Chinese Agricultural Science Bulletin, vol. 29, no. 21, pp. 6–11, 2013. [Google Scholar]
17. Z. Tian, J. Shi, Z. Gao and F. N. Tubiello, “Assessing the impact of future climate change on wheat production in Huang-Huai-Hai plain in China based on GIS and crop model,” Proceedings of SPIE, vol. 7083, no. 1, pp. 1–10, 2008. [Google Scholar]
18. W. Liu, M. Guo, W. An, Y. Liu, J. Yan et al., “Influence of climatic change on winter wheat cropping system in Shanxi,” Journal of Arid Land Resources and Environment, vol. 23, no. 11, pp. 88–93, 2009. [Google Scholar]
19. M. Olmo, J. A. Alburquerque, V. Barrón, M. C. Del Campillo, A. Gallardo et al., “Wheat growth and yield responses to biochar addition under mediterranean climate conditions,” Biology and Fertility of Soils, vol. 50, no. 8, pp. 1177–1187, 2014. [Google Scholar]
20. L. D. Hoa, E. Li, I. Nuberg and J. Bruwer, “Understanding farmers’ adaptation intention to climate change: A structural equation modelling study in the Mekong delta,” Vietnam Environmental Science & Policy, vol. 41, no. 3, pp. 11–22, 2014. [Google Scholar]
21. R. K. Grace, K. Induja and M. Lincy, “Enrichment of crop yield prophecy using machine learning algorithms,” Intelligent Automation and Soft Computing, vol. 31, no. 1, pp. 279–296, 2022. [Google Scholar]
22. J. He, “Best management practice development with the CERES-Maize model for sweet corn production in north Florida,” Ph.D. dissertation, University of Florida, United States, 2008. [Google Scholar]
23. J. He, M. D. Dukes, G. J. Hochmuth, J. W. Jones and W. D. Graham, “Identifying irrigation and nitrogen best management practices for sweet corn production on sandy soils using ceres-maize model,” Agricultural Water Management, vol. 109, no. 3, pp. 61–70, 2012. [Google Scholar]
24. J. He, H. Cai and J. Bai, “Irrigation scheduling based on CERES-Wheat model for spring wheat production in the Minqin oasis in northwest China,” Agricultural Water Management, vol. 128, no. 3, pp. 19–31, 2013. [Google Scholar]
25. J. M. Yang, J. Y. Yang, S. Liu and G. Hoogenboom, “An evaluation of the statistical methods for testing the performance of crop models with observed data,” Agricultural Systems, vol. 127, no. 9, pp. 81–89, 2014. [Google Scholar]
26. G. Hoogenboom, “Contribution of agrometeorology to the simulation of crop production and its applications,” Agricultural and Forest Meteorology, vol. 103, no. 1–2, pp. 137–157, 2000. [Google Scholar]
27. G. Hoogenboom, C. H. Porter, V. Shelia, K. J. Boote, U. Singh et al., Decision support system for agrotechnology transfer (DSSAT), Version 4.7.5 ed., Gainesville, FL, USA: DSSAT Foundation, 2019. [Google Scholar]
28. M. V. Garrison, W. D. Batchelor, R. S. Kanwar and J. T. Ritchie, “Evaluation of the ceres-maize water and nitrogen balances under tile-drained conditions,” Agricultural Systems, vol. 62, no. 3, pp. 189–200, 1999. [Google Scholar]
29. J. Ji, H. Cai, J. He and H. Wang, “Performance evaluation of ceres-wheat model in Guanzhong plain of northwest China,” Agricultural Water Management, vol. 144, pp. 1–10, 2014. [Google Scholar]
30. A. Angstrom, “Solar and terrestrial radiation. Report to the international commission for research on actinometric investigations of solar and atmospheric radiation,” Quarterly Journal of the Royal Meteorological Society, vol. 210, no. 50, pp. 121–126, 1924. [Google Scholar]
31. M. Song, H. Feng, Z. Li and J. Gao, “Global sensitivity analyses of DSSAT-CERES-Wheat model using Morris and EFAST methods,” Transactions of the Chinese Society for Agricultural Machinery, vol. 45, no. 10, pp. 124–131, 166, 2014. [Google Scholar]
32. X. Xu, G. Huang, C. Sun, L. S. Pereira, T. B. Ramos et al., “Assessing the effects of water table depth on water use, soil salinity and wheat yield: Searching for a target depth for irrigated areas in the upper yellow river basin,” Agricultural Water Management, vol. 125, no. 3, pp. 46–60, 2013. [Google Scholar]
33. G. Shao, J. Cui, S. E. Yu, B. Lu, B. J. Brian et al., “Impacts of controlled irrigation and drainage on the yield and physiological attributes of rice,” Agricultural Water Management, vol. 149, pp. 156–165, 2015. [Google Scholar]
34. Z. Jingxiao and S. Wei, “Sensitivity analysis of CERES-Wheat model parameters based on EFAST method,” Journal of China Agricultural University, vol. 17, no. 5, pp. 149–154, 2012. [Google Scholar]
35. X. Wang, M. Huang, Q. Zhou, J. Cai, T. Dai et al., “Physiological and proteomic mechanisms of waterlogging priming improves tolerance to waterlogging stress in wheat (Triticum aestivum L.),” Environmental and Experimental Botany, vol. 132, pp. 175–182, 2016. [Google Scholar]
36. E. K. Liu, X. R. Mei, C. R. Yan, D. Z. Gong and Y. Q. Zhang, “Effects of water stress on photosynthetic characteristics, dry matter translocation and WUE in two winter wheat genotypes,” Agricultural Water Management, vol. 167, pp. 75–85, 2016. [Google Scholar]
 | This work is licensed under a Creative Commons Attribution 4.0 International License, which permits unrestricted use, distribution, and reproduction in any medium, provided the original work is properly cited. |