DOI:10.32604/cmc.2022.027707
| Computers, Materials & Continua DOI:10.32604/cmc.2022.027707 | |
| Article |
Optimal Deep Learning Enabled Statistical Analysis Model for Traffic Prediction
1Department of Computer Science and Information Systems, College of Applied Sciences, AlMaarefa University, Ad Diriyah, Riyadh, 13713, Kingdom of Saudi Arabia
2Institute of Biomedical Engineering, Saveetha School of Engineering, Saveetha Institute of Medical and Technical Sciences, Saveetha University, Saveetha Nagar, Thandalam, Chennai, 602105, India
3Department of Electrical & Electronics Engineering, Amal Jyothi College of Engineering, Kanjirappally, Kerala, 686518, India
4Saveetha School of Engineering, Saveetha Institute of Medical and Technical Sciences, Saveetha University, Saveetha Nagar, Thandalam, Chennai, 602105, India
5Department of Electronics and Communication Engineering, College of Engineering and Technology, SRM Institute of Science and Technology, Vadapalani Campus, Chennai, 600026, India
6Department of Business Administration, Hanbat National National University, Daejeon, 34158, Korea
7Department of Computer Science and Engineering, Sejong University, Seoul, 05006, Korea
8Department of Information and Communication Engineering, Yeungnam University, Gyeongsan-si, Gyeongbuk-do, 38541, Korea
*Corresponding Author: Sung Won Kim. Email: swon@yu.ac.kr
Received: 24 January 2022; Accepted: 08 March 2022
Abstract: Due to the advances of intelligent transportation system (ITSs), traffic forecasting has gained significant interest as robust traffic prediction acts as an important part in different ITSs namely traffic signal control, navigation, route mapping, etc. The traffic prediction model aims to predict the traffic conditions based on the past traffic data. For more accurate traffic prediction, this study proposes an optimal deep learning-enabled statistical analysis model. This study offers the design of optimal convolutional neural network with attention long short term memory (OCNN-ALSTM) model for traffic prediction. The proposed OCNN-ALSTM technique primarily pre-processes the traffic data by the use of min-max normalization technique. Besides, OCNN-ALSTM technique was executed for classifying and predicting the traffic data in real time cases. For enhancing the predictive outcomes of the OCNN-ALSTM technique, the bird swarm algorithm (BSA) is employed to it and thereby overall efficacy of the network gets improved. The design of BSA for optimal hyperparameter tuning of the CNN-ALSTM model shows the novelty of the work. The experimental validation of the OCNN-ALSTM technique is performed using benchmark datasets and the results are examined under several aspects. The simulation results reported the enhanced outcomes of the OCNN-ALSTM model over the recent methods under several dimensions.
Keywords: Statistical analysis; predictive models; deep learning; traffic prediction; bird swarm algorithm
With the advancement of intelligent transportation system (ITS), traffic prediction system has gained considerable interest as precise traffic prediction plays an important part in ITS, including route guidance system, traffic signal control system, and navigation system [1]. In addition, with the increase of smart electric vehicles, the traffic prediction system of such an intelligent traffic system will become more important. The aim is to predict condition of the traffic (for example, speed and flow of traffic) of upcoming time-step assuming the historical traffic information [2]. But it is difficult process because of the uncertainty and natural complexity of traffic patterns. In several loops, sensor nodes are implanted under the road, and they gather traffic information by identifying passing vehicles. Next, the traffic information of the network has been experimented with as traffic graph signal [3]. At the same time, the node in the similar traffic flow is connected with one another, for example, the pattern of upstream node signal appears quickly in the downstream node signal. Furthermore, the constant node signal has trend and seasonality that implies the pattern of weekdays are analogous to one another even though distinct from the pattern of weekend and the trend of vehicle amount is increasing yearly.
Also, Short-term traffic flow prediction assists traveler makes good path selections [4]. In the last decade, several methods of traffic flow prediction have developed, and they are commonly categorized as hybrid, parametric, and non-parametric approaches. The parametric method includes multi-variate time series model, exponential smoothing, regression model, and cellular models are designed for handling the variability and uncertainty of traffic flow development. Amongst this method, the autoregressive integrated moving average (ARIMA) system [5] are able to provide explicit formula to demonstrate rules of promising predicted results and traffic flow. But this parametric method makes severe assumption on traffic movement and are lower to forecast the traffic steam with uneven fluctuation.
Consequently, precise traffic flow prediction has received considerable interest from the authors worldwide [6], also several predictive models have been introduced for achieving higher predictive performance. Amongst others, machine learning (ML)-based method has the better representation since the efficiency of this ML-based algorithm is similarly consistent with people’s expectations [7]. But over the last decade, authors only concentrated on enhancing predictive performance without paying equivalent consideration to reduce the deployment cost and the processing time of this presented system [8]. Recently, deep learning (DL) method is making considerable achievement with an advanced efficiency in Artificial Intelligence (AI) [9]. Usually, the Current deep neural network (DNN) consists of many consecutive layers to determine complex structure from higher-dimension data and additionally extracts hierarchical representation in feature learning. Consequently, the researcher in the ITS was established the significance of DL method and previously initiated for exploiting DNN for smart traffic prediction and sensing [10]. The incorporation of ITS and DL method was justified effectively by that DL method could design intricate representation from largescale traffic data sets in layer-wise manner. Furthermore, the intermediate representation of spatial and temporal traffic is collectively learned using the DL algorithms.
Gu et al. [11] introduced an improved Bayesian combination method using DL (IBCM-DL) for predicting traffic flows. Firstly, the presented architecture is developed on the basis of BCM architecture presented by Wang. Next, relation analysis is utilized for analyzing the significance among the present and past traffic flow intervals. The 3 sub-predictor includes the ARIMA, RBFNN, and GRUNN are combined with the IBCM architecture. Mounica et al. [12], proposed big data for analyzing practical traffic text data. The Spark and Kafka architecture are utilized in integration. Big data framework with Spark, Kafka using the capacity to process and prepare the data measure, have established the severe problem of managing and confining continuously flowing information.
Kim et al. [13] presented a DNN system named Ship Traffic Extraction Network (STENet) to forecast the medium- and long-term traffics of the cautionary region. The presented method is trained by AIS sensor data. The STENet method is systematized into a hierarchical model where the output of the contextual and movement feature extraction models is fed and concatenated as to predictive method. Qiu et al. [14], presented an ML technique that collectively examined the spatio-temporal correlations. Especially, RNN framework is employed. Moreover, multitask learning model is adapted for exploring the differences and commonalities through cells in enhancing the predictive accuracy.
This study offers the design of optimal convolutional neural network with attention long short term memory (OCNN-ALSTM) model for traffic prediction. The proposed OCNN-ALSTM technique primarily pre-processes the traffic data by the use of min-max normalization technique. Besides, OCNN-ALSTM technique was executed for classifying and predicting the traffic data in real time cases. For enhancing the predictive outcomes of the OCNN-ALSTM method, the birds’ swarm algorithm (BSA) is employed to it, and thereby overall efficacy of the network gets improved. The experimental validation of the OCNN-ALSTM technique is performed using benchmark datasets.
In this study, a new OCNN-ALSTM technique has been developed for effective traffic prediction. The proposed OCNN-ALSTM technique incorporates pre-processing CNN-ALSTM based prediction and BSA based hyperparameter tuning. The OCNN-ALSTM model is applied to classify and predict the traffic data in real time cases and BSA is applied in order to enhance the predictive outcomes of the OCNN-ALSTM model.
The scaling defines to change data that are different scales to attain off biases due to the amount of outliers. The most generally utilized approach of feature scaling has Mini-Maxi normalized. In Mini-Maxi normalized variations the signal values of many ranges as to zero and one. The general formula of Mini-Maxi normalized was formulated as:
At present m and
2.2 Design of CNN-ALSTM Based Prediction
The CNN-ALSTM technique receives the pre-processed data as input to perform traffic prediction process. This presented method is a hybrid DL approach which extracts features from the raw information and implements foresting by means of LSTM-NN. The CNN layer is applied for extracting the valuable characteristics from the time sequence data that has the potential to enhance the predictive performance. The feature vector attained from the following layer of CNN was inputted into the LSTM for calculation. All the elements of feature vector have similarities to most thirty-two units in the LSTM layer. The attention model puts high weight on the feature quantity that is considerably associated with the present output. The projected value of the AC2 at the following moment is output. Current work shows larger prediction accuracy integrating CNN and LSTM for different applications [15]. CNN assists LSTM in extracting the features of data. The attention model is a procedure of allotting weight. With the attention model, precise weightage value is allotted to the LSTM output to enhance the predictive ability. It can be attained as follows
Whereas
The existence of LSTM efficiently solves the vanishing or explosion gradient problem. There are four significant components: cell status, output gate, input gate, and forget gate. The output, input, and forget gates are utilized for controlling the deletion, maintenance, and update of data in cell status.
Here,
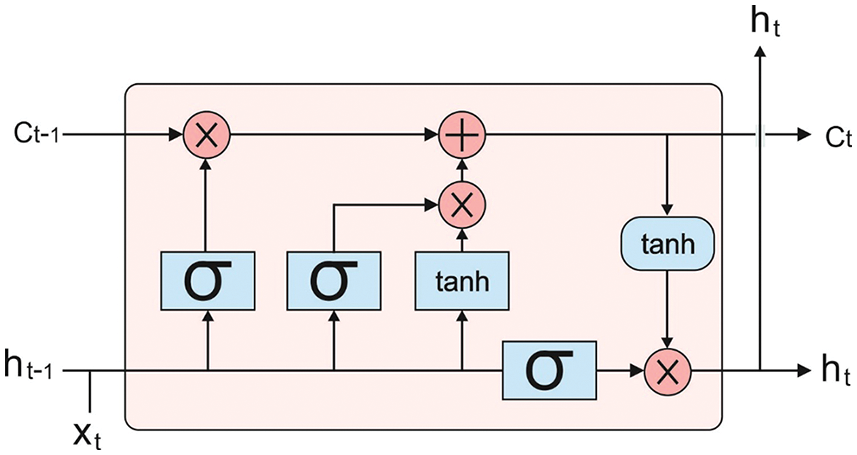
Figure 1: LSTM structure
The attention process method is a brain signal processing model anomalous to human visualization. The attention method was effectively applied and implemented to model training. The presented method employs the LSTM hidden layer output vector
Whereas
2.3 BSA Based Hyperparameter Tuning
For optimally modifying the hyperparameters of the CNN-ALSTM technique, the BSA is employed to it. Meng et al. [16], proposed a BSA using an intelligent bionic approach based on multisearch and multi-group models; it stimulates the bird vigilance, flight, and foraging behaviors and applies SI technique to resolve the optimization issue. The basic rules for bird swarm algorithm are given in the following:
Rule 1: all the birds switch between foraging and vigilant behaviors, as well as keeps and forages vigilance is imitated as random decision.
Rule 2: during foraging, all the birds recorded and updated their prior optimal experience and the swarm’s prior optimal experience with food patches. And it is utilized for food searching. Instantly share social data all over the groups.
Rule 3: While keeping vigilance, all the birds try to move toward the center of the swarm. Such performance might be impacted by disturbance created by swarm competition. Bird with most stocks is highly possible to near swarm center when compared to birds with least stock.
Rule 4: regularly bird flies to different locations. While flying to different places, birds frequently switch between shrubs and production. The bird with lease is a scrounger and the bird with more stocks is the producer. The birds with lowest and highest reserves were chosen arbitrarily for scroungers and producers.
Rule 5: producer actively seeks food. Scrounger arbitrarily follows producer in search of food.
Based on Rule 1, determine the time interval of all the bird’s flight behavior
Foraging behavior: When the iteration number has lesser when compared to FQ and
In which C and S represent 2 positive numbers; the previous one is named cognitive accelerated coefficient, and the last one is named social accelerated coefficient. Now,
Vigilance behavior: When iteration number is lesser when compared to FQ and
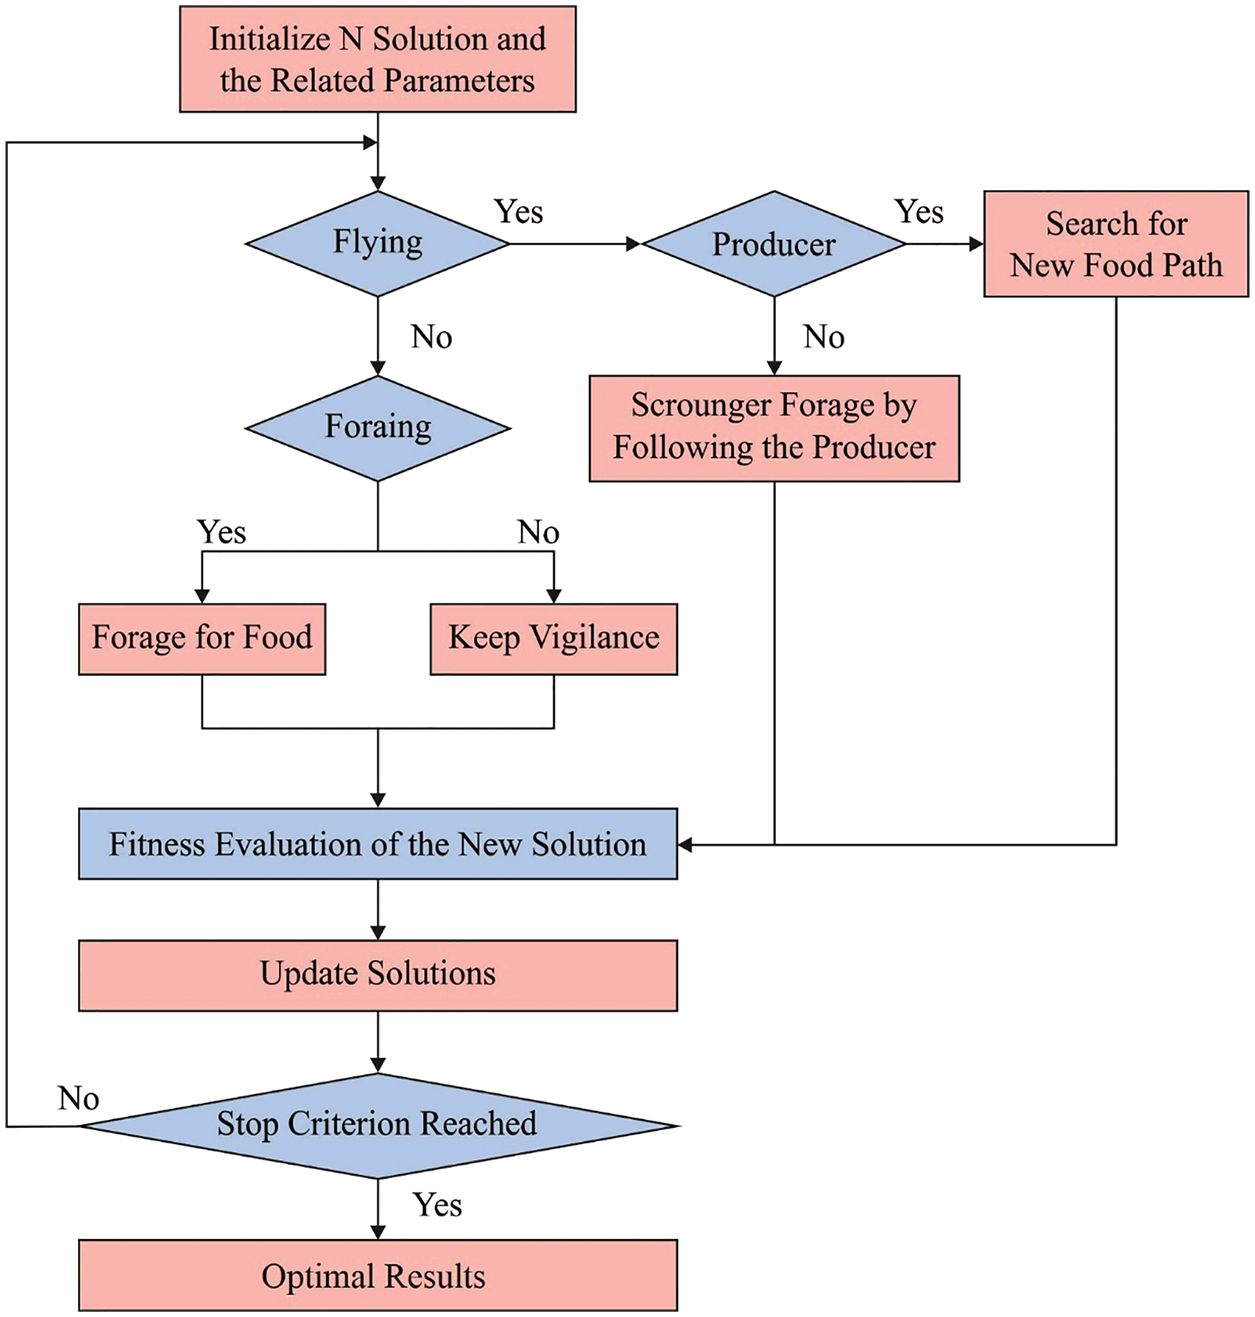
Figure 2: Flowchart of BSA
Here
Flight behavior: When the iteration number is equal to
While FL
The BSA approach derives a FF for obtaining enhanced classification performance. It resolves the positive integer for representing an optimum efficiency of the candidate solution. During this case, the minimized classification error rate was regarded as FF is provided in Eq. (11). Optimum solutions have a lower error rate and worst solution gains an enhanced error rate.
The proposed OCNN-ALSTM technique is tested using two datasets, which not only comprise rush and non-rush hours, along with weekdays and weekends. A primary data set was highway of Los Angeles County (METR-LA). The secondary data set was gathered in main publicly accessible data base, e.g., Caltrans Performance Measurement System (PeMS). In 325 loop detectors from the Bay Area (PEMS-BAY) are chosen.
Fig. 3 demonstrates the MSE analysis of the OCNN-ALSTM technique with existing methods under different time intervals on METR-LA dataset. For instance, under 15 min duration, the results indicated that the ARIMA and FNN techniques have reached ineffective predictive outcomes with the maximum MSE of 64.16 and 62.88 respectively. Next, the STGCN, ST-UNet, GWaveNet, and ST-TrafficNet techniques have obtained moderately closer MSE of 33.64, 27.14, 28.52, and 25.30 respectively. However, the OCNN-ALSTM technique has outperformed the other methods with the least MSE of 9.61.
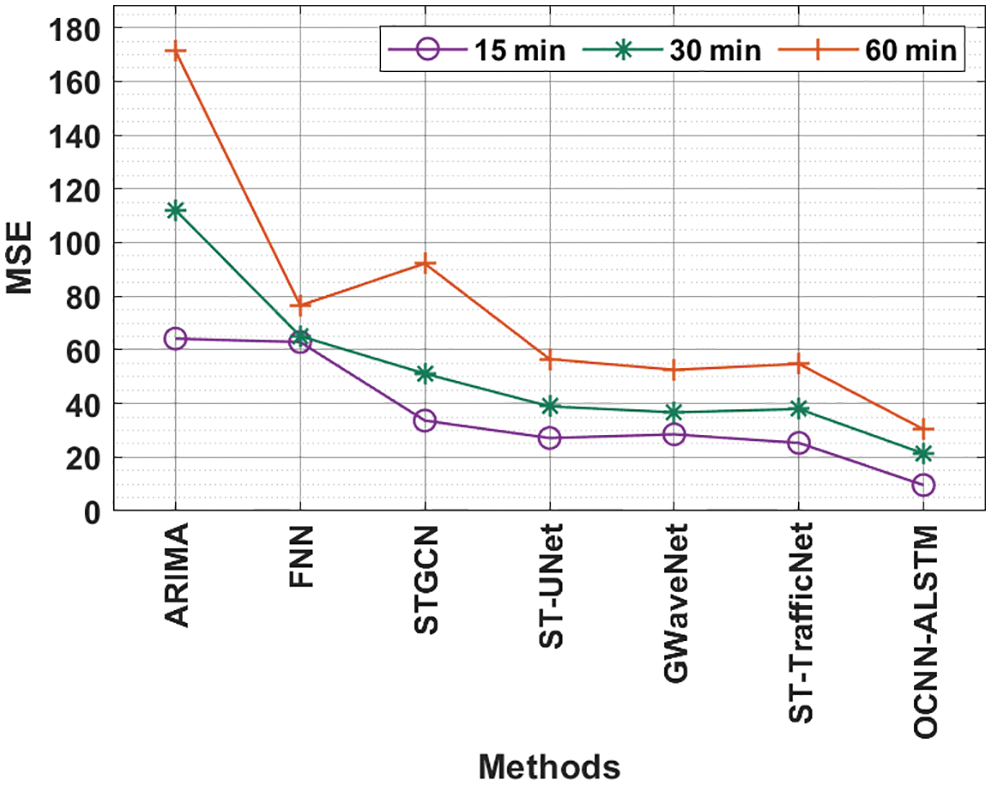
Figure 3: MSE comparison of OCNN-ALSTM with baseline techniques on METR-LA dataset
Fig. 4 depicts the RMSE analysis of the OCNN-ALSTM approach with existing techniques under distinct time intervals on METR-LA dataset. The figure highlighted the higher outcomes of the OCNN-ALSTM approach. For instance, with 15 min, the results referred that the ARIMA and FNN methods have reached ineffective predictive outcomes with the maximal RMSE of 8.01 and 7.93 correspondingly. Next, the STGCN, ST-UNet, GWaveNet, and ST-TrafficNet approaches have obtained moderately closer RMSE of 5.80, 5.21, 5.34, and 5.03 correspondingly. But, the OCNN-ALSTM system has exhibited the other techniques with the least RMSE of 3.10.
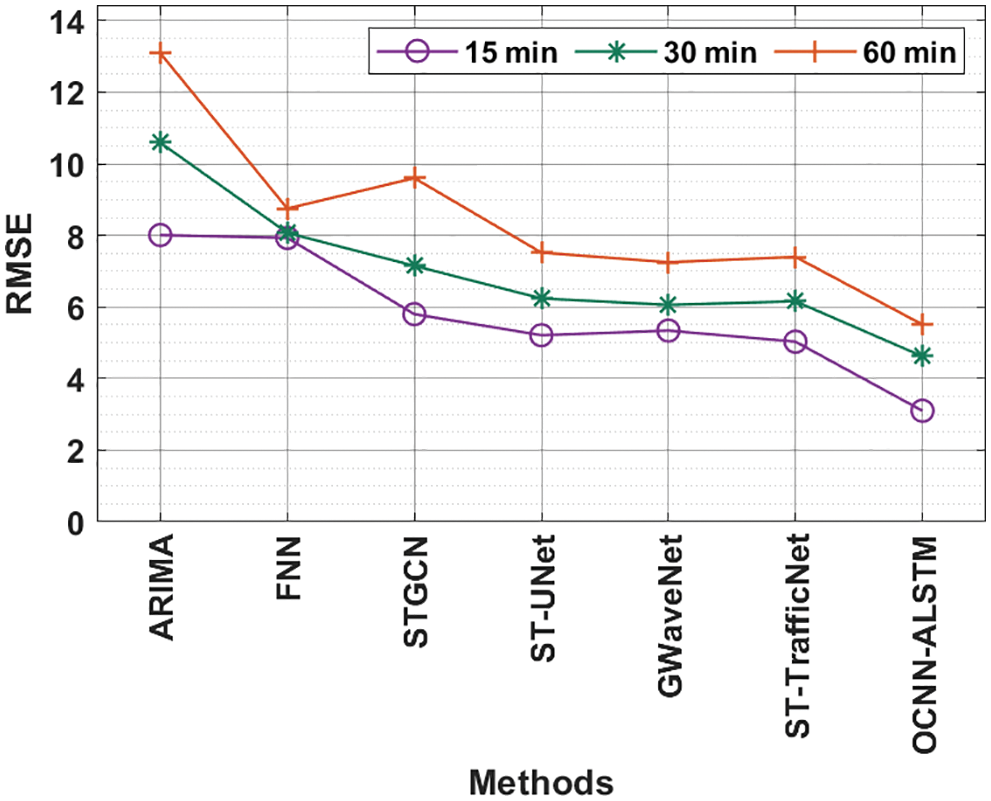
Figure 4: RMSE comparison of OCNN-ALSTM with baseline approaches on METR-LA dataset
Fig. 5 illustrates the MAPE E analysis of the OCNN-ALSTM technique with existing methods under distinct time intervals on METR-LA dataset. The figure highlighted the maximal outcomes of the OCNN-ALSTM model. For sample, with 15 min, the outcomes showed that the ARIMA and FNN approaches have achieved ineffective predictive outcomes with the maximum MAPE of 9.61 and 9.52 correspondingly. Followed by, the STGCN, ST-UNet, GWaveNet, and ST-TrafficNet methodologies have gained reasonably closer MAPE of 7.74, 6.96, 7.13, and 6.72 respectively. At last, the OCNN-ALSTM system has demonstrated the other methods with the least MAPE of 6.72.
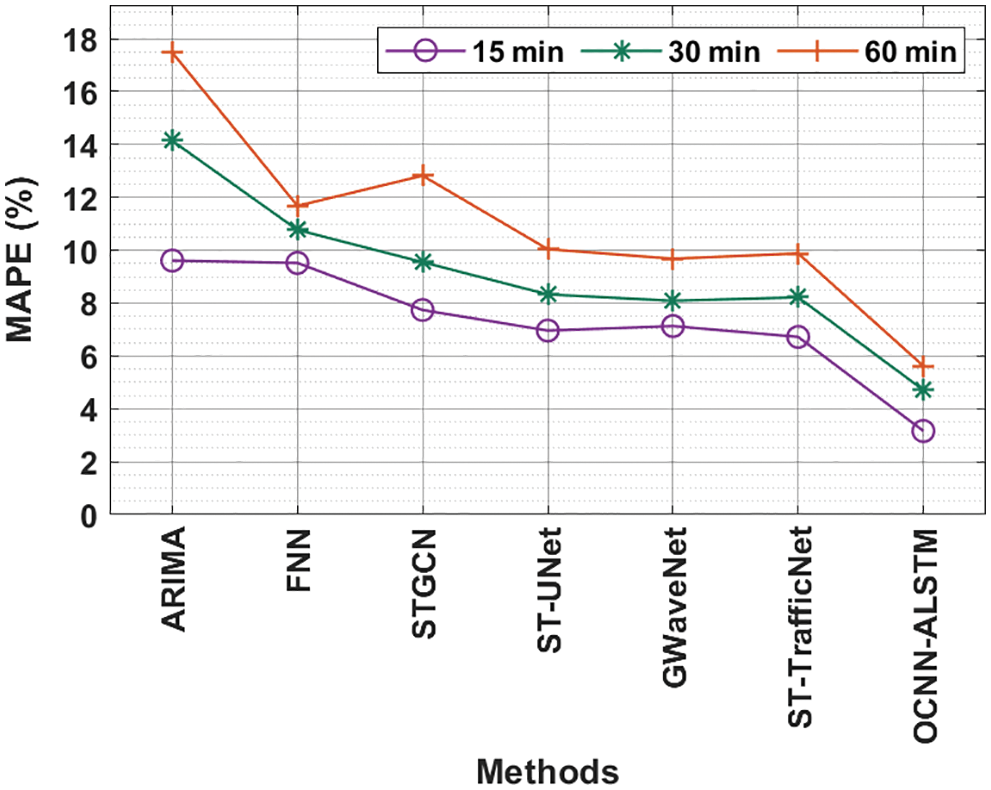
Figure 5: MAPE comparison of OCNN-ALSTM with baseline approaches on METR-LA dataset
Fig. 6 demonstrates the MSE analysis of the OCNN-ALSTM technique with existing methods under different time intervals on PEMS-BAY dataset. For instance, under 15 min duration, the results indicated that the ARIMA and FNN techniques have reached ineffective predictive outcomes with the maximum MSE of 11.83 and 12.89 respectively. Next, the STGCN, ST-UNet, GWaveNet, and ST-TrafficNet techniques have obtained moderately closer MSE of 8.64, 6.92, 7.13, and 7.24 respectively. However, the OCNN-ALSTM technique has outperformed the other methods with the least MSE of 4.41.
Fig. 7 showcases the RMSE analysis of the OCNN-ALSTM technique with recent algorithms under different time intervals on PEMS-BAY dataset. The figure highlighted the superior outcomes of the OCNN-ALSTM system. For sample, with 15 min, the outcomes indicated that the ARIMA and FNN methods have reached ineffective predictive outcomes with the maximal RMSE of 3.44 and 3.59 respectively. Next, the STGCN, ST-UNet, GWaveNet, and ST-TrafficNet techniques have reached moderately closer RMSE of 2.94, 2.63, 2.67, and 2.69 correspondingly. Lastly, the OCNN-ALSTM method has portrayed the other methodologies with a minimum RMSE of 2.10.
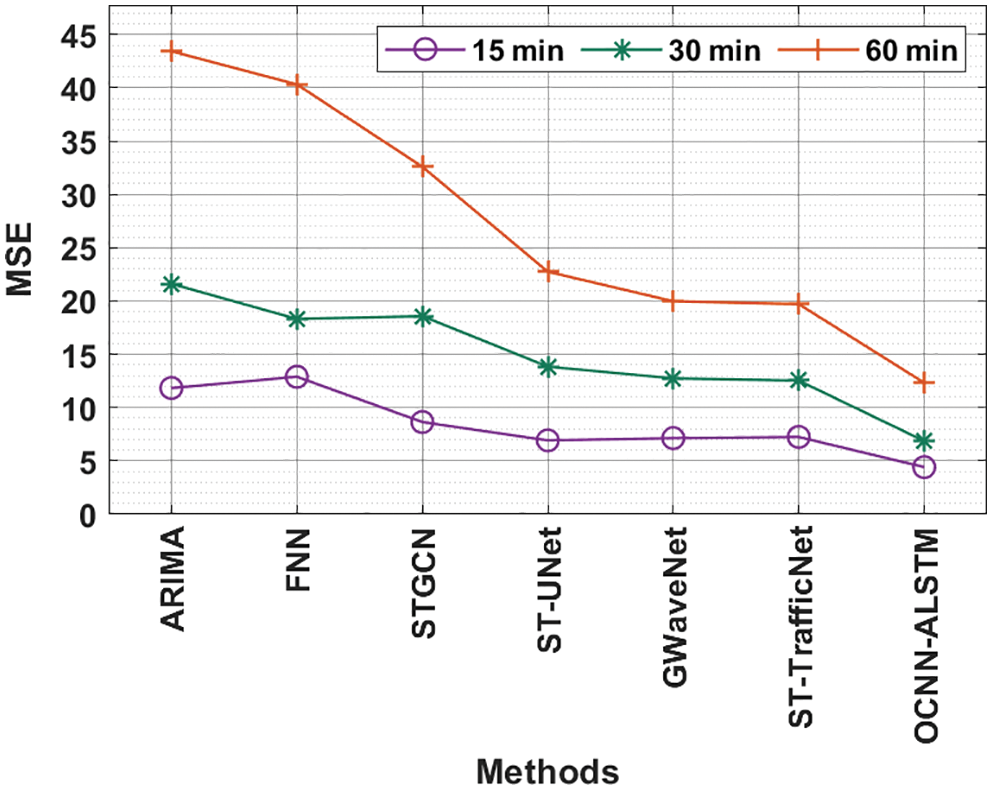
Figure 6: MSE comparison of OCNN-ALSTM with baseline systems on PEMS-BAY dataset
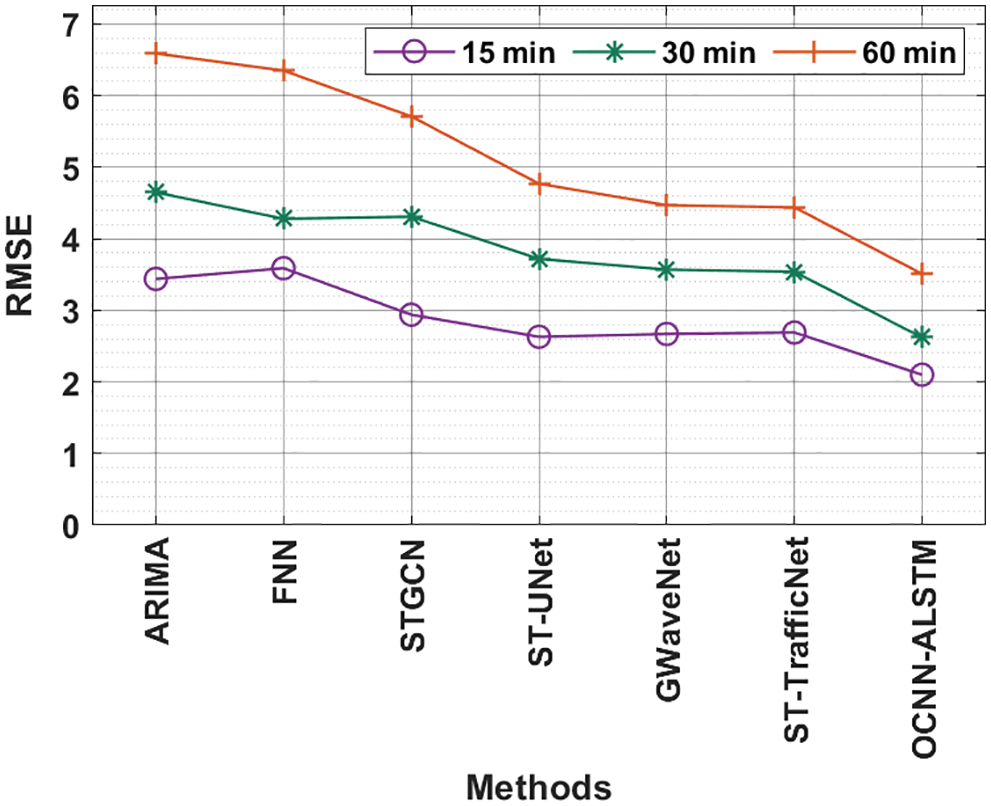
Figure 7: RMSE comparison of OCNN-ALSTM with baseline systems on PEMS-BAY dataset
Fig. 8 demonstrates the MAPE E analysis of the OCNN-ALSTM technique with existing methods under various time intervals on PEMS-BAY dataset. The figure highlighted the improved outcomes of the OCNN-ALSTM model. For instance, with 15 min, the outcomes represented that the ARIMA and FNN techniques have reached ineffective predictive outcomes with the maximal MAPE of 4.58 and 4.77 correspondingly. Afterward, the STGCN, ST-UNet, GWaveNet, and ST-TrafficNet approaches have obtained reasonably closer MAPE of 3.91, 3.50, 3.55, and 3.58 correspondingly. Eventually, the OCNN-ALSTM system has outperformed the other methods with a lower MAPE of 2.79.
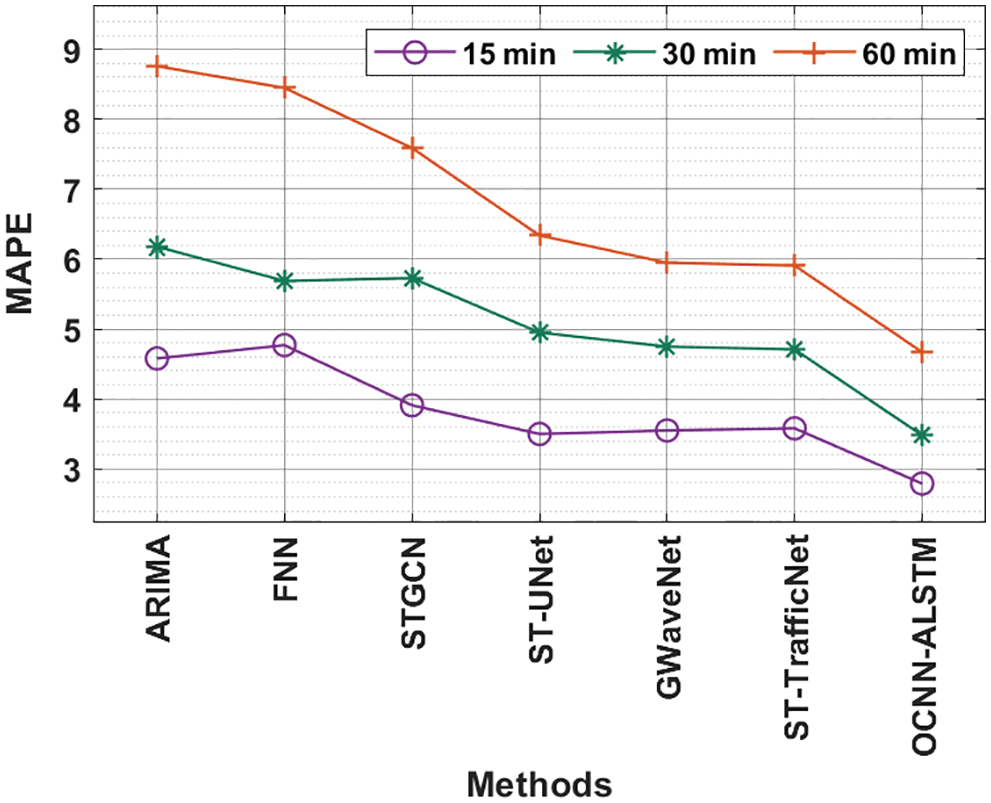
Figure 8: MAPE comparison of OCNN-ALSTM with baseline techniques on PEMS-BAY dataset
Fig. 9 demonstrates the predictive result analysis of the OCNN-ALSTM method on the test PEMS-BAY dataset. The results reported that the OCNN-ALSTM technique has accomplished effective prediction outcomes.
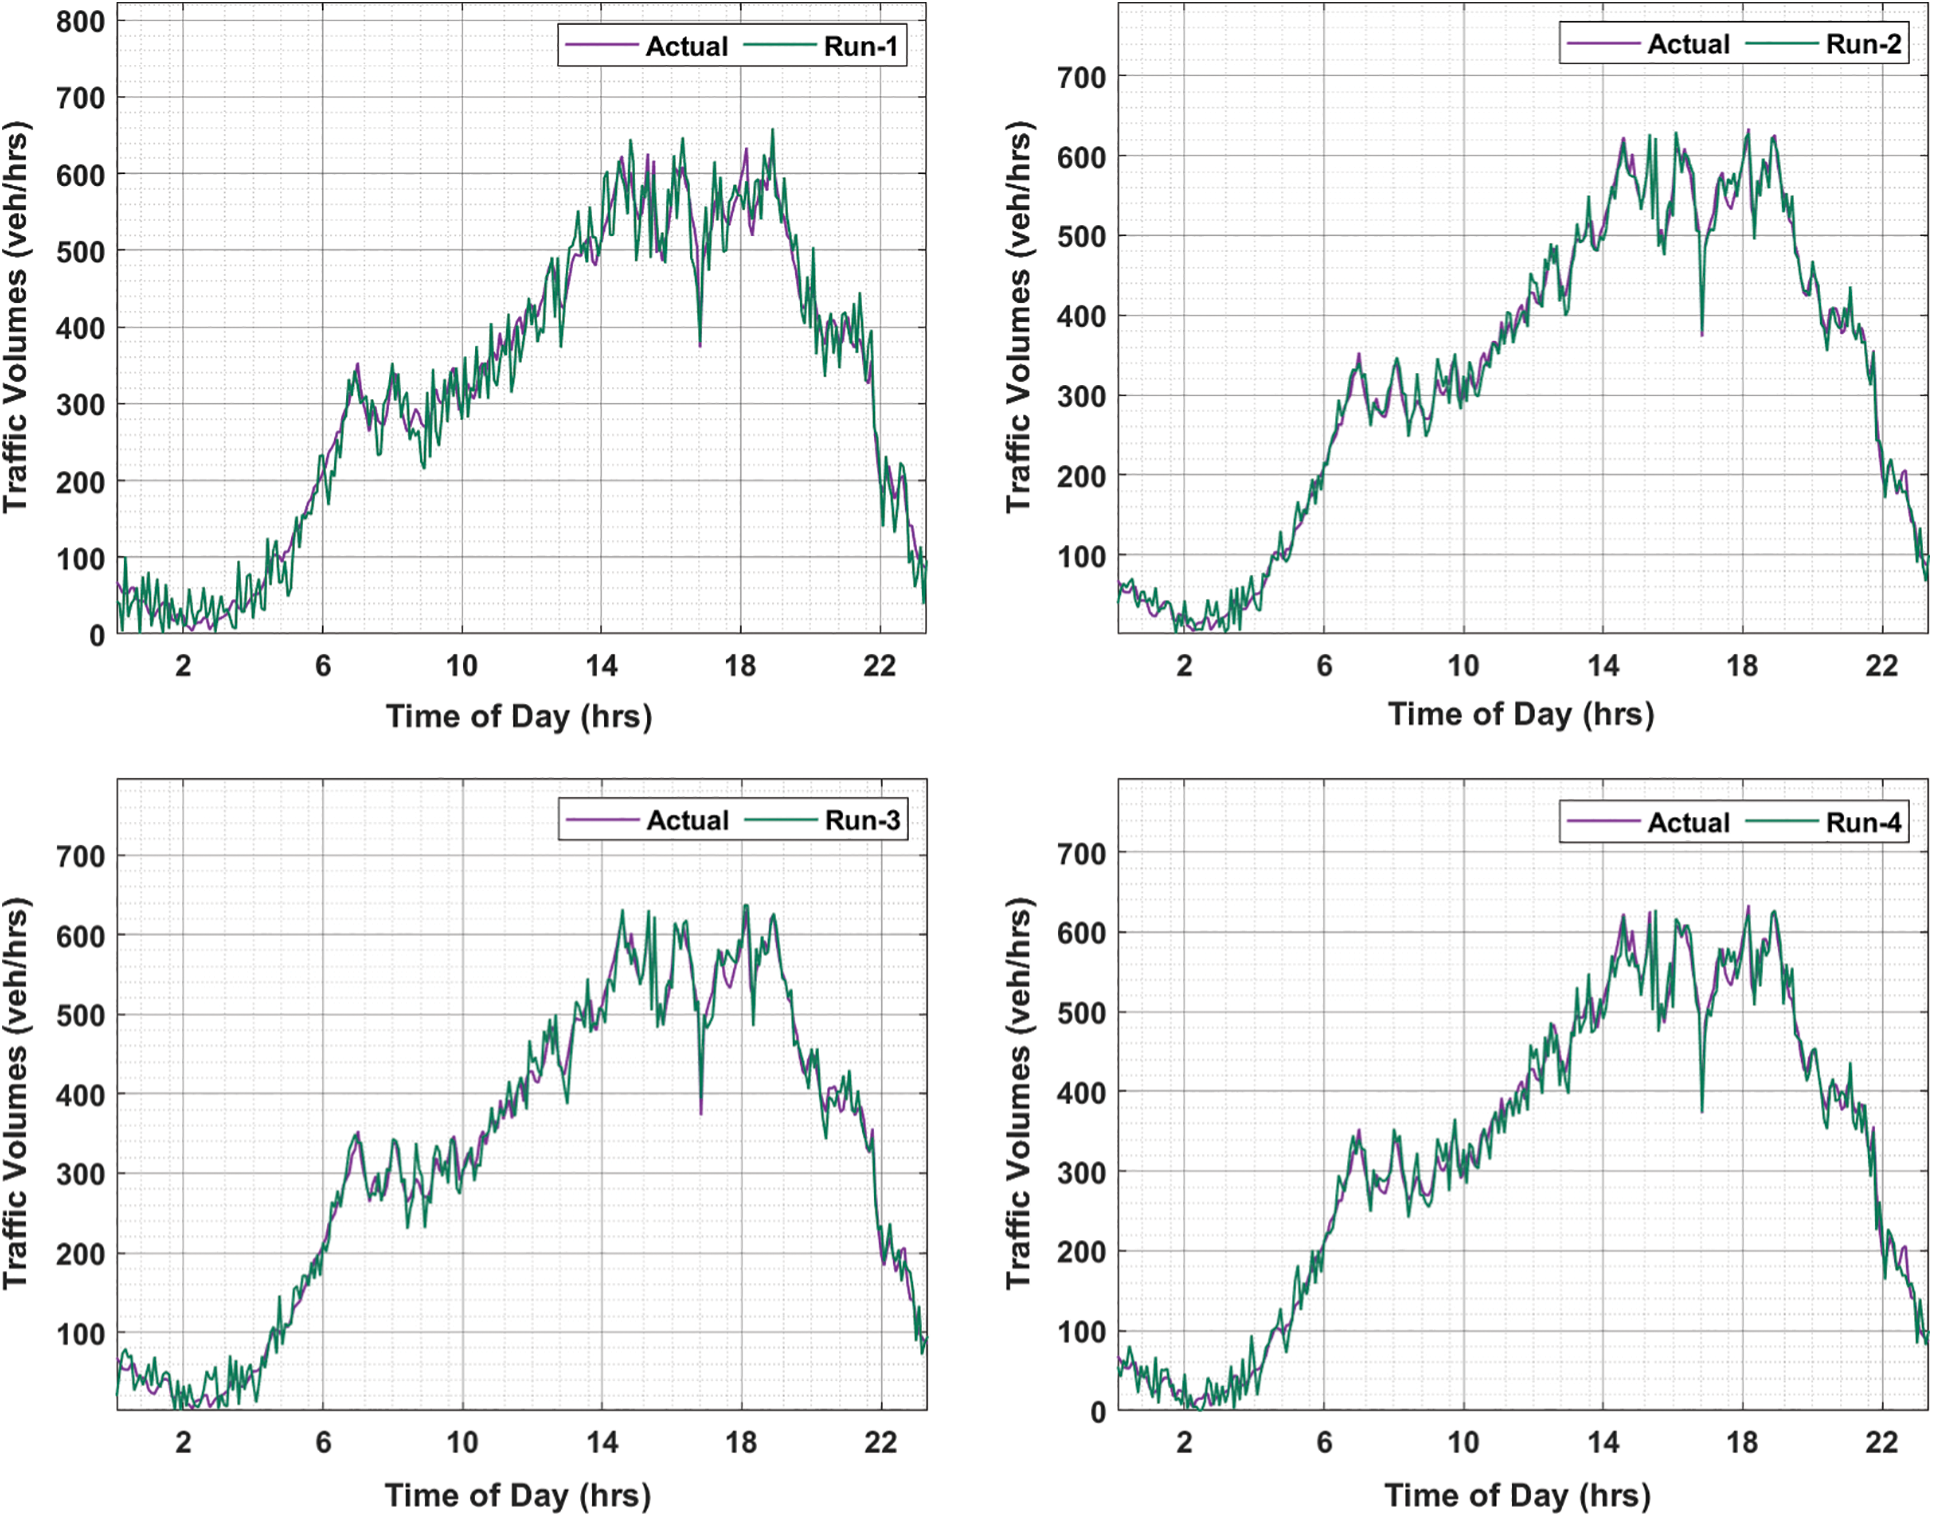
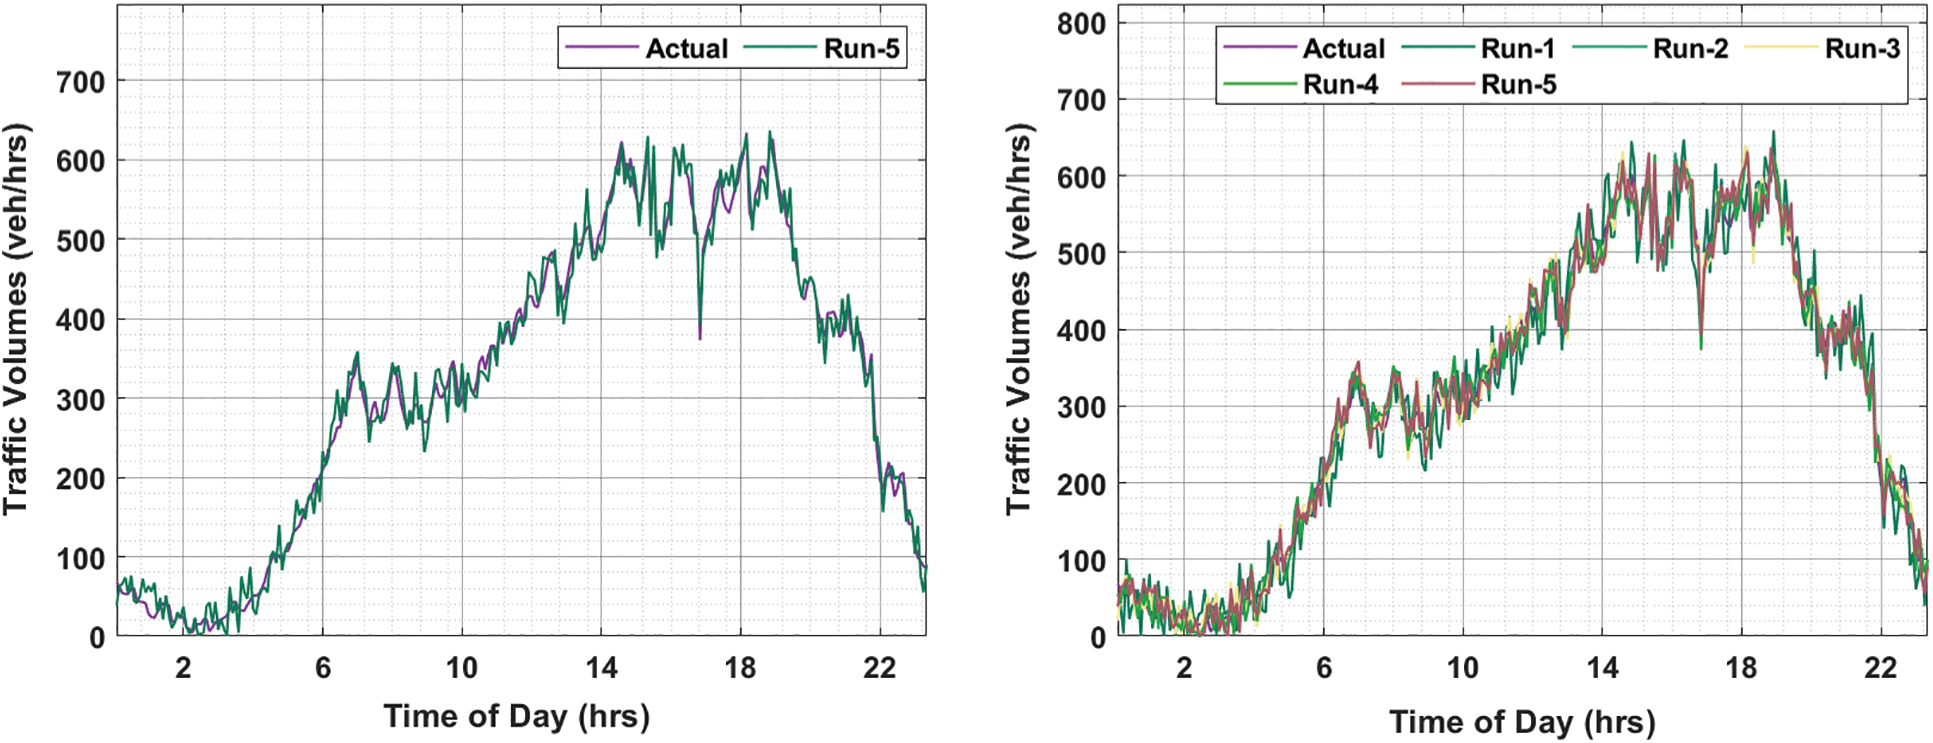
Figure 9: 24 hrs Prediction on Proposed Model on PEMS-BAY dataset
Finally, a computation time (CT) analysis of the OCNN-ALSTM with recent techniques takes place in Tab. 1 [18,19]. Fig. 10 illustrates the CT analysis of the OCNN-ALSTM technique on the METR-LA dataset. The figure reported that the DCRNN and M1 techniques have reached ineffectual outcomes with a maximum CT of 60.67 and 39.20 min. In addition, the S2S, SA2S, and DARNN techniques have obtained moderately reduced CTs of 1.55, 2.12, and 6.15 min respectively. However, the OCNN-ALSTM technique has accomplished least CT of 1.03 min.
Fig. 11 examines the CT analysis of the OCNN-ALSTM approach on the PEMS-BAY dataset. The figure described that the DCRNN and M1 techniques have reached ineffectual outcomes with the maximum CT of 57.48 and 37.17 min. Also, the S2S, SA2S, and DARNN approaches have reached moderately lower CTs of 1.42, 2.42, and 5.12 min respectively. At last, the OCNN-ALSTM technique has accomplished minimum CT of 0.56 min. After examining the above mentioned tables and figures, it is apparent that the OCNN-ALSTM technique has resulted in effective outcomes over the other methods.
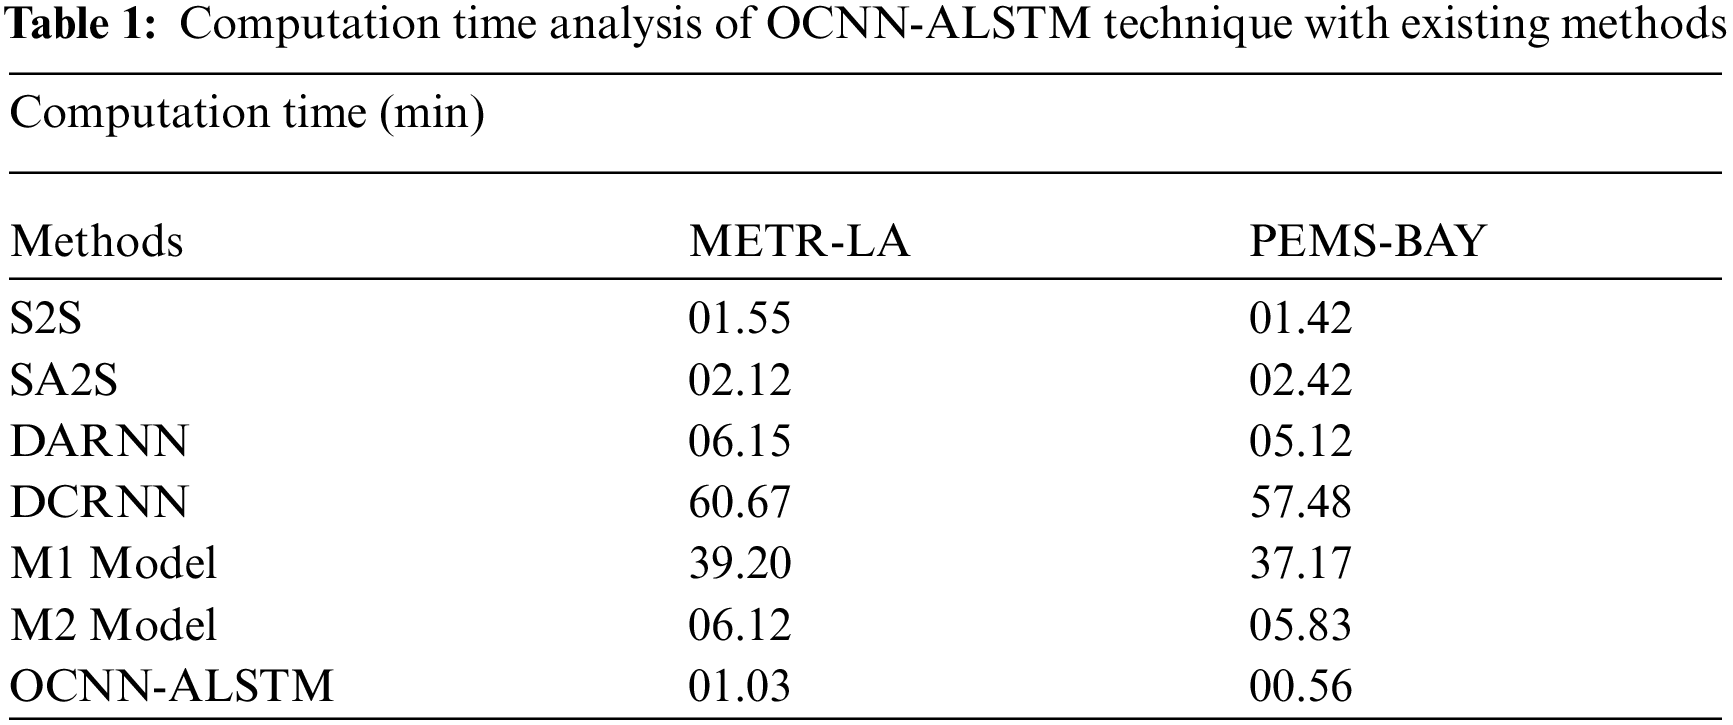
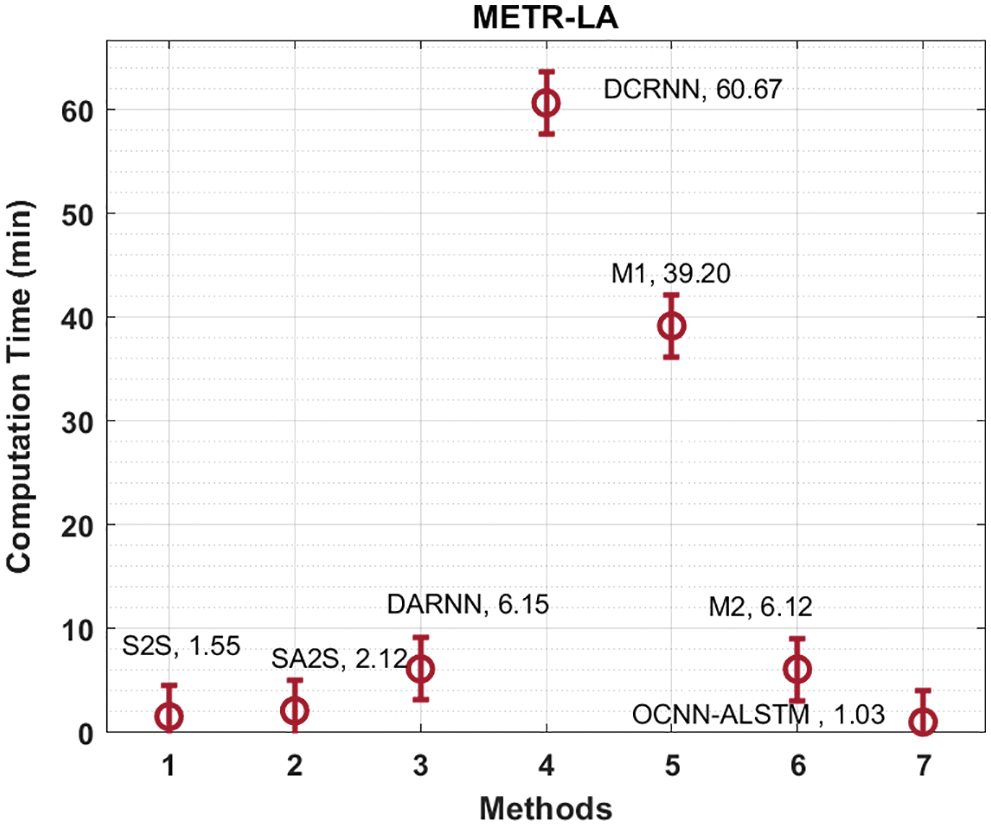
Figure 10: CT analysis of OCNN-ALSTM technique on METR-LA dataset
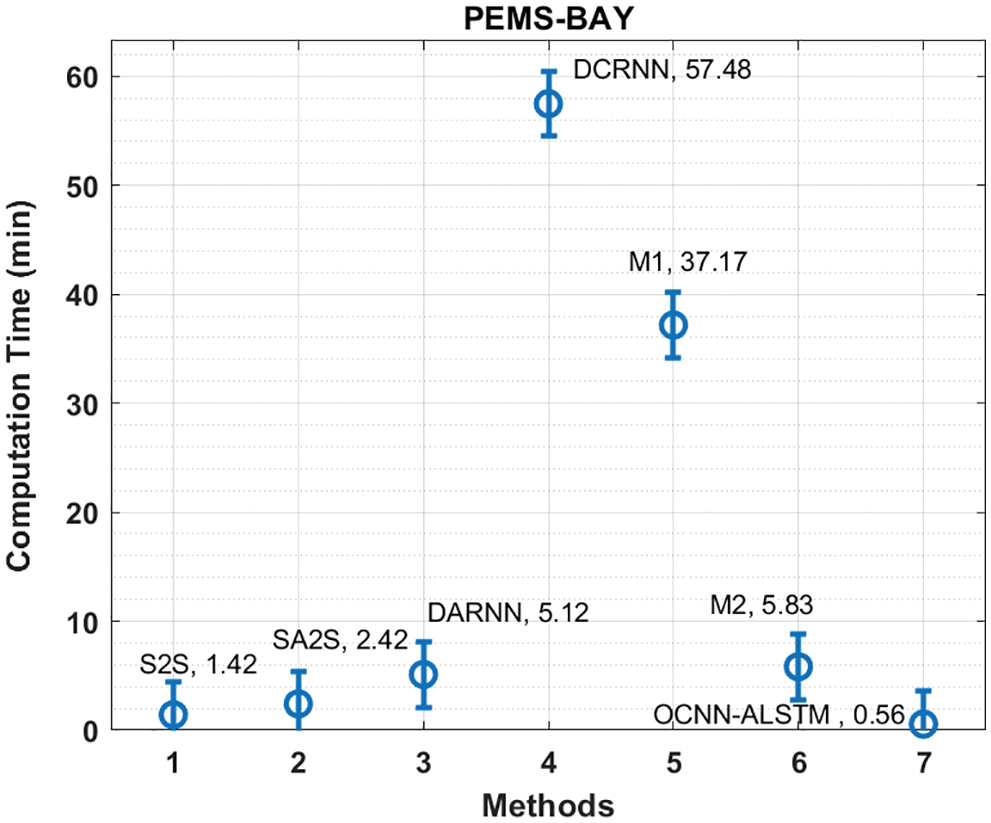
Figure 11: CT analysis of OCNN-ALSTM technique on PEMS-BAY dataset
In this study, a new OCNN-ALSTM approach has been established for effective traffic prediction. The proposed OCNN-ALSTM technique incorporates pre-processing CNN-ALSTM based prediction and BSA based hyperparameter tuning. The OCNN-ALSTM model was executed for classifying and predicting the traffic data in real time cases and BSA is applied for enhancing the predictive outcomes of the OCNN-ALSTM technique. The experimental validation of the OCNN-ALSTM technique is performed using benchmark datasets and the results are examined under several aspects. The simulation results reported the enhanced outcomes of the OCNN-ALSTM model over the recent methods under several dimensions. In future, the OCNN-ALSTM technique can be extended to the utilization of hybrid metaheuristics for learning rate scheduling process. With the increase of smart electric vehicles, the importance of intelligent transportation systems (ITS) will grow even more in the future. In this situation, the demand for improving the accuracy of the traffic prediction model will increase, and the increase in the predictive power of the OCNN-ALSTM model through the BSA considered in this paper will contribute greatly.
Funding Statement: This research was supported by Basic Science Research Program through the National Research Foundation of Korea(NRF) funded by the Ministry of Education(NRF-2021R1A6A1A03039493).
Conflicts of Interest: The authors declare that they have no conflicts of interest to report regarding the present study.
1. M. Veres and M. Moussa, “Deep learning for intelligent transportation systems: A survey of emerging trends,” IEEE Transactions on Intelligent Transportation Systems, vol. 21, no. 8, pp. 3152–3168, 2020. [Google Scholar]
2. B. Pan, U. Demiryurek and C. Shahabi, “Utilizing real-world transportation data for accurate traffic prediction,” in 2012 IEEE 12th Int. Conf. on Data Mining, Brussels, Belgium, pp. 595–604, 2012. [Google Scholar]
3. A. Abadi, T. Rajabioun and P. A. Ioannou, “Traffic flow prediction for road transportation networks with limited traffic data,” IEEE Transactions on Intelligent Transportation Systems, vol. 16, no. 2, pp. 653–662, 2015. [Google Scholar]
4. P. Sun, N. Aljeri and A. Boukerche, “Machine learning-based models for real-time traffic flow prediction in vehicular networks,” IEEE Network, vol. 34, no. 3, pp. 178–185, 2020. [Google Scholar]
5. K. Boriboonsomsin, M. J. Barth, W. Zhu and A. Vu, “Eco-routing navigation system based on multisource historical and real-time traffic information,” IEEE Transactions on Intelligent Transportation Systems, vol. 13, no. 4, pp. 1694–1704, 2012. [Google Scholar]
6. G. Comert and A. Bezuglov, “An online change-point-based model for traffic parameter prediction,” IEEE Transactions on Intelligent Transportation Systems, vol. 14, no. 3, pp. 1360–1369, 2013. [Google Scholar]
7. X. Feng, X. Ling, H. Zheng, Z. Chen and Y. Xu, “Adaptive multi-kernel svm with spatial–temporal correlation for short-term traffic flow prediction,” IEEE Transactions on Intelligent Transportation Systems, vol. 20, no. 6, pp. 2001–2013, 2019. [Google Scholar]
8. B. M. Williams and L. A. Hoel, “Modeling and forecasting vehicular traffic flow as a seasonal arima process: Theoretical basis and empirical results,” Journal of Transportation Engineering, Part A: Systems, vol. 129, no. 6, pp. 664–672, 2003. [Google Scholar]
9. L. Li, X. Qu, J. Zhang, H. Li and B. Ran, “Travel time prediction for highway network based on the ensemble empirical mode decomposition and random vector functional link network,” Applied Soft Computing, vol. 73, pp. 921–932, 2018. [Google Scholar]
10. Y. Tian and L. Pan, “Predicting short-term traffic flow by long short-term memory recurrent neural network,” in 2015 IEEE Int. Conf. on Smart City/SocialCom/SustainCom (SmartCity), Chengdu, China, pp. 153–158, 2015. [Google Scholar]
11. Y. Gu, W. Lu, X. Xu, L. Qin, Z. Shao et al., “An improved Bayesian combination model for short-term traffic prediction with deep learning,” IEEE Transactions on Intelligent Transportation Systems, vol. 21, no. 3, pp. 1332–1342, 2020. [Google Scholar]
12. B. Mounica and K. Lavanya, “Real time traffic prediction based on social media text data using deep learning,” Journal of Mobile Multimedia, vol. 18, no. 2, pp. 373–392, 2022. [Google Scholar]
13. K. I. Kim and K. Lee, “Deep learning-based caution area traffic prediction with automatic identification system sensor data,” Sensors, vol. 18, no. 9, pp. 3172, 2018. [Google Scholar]
14. C. Qiu, Y. Zhang, Z. Feng, P. Zhang and S. Cui, “Spatio-temporal wireless traffic prediction with recurrent neural network,” IEEE Wireless Communications Letters, vol. 7, no. 4, pp. 554–557, 2018. [Google Scholar]
15. K. Yan, X. Wang, Y. Du, N. Jin, H. Huang et al., “Multi-step short-term power consumption forecasting with a hybrid deep learning strategy,” Energies, vol. 11, no. 11, pp. 3089, 2018. [Google Scholar]
16. X. B. Meng, X. Z. Gao, L. Lu, Y. Liu and H. Zhang, “A new bio-inspired optimisation algorithm: Bird swarm algorithm,” Journal of Experimental & Theoretical Artificial Intelligence, vol. 28, no. 4, pp. 673–687, 2016. [Google Scholar]
17. H. Yang, T. Chen and N. Huang, “An adaptive bird swarm algorithm with irregular random flight and its application,” Journal of Computational Science, vol. 35, pp. 57–65, 2019. [Google Scholar]
18. H. Lu, D. Huang, Y. Song, D. Jiang, T. Zhou et al., “ST-TrafficNet: A spatial-temporal deep learning network for traffic forecasting,” Electronics, vol. 9, no. 9, pp. 1474, 2020. [Google Scholar]
19. A. Boukerche and J. Wang, “A performance modeling and analysis of a novel vehicular traffic flow prediction system using a hybrid machine learning-based model,” Ad Hoc Networks, vol. 106, pp. 102224, 2020. [Google Scholar]
 | This work is licensed under a Creative Commons Attribution 4.0 International License, which permits unrestricted use, distribution, and reproduction in any medium, provided the original work is properly cited. |