DOI:10.32604/cmc.2022.027943
| Computers, Materials & Continua DOI:10.32604/cmc.2022.027943 | |
| Article |
Enhancing the Prediction of User Satisfaction with Metaverse Service Through Machine Learning
1Department of Applied Artificial Intelligence/Department of Human-Artificial Intelligence Interaction, Sungkyunkwan University, Seoul, 03063, Korea
2Department of Interaction Science/Department of Human-Artificial Intelligence Interaction, Sungkyunkwan University, Seoul, 03063, Korea
*Corresponding Author: Jang Hyun Kim. Email: alohakim@skku.edu
Received: 29 January 2022; Accepted: 08 March 2022
Abstract: Metaverse is one of the main technologies in the daily lives of several people, such as education, tour systems, and mobile application services. Particularly, the number of users of mobile metaverse applications is increasing owing to the merit of accessibility everywhere. To provide an improved service, it is important to analyze online reviews that contain user satisfaction. Several previous studies have utilized traditional methods, such as the structural equation model (SEM) and technology acceptance method (TAM) for exploring user satisfaction, using limited survey data. These methods may not be appropriate for analyzing the users of mobile applications. To overcome this limitation, several researchers perform user experience analysis through online reviews and star ratings. However, some online reviews occasionally have inconsistencies between the star rating and the sentiment of the text. This variation disturbs the performance of machine learning. To alleviate the inconsistencies, Valence Aware Dictionary and sEntiment Reasoner (VADER), which is a sentiment classifier based on lexicon, is introduced. The current study aims to build a more accurate sentiment classifier based on machine learning with VADER. In this study, five sentiment classifiers are used, such as Naïve Bayes, K-Nearest Neighbors (KNN), Logistic Regression, Light Gradient Boosting Machine (LightGBM), and Categorical boosting algorithm (Catboost) with three embedding methods (Bag-of-Words (BoW), Term Frequency-Inverse Document Frequency (TF-IDF), Word2Vec). The results show that classifiers that apply VADER outperform those that do not apply VADER, excluding one classifier (Logistic Regression with Word2Vec). Moreover, LightGBM with TF-IDF has the highest accuracy 88.68% among other models.
Keywords: Metaverse; ubiquitous computing; user satisfaction; online review; big data; VADER; machine learning; natural language processing
Metaverse is one of the most promising technologies which actualize virtual reality. Considering the Consumer Electronics Show (CES) held in 2022, metaverse was evaluated as one of the most important technologies of the future along with Non-Fungible Token (NFT) [1]. Regarding the emergence of metaverse, various platforms and applications are increasingly attempting to utilize the technology in their service [2]. Because this new trend is occurring in various fields (e.g., learning system, tour system), ubiquitous computing infrastructure in relevant fields are being established [3,4]. Moreover, considering the introduction of metaverse, several users can use the diverse metaverse applications in mobile and PC environments [5]. However, few studies have been conducted in the area of mobile metaverse applications. Considering the increasing number of users of metaverse, it is important to analyze user experience to provide the metaverse application users with improvedservices [6].
Regarding the process of analyzing user experience, user satisfaction can be obtained by online reviews [7]. User satisfaction on the internet is strongly related to the performance of a service [8]. Moreover, several scholars generally analyze user satisfaction to identify the factors which positively influence the fulfillment of service [9–11]. Considering these aspects, several researchers are trying to relate user satisfaction to predict the reuse intention of service [12,13]. For instance, by predicting user satisfaction in vehicle sharing systems, unnecessary resources can be reduced, and an efficient service can be provided [14].
However, most studies adopt few sample questionnaires to obtain user satisfaction, using conventional methods such as Structural Equation Model (SEM) or Technology Acceptance Model (TAM). To overcome the limitation of conventional methodologies, resources such as big-size online data (e.g., online reviews) from ubiquitous computing are getting more pervasive [15]. Big data are collected and analyzed in various fields [16,17]. Considering such a trend, this study aims to predict user satisfaction using big data from online reviews. Particularly, the authors use various machine learning models and embedding methods to find the optimal model that predicts user satisfaction. Furthermore, to remove biased text data, Valence Aware Dictionary and sEntiment Reasoner (VADER) is applied.
In the study, 4,783,669 online reviews of metaverse application (i.e., Roblox) were collected from Google play store. Roblox is one of the most well-known metaverse applications. Considering a successful metaverse introduction, Roblox had 47 million daily users in 2021 [18]. Subsequently, to predict user satisfaction, five sentiment classifiers based on machine learning (i.e., Naïve Bayes, Logistic Regression, K-Nearest Neighbor (KNN), Light Gradient Boosting Machine (LightGBM), and Categorical boosting algorithm (Catboost)) with three methods of embedding (Bag-of-Words (BoW), and Term Frequency-Inverse Document Frequency (TF-IDF), Word2Vec) were implemented. This study provides the first model to predict user satisfaction using various machine learning approaches and big data in the metaverse domain. In addition, using VADER, the authors developed classifiers having more higher performance than the models that did not remove inconsistencies between user’ reviews and user satisfaction.
2.1 Metaverse and Ubiquitous Computing
The metaverse and ubiquitous computing are closely related in different fields. Tang [3] suggested that metaverse could be used in educational systems accessible everywhere to provide beneficial experiences for students. Erdem and Şeker [4] discovered that smart tourism was developing along with the expansion of ubiquitous computing and metaverse systems. This is because metaverse technology provides a personalized experience. In addition, these technologies have helped increase satisfaction through interconnected connections between tourists and community members. Therefore, both tourists and community residents have improved their lives and have experienced sustainability. Regarding the metaverse technology, in museum exhibition contents, the audience can have a good sight from any place [19]. Therefore, metaverse technology is one of the main factors that make ubiquitous computing possible.
2.2 Previous Studies on User Experience (Satisfaction) and Online Review
Predicting user satisfaction is an important task for various businesses [20]. Considering the importance of users’ feedback, several researchers frequently used questionnaires to analyze user satisfaction [21–23]. Zviran et al. [21] employed exploratory factor analysis (EFA) to identify the factors influencing user satisfaction, using survey data from 359 respondents. Alawneh et al. [22] used factor analysis and multiple linear regressions with survey data from 400 staff members to evaluate the factors related to satisfaction. By using UMUX-Lite and SUS models, Korableva et al. [23] evaluated user satisfaction with data from 60 respondents. To predict user satisfaction, Xu et al. [24] introduced Technology Acceptance Method (TAM) based on 426 survey questionnaires. Alalwan [10] also utilized online questionnaire surveys from 500 smartphone users, proposing a UTAUT2 model that analyzed customer satisfaction. In previous studies, user satisfaction was mainly analyzed and predicted by survey instruments, which did not consider the big data approach.
To overcome previously mentioned limitations, online reviews in customer evaluation can consider quality data as big data [16]. Nwakanma et al. [25] indicate that online reviews are used to predict user satisfaction. This can help when receiving feedback from users for products and services. Online reviews contain the emotions and intentions of customers about products and services [26].Zhou et al. [27] suggest that an online review is related to users’ assessment, which helps future consumers to purchase products or services. Moreover, marketers in various fields (e.g., health care, restaurant, and hotel service) understand that analyzing online reviews is important for increasing products or services’ success [17,28–30]. Furthermore, Chen et al. [31] demonstrated that online reviews could be used to predict user satisfaction and to improve service quality. Therefore, it can be an appropriate approach because online reviews contain a viewpoint of user satisfaction.
2.3 Machine Learning and User Experience
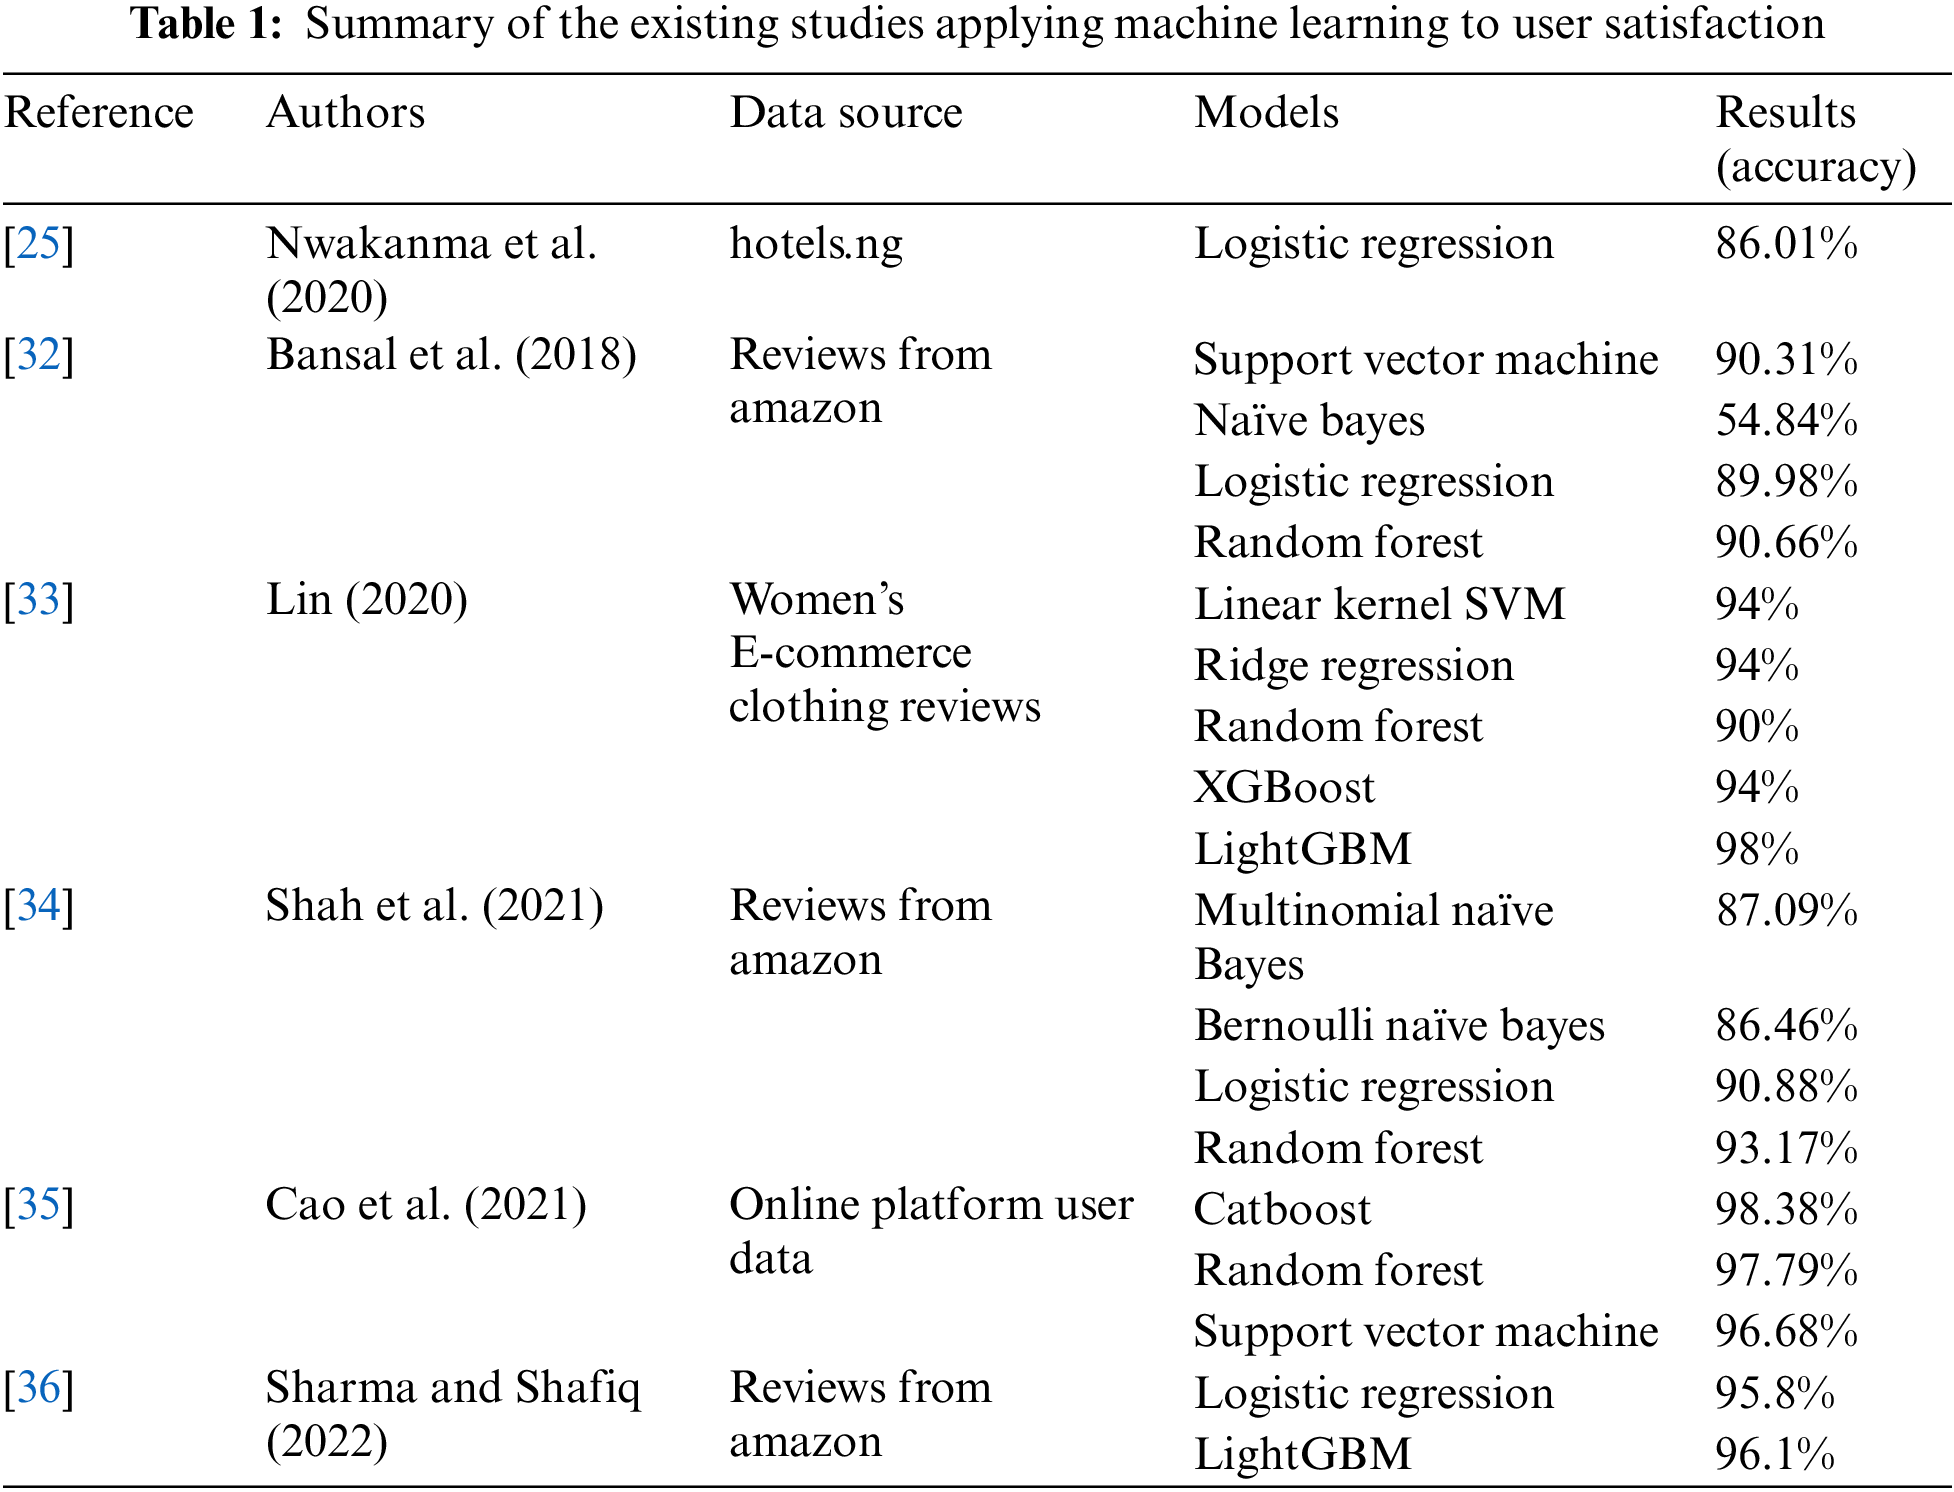
Considering online review data, the user satisfaction classifier model (e.g., Logistic Regression) was suggested by Nwakanma et al. [25]. Moreover, several machine learning models were proposed as approaches to the prediction of user satisfaction. Furthermore, accurate results have been obtained by employing machine learning technology when investigating user satisfaction. Tab. 1 summarizes the studies on user satisfaction, which have applied machine learning to numerous service areas. Considering e-commerce, Bansal et al. [32] adopted machine learning models (e.g., Naïve Bayes, Logistic Regression, Support Vector Machine, and Random Forest) as user satisfaction classifiers. Considering their study, Random Forest had the highest accuracy (90.66%) and Naïve Bayes had the lowest accuracy (54.84%). Similarly, Lin [33] experimented with XGBoost and LightGBM machine learning and various models (e.g., Support Vector Machine, Random Forest, and Logistic Regression) in the Women’s clothing online market. LightGBM had the highest accuracy (98%). Shah et al. [34] compared machine learning models (Support Vector Machine, Decision Trees, Naïve Bayes, and Logistic Regression) in Amazon Product reviews. The accuracy of Random Forest (93.17%) and Logistic Regression (90.88%) had better performances than the other models. Cao et al. [35] developed prediction models (Catboost, Random Forest, Support Vector Machine) for users’ online purchasing behavior. Catboost had the best accuracy (98.38%), compared to other models. Sharma and Shafiq [36] utilized online reviews for building models that are able to predict purchase intentions on the basis of information related to service experience. As a result, LightGBM had a better performance (96.1%) than Logistic Regression (95.8%). Applying machine learning by considering user experience can be useful for predicting user satisfaction and for identifying the appropriate development direction in several domains.
The authors collected 4,783,669 user review data from the RoBlox application in Google play store. The dataset is composed of three metadata that have textual reviews, star ratings, and dates (from June 19, 2014 to November 23, 2021).
To compose sentiment classifiers based on machine learning, star ratings were chosen as a feature as offered by previous study [37]. Moreover, previous study has shown a tendency of considering reviews with four or five out of five stars as positive reviews and those with less than three stars as negative reviews. Following Li et al. [37], the reviews that have three-star ratings were eliminated, analyzing the data with three stars out of five as neither positive nor negative.
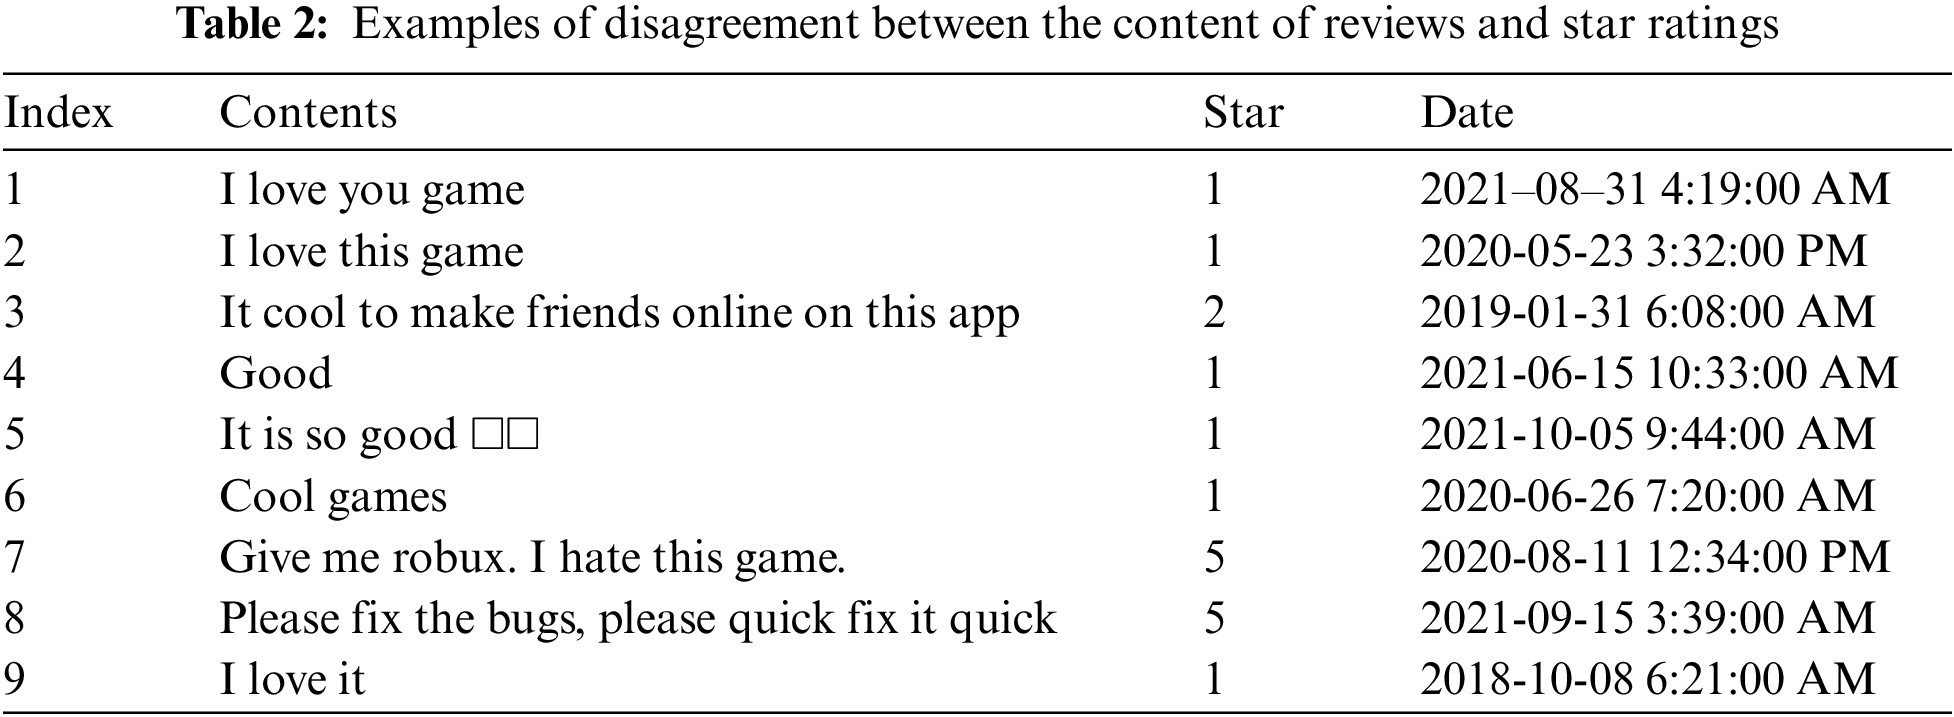
However, the sentiments revealed in online reviews are sometimes not congruent with star ratings. There are two kinds of such cases. The first is where the reviews in writing show saliently positive sentiment; nonetheless, the reviewer awards a low star rating. The second is where the reviews in writing have negative sentiments; however, the reviewer assigns a high star rating (Tab. 2).
These cases can hinder the performance of sentiment classifiers based on the machine learning models [38]. To remove these cases, the authors used the VADER by Hutto et al. [39].
The VADER is introduced by Hutto et al. [39] as a rule-based model for broad sentiment analysis. Moreover, its efficiency can be measured by comparing it to classical methods such as Affective Norms for English Words (ANEW), Linguistic Inquiry and Word Count (LIWC), SentiWordNet, and machine learning algorithms. Elbagir et al. [40] classified tweets on the 2016 US election. The results showed great accuracy in distinguishing classes. Furthermore, Borg et al. [41] investigated sentiment analysis using e-mails from customers. Because the dataset did not have any sentiment information, they utilized VADER for the labeling of emails. They indicated predictable features in email communication. Therefore, VADER has a discrimination against LIWC or previous lexicon-based methods because it is more sensitive to emotions in social media contents. Therefore, the authors adjusted the VADER for examining the sentiment of user reviews and eliminating disagreement cases between texts and star ratings. Consequently, it is possible to build an honest and unbiased predictable machine learning model.
Considering this process, SentimentIntensityAnalyzer in the Natural Language Toolkit (NLTK) of Python library was used to examine positive and negative indices and to calculate the total sentiment index (i.e., compound). Positive, negative, and neutral sentiments are determined by a compound score. This study labels the positive (compound value greater than or equal to 0.05), negative (compound value less than or equal to −0.05), and neutral (compound value between −0.05 and 0.05) reviews.
Subsequently, regular expressions using the Python library were applied to delete special symbols. In addition, NLTK was used to eliminate the stop-words and to extract lemmatization. extract lemmatization and to remove the stop-words in NLTK.
Additionally, the authors assigned different training dataset for the data group which applied VADER (Group 1) and for the other data group which did not apply VADER (Group 2). The training set for Group 1 consisted of the same values of star rating and VADER. Data with incongruent values were excluded from the training set. Group 2 did not have any exclusion. To evaluate the results, the authors assigned sentiment labels (positive: 1, negative: 0) to the 21,440 test dataset (Fig. 1).

Figure 1: Diagram of the total process
Considering a balanced distribution of the training set with VADER (positive: 314,627 and negative: 155,084) and without VADER (positive: 4,306,104 and negative: 384,767), down-sampling was performed as suggested by Liu et al. [42]. Consequently, the count of the positive and negative review data became identical. The training set with VADER (positive: 155,084 and negative: 155,084) and without VADER (positive: 384,767 and negative: 384,767) had a balanced distribution.
3.4 Text Feature Vectorization
In the process of applying classification algorithms, it is important to perform appropriate embedding processing in various fields. For example, watermark embeddings are used for analyzing medical audio data or to analyze image data [43,44]. In this study, the authors utilized the traditional embedding (BoW, TF-IDF) that have been employed in the field of natural language processing and the recently developed embedding (Word2Vec).
Expression methodologies for processing natural languages such as bag-of-words (BoW), term frequency-inverse document frequency (TF-IDF) [45], and Word2Vec [46], were adjusted for selecting the representation features from the text data as proposed by Krouska et al. [47]. These methods are performed to find the appropriate features of the classifiers.
Bag-of-Words transforms text data in a digitization expression method for adjusting machine learning models. These features were achieved by employing the count vectorizer module in scikit-learn, a Python library.
Frequency-inverse document frequency expresses the conciseness of a word in a certain document when a document group combines numerous documents [45]. This is the value obtained by multiplying TF and IDF. Term-frequency (TF) indicates the value that informs the frequency of a certain word within a document, and IDF is the relative frequencies applicable to a set of documents.
The vector W based on a document (d) is set by a product of the statistics TF (t, d) and DF(t). The term frequency (TF) is a word count (t) that occurs in document (d). The document frequency (DF) is the number of documents where the particular word (t) comes. The inverse document frequency (t) is obtained by document frequency.
When inverse document frequency about a word (IDF) emerges in a small number of documents, it has a high value. Moreover, it has low value when it appears in large documents. The word feature W is computed as a dot product [48]. Therefore, TF-IDF features are attained by applying the Tfidf Vectorizer module in scikit-learn.
Word2Vec was developed by Mikolov et al. [46]. Word2Vec is based on the distribution hypothesis that words appearing in similar contexts have similar meanings. When words in a text are vectorized based on the distribution hypothesis, vectors of similar words have similar vector values. Thus, Word2Vec is a way to learn to express the meaning of words by dispersing words in multiple dimensions of a vector. The Word2Vec is classified into two learning methodologies: Continuous Bag of Words (CBOW) and Skip-gram. The Skip-gram has a better performance than CBOW overall [49,50]. Therefore, the authors used a Skip-gram model. The Skip-gram is a method of predicting surrounding words using a central word:
where Q is a training complexity of the Skip-gram model, and C is the maximum distance of the words. Moreover, V is the size of the vocabulary, and D is the word representations. Word2Vec features were obtained from the gensim module in a Python library.
3.5 Machine Learning for Classification
The authors used five machine learning classifiers (Naïve Bayes, K-Nearest Neighbor, Logistic Regression, LightGBM, and Catboost) and three embedding methods (BoW, TF-IDF, and Word2Vec) with 5-fold cross validation. Furthermore, the grid search, which is supported in the scikit-learn package, was utilized for optimizing the hyperparameters [51].
The Naïve Bayes classifier is a conditional probability model universally used for text classification. Considering the Naïve Bayes classifier based on Bayes’ theorem, each attribute is expected to be independent [52]:
where P(A|B) is the posterior probability, P(B) is the evidence, P(A) is the prior probability, and P(B|A) is the likelihood. The Naïve Bayes model was applied with the scikit-learn package in Python.
3.5.2 K-Nearest Neighbor (KNN)
The K-Nearest Neighbor (KNN) is a supervised learning and non-parametric algorithm. Because of KNNs’ simplicity and effectiveness, KNN is one of the most widely used classifiers [53,54]. Moreover, KNN employs a similarity function that arranges data points based on their closeness to their neighbors [55]. To calculate the distance between data points, the Euclidean distance is operated in the KNN algorithm. The related formula is as follows:
where d indicates the distance, and x and y are separate data points. The KNN model was built using the scikit-learn package in Python.
Logistic Regression was introduced by Cox [56]. Logistic Regression expresses the relationship between dependent and independent variables as a specific function. This is used for the predictive models. Particularly, it is applied to a binary problem [57]. Logistic Regression is a continuous and increasing function and has a value ranging from zero to one.
The Logistic Regression model was set up using the scikit-learn package in Python.
3.5.4 Light Gradient Boosting Machine (LightGBM)
The LightGBM is an advanced machine learning model for improving the computational complexity and out of memory [58]. Regarding the training process, when creating trees, the LightGBM classifier uses a leaf-wise method as it moves into the deeper layers. Therefore, low memory is used, and high performance was achieved. The LightGBM classifier was constructed using the lightgbm library in Python.
3.5.5 Categorical Boosting Algorithm (Catboost)
Catboost is a kind of gradient boosting algorithms which can deal with categorical data. Catboost could perform a random permutation of the data and compute the mean of label value for the data with identical category value. Catboost alleviates overfitting and lowers the loss function in the process of iteration [35,59]. The Catboost classifier was from the catboost library in Python.
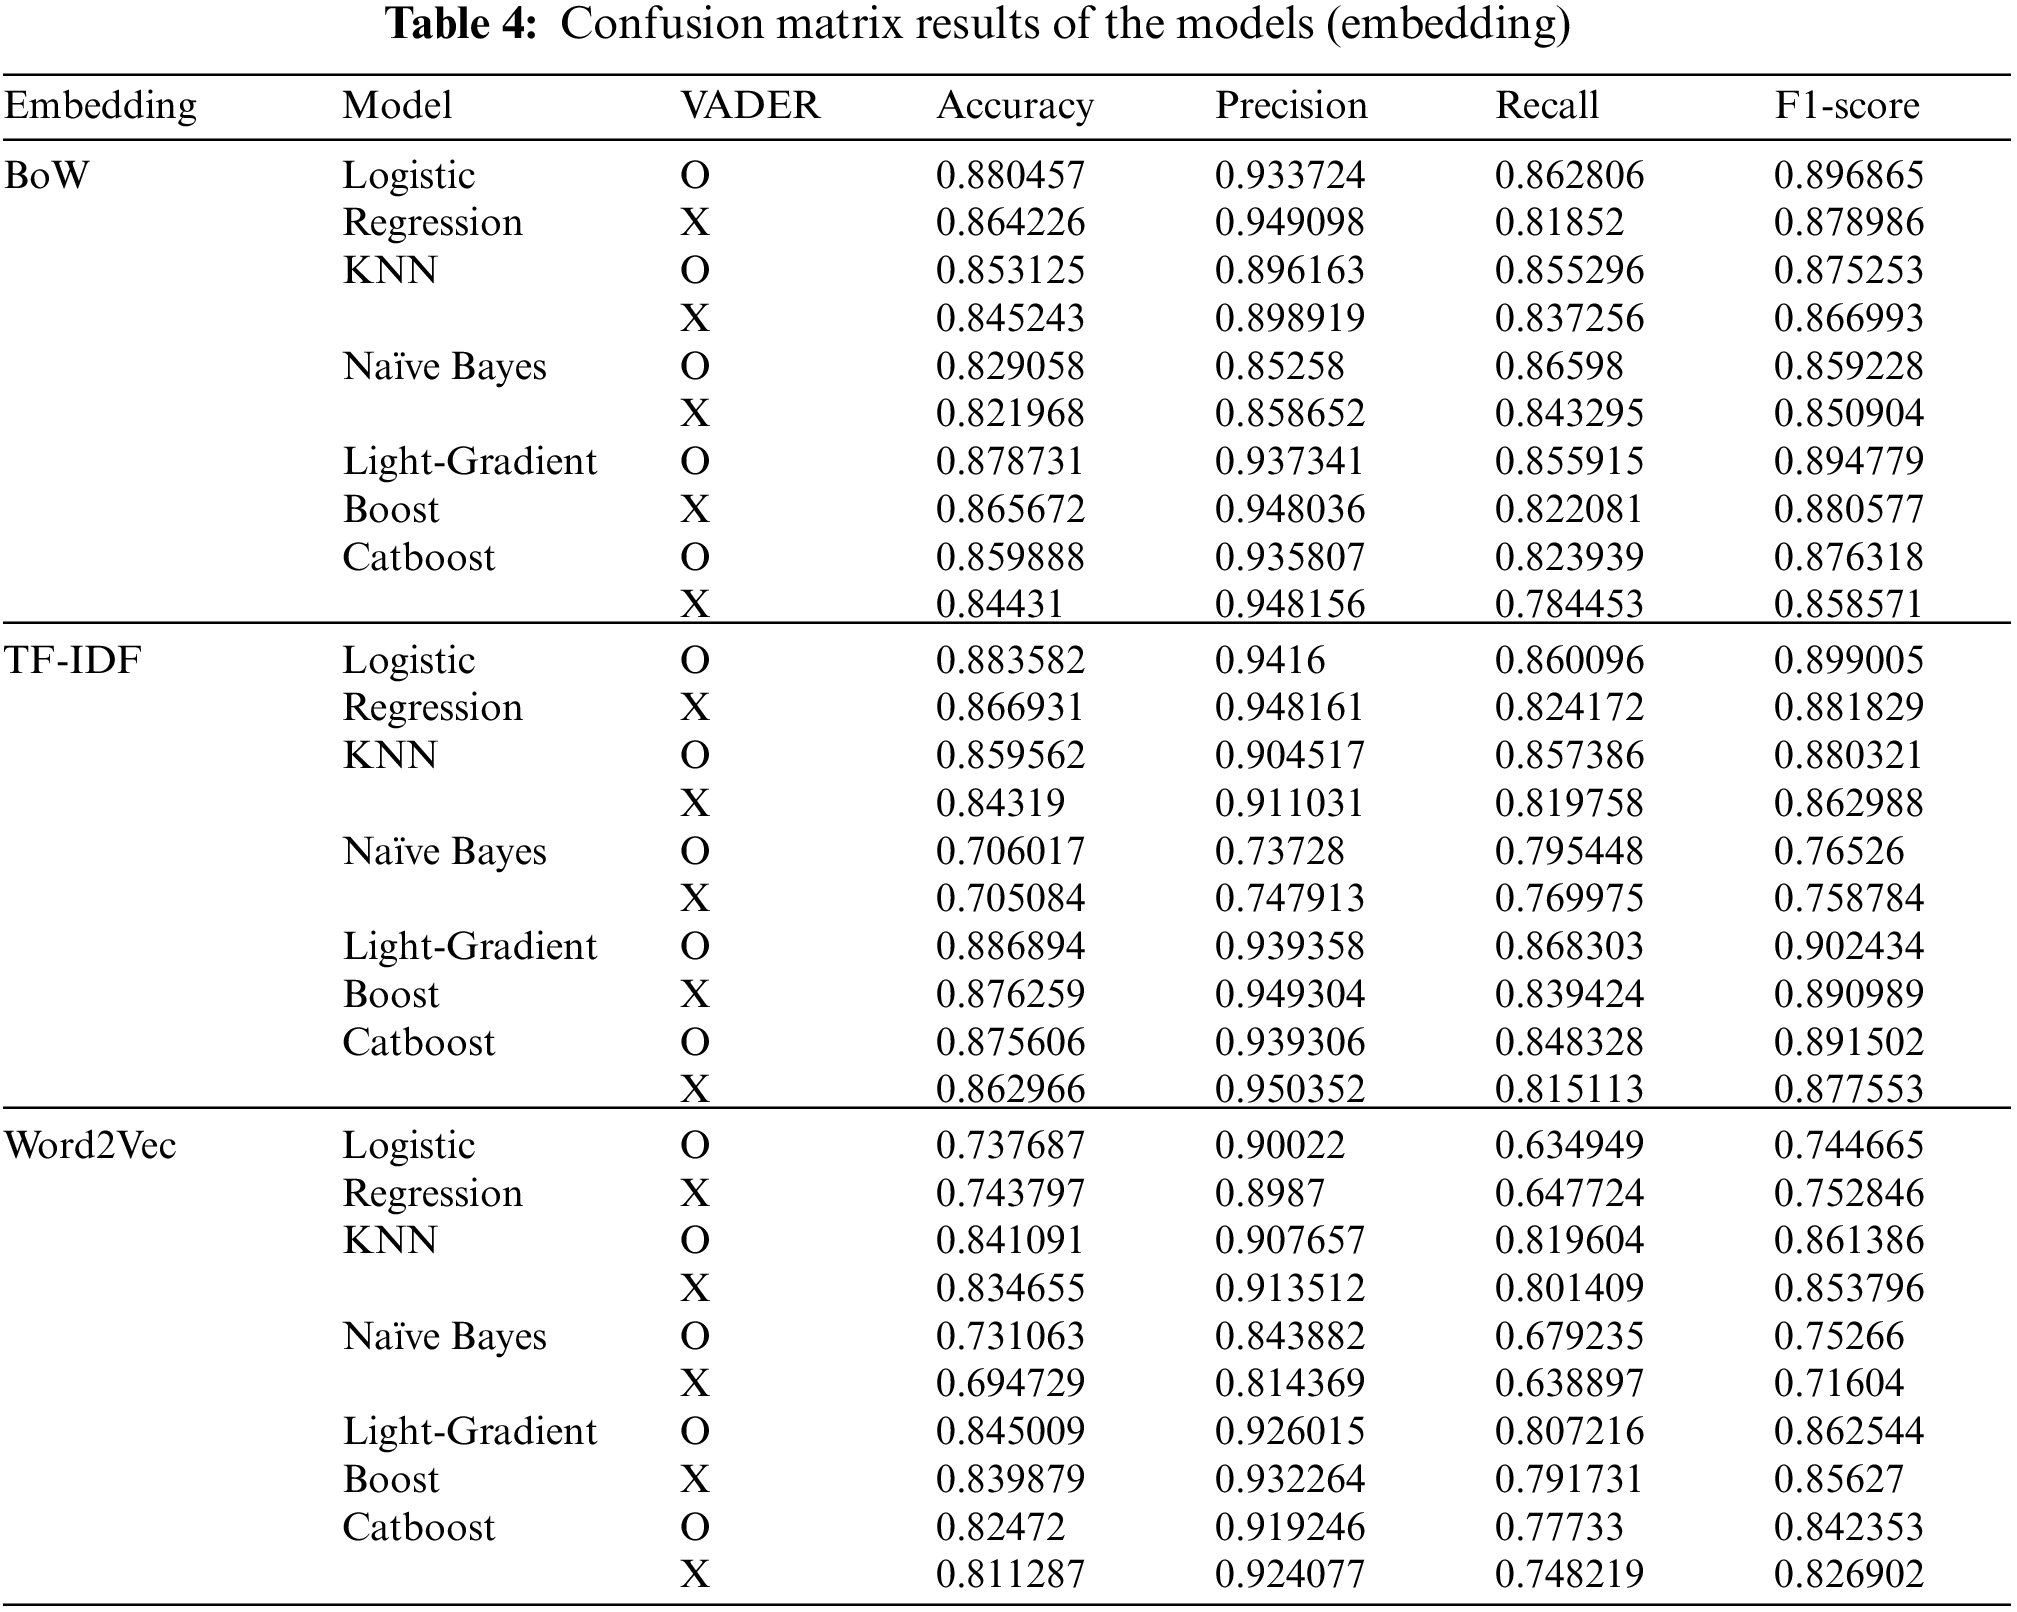
Considering the instruction of Visa et al. [60], the prediction consequences of the classifiers were effectuated by implementing a confusion matrix (Tab. 3): precision [Eq. (7)], recall [Eq. (8)], accuracy [Eq. (9)], and F1-score [Eq. (10)]. Consequently, the LightGBM classifier using the TF-IDF generated the highest accuracy with 88.68%. The Logistic regression with TF-IDF (88.35%) achieved a relatively high accuracy. Moreover, the TF-IDF method appeared to have a relatively superior performance, compared to BoW and Word2Vec. Excluding one (Logistic Regression with Word2Vec) of the 15 models, all the models to which VADER was applied showed a high performance. The summary of the occurrence results is described in Figs. 2, 3, and Tab. 4.
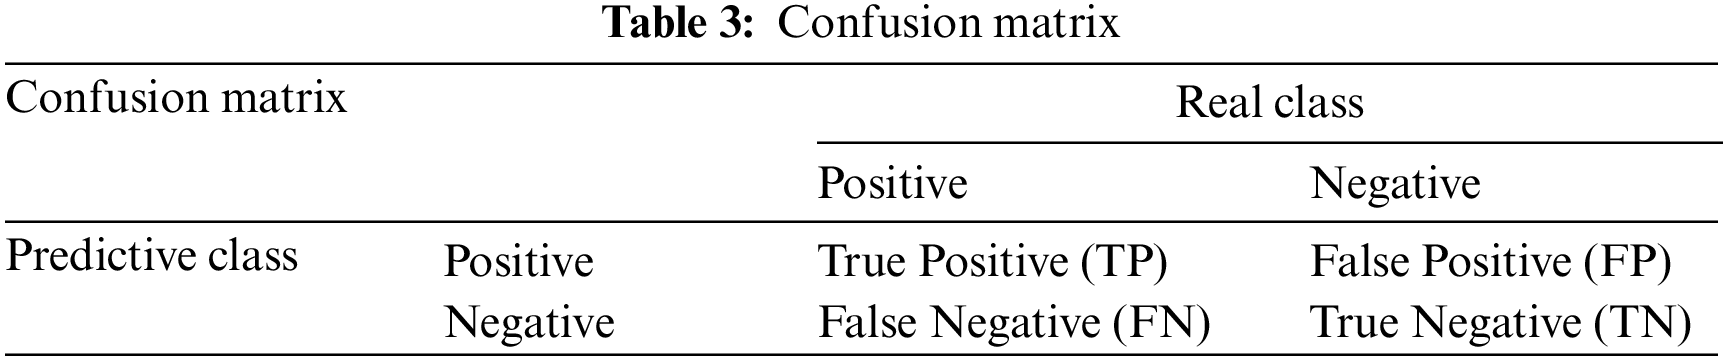

Figure 2: Accuracy of the models (embedding) with VADER applied

Figure 3: Accuracy of models (embedding) without VADER applied
The ubiquitous market is developing with the expansion of the mobile application market and metaverse technology [61]. Considering these tendencies, various fields try to improve the user experience [62]. This improvement of user experience has become an important factor in increasing user satisfaction [7]. To predict user satisfaction, previous studies approached the traditional method (e.g., SEM) with a limited number of samples [12,13]. This study considers this drawback by providing the optimal machine learning with big data. Five sentiment classifiers based on machine learning with three embedding methods were utilized. In addition, to remove the inconsistency between the sentiment of the star ratings and the review text, VADER was used. Therefore, the optimal machine learning model (LightGBM with TF-IDF) with VADER had an 88.68% of accuracy.
This study contributes to relevant fields in two aspects. Methodologically, it utilized VADER for eliminating disagreement between start ratings and review contents and compared its results with traditional approaches. In addition, the current study comprehensively reviewed extant studies on predicting user satisfaction from online reviews and enhanced the performance of related models.
This study has the following practical implications. Considering the results, LightGBM had a good performance both in the models without text disagreement and those with it. These outcomes can be used to develop an online review analysis platform in the field of metaverse systems such as Roblox. Additionally, in this study, TF-IDF and BoW are more appropriate than Word2Vec in representing words. Therefore, it is recommended to exclude Word2Vec embedding from the standpoint of a company that uses limited resources and human resources for building the sentiment classifier.
Theoretically, this study presents that user satisfaction can be predicted through user-based texts such as online reviews. Because online reviews and user satisfaction are closely related to application service [31], this perspective is important. Therefore, our methodologies can help service providers to select the right service for users even when only reviews without star ratings are available. Particularly, our methodologies provide insights into how reviews on applications can be used for data analysts. Therefore, the results of this study are helpful in understanding users’ perceptions of metaverse-related services.
The current study has some limitations that need to be resolved in the future. First, Google play store does not offer users’ personal information. Thus, the current study cannot examine age or nationality in its analysis. Second, this study analyzes one mobile metaverse application for observing user satisfaction. Therefore, it is required to confirm the methodology in relation to other metaverse applications. Third, this study employs English data. Hence, future studies can examine data in various languages.
Acknowledgement: We would like to thank Editage (https://www.editage.co.kr) for English language editing.
Funding Statement: This study was supported by a National Research Foundation of Korea (NRF) (http://nrf.re.kr/eng/index) grant funded by the Korean government (NRF-2020R1A2C1014957).
Conflicts of Interest: The authors declare that they have no conflicts of interest to report regarding the present study.
1. Hankookilbo. (2022). Available: https://m.hankookilbo.com/News/Read/A2022011413230003736. [Google Scholar]
2. S. N. Suzuki, H. Kanematsu, D. M. Barry, N. Ogawa, K. Yajima et al., “Virtual experiments in metaverse and their applications to collaborative projects: The framework and its significance,” Procedia Computer Science, vol. 176, pp. 2125–2132, 2020. [Google Scholar]
3. Y. Tang, “Help first-year college students to learn their library through an augmented reality game,” The Journal of Academic Librarianship, vol. 47, no. 1, pp. 102294, 2021. [Google Scholar]
4. A. Erdem and F. Şeker, “Tourist experience and digital transformation,” in Research on Digital Communications, Internet of Things, and the Future of Cultural Tourism, IGI Global, pp. 103–120, 2022. [Online]. Available: https://www.igi-global.com/chapter/tourist-experience-and-digital-transformation/295499. [Google Scholar]
5. L. H. Lee, T. Braud, P. Zhou, L. Wang, D. Xu et al., “All one needs to know about metaverse: A complete survey on technological singularity, virtual ecosystem, and research agenda,” 2021. [online]. Available: https://arxiv.org/pdf/2110.05352. [Google Scholar]
6. M. Yavuz, E. Çorbacıoğlu, A. N. Başoğlu, T. U. Daim and A. Shaygan, “Augmented reality technology adoption: Case of a mobile application in Turkey,” Technology in Society, vol. 66, pp. 101598, 2021. [Google Scholar]
7. J. Jang and M. Y. Yi, “Modeling user satisfaction from the extraction of user experience elements in online product reviews,” in Proc. of the 2017 CHI Conf, Extended Abstracts on Human Factors in Computing Systems, New York, NY, USA, pp. 1718–1725, 2017. [Google Scholar]
8. M. Alameri, O. Isaac and A. Bhaumik, “Factors influencing user satisfaction in UAE by using internet,” Published in International Journal on Emerging Technologies, vol. 10, pp. 8–15, 2019. [Google Scholar]
9. O. Isaac, Z. Abdullah, T. Ramayah, A. M. Mutahar and I. Alrajawy, “Integrating user satisfaction and performance impact with technology acceptance model (TAM) to examine the internet usage within organizations in Yemen,” Asian Journal of Information Technology, vol. 17, no. 1, pp. 60–78, 2018. [Google Scholar]
10. A. A. Alalwan, “Mobile food ordering apps: An empirical study of the factors affecting customer e-satisfaction and continued intention to reuse,” International Journal of Information Management, vol. 50, pp. 28–44, 2020. [Google Scholar]
11. A. Bilgihan, S. Seo and J. Choi, “Identifying restaurant satisfiers and dissatisfiers: Suggestions from online reviews,” Journal of Hospitality Marketing & Management, vol. 27, no. 5, pp. 601–625, 2018. [Google Scholar]
12. Q. Wang, M. S. Khan and M. K. Khan, “Predicting user perceived satisfaction and reuse intentions toward massive open online courses (MOOCs) in the COVID-19 pandemic: An application of the UTAUTmodel and quality factors,” International Journal of Research in Business and Social Science (2147–4478), vol. 10, no. 2, pp. 1–11, 2021. [Google Scholar]
13. Y. Choi, L. Zhang, J. Debbarma and H. Lee, “Sustainable management of online to offline delivery apps for consumers’ reuse intention: Focused on the meituan apps,” Sustainability, vol. 13, no. 7, pp. 3593, 2021. [Google Scholar]
14. L. Caggiani, R. Camporeale, M. Marinelli and M. Ottomanelli, “User satisfaction based model for resource allocation in bike-sharing systems,” Transport Policy, vol. 80, pp. 117–126, 2019. [Google Scholar]
15. E. Bran, E. Bautu, D. F. Sburlan, C. M. Puchianu and D. M. Popovici, “Ubiquitous computing: Driving in the intelligent environment,” Mathematics, vol. 9, no. 21, pp. 2649, 2021. [Google Scholar]
16. R. Filieri and M. Mariani, “The role of cultural values in consumers’ evaluation of online review helpfulness: A big data approach,” International Marketing Review, vol. 38, no. 6, pp. 1267–1288, 2021. [Google Scholar]
17. G. S. Budhi, R. Chiong, I. Pranata and Z. Hu, “Using machine learning to predict the sentiment of online reviews: A new framework for comparative analysis,” Archives of Computational Methods in Engineering, vol. 28, no. 4, pp. 2543–2566, 2021. [Google Scholar]
18. Morningbrew (2021) Available: https://www.morningbrew.com/emerging-tech/stories/2021/12/10/roblox-s-metaverse-is-already-here-and-it-s-wildly-popular?__cf_chl_f_tk=bW9ZlaKBo6FifDmmzwoyj_3hONdNjXSpDdl2CjFDQW4-1642433680-0-gaNycGzNCKU. [Google Scholar]
19. H. S. Choi and S. H. Kim, “A content service deployment plan for metaverse museum exhibitions—centering on the combination of beacons and HMDs,” International Journal of Information Management, vol. 37, no. 1, pp. 1519–1527, 2017. [Google Scholar]
20. H. S. Choi and S. Leon, “An empirical investigation of online review helpfulness: A big data perspective,” Decision Support Systems, vol. 139, pp. 113403, 2020. [Google Scholar]
21. M. Zviran, C. Glezer and I. Avni, “User satisfaction from commercial web sites: The effect of design and use,” Information & Management, vol. 43, no. 2, pp. 157–178, 2006. [Google Scholar]
22. A. Alawneh, H. Al-Refai and K. Batiha, “Measuring user satisfaction from e-government services: Lessons from Jordan,” Government Information Quarterly, vol. 30, no. 3, pp. 277–288, 2013. [Google Scholar]
23. O. Korableva, T. Durand, O. Kalimullina and I. Stepanova, “Studying user satisfaction with the MOOC platform interfaces using the example of coursera and open education platforms,” in Proc. of the 2019 Int. Conf. on Big Data and Education, New York, NY, USA, pp. 26–30, 2019. [Google Scholar]
24. F. Xu and J. T. Du, “Factors influencing users’ satisfaction and loyalty to digital libraries in Chinese universities,” Computers in Human Behavior, vol. 83, pp. 64–72, 2018. [Google Scholar]
25. C. I. Nwakanma, M. S. Hossain, J. M. Lee and D. S. Kim, “Towards machine learning based analysis of quality of user experience (QoUE),” International Journal of Machine Learning and Computing, vol. 6, no. 10, pp. 752–758, 2020. [Google Scholar]
26. A. Ahani, M. Nilashi, E. Yadegaridehkordi, L. Sanzogni, A. R. Tarik et al., “Revealing customers’ satisfaction and preferences through online review analysis: The case of canary islands hotels,” Journal of Retailing and Consumer Services, vol. 51, pp. 331–343, 2019. [Google Scholar]
27. F. Zhou, J. Ayoub, Q. Xu and X. Jessie Yang, “A machine learning approach to customer needs analysis for product ecosystems,” Journal of Mechanical Design, vol. 142, no. 1, pp. 011101, 2020. [Google Scholar]
28. S. S.8 Jia, “Motivation and satisfaction of Chinese and US tourists in restaurants: A cross-cultural text mining of online reviews,” Tourism Management, vol. 78, pp. 104071, 2020. [Google Scholar]
29. C. E. Yu, “Humanlike robots as employees in the hotel industry: Thematic content analysis of online reviews,” Journal of Hospitality Marketing & Management, vol. 29, no. 1, pp. 22–38, 2020. [Google Scholar]
30. M. A. Qureshi, M. Asif, M. F. Hassan, G. Mustafa, M. K. Ehsan et al., “A novel auto-annotation technique for aspect level sentiment analysis,” CMC-Computers Materials & Continua, vol. 70, no. 3, pp. 4987–5004, 2022. [Google Scholar]
31. Z. S. Chen, X. L. Liu, K. S. Chin, W. Pedrycz, K. L. Tsui et al., “Online-review analysis based large-scale group decision-making for determining passenger demands and evaluating passenger satisfaction: Case study of high-speed rail system in China,” Information Fusion, vol. 69, pp. 22–39, 2021. [Google Scholar]
32. B. Bansal and S. Srivastava, “Sentiment classification of online consumer reviews using word vector representations,” Procedia Computer Science, vol. 132, pp. 1147–1153, 2018. [Google Scholar]
33. X. Lin, “Sentiment analysis of e-commerce customer reviews based on natural language processing,” in Proc. of the 2020 2nd Int. Conf. on Big Data and Artificial Intelligence, Johannesburg, South Africa, pp. 32–36, 2020. [Google Scholar]
34. B. K. Shah, A. K. Jaiswal, A. Shroff, A. K. Dixit, O. N. Kushwaha et al., “Sentiments detection for Amazon product review,” in Proc. of the 2021 Int. Conf. on Computer Communication and Informatics, Coimbatore, India, pp. 1–6, 2021. [Google Scholar]
35. W. Cao, K. Wang, H. Gan and M. Yang, “User online purchase behavior prediction based on fusion model of CatBoost and logit,” In Journal of Physics: Conference Series, IOP Publishing, vol. 2003, no. 1, pp. 012011, 2021. [Google Scholar]
36. A. Sharma and M. O. Shafiq, “A comprehensive artificial intelligence based user intention assessment model from online reviews and social media,” Applied Artificial Intelligence, pp. 1–26, 2022. [Online]. Available: https://www.tandfonline.com/doi/full/10.1080/08839514.2021.2014193. [Google Scholar]
37. C. Li and J. Zhang, “Prediction of yelp review star rating using sentiment analysis,” Stanford CEE, 2014. [Online]. Available: https://cs229.stanford.edu/proj2014/Chen%20Li,%20Jin%20Zhang,%20Prediction%20of%20Yelp%20Review%20Star%20Rating%20using%20Sentiment%20Analysis.pdf. [Google Scholar]
38. R. ElShawi, Y. Sherif, M. Al-Mallah and S. Sakr, “Interpretability in healthcare: A comparative study of local machine learning interpretability techniques,” Computational Intelligence, vol. 37, no. 4, pp. 1633–1650, 2021. [Google Scholar]
39. C. Hutto and E. Gilbert, “Vader: A parsimonious rule-based model for sentiment analysis of social media text,” in Proc. of the Int. AAAI Conf. on Web and Social Media, Ann Arbor, Michigan, USA, vol. 8, no. 1, pp. 216–225, 2014. [Google Scholar]
40. S. Elbagir and J. Yang, “Twitter sentiment analysis using natural language toolkit and VADER sentiment,” in Proc. of the Int. Multiconference of Engineers and Computer Scientists, Kowloon, Hong Kong, vol. 122, pp. 16, 2019. [Google Scholar]
41. A. Borg and M. Boldt, “Using VADER sentiment and SVM for predicting customer response sentiment,” Expert Systems with Applications, vol. 162, pp. 113746, 2020. [Google Scholar]
42. Z. Liu, M. Qi, C. Shen, Y. Fang and X. Zhao, “Cascade saccade machine learning network with hierarchical classes for traffic sign detection,” Sustainable Cities and Society, vol. 67, pp. 102700, 2021. [Google Scholar]
43. X. R. Zhang, W. F. Zhang, W. Sun, X. M. Sun and S. K. Jha, “A robust 3-D medical watermarking based on wavelet transform for data protection,” Computer Systems Science & Engineering, vol. 41, no. 3, pp. 1043–1056, 2022. [Google Scholar]
44. X. R. Zhang, X. Sun, X. M. Sun, W. Sun and S. K. Jha, “Robust reversible audio watermarking scheme for telemedicine and privacy protection,” Computers, Materials & Continua, vol. 71, no. 2, pp. 3035–3050, 2022. [Google Scholar]
45. T. Joachims, “A probabilistic analysis of the rocchio algorithm with TF-IDF for text categorization,” in Proc. of the 14th Int. Conf. on Machine Learning, pp. 143–151, 1997. [Google Scholar]
46. T. Mikolov, K. Chen, G. Corrado and J. Dean, “Efficient estimation of word representations in vector space,” 2013. [online] https://arxiv.org/abs/1301.3781. [Google Scholar]
47. A. Krouska, C. Troussas and M. Virvou, “Deep learning for twitter sentiment analysis: The effect of pre-trained word embedding,” in Machine Learning Paradigms, Springer, Cham, pp. 111–124, 2020. [Google Scholar]
48. L. P. Jing, H. K. Huang and H. B. Shi, “Improved feature selection approach TFIDF in text mining,” in Proc. of the Int. Conf. on Machine Learning and Cybernetics, Beijing, China, vol. 2, pp. 944–946, 2002. [Google Scholar]
49. P. F. Muhammad, R. Kusumaningrum and A. Wibowo, “Sentiment analysis using word2vec and long short-term memory (LSTM) for Indonesian hotel reviews,” Procedia Computer Science, vol. 179, pp. 728–735, 2021. [Google Scholar]
50. S. H. Kumhar, M. M. Kirmani, J. Sheetlani and M. Hassan, “Word embedding generation for urdu language using word2vec model,” Materials Today: Proceedings, 2021. [Online]. Available: https://www.sciencedirect.com/science/article/pii/S2214785320394426. [Google Scholar]
51. K. Budholiya, S. K. Shrivastava and V. Sharma, “An optimized XGBoost based diagnostic system for effective prediction of heart disease,” Journal of King Saud University-Computer and Information Sciences, 2020. [Online]. Available: https://www.sciencedirect.com/science/article/pii/S1319157820304936. [Google Scholar]
52. E. Frank and R. R. Bouckaert, “Naive Bayes for text classification with unbalanced classes,” in Proc. of the European Conf. on Principles of Data Mining and Knowledge Discovery, Springer, Berlin, Heidelberg, Germany, pp. 503–510, 2006. [Google Scholar]
53. N. S. Altman, “An introduction to kernel and nearest-neighbor nonparametric regression,” The American Statistician, vol. 46, no. 3, pp. 175–185, 1992. [Google Scholar]
54. H. Arslan and H. Arslan, “A new COVID-19 detection method from human genome sequences using CpG island features and KNN classifier,” Engineering Science and Technology, an International Journal, vol. 24, no. 4, pp. 839–847, 2021. [Google Scholar]
55. M. F. M. J. Shamrat, S. Chakraborty, M. M. Imran, J. N. Muna, M. M. Billah et al., “Sentiment analysis on twitter tweets about COVID-19 vaccines using NLP and supervised KNN classification algorithm,” Indonesian Journal of Electrical Engineering and Computer Science, vol. 23, no. 1, pp. 463–470, 2021. [Google Scholar]
56. D. R. Cox, “The regression analysis of binary sequences,” Journal of the Royal Statistical Society: Series B (Methodological), vol. 20, no. 2, pp. 215–232, 1958. [Google Scholar]
57. S. H. Walker and D. B. Duncan, “Estimation of the probability of an event as a function of several independent variables,” Biometrika, vol. 54, no. 1–2, pp. 167–179, 1967. [Google Scholar]
58. G. Ke, Q. Meng, T. Finley, T. Wang, W. Chen et al., “Lightgbm: A highly efficient gradient boosting decision tree,” Advances in Neural Information Processing Systems, vol. 30, pp. 3146–3154, 2017. [Google Scholar]
59. L. Prokhorenkova, G. Gusev, A. Vorobev, A. V. Dorogush and A. Gulin, “CatBoost: Unbiased boosting with categorical features,” Advances in Neural Information Processing Systems, vol. 31, pp. 6639--6649, 2018. [Google Scholar]
60. S. Visa, B. Ramsay, A. L. Ralescu and E. Van Der Knaap, “Confusion matrix-based feature selection,” The Modern Artificial Intelligence and Cognitive Science Conf. vol. 710, pp. 120–127, 2011. [Google Scholar]
61. P. A. Rospigliosi, “Metaverse or simulacra? roblox, minecraft, meta and the turn to virtual reality for education, socialisation and work,” Interactive Learning Environments, vol. 30, no. 1, pp. 1–3, 2022. [Google Scholar]
62. H. Ureña-Madrigal, G. López, I. Díaz-Oreiro and L. Quesada, “A mobile application for improving the delivery process of notifications,” in Proc. of the Int. Conf. on Information Technology & Systems, Península de Santa Elena, Ecuador, pp. 361–371, 2021. [Google Scholar]
 | This work is licensed under a Creative Commons Attribution 4.0 International License, which permits unrestricted use, distribution, and reproduction in any medium, provided the original work is properly cited. |