DOI:10.32604/cmc.2022.028339
| Computers, Materials & Continua DOI:10.32604/cmc.2022.028339 | |
| Article |
Efficient Feature Selection and Machine Learning Based ADHD Detection Using EEG Signal
1School of Computer Science and Engineering, The University of Aizu, Aizuwakamatsu, Fukushima, 965-8580, Japan
2Faculty of Humanities and Social Science, Kumamoto University, Chuo-ku, Kumamoto, Japan
*Corresponding Author: Jungpil Shin. Email: jpshin@u-aizu.ac.jp
Received: 08 February 2022; Accepted: 16 March 2022
Abstract: Attention deficit hyperactivity disorder (ADHD) is one of the most common psychiatric and neurobehavioral disorders in children, affecting 11% of children worldwide. This study aimed to propose a machine learning (ML)-based algorithm for discriminating ADHD from healthy children using their electroencephalography (EEG) signals. The study included 61 children with ADHD and 60 healthy children aged 7–12 years. Different morphological and time-domain features were extracted from EEG signals. The t-test (p-value < 0.05) and least absolute shrinkage and selection operator (LASSO) were used to select potential features of children with ADHD and enhance the classification accuracy. The selected potential features were used in four ML-based algorithms, including support vector machine (SVM), k-nearest neighbors, multilayer perceptron (MLP), and logisticregression, to classify ADHD and healthy children. The overall prevalence of boys and girls with ADHD was 48.9% and 56.5%, respectively. The average age of children with ADHD was 9.6
Keywords: ADHD; feature extraction; feature selection; classification; machine learning
Attention deficit hyperactivity disorder (ADHD) is one of the most common psychiatric and neurobehavioral disorders in children. Children with ADHD face different difficulties, such as impulsivity, inattention, and hyperactivity [1]. The symptoms of ADHD develop in preschoolers and become more acute problems when they appear in school-aged children [2,3]. These symptoms have a negative impact on their academic activities, personal activities, and social activities, which last until adulthood [4,5]. Approximately 11% of children suffer from ADHD worldwide [3,6]. According to the CDC, 6.1 million children in the USA aged 2–17 years were affected by ADHD in 2016 [7]. Globally, 84.7 million people were also affected by ADHD in 2019 [8]. A higher prevalence of ADHD was found in boys than in girls [7,9]. It was noted that brain injury, genetic factors, drinking alcohol during pregnancy, premature delivery, and low birth weight were associated with ADHD [10,11]. If children with ADHD can be detected at an early stage, it can help the children to maintain their daily lives [12,13]. ADHD may have occurred due to changes in brain function. Various neurophysiological and neuroimaging methods were used to evaluate the differences in brain function of children with ADHD [14–18]. Electroencephalography (EEG) can be used to investigate brain activity with a high temporal resolution, low data recording costs, and a wide range of frequency bands [13,19]. Various research has already been done to discriminate ADHD from healthy children. In 1938, Jasper et al. published the first report of EEG in “child’s behavior problems” [20]. They considered 71 children (boys: 59 vs. girls: 12) aged 2–16 years to diagnose children’s behavior problems as early as possible. They discovered that 59.0% of children had abnormalities, 39.0% had electrical activity, and the remaining children had emotional and mental disturbance issues. EEG signals based on some indices can discriminate between abnormal children and those with learning disabilities [21]. Fonseca et al. [22] adopted relative and absolute power to determine epilepsy in children with ADHD. He collected 30 ADHD and 30 healthy children using EEG signals. He found that 10% of children with ADHD had epileptiform activities and greater power in theta and delta oscillations in all regions of their brain.
There are different linear and non-linear features used to diagnose ADHD [6,23]. Researchers have attempted to propose a technique that can automatically diagnose children who have ADHD. To meet these objectives, different machine learning (ML)-based algorithms have been used to identify these features to automatically diagnose ADHD [6,24,25]. The ERP trial averaging method was used to evaluate children with ADHD from EEG data in the time domain. Moreover, morphological features were used to analyze ADHD subjects in several studies [5,6]. The power of various EEG-based frequency bands was used to make a diagnosis of children with ADHD. Increasing theta power and a high theta/beta ratio in ADHD compared to healthy are the most consistent findings. The most consistent results were found due to the increased power of theta and a higher theta/beta ratio in ADHD compared to healthy children. Furthermore, different frequency domain features were also used to classify children as either having ADHD or healthy [26,27].
The current study extracted different morphological and time-domain features from EEG signals to classify children as ADHD or healthy. Then, we combined these combined features to discriminate children with ADHD from healthy children. First, the extracted features were evaluated using two feature selection methods (FSMs): t-test and least absolute shrinkage and selection operator (LASSO). Classifiers give lower performances due to irrelevant features. To improve the model’s performance, it is necessary to remove the irrelevant features of ADHD. To select the significant features for ADHD, various methods such as t-test [5], principal component analysis (PCA) [28], and minimum redundancy maximum relevance (mRMR) [25] were most commonly utilized.
In this study, two FSMs, t-test, and LASSO were used to select the most important potential features from the extracted features of ADHD. Then, these selected features were used in machine learning (ML)-based algorithms to classify children into ADHD and health. In the past, lots of ML-based classifiers such as support vector machine (SVM) [29], logistic regression (LR) [30], and k-nearest neighbor (k-NN) [6] were widely used for the prediction of children with ADHD. In the current study, four ML-based classifiers such as SVM, k-NN, multilayer perceptron (MLP), and LR were employed to classify children as ADHD or healthy. The aims of this were to (i) extract different types of features for ADHD from EEG signals; (ii) select the most potential features of ADHD; and (iii) propose an efficient ML-based system to classify children as either having ADHD or healthy.
The layout of the paper is as follows: Section 2 presents materials and methods that include data acquisition, feature extraction, feature selection methods, and different classification methods. Their performances are also discussed in this section. Section 3 presents the results. The discussion and conclusion are discussed in Section 4 and Section 5.
The proposed ML-based framework for the prediction of children with ADHD and healthy children is presented in Fig. 1. The study consists of seven steps. The first step is data acquisition from 121 children. The next step is data normalization to remove bias and then extract different kinds of morphological and time-domain features. The fourth step is to select the most important features of ADHD using two feature selection methods like the t-test and LASSO. We adopted leave-one-out cross-validation (LOOCV) and tuned the different hyperparameter values of the classifiers. Four ML-based classifiers, namely SVM, k-NN, MLP, and LR, have been employed to predict the children into ADHD vs. healthy. Finally, the performance scores of these classifiers were evaluated using accuracy (ACC), sensitivity (SE), specificity (SP), F1-score, and area under the curve (AUC).
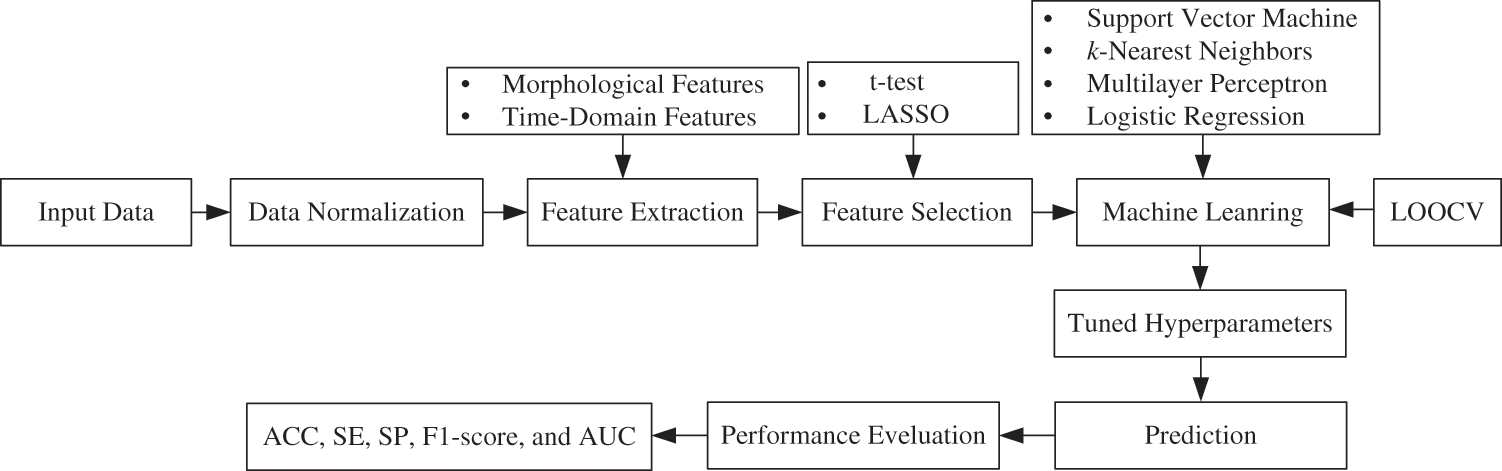
Figure 1: Proposed ML-based framework for the prediction of ADHD and healthy children
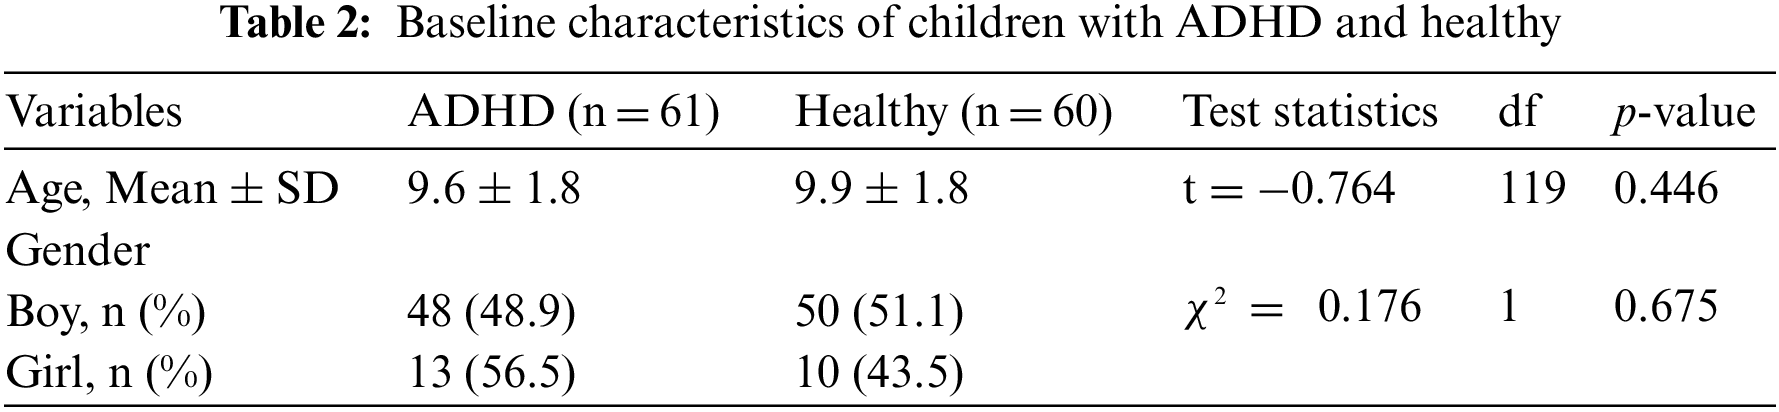
We utilized the ADHD database, which was publicly available online [31]. The database consisted of 121 participants (boys and girls, aged 7–12 years), with 61 children with ADHD and 60 healthy children. The database had 98 boys (ADHD: 48 vs. Healthy: 50) and 23 girls (ADHD: 13 vs. Healthy: 10). The children who had ADHD were diagnosed by a psychiatrist based on DSM-5 criteria. EEG recordings were made with 19 channels (Fz, Cz, Pz, C3, T3, C4, T4, Fp1, Fp2, F3, F4, F7, F8, P3, P4, T5, T6, O1, and O2) at 128 Hz sampling frequency. Since visual attention is one of the main deficits in children with ADHD, EEG recordings were captured based on visual attention tasks. The children were shown a set of images of cartoon characters and asked to count the characters. Each image included a different number of characters, ranging from 5 to 16, and the image sizes were large enough for the children to easily see and count. Each image was presented immediately and without interruption after the children’s responses were recorded to provide continuous stimulation during the recording’s signal. As a result, the length of time that EEG was recorded during this cognitive visual task was determined based on the children’s performance.
In this study, we used two types of feature extraction methods: (i) morphological features and (ii) time-domain features. We extracted different features based on each feature category from EEG signals. We discussed the calculation procedure of every feature from EEG signals as follows:
EEG signal is one kind of time series data. Different morphological features were calculated from EEG signals in the previous studies [6,10,32]. Let
Absolute amplitude: It is a method for extracting morphological features from EEG signals. It is mathematically defined as follows:
Positive area: It is also another method for extracting morphological features from EEG signals. It is mathematically defined as follows:
Negative area: It is calculated from EEG signals and mathematically defined as follows:
Total area: It is calculated from EEG signals by summing the positive and negative areas. It is mathematically defined as follows:
Peak to peak: The difference between the maximum value and minimum value of the EEG signals is called peak to peak. It is mathematically defined as follows:
We computed different statistical features from EEG signals. In this study, we calculated 13 statistical features from EEG signals as follows:
Mean: Mean is one of the common and easy feature extraction methods of the time-domain feature [6,33]. Let zt be the EEG signals. We calculated the mean of EEG signal over a sample length of the EEG signal. It is denoted by
Median: The median is the middlemost observation or halfway into the dataset. To calculate the median, we need to arrange the dataset in ascending or descending order of magnitude [34].
1st Quartile: The 1st quartile is defined as the middle number between the minimum and median of the dataset. To calculate the 1st quartile, we also ordered the dataset in ascending orders. It is also known as 25% of the dataset is below this point [34].
3rd Quartile: The 3rd quartile is defined as the middle value between the median and maximum of a dataset. It is known as 75% of the data lies below this point [34].
Standard deviation: Standard deviation is another statistical method for extracting time-domain features [6,33]. It is denoted
Coefficient of variation: The coefficient of variation (CV) is also another statistical measure for extracting time-domain features. CV is the ratio between the standard deviation (
Skewness: Skewness is a measure of the symmetry of an EEG signal [6,33]. It is mathematically defined as follows:
where,
Kurtosis: Kurtosis is also a measure of “tailedness” of a distribution relative to normal distribution. It is also another method for extracting time-domain features [6,33] which is mathematically defined as follows:
where,
Energy: The energy is also a feature extraction method of EEG signals [35,36]. It is mathematically defined as follows:
Power: Power is one kind for extracting time-domain features. It is mathematically defined as follows:
Hjorth parameter-activity: Hjorth parameter-activity [36] is also a method for extracting time-domain features of EEG signals. It is calculated based on the following formulae:
Hjorth parameter-mobility: Hjorth parameter-mobility [36] feature extraction method from EEG signals are calculated based on the following formulae:
Hjorth parameter-complexity: Hjorth parameter-complexity [36] feature extraction methods from EEG signals are calculated based on the following formulae:
After extracting features from EEG signals, we adopted two FSMs as (i) t-test and (ii) LASSO for the identification of potential features of children with ADHD. The descriptions of these two FSMs are explained in this section.
The t-test is a parametric test that evaluates the difference between two group means (ADHD vs. healthy). The test statistics for the t-test is given by
where,
LASSO stands for least absolute shrinkage and selection operator. In this study, we used LASSO-logistic regression for feature selection. We chose LR since the response variable used in this study had two categories: 1 for children with ADHD and 0 for healthy children. The conditional probability of children with ADHD given the input features Xi was computed as follows:
where
Therefore, we get
We adopt a maximum likelihood estimate to calculate the regression coefficients, and the log-likelihood function can be written as follows:
The above-mentioned LR model can now be extended into a LASSO-LR model by implementing an L1 constraint on B regression coefficients [37,38]. We have to minimize the following negative log-likelihood function with a penalty term:
We need to determine the optimum value of
After extracting features and identifying the important features of the children with ADHD, we applied four classifiers such as SVM, KNN, MLP, and LR to classify children as either having ADHD or healthy. The brief descriptions of these classifiers are described below.
SVM is one of the most robust ML-based predictive algorithms. It is mostly used for both classification and regression problems [39,40]. The main objective of SVM is to determine a hyperplane in n-dimensional space that can be used to classify the data points directly. During the training phase, it maximizes the distance between patterns and classes that can be easily separated using a hyperplane. If the pattern of the data points is not linearly separable, nonlinear kernels can be used. During the training phase, various types of kernels can be used in SVM. In this paper, we have used three types of kernels, such as linear, polynomial, and radial basis function (RBF) kernels.
Fix and Hodges first developed k-NN in 1951 [41]. Thomas Cover expanded this algorithm later in statistics [42] that is commonly used for regression and classification. This classifier does not need to make any assumptions about the data points. That is why it is called a non-parametric-based algorithm. This classifier is defined based on a distance metric between two data points. The distance was calculated using the Euclidean distance. In the training phase, k is user-defined, and the test set is classified by assigning the label that appears most frequently among the k training samples closest to that query point.
MLP is a supervised learning technique called back propagation [43]. It is also used for regression and classification [44]. It has three types of node layers, such as: (i) an input layer, (ii) a hidden layer, and (iii) an output layer. Each node, except the input node, is a neuron that utilizes a nonlinear activation function. It has some hyperparameters that are needed to estimate before training. These parameters are needed to tune to improve the classification accuracy. The settings of the hyperparameters are clearly explained in Section 3.4.
The statistical model of LR establishes a link between a dichotomous output variable and a set of predictor variables. It is used to estimate the probability of a certain class, such as: ADHD/healthy, diabetic/control, alive/dead based on logistic function. LR can be utilized for predicting different kinds of diseases like ADHD, diabetes [45,46], and heart disease. The logistic function is defined as follows:
where
2.5 Performances Evaluation Metrics
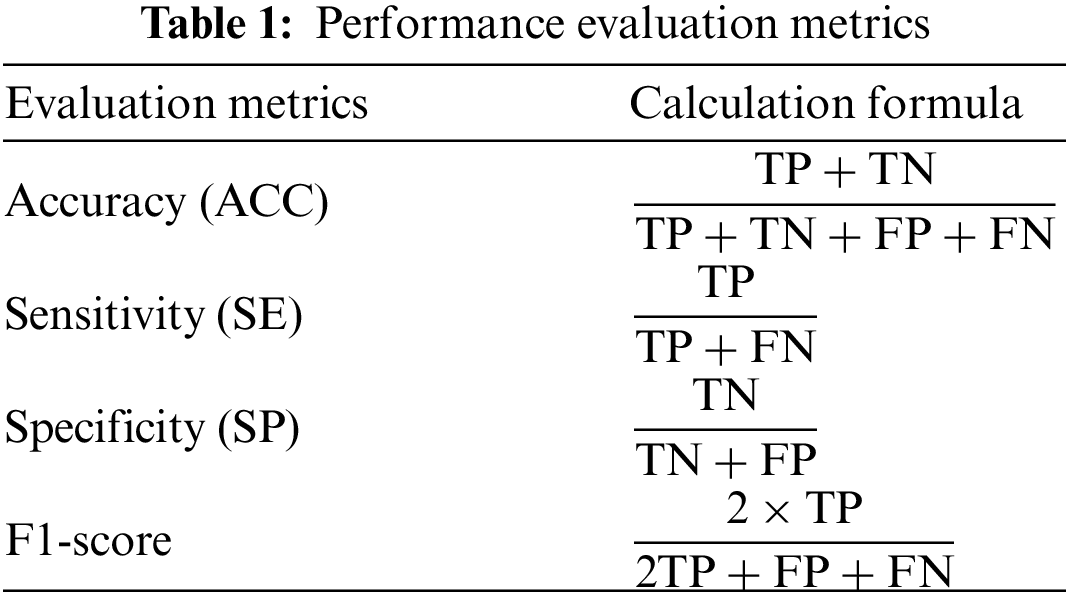
In this paper, we used four ML-based classifiers to classify children as ADHD and healthy using LOOCV. We used five evaluation metrics: ACC, SE, SP, F1-score, and AUC to evaluate the performance of ML-based classifiers. The ACC, SE, SP, and F1-score were calculated using true positive (TP), true negative (TN), false positive (FP), and false negative (FN), which are clearly explained in Tab. 1.
In this study, we adopted LOOCV protocols to evaluate the performance of classifiers. For this experiment, R-programming language is used. The version of R used is 4.1.2. As the operating system, windows 10 version 21H1 (build 19043.1151) 64 bit is used. As hardware, Intel(R) Core (TM) i5-10400 with 16 GB RAM setup is used.
3.2 Baseline Characteristics of ADHD and Healthy Children
The average age of ADHD and healthy children was 9.6
A total of 342 features from 95 morphological (19 channels
3.4 Parameter Tuning of Classifiers
In this work, we used four classifiers namely, SVM, k-NN, MLP, and LR for predicting children with ADHD. The three classifiers (SVM, k-NN, and MLP) had some parameters, called hyperparameters. We tuned these hyperparameters using the grid search method. There are some hyperparameters for the three kernels of SVM, such as cost (C) for linear; cost (C), degree, and scale for polynomial; and cost (C), and sigma (
In this paper, three types of SVM kernels, such as linear, polynomial, and RBF, were utilized. We chose the best kernel of SVM, which gave the highest accuracy. The classification accuracy of different kernels of SVM across t-test and LASSO is presented in Fig. 2. It was noted that SVM with RBF kernel provided the highest classification accuracy (82.6% for the t-test and 94.2% for LASSO). As a result, RBF kernel was chosen for SVM to predict children with ADHD.
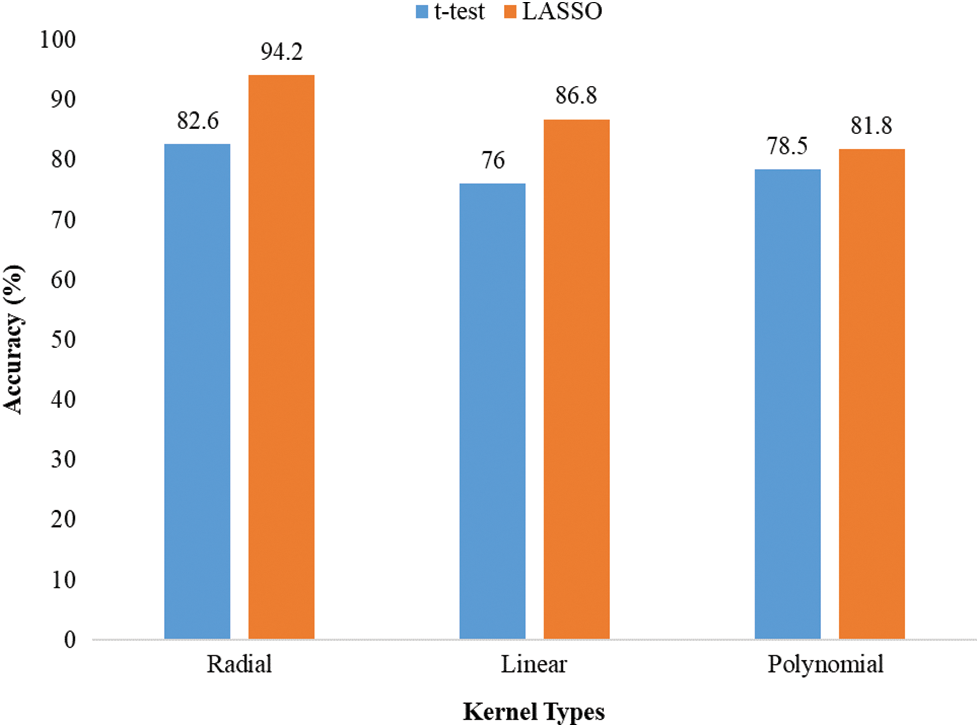
Figure 2: Accuracy of different kernels of SVM
3.6 Performance Scores of Classifiers
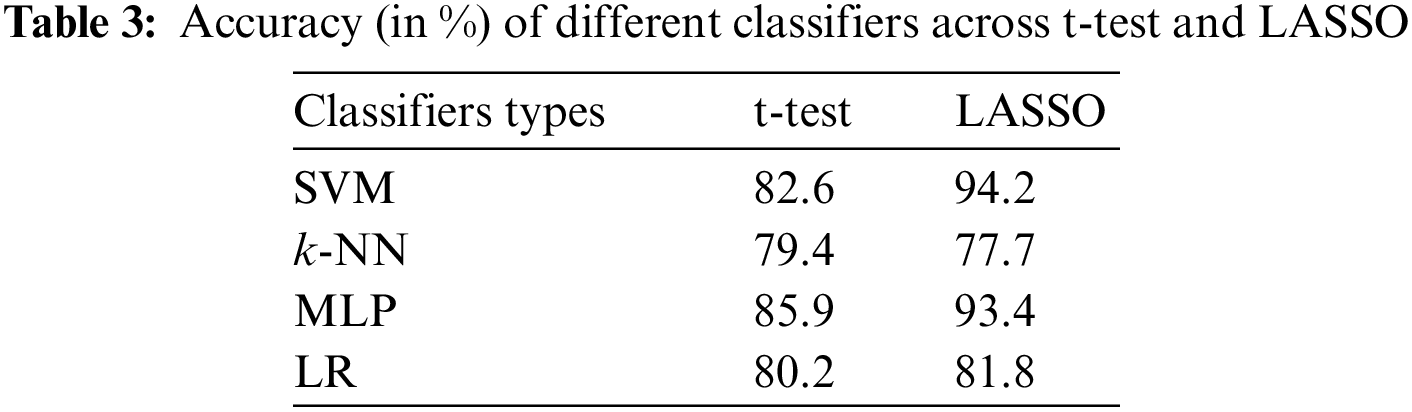
The accuracies of different classifiers across the t-test vs. LASSO are shown in Tab. 3. The accuracies of 82.6, 79.4, 85.9, and 80.2 were achieved by SVM, k-NN, MLP, and LR-based classifiers when the t-test was applied as FSM. The classification accuracy of all classifiers (except k-NN) was improved when we adopted LASSO-based FSM. The highest accuracy (94.2%) of SVM was obtained by feature sets obtained from the LASSO-based FSM. Whereas, SVM with a t-test-based system achieved an accuracy of 82.6%.
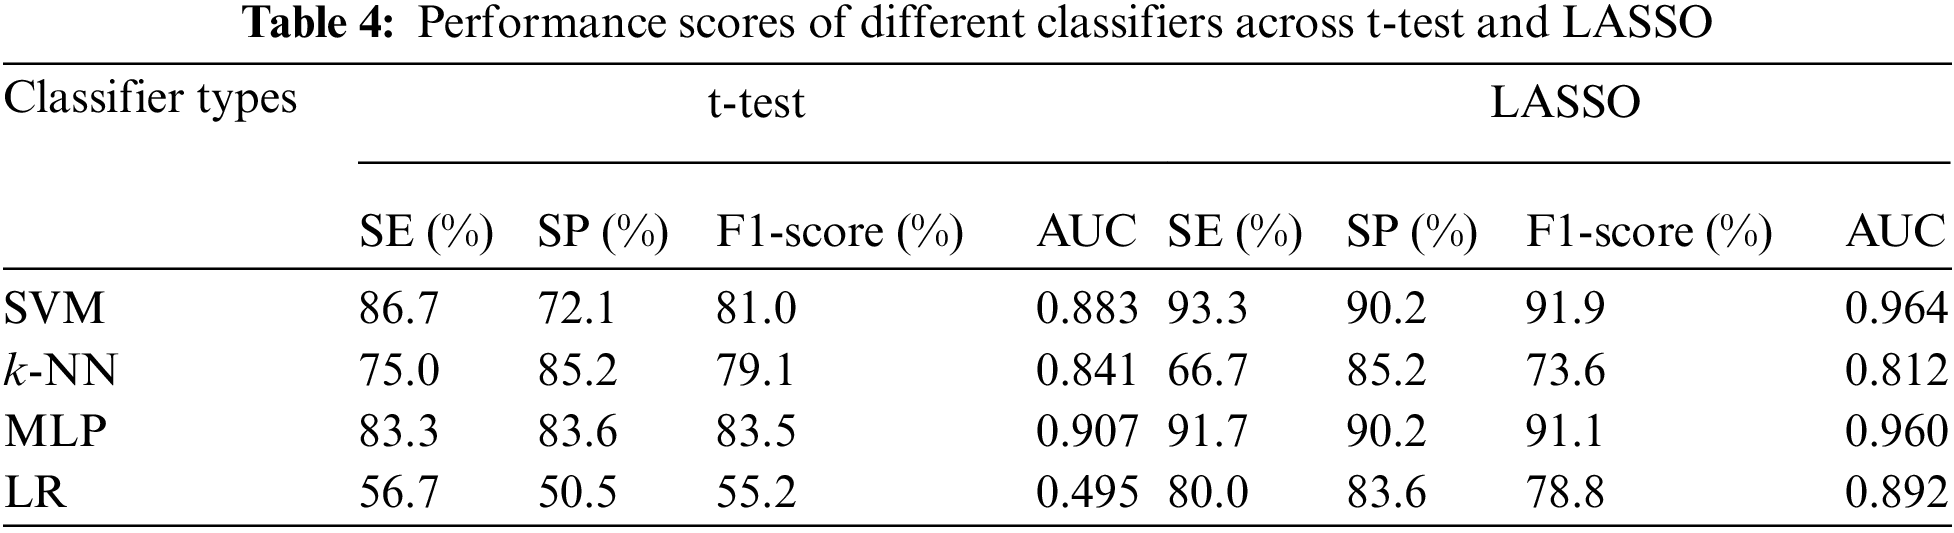
The other performance scores, such as sensitivity, specificity, F1-score, and AUC of different classifiers against the t-test and LASSO, are presented in Tab. 4. The sensitivity, F1-score, and AUC of SVM for the t-test were 86.7%, 81.0%, and 0.883, whereas MLP gave 83.3% sensitivity, 83.5% F1-score, and an AUC of 0.907. As expected from the results of the application of the LASSO-based FSM, all performance scores (except SE for k-NN) of all classifiers were improved. The highest sensitivity (93.3%), F1-score (91.9%), and AUC (0.964) were attained by SVM with LASSO-based FSM. Finally, it may be concluded that SVM with a LASSO-based system may successfully classify children with ADHD from healthy children. Our findings recommend that the utilization of appropriate features, selected FSM, and classifiers may improve the classification capacity of ADHD and healthy children.
3.7 Comparison Between Our Study and Other Existing Works
The comparison of performance sores between our study and previous studies in the literature to discriminate children as either having ADHD or healthy using EEG signals (See Tab. 5). Mueller et al. [26] utilized independent component analysis (ICA) to extract features of event-related potential (ERP) signals in 74 ADHD subjects and 74 healthy subjects. The extracted features were utilized as input features for SVM classification. They achieved the highest accuracy of 92.0%, sensitivity of 90.0%, and specificity of 94.0%. Tenev et al. [29] extracted features using power spectra analysis (PSA). The data consisted of 117 subjects, with 67 ADHD and 50 healthy children. They also adopted SVM for the classification of children as ADHD or healthy and achieved 82.3% classification accuracy. Lenartowicz et al. [30] extracted EEG signals from 99 children (ADHD: 52 vs. healthy: 47) aged between 7 and 14 years. They used ICA and time-frequency analysis to determine mid-occipital alpha and frontal midline theta for evaluating the encoding and maintenance process. They applied LR-based classifier to predict ADHD and achieved 70.0% accuracy, 69.0% sensitivity, and 71.0% specificity. Poil et al. [47] mentioned in their study that the effects of ADHD strongly depended on frequency and age. Using central frequency and power from all frequency bands, SVM obtained 67.0% sensitivity and 83.0% specificity for the classification of adults with ADHD against healthy controls. Mohammadi et al. [23] extracted different non-linear features such as approximate entropy, Lyapunov exponent, and fractional dimension. They employed DISR and mRMR to select potential features of ADHD. They also employed MLP for the classification of ADHD and healthy children and achieved the highest classification accuracy. Yang et al. [48] conducted a study for the diagnosis of children with ADHD using EEG. They took 30 subjects, with 14 ADHD subjects and 16 healthy subjects. PCA was used to select the potential features as input to SVM with RBF kernel and k-NN for the discrimination of ADHD and healthy children. The highest accuracy of 89.3% was achieved by SVM.
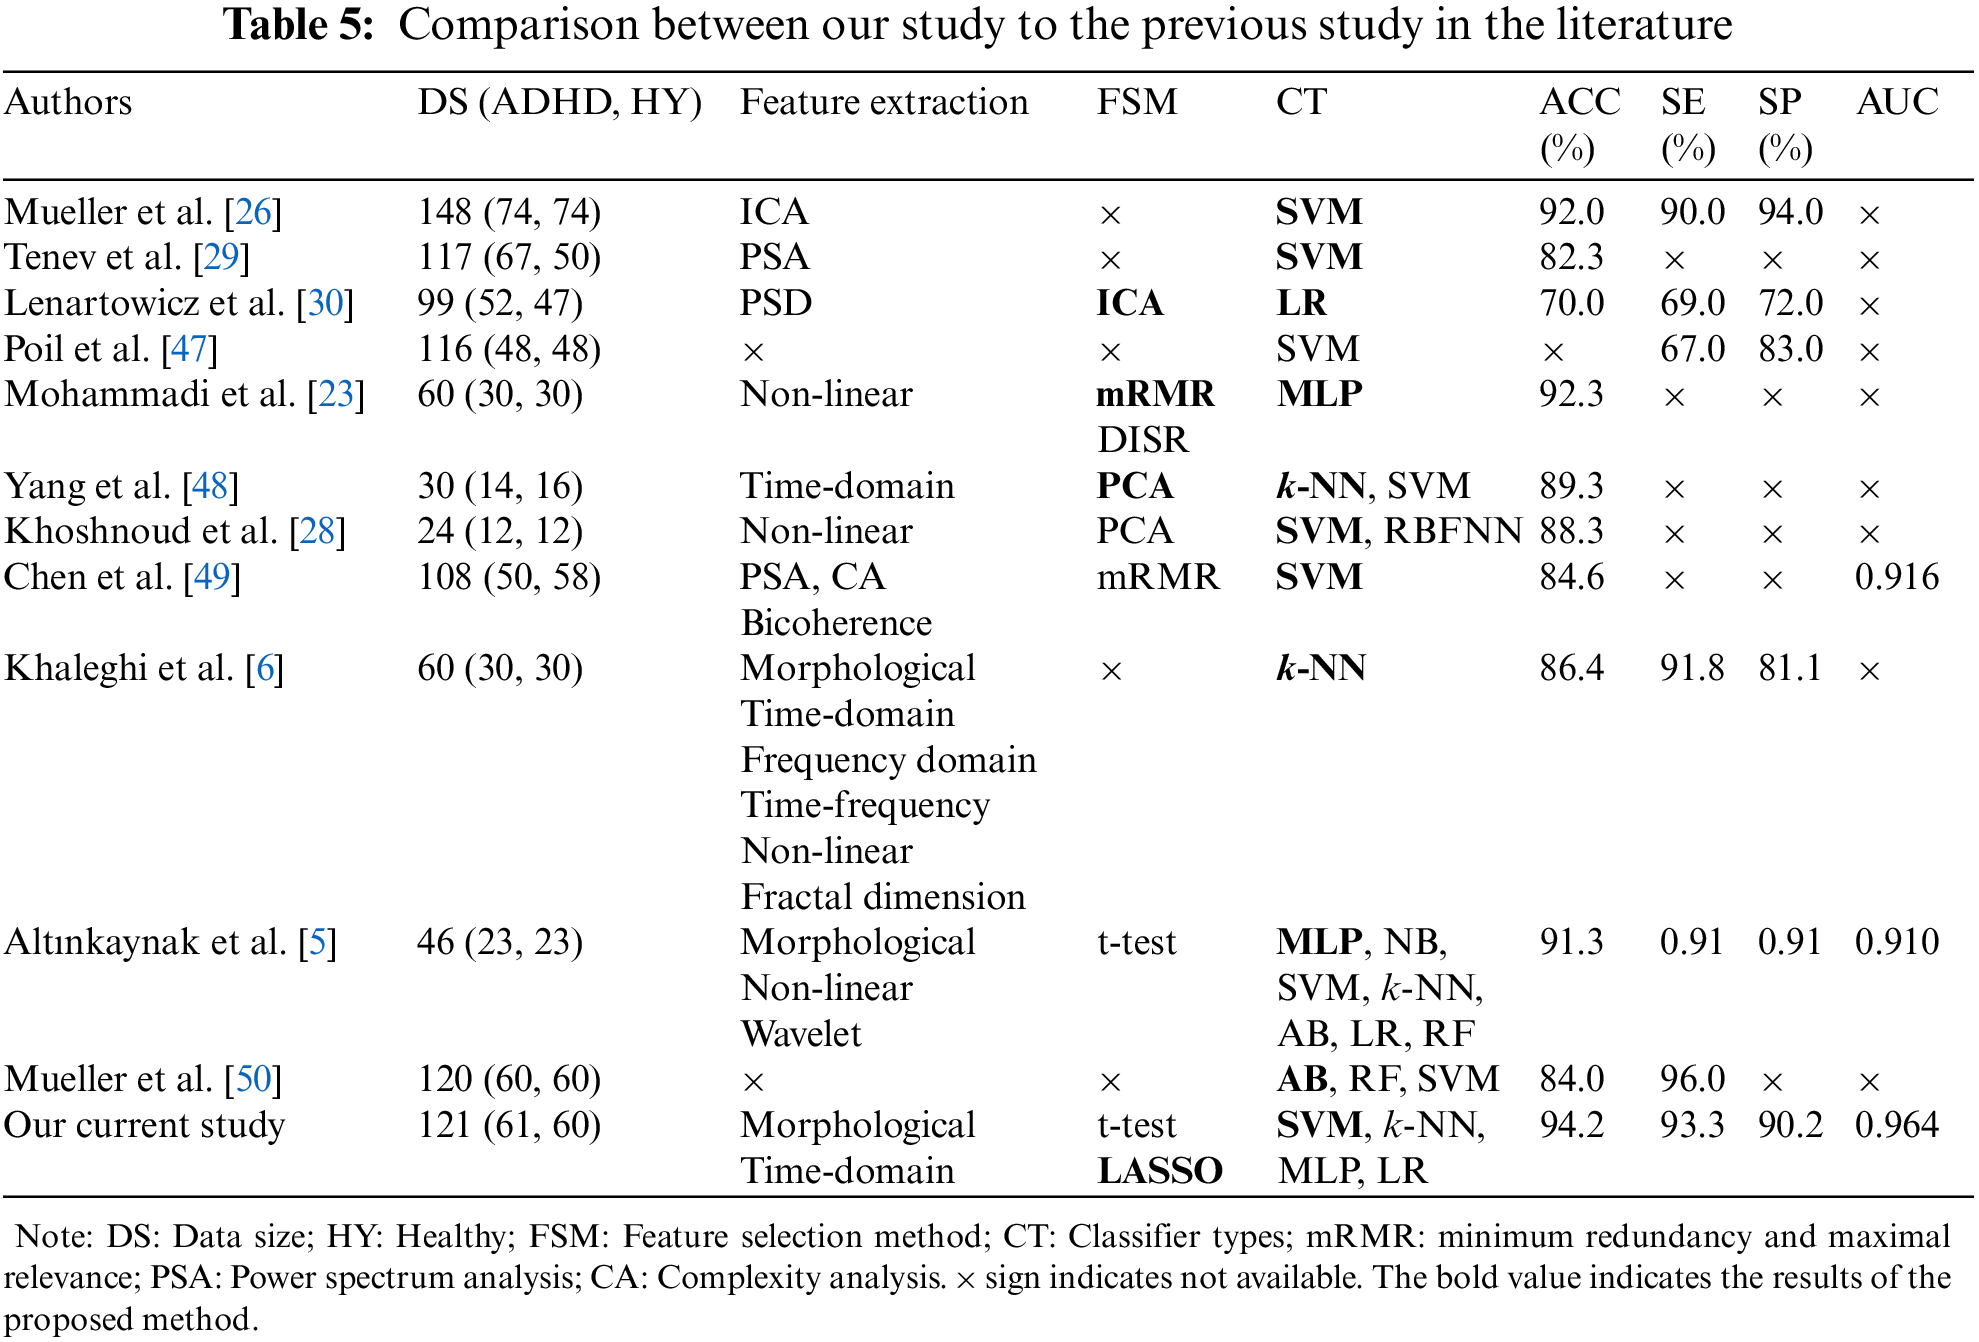
Khoshnoud et al. [28] explored brain function in children with ADHD by exploring non-linear features of EEG signals. They utilized 19 EEG channels, which were recorded from 24 children (ADHD: 12 vs. Healthy: 12). They also used PCA as an FSM to reduce the dimension of input feature space. They used two classifiers: SVM and radial basis function neural network (RBFNN) to discriminate between ADHD and healthy children. They showed that the highest accuracy (88.3%) was obtained by SVM. Chen et al. [49] applied SVM to classify children with ADHD from healthy children after extracting features from EEG signals using power spectrum, bicoherence, and complexity analysis methods. They ranked the selected features with the help of mRMR. SVM classifier yielded the highest accuracy of 84.6% and an AUC of 0.916. Khaleghi et al. [6] assessed the performance of extracting different features from EEG signals to diagnose children with ADHD. To classify ADHD and healthy children, k-NN classifier was adopted. They reported that the highest accuracy (86.4%), with sensitivity (91.8%), and specificity (81.1%), was obtained using non-linear features compared to other features. Altınkaynak et al. [5] applied MLP on EEG data to classify children as ADHD and healthy and achieved 91.3% accuracy. They trained seven different classifiers (MLP, NB, SVM, k-NN, AB, LR, and RF) and compared their performance based on classification accuracy and AUC. They reported that MLP had higher performance scores than NB, SVM, k-NN, AB, LR, and RF. Mueller et al. [50] applied three classifiers such as AdaBoost (AB), random forest (RF), and SVM for the classification of ADHD and healthy children. The utilized database was comprised of 120 subjects, with 60 ADHD subjects and 19 channels, which were treated as input features for classifiers. They reported that the highest accuracy of 84.0% and sensitivity of 96.0% were achieved by AB.
In the current study, we applied different ML-based classifiers to classify children as ADHD or healthy. The main common problem in ML is overfitting, which reduces the generalizability of classifiers. To avoid the overfitting problem, we optimized the features using t-test and LASSO before classification. We also optimized the hyperparameters of the classifiers using a grid search algorithm. Since our data sample was small, we applied LOOCV to assess the performance of classifiers. Among the classifiers, the better results were achieved by SVM with RBF, which are shown in Tabs. 3 and 4.
One of the most common neurodevelopmental diseases among children is ADHD. It is necessary to have an early diagnosis of ADHD to prevent its complications. Our study aimed was to automatically classify children as ADHD or healthy by the morphological and time-domain features of EEG signals in an ML-based algorithm. Most of the studies utilized (extracted features) morphological, time-domain, frequency domain, and non-linear features [5,6,26,28,29,51] from EEG signals to classify children as ADHD or healthy. Even though these studies produced a higher performance score for distinguishing children with ADHD from healthy children, scientists and researchers attempted to develop a model for identifying reliable features in EEG signals to diagnose children with ADHD as early as possible. This study hypothesized that by extracting relevant features, developing a suitable FSM, and proposing an ML-based classifier, it would be possible to correctly identify children as ADHD or healthy from EEG signals. This study utilized two FSMs (t-test and LASSO) to determine reliable features for children with ADHD and enhanced the classification accuracy. Various ML-based classifiers were used for the prediction of ADHD and healthy children. Previously, two ML-based classifiers (k-NN and SVM) were widely used to predict ADHD and healthy children (See Tab. 5). In addition to these two classifiers, MLP and LR-classifiers were used in this study, and their presented results were compared to each other. The accuracy achieved by LASSO is comparatively better than the t-test. Therefore, the LASSO-based FSM combined with SVM was able to obtain better accuracy (94.2%) and AUC (0.964).
Strengths and Limitations of the Study
The current study has some advantages compared to previous studies, such as (i) Extraction of various morphological and time-domain features from EEG signals; (ii) Identification of potential features for ADHD using the t-test and LASSO; (iii) Better classification of ADHD and healthy children with up to 94.24% accuracy, achieved by SVM; whereas, LASSO selected 47 features out of 342 features; and (iv) Using a t-test, SVM could classify ADHD and healthy children with 80.2% accuracy for all features and 82.6% accuracy for 147 features. Adopting LASSO-based FSM, the feature sets were reduced (47 features) and the accuracy of SVM was increased by 14.04%.
This study also had some limitations as the database had a small sample size. The highest accuracy of ML-based classifiers was reported for small-sample. However, four different ML-based algorithms were used to predict children with ADHD and they achieved higher performance scores. These performance scores were more robust for large-sample case studies. Secondly, we only used two feature extraction methods to extract features from EEG signals. It is more appropriate to evaluate the performance by adding different feature extraction methods. Thirdly, we chose only four ML-based classifiers. Despite these weak points, the findings of the current study were highly promising.
Our study presented an ML-based algorithm for the prediction of children as ADHD vs. healthy that can be used for the early diagnosis of children with ADHD. So far, various feature extraction methods have been utilized to determine features for the diagnosis of ADHD from EEG signals. Most of the studies used or did not use any FSM to select reliable features of ADHD. This study emphasized selecting the reliable features of ADHD. We used two FSMs (t-test and LASSO) to select the reliable features and also improve the performance scores. Moreover, to classify children as ADHD and healthy, four ML-based classifiers (SVM, k-NN, MLP, and LR) were employed. Our findings showed that performance scores obtained from LASSO were better than t-test based FSM. However, the highest performance scores (accuracy: 94.2%, sensitivity: 91.7%, and AUC: 0.964) were achieved by the combination of LASSO-based FSM with SVM classifier.
In the future, we will expand this study by obtaining more data on children’s brain activity to classify children as ADHD or healthy. Furthermore, we will also expand feature extraction as well as FSMs that may help to improve classification accuracy. We will adopt more ML-based algorithms and convolution neural network [52,53] algorithms to classify children as ADHD vs. healthy. In addition, we will also introduce a web-based algorithm to predict ADHD and healthy children that will be available to health providers and doctors that could be used for the early diagnosis of ADHD.
Funding Statement: This work was supported by the Japan Society for the Promotion of Science Grants-in-Aid for Scientific Research (KAKENHI), Japan (Grant Numbers JP20K11892, which was awarded to Jungpil Shin and JP21H00891, which was awarded to Akira Yasumura).
Conflicts of Interest: The authors declare that they have no conflicts of interest to report regarding the present study.
1. V. N. Vahia, “Diagnostic and statistical manual of mental disorders 5: A quick glance,” Indian Journal of Psychiatry, vol. 55, no. 3, pp. 220–223, 2013. [Google Scholar]
2. P. Jafari, A. Ghanizadeh, S. Akhondzadeh and M. R. Mohammadi, “Health-related quality of life of Iranian children with attention deficit/hyperactivity disorder,” Quality of Life Research, vol. 20, no. 1, pp. 31–36, 2011. [Google Scholar]
3. M. R. Mohammadi, N. Ahmadi, A. Khaleghi, S. A. Mostafavi, K. Kamali et al., “Prevalence and correlates of psychiatric disorders in a national survey of Iranian children and adolescents,” Iranian Journal of Psychiatry, vol. 14, no. 1, pp. 1–15, 2019. [Google Scholar]
4. I. Lazzaro, E. Gordon, W. Li, C. Lim, M. Plahn et al., “Simultaneous EEG and EDA measures in adolescent attention deficit hyperactivity disorder,” International Journal of Psychophysiology, vol. 34, no. 2, pp. 123–134, 1999. [Google Scholar]
5. M. Altınkaynaka, N. Dolu, A. Guven, F. Pektas, S. Özmen et al., “Diagnosis of attention deficit hyperactivity disorder with combined time and frequency features,” Biocybernetics and Biomedical Engineering, vol. 40, no. 3, pp. 927–937, 2020. [Google Scholar]
6. A. Khaleghi, P. M. Birgani, M. F. Fooladi and M. R. Mohammadi, “Applicable features of electroencephalogram for ADHD diagnosis,” Research on Biomedical Engineering, vol. 36, no. 1, pp. 1–11, 2020. [Google Scholar]
7. M. L. Danielson, R. H. Bitsko, R. M. Ghandour, J. R. Holbrook, M. D. Kogan et al., “Prevalence of parent-reported ADHD diagnosis and associated treatment among us children and adolescents, 2016,” Journal of Clinical Child & Adolescent Psychology, vol. 47, no. 2, pp. 199–212, 2018. [Google Scholar]
8. L. G. Ciobanu, A. J. Ferrari, H. E. Erskine, D. F. Santomauro, F. J. Charlson et al., “The prevalence and burden of mental and substance use disorders in Australia: Findings from the global burden of disease study 2015,” Australian & New Zealand Journal of Psychiatry, vol. 52, no. 5, pp. 483–490, 2018. [Google Scholar]
9. F. D. Mowlem, M. A. Rosenqvist, J. Martin, P. Lichtenstein, P. Asherson et al., “Sex differences in predicting ADHD clinical diagnosis and pharmacological treatment,” European Child & Adolescent Psychiatry, vol. 28, no. 4, pp. 481–489, 2019. [Google Scholar]
10. A. Khaleghi, M. R. Mohammadi, M. Moeini, H. Zarafshan and M. Fadaei Fooladi, “Abnormalities of alpha activity in frontocentral region of the brain as a biomarker to diagnose adolescents with bipolar disorder,” Clinical EEG and Neuroscience, vol. 50, no. 5, pp. 311–318, 2019. [Google Scholar]
11. S. V. Faraone, T. Banaschewski, D. Coghill, Y. Zheng, J. Biederman et al., “The world federation of ADHD international consensus statement: 208 evidence-based conclusions about the disorder,” Neuroscience & Biobehavioral Reviews, vol. 128, no. 9, pp. 789–818, 2021. [Google Scholar]
12. S. S. Beriha, “Computer aided diagnosis system to distinguish ADHD from similar behavioral disorders,” Biomedical & Pharmacology Journal, vol. 11, no. 2, pp. 1135–1141, 2018. [Google Scholar]
13. A. Ekhlasi, A. M. Nasrabadi and M. R. Mohammadi, “Direction of information flow between brain regions in ADHD and healthy children based on EEG by using directed phase transfer entropy,” Cognitive Neurodynamics, vol. 15, no. 6, pp. 975–986, 2021. [Google Scholar]
14. X. Peng, P. Lin, T. Zhang and J. Wang, “Extreme- learning machine-based classification of ADHD using brain structural MRI data,” PLoS One, vol. 8, no. 11, pp. 1–12, 2013. [Google Scholar]
15. J. R. Sato, M. Q. Hoexter, X. F. Castellanos and L. A. Rohde, “Abnormal brain connectivity patterns in adults with ADHD: A coherence study,” PloS One, vol. 7, no. 9, pp. 1–9, 2012. [Google Scholar]
16. Y. Monden, H. Dan, M. Nagashima, I. Dan, Y. Kyutoku et al., “Clinically-oriented monitoring of acute effects of methylphenidate on cerebral hemodynamics in ADHD children using fNIRS,” Clinical Neurophysiology, vol. 123, no. 6, pp. 1147–1157, 2012. [Google Scholar]
17. T. J. Silk, A. Vance, N. Rinehart, J. L. Bradshaw and R. Cunnington, “White-matter abnormalities in attention deficit hyperactivity disorder: A diffusion tensor imaging study,” Human Brain Mapping, vol. 30, no. 9, pp. 2757–2765, 2009. [Google Scholar]
18. J. J. Gonzalez, L. D. M. Endez, S. Manas, M. R. Duque, E. Pereda et al., “Performance analysis of univariate and multivariate EEG measurements in the diagnosis of ADHD,” Clinical Neurophysiology, vol. 124, no. 6, pp. 1139–1150, 2013. [Google Scholar]
19. J. J. Gonzalez, G. Alba, S. Manas, A. Gonzalez and E. Pereda, “Assessment of ADHD through electroencephalographic measures of functional connectivity,” ADHD-New Dir. Diagnosis Treat, pp. 35–54, 2017. https://dx.doi.org/10.5772/60559. [Google Scholar]
20. H. H. Jasper, P. Solomon and C. Bradley, “Electroencephalographic analyses of behavior problem children,” American Journal of Psychiatry, vol. 95, no. 3, pp. 641–658, 1938. [Google Scholar]
21. M. A. Tansey, “Brainwave signatures-an index reflective of the brain’s functional neuroanatomy: Further findings on the effect of EEG sensorimotor rhythm biofeedback training on the neurologic precursors of learning disabilities,” International Journal of Psychophysiology, vol. 3, no. 2, pp. 85–99, 1985. [Google Scholar]
22. L. C. Fonseca, G. M. A. Tedrus, C. d. Moraes, A. d. V. Machado, M. P. d. Almeida et al., “Epileptiform abnormalities and quantitative EEG in children with attention-deficit/hyperactivity disorder,” Arquivos De Neuro-Psiquiatria, vol. 66, no. 3A, pp. 462–467, 2008. [Google Scholar]
23. M. R. Mohammadi, A. Khaleghi, A. M. Nasrabadi, S. Rafieivand, M. Begol et al., “EEG classification of ADHD and normal children using non-linear features and neural network,” Biomedical Engineering Letters, vol. 6, no. 2, pp. 66–73, 2016. [Google Scholar]
24. Y. K. Boroujeni, A. A. Rastegari and H. Khodadadi, “Diagnosis of attention deficit hyperactivity disorder using non-linear analysis of the EEG signal,” IET Systems Biology, vol. 13, no. 5, pp. 260–266, 2019. [Google Scholar]
25. J. C. Chow, C. S. Ouyang, C. T. Chiang, R. C. Yang, R. C. Wu et al., “Novel method using Hjorth mobility analysis for diagnosing attention-deficit hyperactivity disorder in girls,” Brain and Development, vol. 41, no. 4, pp. 334–340, 2019. [Google Scholar]
26. A. Mueller, G. Candrian, J. D. Kropotov, V. A. Ponomarev and G. -M. Baschera, “Classification of ADHD patients on the basis of independent ERP components using a machine learning system,” Nonlinear Biomedical Physics, vol. 4, no. 1, pp. 1–12, 2010. [Google Scholar]
27. V. A. Ponomarev, A. Mueller, G. Candrian, V. A. Grin-Yatsenko and J. D. Kropotov, “Group independent component analysis (gICA) and current source density (CSD) in the study of EEG in ADHD adults,” Clinical Neurophysiology, vol. 125, no. 1, pp. 83–97, 2014. [Google Scholar]
28. S. Khoshnoud, M. A. Nazari and M. Shamsi, “Functional brain dynamic analysis of ADHD and control children using nonlinear dynamical features of EEG signals,” Journal of Integrative Neuroscience, vol. 17, no. 1, pp. 17–30, 2018. [Google Scholar]
29. A. Tenev, S. Markovska-Simoska, L. Kocarev, J. Pop-Jordanov, A. Muller et al., “Machine learning approach for classification of ADHD adults,” International Journal of Psychophysiology, vol. 93, no. 1, pp. 162–166, 2014. [Google Scholar]
30. A. Lenartowicz, A. Delorme, P. D. Walshaw, A. L. Cho, R. M. Bilder et al., “Electroencephalography correlates of spatial working memory deficits in attention-deficit/hyperactivity disorder: Vigilance, encoding, and maintenance,” Journal of Neuroscience, vol. 34, no. 4, pp. 1171–1182, 2014. [Google Scholar]
31. A. A. M. Nasrabadi, M. Samavati and M. R. Mohammadi, “EEG data for ADHD/control children,” IEEE Dataport, 2020. https://dx.doi.org/10.21227/rzfh-zn36. [Google Scholar]
32. I. Kalatzis, N. Piliouras, E. Ventouras, C. C. Papageorgiou, A. D. Rabavilas et al., “Design and implementation of an SVM-based computer classification system for discriminating depressive patients from healthy controls using the p600 component of ERP signals,” Computer Methods and Programs in Biomedicine, vol. 75, no. 1, pp. 11–22, 2004. [Google Scholar]
33. C. Altın, “Comparison of different time and frequency domain feature extraction methods on elbow gesture’s EMG,” European Journal of Interdisciplinary Studies, vol. 2, no. 3, pp. 35–44, 2016. [Google Scholar]
34. W. Xiang, W. Wang, J. Liu and T. Tong, “Estimating the sample mean and standard deviation from the sample size, median, range and/or interquartile range,” BMC Medical Research Methodology, vol. 14, no. 1, pp. 1–4, 2014. [Google Scholar]
35. O. K. Fasil and R. Rajesh, “Time-domain exponential energy for epileptic EEG signal classification,” Neuroscience, vol. 694, no. 7, pp. 1–8, 2019. [Google Scholar]
36. Y. Chen, R. Chang and J. Guo, “Emotion recognition of EEG signals based on the ensemble learning method: Adaboost,” Mathematical Problems in Engineering, vol. 2021, pp. 1–12, 2021. [Google Scholar]
37. H. Wang, Q. Xu and L. Zhou, “Large unbalanced credit scoring using lasso-logistic regression ensemble,” PloS One, vol. 10, no. 2, pp. 1–20, 2015. [Google Scholar]
38. S. M. Kim, Y. Kim, K. Jeong, H. Jeong and J. Kim, “Logistic lasso regression for the diagnosis of breast cancer using clinical demographic data and the BI-RADS lexicon for ultrasonography,” Ultrasonography, vol. 37, no. 1, pp. 36–42, 2018. [Google Scholar]
39. C. Cortes and V. Vapnik, “Support-vector networks,” Machine Learning, vol. 20, no. 3, pp. 273–297, 1995. [Google Scholar]
40. M. A. M. Hasan, M. Nasser, B. Pal and S. Ahmad. “Support vector machine and random forest modeling for intrusion detection system (IDS). ” Journal of Intelligent Learning Systems and Applications, vol. 6, no. 1, pp. 45–52, 2014. [Google Scholar]
41. E. Fix and J. L. Hodges, “Discriminatory analysis. Nonparametric discrimination: Consistency properties,” International Statistical Review/Revue Internationale de Statistique, vol. 57, no. 3, pp. 238–247, 1989. [Google Scholar]
42. N. S. Altman, “An introduction to kernel and nearest-neighbor nonparametric regression,” The American Statistician, vol. 46, no. 3, pp. 175–185, 1992. [Google Scholar]
43. M. Durairaj and V. Revathi, “Prediction of heart disease using back propagation MLP algorithm,” International Journal of Scientific and Technology Research, vol. 4, no. 8, pp. 235–239, 2015. [Google Scholar]
44. F. Murtagh, “Multilayer perceptron for classification and regression,” Neurocomputing, vol. 2, no. 5−6, pp. 183–197, 1991. [Google Scholar]
45. M. Maniruzzaman, M. J. Rahman, M. A. M. Hasan, H. S. Suri, M. Abedin et al., “Accurate diabetes risk stratification using machine learning: Role of missing value and outliers,” Journal of Medical Systems, vol. 42, no. 5, pp. 1–17, 2018. [Google Scholar]
46. J. Truett, J. Cornfield and W. Kannel, “A multivariate analysis of the risk of coronary heart disease in framingham,” Journal of Chronic Diseases, vol. 20, no. 7, pp. 511–524, 1967. [Google Scholar]
47. S. S. Poil, S. Bollmann, C. Ghisleni, R. O’Gorman, P. Klaver et al., “Age dependent electroencephalographic changes in attention-deficit/hyperactivity disorder (ADHD),” Clinical Neurophysiology, vol. 125, no. 8, pp. 1626–1638, 2014. [Google Scholar]
48. J. Yang, W. Li, S. Wang, J. Lu and L. Zou, “Classification of children with attention deficit hyperactivity disorder using PCA and k-nearest neighbors during interference control task,” in Proc. of the Advances in Cognitive Neurodynamics, Springer, Singapore, pp. 447–453, 2016. [Google Scholar]
49. H. Chen, W. Chen, Y. Song, L. Sun and X. Li, “EEG characteristics of children with attention deficit/hyperactivity disorder,” Neuroscience, vol. 406, no. 11, pp. 444–456, 2019. [Google Scholar]
50. A. Mueller, G. Candrian, V. A. Grane, J. D. Kropotov, V. A. Ponomarev et al., “Discriminating between ADHD adults and controls using independent ERP components and a support vector machine: A validation study,” Nonlinear Biomedical Physics, vol. 5, no. 1, pp. 1–18, 2011. [Google Scholar]
51. A. Parashar, N. Kalra, J. Singh and R. K. Goyal, “Machine learning based framework for classification of children with ADHD and healthy controls,” Intelligent Automation Soft Computing, vol. 28, no. 3, pp. 669–682, 2021. [Google Scholar]
52. W. Sun, G. Z. Dai, X. R. Zhang, X. Z. He and X. Chen, “TBE-Net: A three-branch embedding network with part-aware ability and feature complementary learning for vehicle re-identification,” IEEE Transactions on Intelligent Transportation Systems, pp. 1–13, 2021. https://dx.doi.org/10.1109/TITS.2021.3130403. [Google Scholar]
53. W. Sun, L. Dai, X. R. Zhang, P. S. Chang and X. Z. He, “RSOD: Real-time small object detection algorithm in UAV-based traffic monitoring,” Applied Intelligence, pp. 1–16, 2021. https://doi.org/10.1007/s10489-021-02893-3. [Google Scholar]
 | This work is licensed under a Creative Commons Attribution 4.0 International License, which permits unrestricted use, distribution, and reproduction in any medium, provided the original work is properly cited. |