DOI:10.32604/cmc.2022.028364
| Computers, Materials & Continua DOI:10.32604/cmc.2022.028364 | |
| Article |
Hybrid Single Image Super-Resolution Algorithm for Medical Images
1Department of Electronics and Electrical Communications Engineering, Faculty of Electronic Engineering, Menoufia University, Menouf, 32952, Egypt
2Security Engineering Lab, Computer Science Department, Prince Sultan University, Riyadh, 11586, Saudi Arabia
3Electrical Engineering Department, College of Engineering, Prince Sattam Bin Abdulaziz University, Wadi Addwasir, 11991, Saudi Arabia
4Electrical Engineering Department, Aswan University, Aswan, 81542, Egypt
5Electronics and Micro-Electronics Laboratory (E. μ. E. L), Faculty of Sciences, University of Monastir, Monastir, 5000, Tunisia
6Alexandria Higher Institute of Engineering & Technology (AIET), Alexandria, Egypt
7Electronics and Communications Engineering Department, College of Engineering and Technology, Arab Academy for Science, Technology and Maritime Transport, Alexandria, 1029, Egypt
*Corresponding Author: Ehab Mahmoud Mohamed. Email: e.mahmoud@psau.edu.sa
Received: 08 February 2022; Accepted: 14 March 2022
Abstract: High-quality medical microscopic images used for diseases detection are expensive and difficult to store. Therefore, low-resolution images are favorable due to their low storage space and ease of sharing, where the images can be enlarged when needed using Super-Resolution (SR) techniques. However, it is important to maintain the shape and size of the medical images while enlarging them. One of the problems facing SR is that the performance of medical image diagnosis is very poor due to the deterioration of the reconstructed image resolution. Consequently, this paper suggests a multi-SR and classification framework based on Generative Adversarial Network (GAN) to generate high-resolution images with higher quality and finer details to reduce blurring. The proposed framework comprises five GAN models: Enhanced SR Generative Adversarial Networks (ESRGAN), Enhanced deep SR GAN (EDSRGAN), Sub-Pixel-GAN, SRGAN, and Efficient Wider Activation-B GAN (WDSR-b-GAN). To train the proposed models, we have employed images from the famous BreakHis dataset and enlarged them by 4× and 16× upscale factors with the ground truth of the size of 256 × 256 × 3. Moreover, several evaluation metrics like Peak Signal-to-Noise Ratio (PSNR), Mean Squared Error (MSE), Structural Similarity Index (SSIM), Multiscale Structural Similarity Index (MS-SSIM), and histogram are applied to make comprehensive and objective comparisons to determine the best methods in terms of efficiency, training time, and storage space. The obtained results reveal the superiority of the proposed models over traditional and benchmark models in terms of color and texture restoration and detection by achieving an accuracy of 99.7433%.
Keywords: GAN; medical images; SSIM; MS-SSIM; PSNR; SISR
Almost half a million breast cancer patients die, and nearly 7.8 Million new cases are diagnosed yearly. These figures are likely to grow dramatically as social and medical engineering advances [1–3]. Compared with other medical imaging types, histopathological images represent the gold standard for diagnosing breast cancer. The ideal treatment plan for breast cancer depends on the early classification. Early classification of tissue images requires many images and storage space, so finding more efficient ways to preserve images makes sense. The primary motivation for developing a more accurate breast cancer classification algorithm is to assist clinicians familiar with the molecular subtypes of breast cancer in controlling cancer cell metastasis early in the disease diagnosis and treatment planning process. Artificial intelligence (AI) based solutions are utilized to assist the automated identification of breast cancer. Deep Learning (DL) models are among the most popular approaches due to their superior performance in classifying and processing medical images.
Because of the high cost of storage and hardware, it is prudent to obtain high-resolution (HR) medical images from low-resolution (LR) ones. Image super-resolution (SR) techniques focus on reconstructing low-quality images with lost pixels to address hardware costs. Furthermore, due to the importance of enlarging the images so that the feature information and texture details remain clear and indistinct while utilizing the quantifiable performance of the employed SR algorithms, Generative Adversarial Network (GANs) are gaining attention due to their ability to reconstruct the images realistically [2–6].
This paper proposes a Multi-SR and Classification Framework (MSRCF) based on GAN networks to improve and reconstruct breast cancer images from histopathology ones. The MSRCF comprises five GAN models: ESRGAN, EDSRGAN, Sub-Pixel-GAN, SRGAN, and WDSR-b-GAN. We used the well-known models in SR such as EDSR, WDSR-b, and ESPCN as the generator in GAN models and proposed a special model for the discriminator. In addition, we also use the ESRGAN and SRGAN models while modifying their discriminators [7–11]. The main contributions of this paper can be summarized as follows:
• Developing five fine-tuned multi-SR frameworks for medical image classification applications.
• Developing feedforward-based SR Convolutional Neural Network (CNN) models and using them as a GAN model generator.
• Employing fine-tuned GAN models to function properly on 7783 images of 7909 images after removing duplicate images of two satisfactory histological types.
• Implementing a hybrid content loss, MSE loss, and adversarial loss as the perceptual loss to generate HR images.
• Examining the suggested Single Image Super-Resolution (SISR) algorithm with different assessment metrics, including Structural Similarity Index (SSIM), Peak Signal-to-Noise Ratio (PSNR), histogram, and Multiscale Structural Similarity Index (MS-SSIM), to assess the trained image qualities.
• Implementing the proposed MSRCF model in the pre-processing stage prior to the classification stage to generate HR images.
• Achieving high detection accuracy with few iterations and epochs after SR pre-processing for the ResNeXt-101 (32 × 8d) model than traditional and benchmark approaches.
The rest of this paper is organized as follows. The proposed multi-super-resolution and classification framework is presented in Section 2. The experimental results are displayed and discussed in Section 3. The concluding remarks are summarized in Section 4.
2 Proposed Multi-Super-Resolution and Classification Framework
Reconstruction is an effective process to improve the efficiency of medical images in terms of storage while it supports the highly efficient diagnosis. Therefore, this paper presents effective MSRCF based on DL and GAN methods to overcome the high computational processing and the limited efficiency of the traditional techniques. As shown in Fig. 1, the MSRCF consists of several phases that can be summarized as follows: In the first phase, a data set of breast cancer histopathological images is prepared, and then the images are reshaped into small dimensions that serve the idea of research. The dimension of the images is set to 64 × 64, valid for low storage hardware. In the second phase, SR image construction takes place for efficient and automated diagnosis purposes in the third phase. In the fourth phase, we perform many measurements on the medical images to prove the efficiency of the proposed framework in terms of the ability to save data economically. We can perform any operations on-demand without lowering the efficiency standards. In the following, the detailed descriptions of these four phases will be given.
The first phase is random selection and reconfiguring image samples from the BreaKHis dataset. Reconfiguration means to reshape the dimensions of the medical images to fit the proposed models in the coming phases, such as the SR GAN phase, which needs images with low-resolution dimensions (64 × 64 × 3), and the classification phase, which requires images with high-resolution dimensions (256 × 256 × 3). Random sampling is a mandatory step due to the resource-poor Graphics Processing Unit (GPU) so that the super-resolution GAN models are trained on a maximum of 4 images at the same time. In order to reduce the training time, we randomly select 1700 images from the BreaKHis dataset. Also, most basic and texture features are preserved during the data reconfiguration process that uses bicubic interpolation. Moreover, normalization is used on the image data in the range of [1]. This normalization range is selected after conducting several tests, and it was found that this range is better than the typical range of [0 1]. The normalization is performed by subtracting 127.5 from each pixel in the image and then dividing the result by 127.5. The main benefits of normalization are to speed up the training process and reduce the required computational complexity of the proposed DL models.
Moreover, at this phase, the BreaKHis dataset is divided into two groups, where one is used for training, and the other is used for validation. In this paper, 90% of the dataset is used for training, while the remaining 10% is used for validation. These ratios are not only going in harmony with what is stated in the literature, but also give the best results after conducting several tests and experimental validations for breast cancer detection.
2.2 Super-Resolution (SR) GAN Phase
This phase consists of two stages; in the first stage, the SR process takes place, where the HR image is estimated from the LR one(s). SR process can be categorized as a multi-image SR or a single-image SR. In the first category, several LR images are used to generate the HR image, while in the later, only one LR image is utilized. Due to its lack of available information, single-image SR is considered as the most difficult, but it is generally the most common type used in most applications. In this paper, a single-image SR is considered. Formerly, researchers relied on mathematical interpolation methods to generate/reconstruct SR images based on increasing the number of pixels in each space. Recently, interest in image reconstruction applications has been increased due to the reliance on computer vision for various functions. This opens the door to applying sophisticated methods such as DL in SR, which shows superior performance than conventional techniques [9].
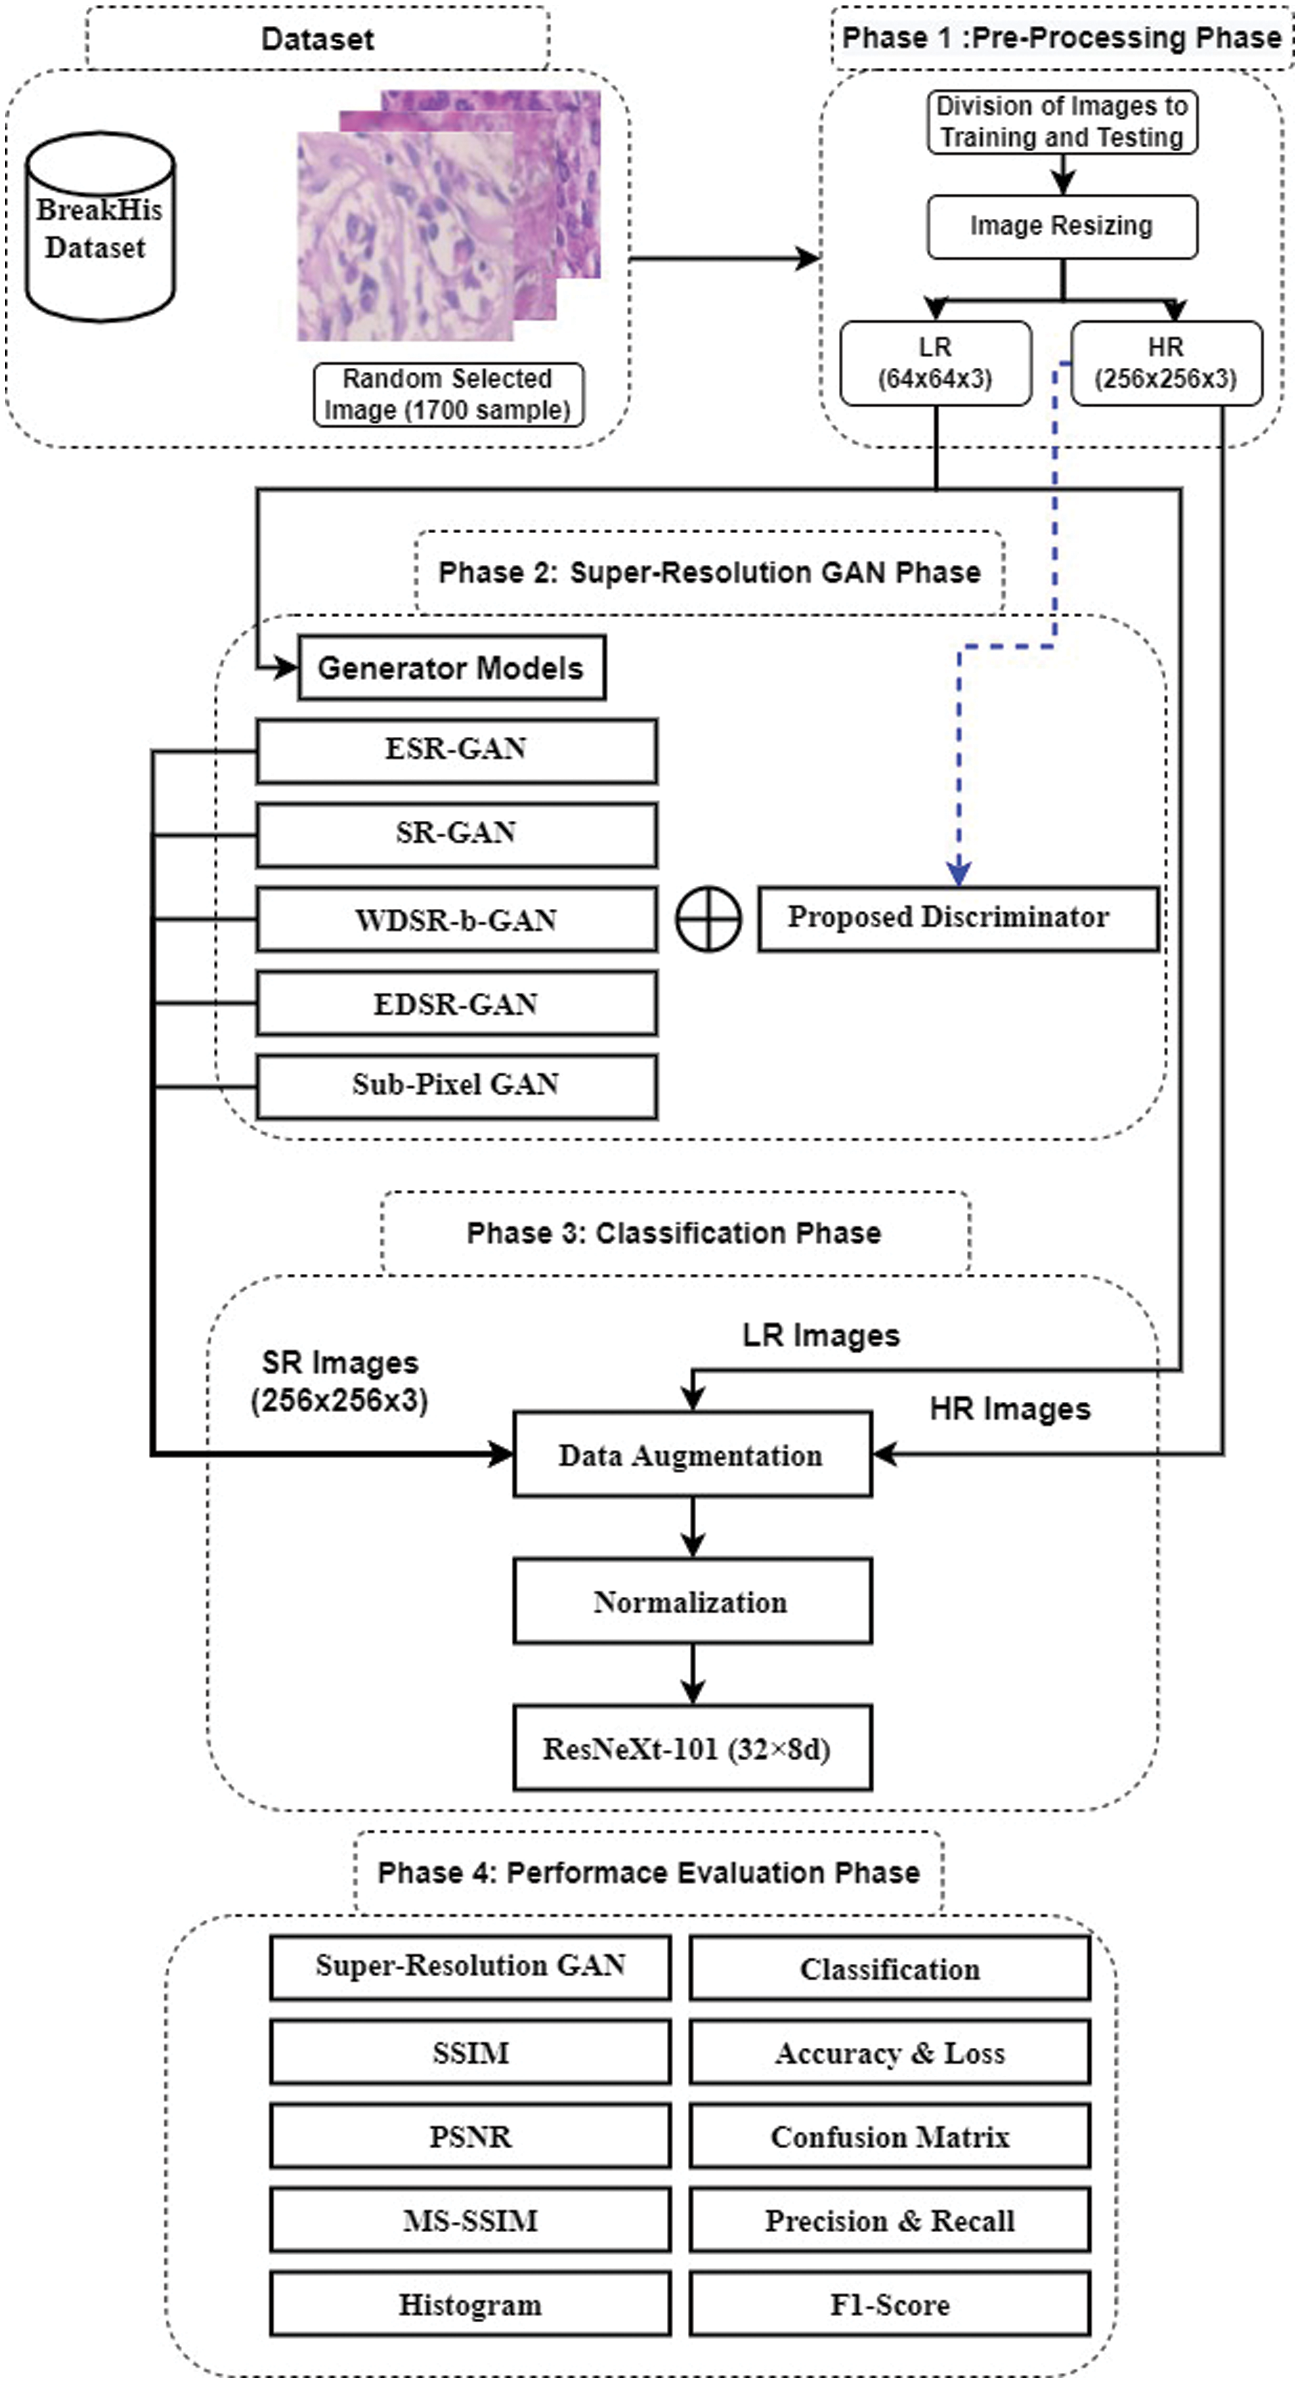
Figure 1: Proposed multi-SR and classification framework
In the second stage, GAN is applied to create images from random noises so that they appear realistic, where the most common type of noise is Gaussian. In [12], the authors provided a comprehensive classification of DL-based generative models. The models were divided into two groups based on maximum likelihood, including explicit density. This method calculates images over a sample area and implicit density. This does not produce explicit density but generates realistic images that can model samples of the correct distribution. In the first method, pixel value estimation is based on autoregression, such as PixelCNN [13] utilizing traceable density or the autoencoder method [14] applying approximate density. Likewise, GAN is based on implicit density and is considered a new way to generate various data from images, audio, and video [15]. The authors of [12] submitted the GAN model, which consists of two deep networks. The first is a generative network to produce acceptable images, and the second is a discriminatory network to supervise the distinction of fake images from the original ones [12]. The GAN model succeeds in carrying out its task when the discriminator fails and the generator succeeds. The generator produces an image whose pixel distribution is similar to that of real images in that it deceives the discriminator. The discriminator fails when it cannot differentiate the generated images from the real ones. GAN has been widely used in SR.
Many SR models have already been trained in general images such as EDSR [3], WDSR-b [4], ESPCN [5], ESRGAN [6], SRGAN [2]. This paper uses the five GAN models to obtain the best HR breast cancer images. To increase image quality, we meticulously study four major components of the GAN model: the generator model architecture, the discriminant model architecture, the adversarial loss, and the perceptual loss. In the generator network architecture, five different architectures are adopted. Three of them are used in SR feedforward or explicit density models that do not depend on GAN or loss of perception. They are among the first CNNs used in SR, where LR images are fed into the network to produce HR images with MSE as the loss function. The other two types are called ESRGAN and SRGAN, and they are mainly used in the multi-SR framework with perceptual loss. They are bearing in mind that the discrimination network architecture and perceptual loss have been developed for all models, which will be explained in detail in the following paragraphs.
The proposed discriminator network is used with all the proposed SR-GAN models, as shown in Fig. 1. The great benefit of the GAN concept is the use of a discriminator network that is able to distinguish the original images from the images generated by the generator network. So, in order to train a generator network capable of generating an HR image similar to the original, and efficient discriminator network should be built. The two models fight each other during training to get the maximum training for both networks together, distinguishing GANs from other Convolutional Neural Networks (CNNs).
As shown in Fig. 2, the DL discriminator architecture consists of several connected CNN layers (19 layers), which are seven batch normalization (BN) layers, eight layers of convolutional (Conv2D) layers, four fully connected (FC) or dense layers, and a final sigmoid layer. The input images have a size of 256 × 256 × 3, and the output layer includes the sigmoid classifier used for distinguishing purposes.
As mentioned, the use of five different networks was discussed as a generator based on the GAN, and among all the generators, the ESRGAN network achieves the best results compared to other networks. Therefore, we provide a detailed explanation about its structure, parameters, and simulation results from PSNR, SSIM, and MS-SSIM perspectives. The SRGAN model inspires the architecture of the ESRGAN model, and both are similar in most properties with some differences in structure.
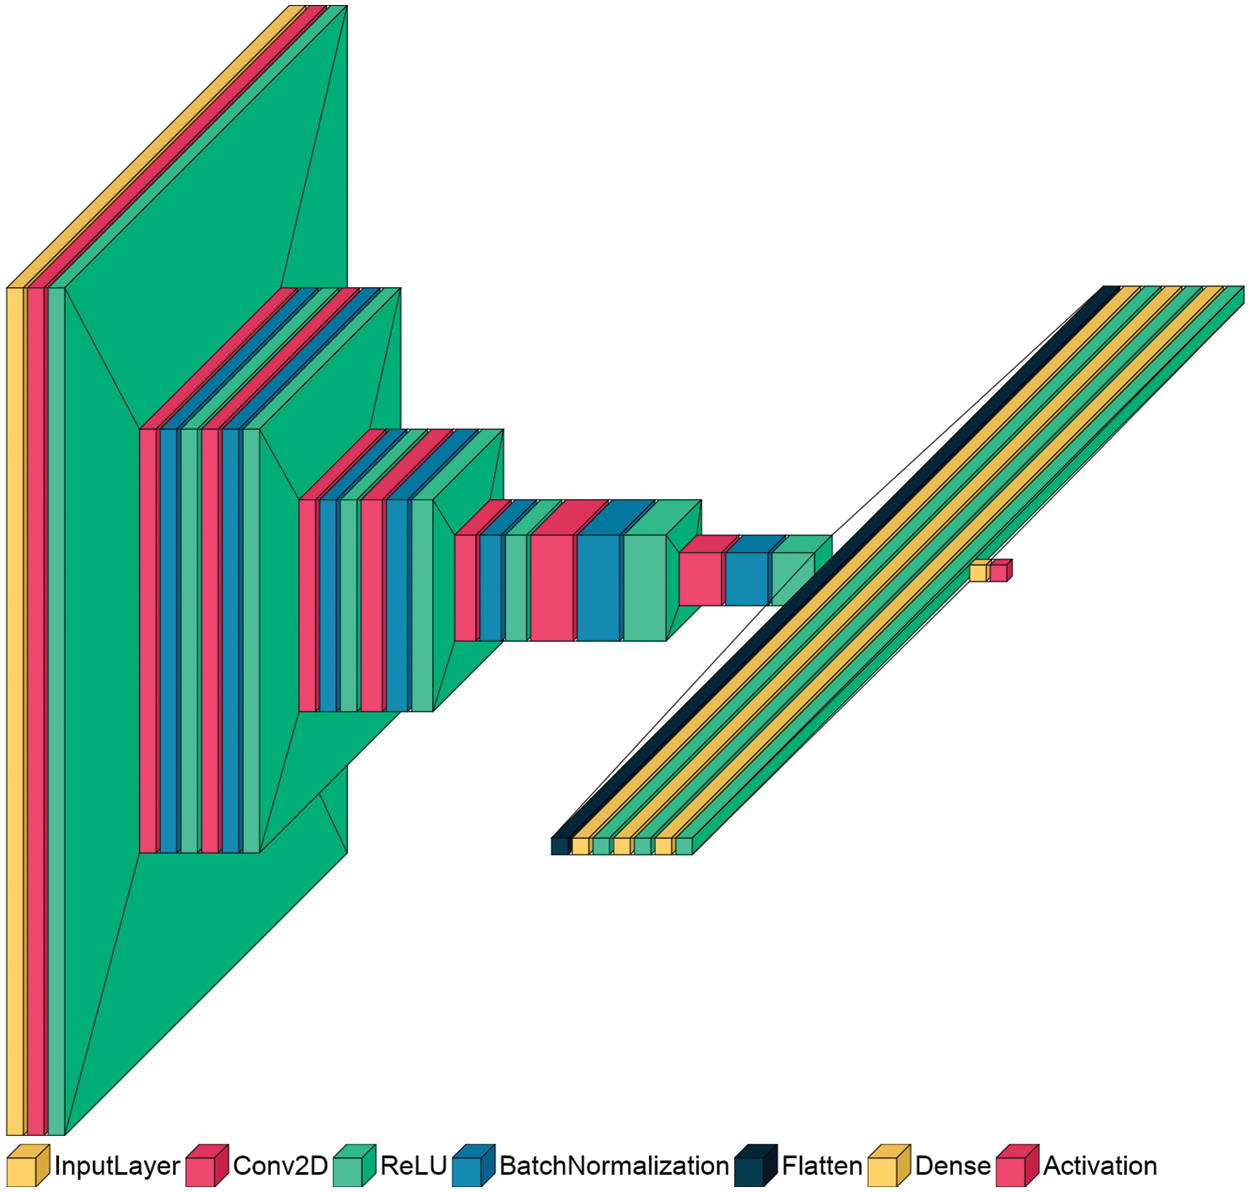
Figure 2: Architecture of the proposed discriminator model
In this paper, the focus is on the structure of the generator part only of the ESRGAN model. The generator consists of a Residual-in-Residual Dense Block (RRDB), which is mainly inspired by the DenseNet model [16] and connects all layers within the Residual block directly to each other. In addition, removing the batch normalization layers from each RRDB in the ESRGAN model reduces artifacts and computational complexity with increased efficiency. The leaky version of a Rectified Linear Unit (ReLU) is also used to activate RRDB layers that can conv2D layers from extracting more features. Then, the feature dimensions are enlarged by a sub-pixel conv2D layer inspired by ESPCN [5].
The significant drawback of the generator network of the ESRGAN model is that it performs complex calculations compared to other GAN models, and with this, the performance of the network is greatly enhanced. So, in order to provide a realistic comparison, another generator model called sub-pixel GAN will be presented. The outstanding feature is that it enhances the performance of the GAN without the need for complex calculations.
The sub-pixel-GAN model is inspired by ESPCN [5], but some layers are modified and then used as a generator network in the GAN model. As shown in Fig. 3, the architecture of the sub-pixel generator network includes seven different connected layers. It consists of five Conv2D layers and two depth-to-space layers. Initially, the breast cancer images are resized to 64 × 64 × 3 to fit the input layer of the sub-pixel generator model. These images are then passed through convolutional layers in order to extract the features. Convolutional layers consist of filters of 5 × 5 and 3 × 3 sizes, and the convolution stride is fixed to one per pixel. This is to ensure that the spatial dimensions of the features remain constant and that the best values for weights are obtained; ReLU is used in all convolutional layers. In addition, the enlarge factor of size 2× is applied in the depth-to-space layers. In the proposed sub-pixel-generator model, all weights layers are initialized by orthogonal weights. The notable advantage of the sub-pixel-generator model is that it boosts the performance of GAN without the need for many convolutional layers or deep RRDB layers. This means that the computational complexity of the model, in general, is as small as possible while maintaining a very high performance compared to the SR models. More details about the structures and interpretations of other SR models (EDSR-GAN, SR-GAN, and WDSR-b-GAN) are explored in [2–4,12].
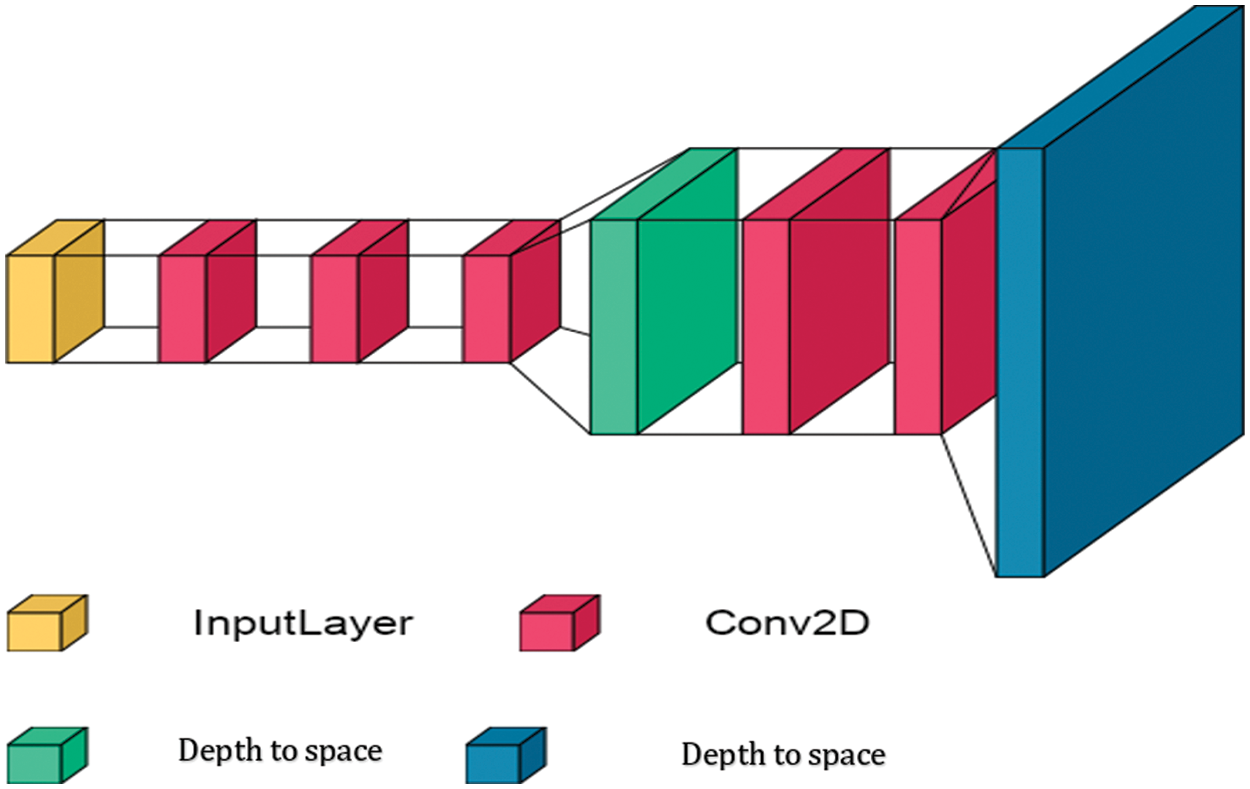
Figure 3: Architecture of the proposed sub-pixel generator model
The strengths of the GAN models are represented in three points: the generator and discriminator network, explained in the previous paragraphs, and the cost function. The cost function is the most critical factor for the success of the SR model based on the GAN. In addition to deep tuning the weights of the layers, the cost function is used to measure the extent of the error of the model in finding a relationship between the inputs and the outputs. It is an iterative function that is repeatedly used during the training process to determine the best weights based on optimization algorithms. The cost function succeeds when it achieves the minimum error rate. The cost function describing the proposed multi-SR framework is expressed as:
where
where Y is HR image,
The VGG loss is another content loss function applied over generated images and real images. VGG19 is a very popular deep neural network that is mostly used for image classification [13]. The intermediate layers of a pre-trained VGG19 network work as feature extractors and can be used to extract feature maps of the generated images and the real images. The VGG loss is based on these extracted feature maps. It is calculated as the Euclidean distance between the feature maps of the generated image and the real image. The used VGG loss is expressed as:
where
In this phase, transfer learning is applied to diagnose breast cancer images. Transfer learning is considered as the best medical image diagnostic method due to its high ability to transfer what has been learned from the classification of general images and then apply it to medical images. Transfer learning is divided into three methods, and the first method is called shallow-tuning, in which the last layer in the transfer learning model is changed to fit the new task. The second method is fine-tuning, which depends on the optimization method, in which more than one layer is updated to fit the new task. The last method used in this paper is deep-tuning, in which all layers of the model are updated to fit the new classification task while keeping the weights as the initial value. The primary objective of the classification phase is to test multiple SR framework models. A pre-trained ResNeXt model is used on ImageNet competition data and achieves the highest efficiency. Initially, a data augmentation technique is applied to solve the overfitting problem. Data augmentation technology is a technology that changes the shape of images before they enter the ResNeXt model. in this work, two types are applied, including horizontal and vertical random flips, and 45 degree random rotation. The normalization of each color channel is also done by means of [0.485, 0.456, 0.406] and standard deviations of [0.229, 0.224, 0.225]. The ResNeXt model is trained seven times, each on a different dataset; five times on the output of the data after applying SR framework models. The ResNeXt model is also trained on the original high-resolution images. Moreover, it is trained on the low-resolution image to make a comparison between training the same ResNeXt model on different data and to show the superiority of SR techniques in improving and maintaining the results of the diagnostic process.
2.4 Performance Evaluation Phase
A comprehensive analysis is carried out in the final phase to evaluate GAN-based and transfer-learning models. We evaluate multi-SR-GAN models on four metrics, including SSIM [17], MSE, PSNR [18], MS-SSIM [19], and histogram. We also evaluate the transfer learning models by curves of loss and accuracy, specificity negative true rate (TNR), accuracy positive predictive value (PPV), recall positive true rate (TPR), sensitivity, and F1 score classification performance. They are comprehensively included in the research community to provide comprehensive assessments of classification approaches. The following are the mathematical formulas for these evaluation metrics [20,21]:
where
This section discusses the experiments and corresponding results obtained after applying five SR frameworks based on GAN models and transfer learning models under the histopathological breast cancer dataset, where it is also unbalanced data.
The medical image data set for breast cancer known as BreakHis [11] is used. The medical images of breast cancer are recorded in two forms, the first is ultrasound images, and the second is histopathological images. BreakHis is a dataset from 82 patients, consisting of 7,909 images. The BreakHis dataset has different magnification factors including 40×, 100×, 200×, and 400× and consists of 5429 malignant sample images and 2480 benign sample images [22,23]. A total of 7909 images are used after the image duplication test. It was found that there were 126 duplicate images, and they were deleted. The image duplication test ensures that correct results are obtained.
3.2 Training Multi-SR Framework
Training in the SR phase is a single-phase, where in most GAN research, the VGG-19 model is first trained on the database used in the GAN, and then VGG-19 is used in the content loss. However, we use ImageNet's competition weights for the VGG-19 model and in the content loss function, which saves a lot of time and leads to more efficient results. After that, the BreaKHis dataset is used to train five different SR models, including ESRGAN, EDSRGAN, Sub-Pixel-GAN, SRGAN, and WDSR-b-GAN. Multi-SR framework networks are trained with four pairs of images (LR, HR) in which LR images enter for generator models and HR images for discriminant models. The Google Colab Pro service is used in the proposed work application for its efficiency. 1700 images from the BreakHis dataset are applied to the multi-SR framework due to the slowness of training of the GAN models in general. Also, 100 images are used as validation data to test the SR models. All models are trained with the same methods as follows:
1) Adam optimizer is applied with a learning rate of 0.0002 during training.
2) The binary cross-entropy function is applied to train the discriminator.
3) Two loss functions are used to calculate the perceptual loss criterion, and they are also used in the backpropagation. They are MSE and content loss.
4) All models are trained on 1000 batches. Each batch contains four random images. Performance measures are observed, and the regression of the upper and lower part of the network is observed for each generator model and discriminator.
5) The sigmoid function is used in the output layer in the proposed discriminant model.
Google Colab Pro features a T4 or P100 GPU and a high-memory virtual machine with 25 GB of available RAM. Moreover, all models are trained on the same Google Colab pro service. The conditional training method is also used, in which the best weights of the generator models are stored only when the best results are achieved when evaluating the model in each batch.
The ResNeXt model is trained using the deep-tuning method by changing the last layer to a fully connected layer with a size of 1024. The trainable parameters are 86.746 M, and the cross-entropy loss is used to calculate the loss function. Also, we apply the Adam optimizer with a learning rate of 0.0001. We divide the data in a ratio of 90 to 10, so that the 90% represents the percentage of training data, which is 7008 images, and the 10% represents the percentage of investigation data, which is 784 images. The Pytorch library is also used in its latest version with Python version 3.8.
3.4.1 Multi-SR Framework Results
This subsection describes the results of the conducted experiments for the super-resolution part. 1,700 random images train all GAN-based SR models from the BreaKHis breast cancer dataset, and 100 random images evaluate each model. Models are evaluated by several metrics, including PSNR, SSIM, MS-SSIM, trainable parameters, and size parameters. The MSE scale is ignored because the PSNR scale is based on the MSE as given in (6). The discriminant model is constant in all the proposed GAN models, containing 141 million trainable parameters with a size of 2179,189 MB. The GAN-based SR models are trained twice to ensure a comprehensive comparison, using the MSE loss function in the generator and the content-loss based on VGG-19 as a loss function.
As shown in Tab. 1, the results of the five GAN-based SR models are compared using MSE as a loss function for the generation models. It shows the superiority of the ESRGAN model over the rest of the models in terms of metric performance SSIM, PSNR, MS-SSIM. However, it is the largest model in the trainable variables and the size of the parameters. Therefore, ESRGAN is considered the best model with high accuracy, but it needs time and large memory. Moreover, all models excel at bicubic interpolation. Images samples generated from each model given in Tab. 1 are shown in Fig. 4.

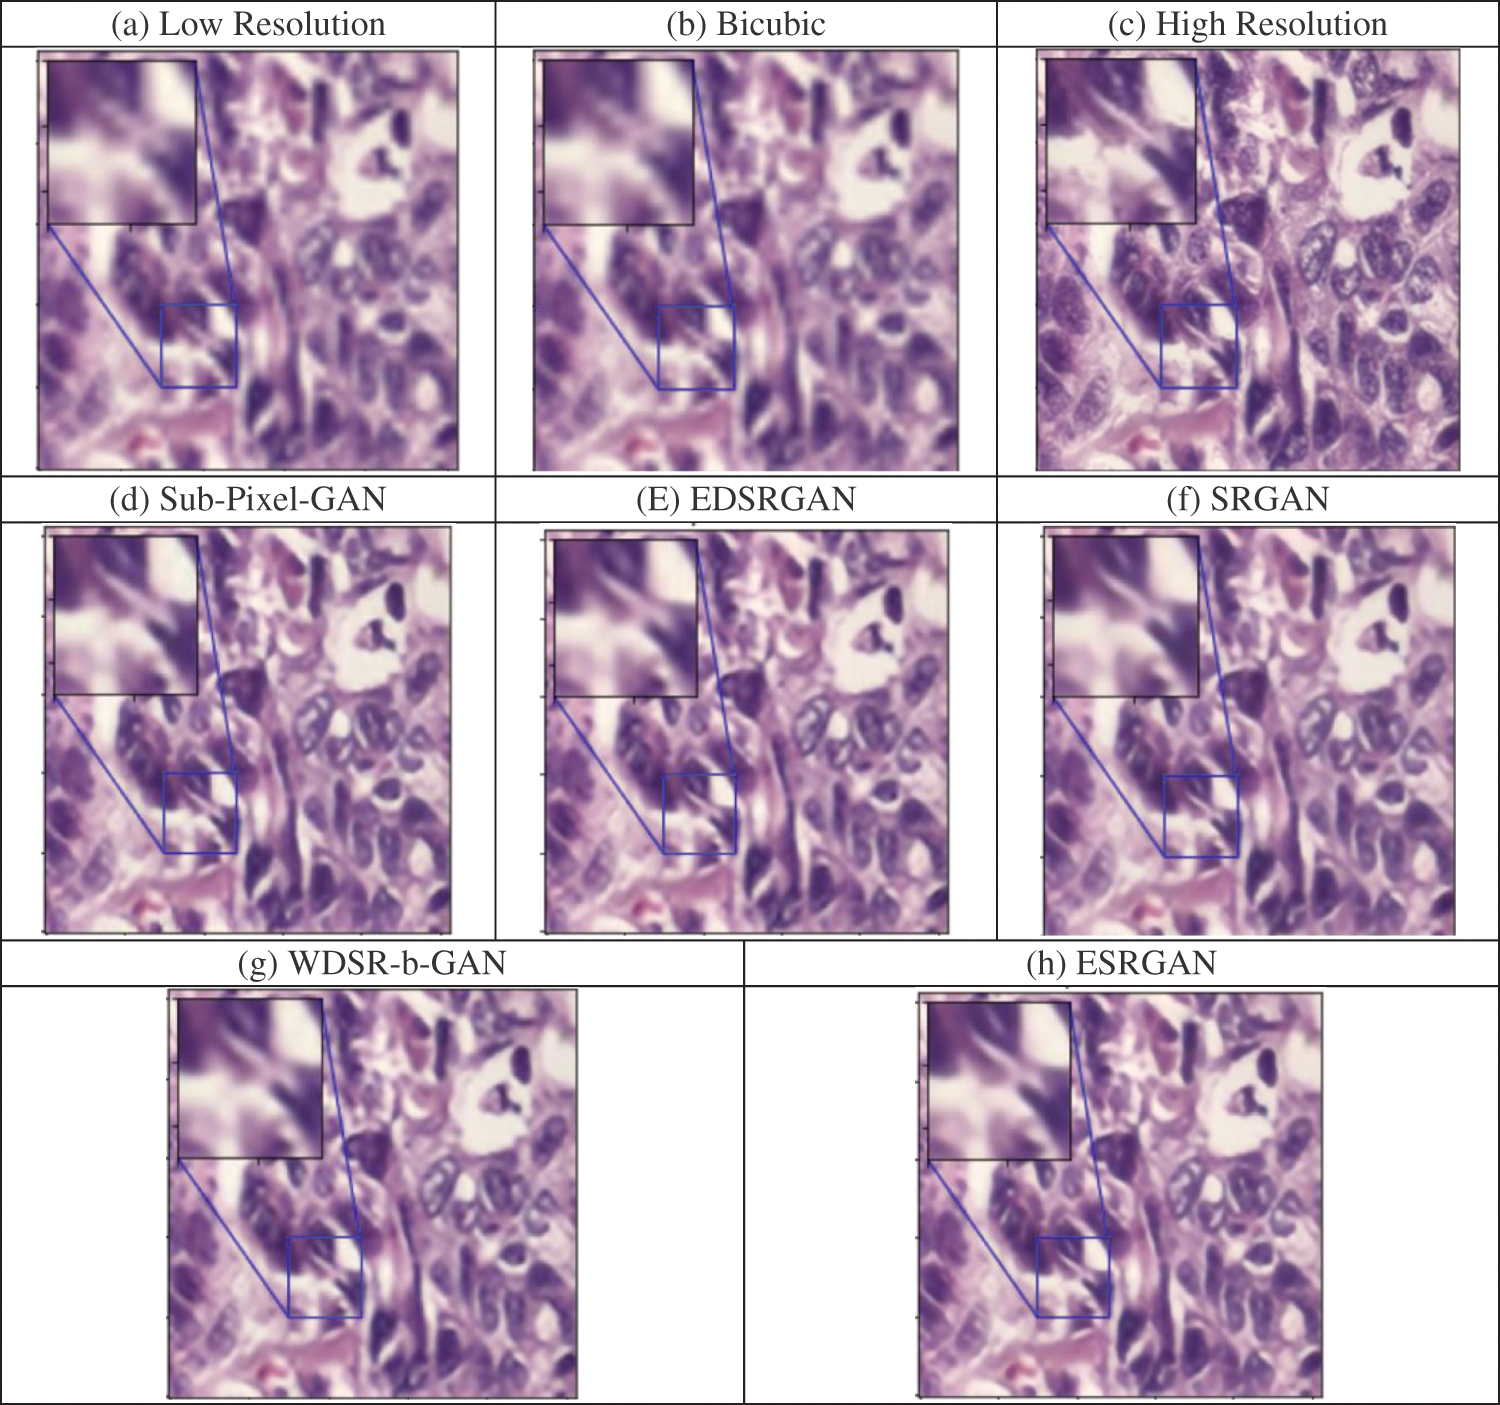
Figure 4: A sample of generated images from the multi-SR framework based on MSE. (a) low resolution (LR) image with the dimension of 64 × 64 × 3, (b) the result of the bicubic interpolation, (c) the ground truth (HR) image with the dimension of 256 × 256 × 3, (d) to (h) are the results of different SR models, and (h) the result of the ESRGAN model in which we have gained the best result for metrics performance
We retrain the multi-SR framework models but using content-loss based on the VGG-19 model, where it shows higher efficiency than MSE as a loss function as given in Tab. 2. The superiority of the ESRGAN model over all other models is shown by using VGG-19 as a loss function, but it has the largest share in the number of trainable parameters. However, the higher efficiency compensates this in terms of SSIM, PSNR, and MS-SSIM, which makes the large size of parameters acceptable. The smallest model in terms of the size of the trainable parameters is Sub-Pixel-GAN, which achieves high efficiency, approaching the ESRGAN model with a difference of 0.0127, which is widely accepted in most applications. The small size of the Sub-Pixel-GAN model is an advantage in terms of reducing computational complexity and can be applied to the lowest GPU requirements. Images samples generated from each model given in Tab. 2, after using the VGG-19 model as a loss function, are shown in Fig. 5. It shows how the image generated from the ESRGAN model is close to the original HR image.

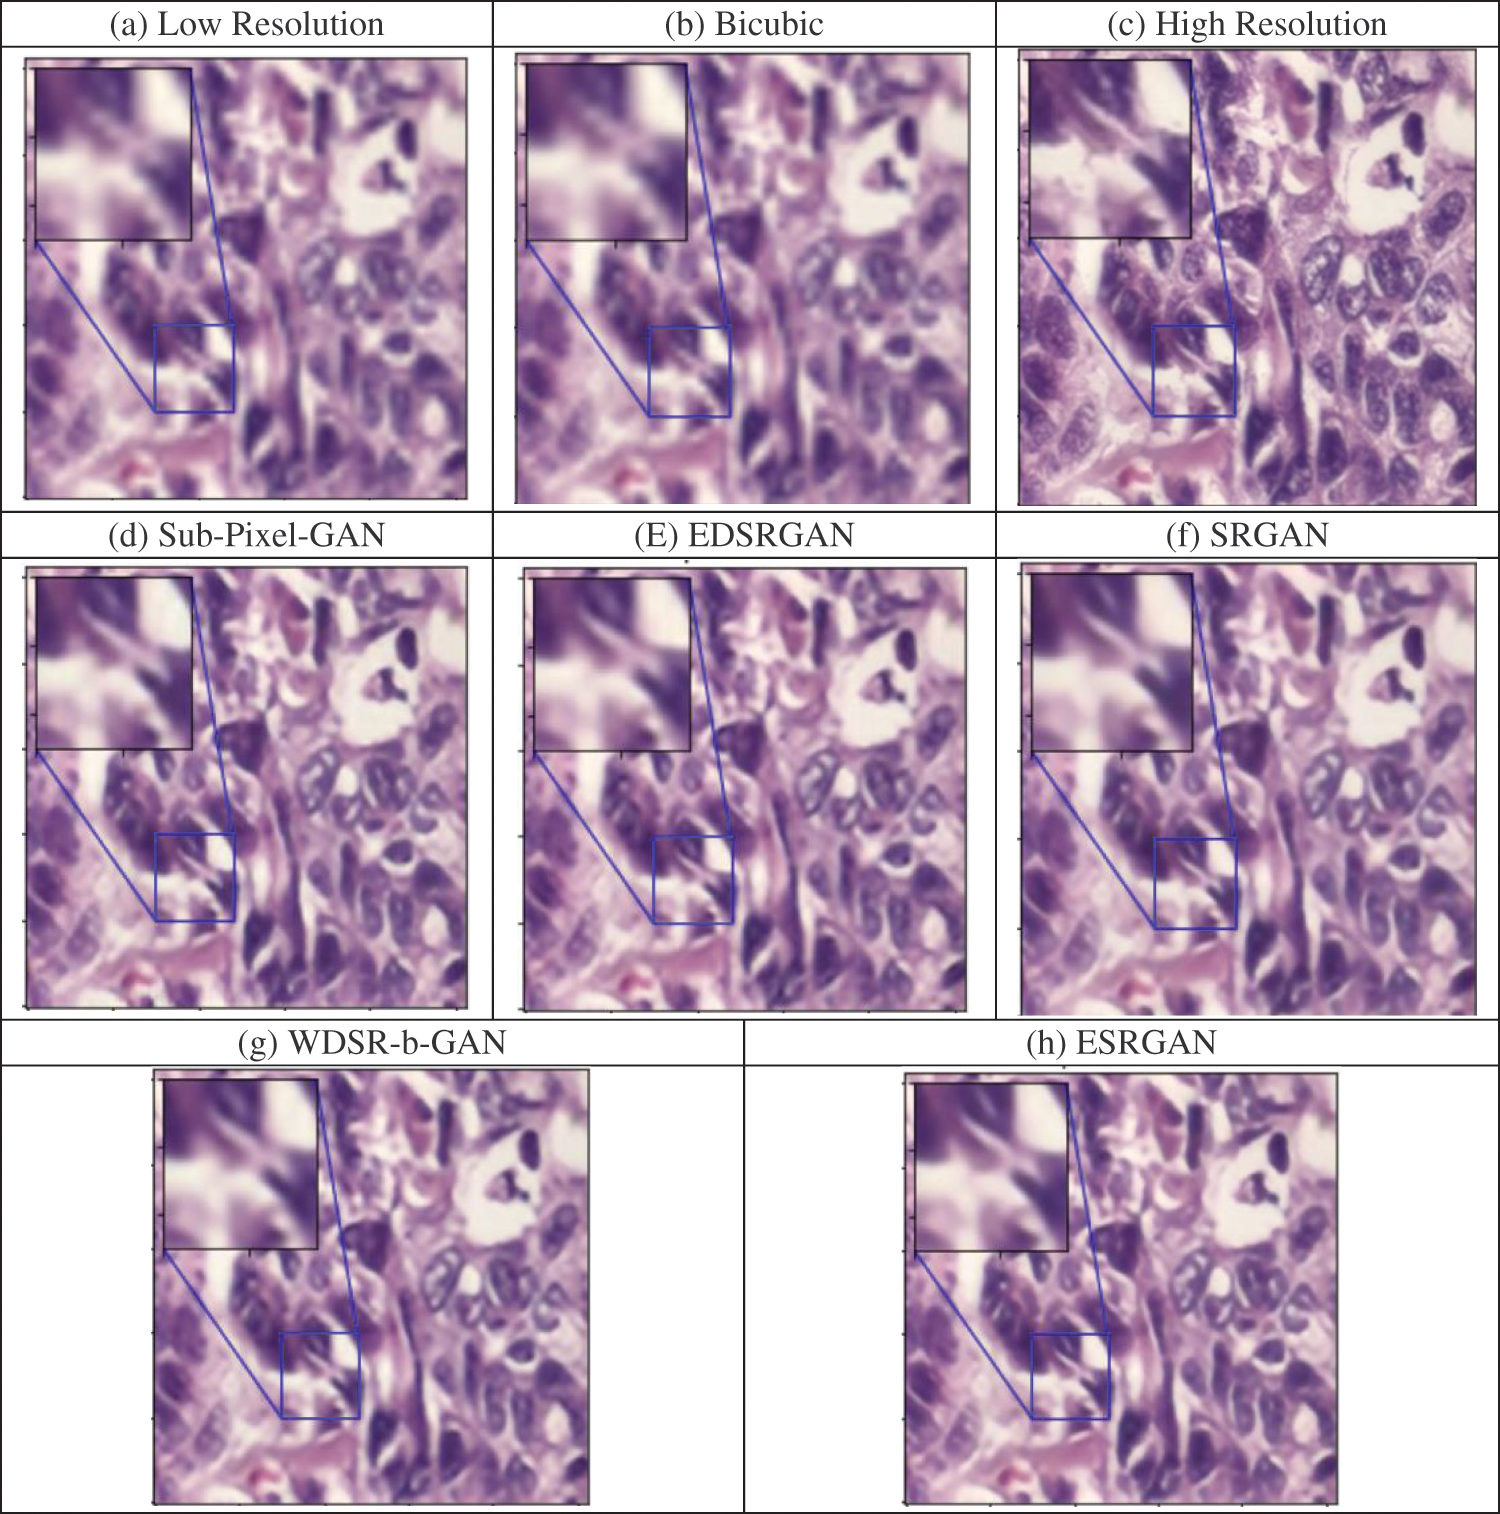
Figure 5: A sample of generated images from the multi-SR framework based on VGG-19 loss. (a) low resolution (LR) image with the dimension of 64 × 64 × 3, (b) the result of the bicubic interpolation, (c) the ground truth (HR) image with the dimension of 256 × 256 × 3, (d) to (h) are the results of different SR models, and (h) the result of the ESRGAN model in which we have gained the best result for metrics performance
In Fig. 6, the histogram of a random image from the data set is calculated. We divide the results of the histogram into three sections. The first section contains the histogram of the original image, and it is repeated in all rows for clarifications. The second section contains the histogram after applying each model of the multi-SR framework on the random image. For the purpose of efficient comparisons, in the third section, we evaluate the histogram of the random image after entering it into the bicubic interpolation.
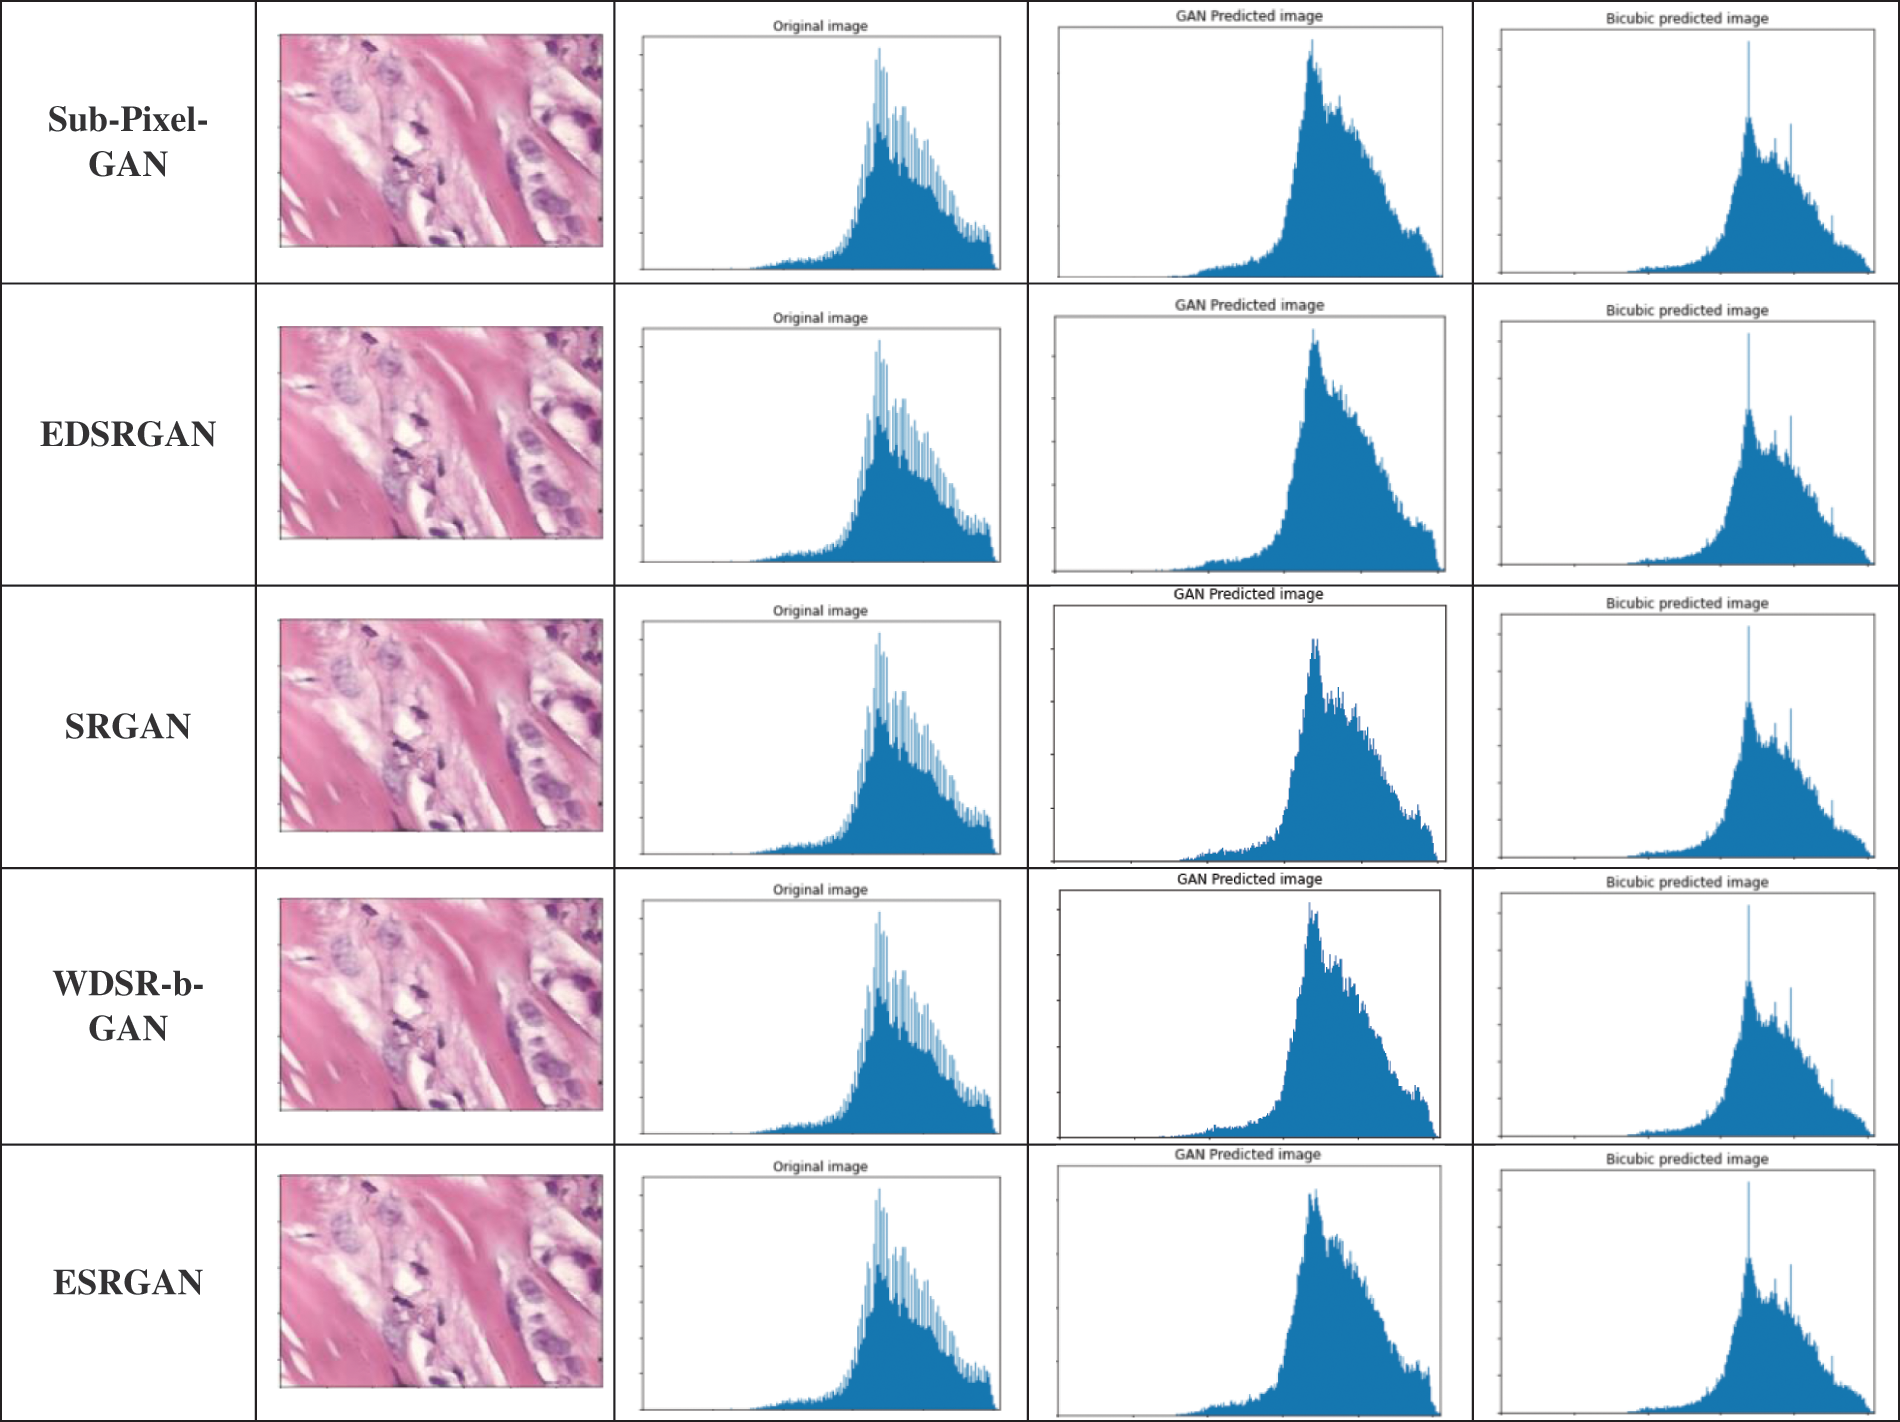
Figure 6: Histogram simple image from the multi-SR framework based on VGG-19 loss
3.4.2 Results of Two-Class Classification
Three different images (HR, LR, and SR) with a size of 256 × 256 × 3 are used to evaluate the proposed framework. The proposed ResNeXt-101(32 × 8d) model is trained with different 64 epochs. Other CNN models based on the VGG-19 content loss are also tested in the proposed framework: ESRGAN, EDSRGAN, Sub-Pixel-GAN, SRGAN, and WDSR-b-GAN. Tab. 3 presents the experimental results for each tested image. The ResNeXt model achieves an accuracy of 99.6149% and a loss of 0.01086 for epoch 57 for the HR images. In addition, the model achieves an accuracy of 98.5879% and a loss of 0.0403 for epoch 59 for the LR images.

Tab. 4 shows the results obtained for two classifications coming from the ResNeXt101_32 × 8d model after applying the multi-SR framework. These results confirm and prove the acquired outcomes in Fig. 7. Fig. 7 offers the loss and accuracy curves of the testing and training processes for the ResNeXt101_32x8d model. It is noticed that both accuracy and loss curves are steady before less than ten epochs. Also, there is no overfitting that occurs in the proposed model.

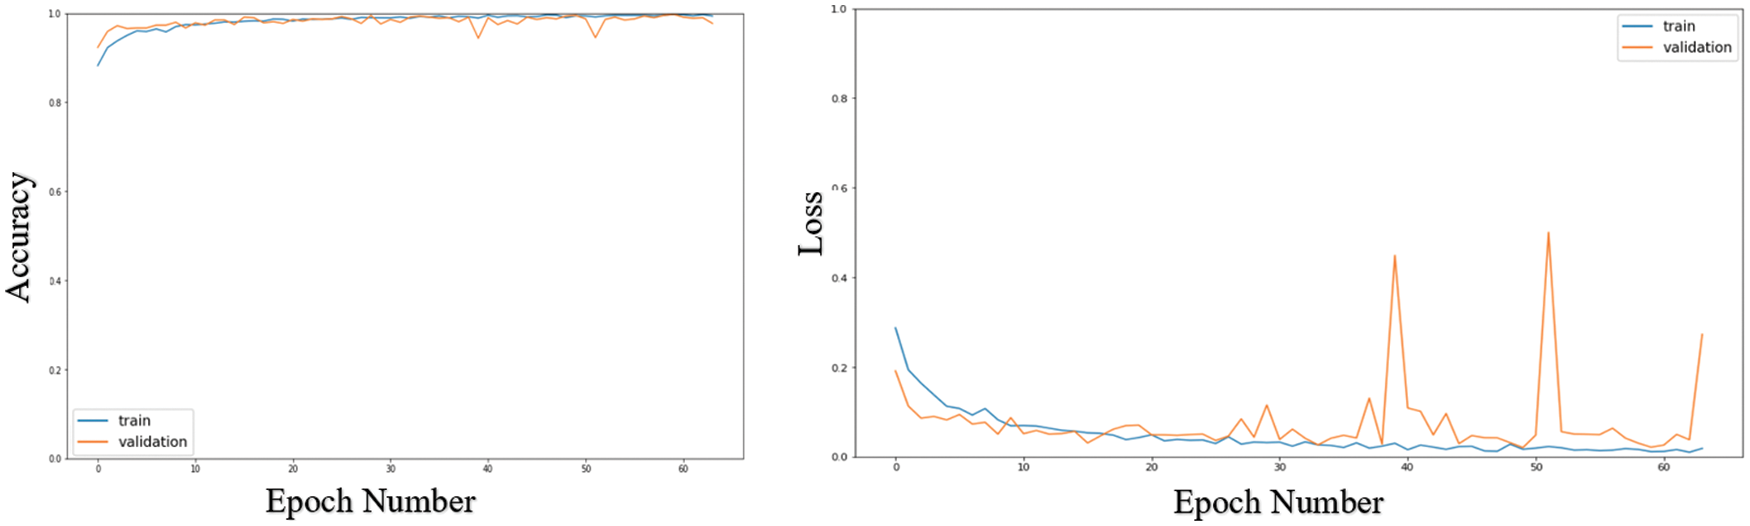
Figure 7: Loss and accuracy curves of the ResNeXt101_32 × 8d model after using the ESRGAN model
This paper presented a multi-SR framework for medical images. This framework is efficient and robust to perform the learning process in training a set using a different set of enlargement techniques and different formulations. The combination of several loss functions, including adversarial loss, image loss, MSE loss, and perception loss, have been employed in the proposed models. To estimate the perception loss function, the pre-trained VGG-19 model was used and employed without the need to retrain it and use the ImageNet competition weights. We proposed the discriminator model for all generators to fairly correct the generator. The multi-SR framework was trained twice, once using the MSE loss function for the generator, and once using the VGG-19 model as a loss function. Then, features from images were extracted and then applied to the MSE equation, called perception loss. Also, different methods have been applied to measure the performance of SR models, including PSNR, SSIM, and MS-SSIM. It was noticed that the ESRGAN model worked better without the need for layers of equalization weight, and it also achieved the highest results in performance measures with a classification accuracy of 99.7433%.
Acknowledgement: The authors extend their appreciation to the Deputyship for Research & Innovation, Ministry of Education in Saudi Arabia for funding this research work through the Project Number (IF-PSAU-2021/01/18585).
Funding Statement: The authors extend their appreciation to the Deputyship for Research & Innovation, Ministry of Education in Saudi Arabia for funding this research work through the project number (IF-PSAU-2021/01/18585).
Conflicts of Interest: The authors declare that they have no conflicts of interest to report regarding the present study.
1. C. DeSantis, F. Bray, J. Ferlay, J. Lortet-Tieulent and B. Anderson, “International variation in female breast cancer incidence and mortality rates,” Cancer Epidemiology and Prevention Biomarkers, vol. 24, no. 10, pp. 1495–1506, 2015. [Google Scholar]
2. C. Ledig, L. Theis, F. Huszár, J. Caballero and A. Cunningham, “Photo-realistic single image super-resolution using a generative adversarial network,” in Proc. IEEE Conf. on Computer Vision and Pattern Recognition (CVPR), Honolulu, USA, pp. 105–114, 2017. [Google Scholar]
3. W. El-Shafai, S. Abd El-Nabi, E. El-Rabaie, A. Ali and F. Soliman, “Efficient deep-learning-based autoencoder denoising approach for medical image diagnosis,” Computers, Materials and Continua, vol. 70, no. 3, pp. 6107–6125, 2022. [Google Scholar]
4. W. El-Shafai, A. Mohamed, E. El-Rabaie, A. Ali and F. Soliman, “Automated COVID-19 detection based on single-image super-resolution and CNN models,” Computers, Materials and Continua, vol. 69, no. 3, pp. 1141–1157, 2021. [Google Scholar]
5. W. Shi, J. Caballero, F. Huszár, J. Totz and A. Aitken, “Real-time single image and video super-resolution using an efficient sub-pixel convolutional neural network,” in Proc. of the IEEE Conf. on Computer Vision and Pattern Recognition (CVPR), Honolulu, USA, pp. 1874–1883, 2016. [Google Scholar]
6. S. Bashir, Y. Wang, M. Khan and Y. Niu, “A comprehensive review of deep learning-based single image super-resolution,” PeerJ Computer Science, vol. 7, no. 3, pp. 11–21, 2021. [Google Scholar]
7. N. Soliman, N. Ali, M. Aly, A. Algarni and W. El-Shafai, “An efficient breast cancer detection framework for medical diagnosis applications,” Computers, Materials and Continua, vol. 70, no. 1, pp. 1315–1334, 2022. [Google Scholar]
8. Z. Wang, J. Chen and S. Hoi, “Deep learning for image super-resolution: A survey,” IEEE Transactions on Pattern Analysis and Machine Intelligence, vol. 3, no. 4, pp. 102–129, 2020. [Google Scholar]
9. F. Shahidi, S. Daud, H. Abas, N. Ahmad and N. Maarop, “Breast cancer classification using deep learning approaches and histopathology image: A comparison study,” IEEE Access, vol. 8, pp. 187531–187552, 2020. [Google Scholar]
10. S. Xie, R. Girshick, P. Dollár, Z. Tu and K. He, “Aggregated residual transformations for deep neural networks,” in Proc. of the IEEE Conference on Computer Vision and Pattern Recognition (CVPR), Honolulu, USA, pp. 1492–1500, 2017. [Google Scholar]
11. F. Spanhol, L. Oliveira, C. Petitjean and L. Heutte, “A dataset for breast cancer histopathological image classification,” IEEE Transaction of Biomedical Engineering, vol. 63, no. 7, pp. 1455–1462, 2016. [Google Scholar]
12. F. Alqahtani, M. Amoon and W. El-Shafai, “A fractional Fourier based medical image authentication approach,” Computers, Materials and Continua, vol. 70, no. 2, pp. 3133–3150, 2022. [Google Scholar]
13. W. El-Shafai, F. Khallaf, E. El-Rabaie and F. Abd El-Samie, “Robust medical image encryption based on DNA-chaos cryptosystem for secure telemedicine and healthcare applications,” Journal of Ambient Intelligence and Humanized Computing, vol. 1, no. 5, pp. 1–29, 2021. [Google Scholar]
14. W. El-Shafai, A. Algarni, G. El Banby, F. El-Samie and N. Soliman, “Classification framework for COVID-19 diagnosis based on deep CNN models,” Intelligent Automation and Soft Computing, vol. 30, no. 3, pp. 1561–1575, 2022. [Google Scholar]
15. N. Soliman, S. Abd-Alhalem, W. El-Shafai, S. Abdulrahman and F. Abd El-Samie, “An improved convolutional neural network model for DNA classification,” Computers, Materials and Continua, vol. 70, no. 3, pp. 5907–5927, 2022. [Google Scholar]
16. G. Huang, Z. Liu, L. Maaten and K. Weinberger, “Densely connected convolutional networks,” in Proc. of the IEEE Conf. on Computer Vision and Pattern Recognition (SVPR), Honolulu, USA, pp. 4700–4708, 2017. [Google Scholar]
17. Z. Wang, A. Bovik, H. Sheikh and E. Simoncelli, “Image quality assessment: From error visibility to structural similarity,” IEEE Transactions on Image Processing, vol. 13, no. 4, pp. 600–612, 2004. [Google Scholar]
18. W. Lin and C. Jay, “Perceptual visual quality metrics: A survey,” Journal of Visual Communication and Image Representation, vol. 22, no. 4, pp. 297–312, 2011. [Google Scholar]
19. Z. Wang, E. Simoncelli and A. Bovik, “Multiscale structural similarity for image quality assessment,” Signals, Systems Computers, vol. 2, no. 3, pp. 1398–1402, 2003. [Google Scholar]
20. P. Wang, J. Wang, J. Li, P. Li and M. Jiang, “Automatic classification of breast cancer histopathological images based on deep feature fusion and enhanced routing,” Biomedical Signal Processing and Control, vol. 65, no. 2, pp. 102–119, 2021. [Google Scholar]
21. W. El-Shafai, A. Mahmoud, E. El-Rabaie, T. Taha and F. El-Samie, “Efficient deep CNN model for COVID-19 classification,” Computers, Materials and Continua, vol. 70, no. 3, pp. 4373–4391, 2022. [Google Scholar]
22. A. Algarni, W. El-Shafai, G. El Banby, F. El-Samie and N. Soliman, “An efficient CNN-based hybrid classification and segmentation approach for COVID-19 detection,” Computers, Materials and Continua, vol. 70, no. 2, pp. 4393–4410, 2022. [Google Scholar]
23. W. El-Shafai and F. Abd El-Samie, “Extensive COVID-19 X-Ray and CT chest images dataset,” Mendeley Data, v3, http://dx.doi.org/10.17632/8h65ywd2jr.3, 2020. [Google Scholar]
 | This work is licensed under a Creative Commons Attribution 4.0 International License, which permits unrestricted use, distribution, and reproduction in any medium, provided the original work is properly cited. |