DOI:10.32604/cmc.2022.023641
| Computers, Materials & Continua DOI:10.32604/cmc.2022.023641 | |
| Article |
Recurrent Autoencoder Ensembles for Brake Operating Unit Anomaly Detection on Metro Vehicles
1Department of Software, Korea National University of Transportation, Chungju, 27469, Korea
2School of Railroad Engineering, Korea National University of Transportation, Uiwang, 16106, Korea
3Graduate School of Transportation, Korea National University of Transportation, Uiwang, 16106, Korea
4Department of AI Robotics Engineering, Korea National University of Transportation, Chungju, 27469, Korea
5Department of Biomedical Engineering, Korea National University of Transportation, Chungju, 27469, Korea
6Department of IT Convergence (Brain Korea PLUS 21), Korea National University of Transportation, Chungju, 27469, Korea
*Corresponding Author: Jeonghwan Gwak. Email: jgwak@ut.ac.kr
Received: 15 September 2021; Accepted: 22 November 2021
Abstract: The anomaly detection of the brake operating unit (BOU) in the brake systems on metro vehicle is critical for the safety and reliability of the trains. On the other hand, current periodic inspection and maintenance are unable to detect anomalies in an early stage. Also, building an accurate and stable system for detecting anomalies is extremely difficult. Therefore, we present an efficient model that use an ensemble of recurrent autoencoders to accurately detect the BOU abnormalities of metro trains. This is the first proposal to employ an ensemble deep learning technique to detect BOU abnormalities in metro train braking systems. One of the anomalous cases on metro vehicles is the case when the air cylinder (AC) pressures are less than the brake cylinder (BC) pressures in certain parts where the brake pressures increase before coming to a halt. Hence, in this work, we first extract the data of BC and AC pressures. Then, the extracted data of BC and AC pressures are divided into multiple subsequences that are used as an input for both bi-directional long short-term memory (biLSTM) and bi-directional gated recurrent unit (biGRU) autoencoders. The biLSTM and biGRU autoencoders are trained using training dataset that only contains normal subsequences. For detecting abnormalities from test dataset which consists of abnormal subsequences, the mean absolute errors (MAEs) between original subsequences and reconstructed subsequences from both biLSTM and biGRU autoencoders are calculated. As an ensemble step, the total error is calculated by averaging two MAEs from biLSTM and biGRU autoencoders. The subsequence with total error greater than a pre-defined threshold value is considered an abnormality. We carried out the experiments using the BOU dataset on metro vehicles in South Korea. Experimental results demonstrate that the ensemble model shows better performance than other autoencoder-based models, which shows the effectiveness of our ensemble model for detecting BOU anomalies on metro trains.
Keywords: Anomaly detection; brake operating unit; deep learning; machine learning; signal processing
A smart city (SC) is defined as a living space that requires high-tech information to improve the quality of residents’ lifestyles and to efficiently manage the available resources such as building activities, environments, roads, and the metro. In SC, safety engineering is a core discipline that ensures the functioning of a system to deal with the possible failure of the system. Especially for the metro system, the reliability of the brake system on a metro train is extremely crutial for the safety of the train's operation. The brake system contains a brake operation unit (BOU), an electronic control unit (ECU), a pneumatic operating unit (POU), a mechanical brake actuator, and a friction material, and these components communicate with each other dynamically [1,2]. The BOU is the most critical component among all components since the anomalous behavior of the BOU might jeopardize the trains’ ability to run reliably and safely. Therefore, it is necessary to detect BOU abnormalities as soon as possible. One of the anomalous cases on metro vehicles is the case when the air cylinder (AC) pressures are less than the brake cylinder (BC) pressures in certain parts where the brake pressures increase before coming to a halt as shown in Fig. 1. However, it is very difficult to detect abnormalities using periodic inspection and maintenance. Also, building a stable and robust system for detecting anomalies is a very difficult task.

Figure 1: Normal and abnormal cases of the BOU data
Anomaly detection is the process of identifying anomalous data points which differ considerably from the bulk of data points. It plays a vital role in a variety of fields such as AI safety, security, risk management, and financial surveillance. Over the past years, deep learning approaches have been proven to be very effective in detecting abnormalities. Given a labeled set which contains abnormal and normal behavior for training, supervised classification can be used for classifying a test sample as either abnormal or normal. However, it is very hard to acquire a labeled data for abnormal behavior. As a result, the anomaly detection model may produce an erroneous decision function if it is trained with inadequate data samples. On the contrary, obtaining normal data samples is not difficult. Therefore, the one-class classifier is often used for detecting abnormalities on metro trains. In one-class classifier, only normal data samples are utilized for training a model. After training the model, the data sample which deviates from the normality is categorized as abnormalities.
In this study, we propose a novel methodology to detect BOU abnormalities on metro trains using an ensemble of recurrent autoencoders. First, we extract data of BC and AC pressures. Then, extracted BC and AC pressure data are divided into multiple subsequences that are used as an input for both bi-directional long short-term memory (biLSTM) and bi-directional gated recurrent unit (biGRU) autoencoders. The biLSTM and biGRU autoencoders are trained using training dataset that only contains normal subsequences. For detecting abnormalities from test dataset which consists of abnormal subsequences, the mean absolute errors (MAEs) between original subsequences and reconstructed subsequences from both biLSTM and biGRU autoencoders are calculated. As an ensemble step, the total error is calculated by averaging two MAEs from biLSTM and biGRU autoencoders. The subsequence with total error greater than a predefined threshold is considered an anomaly. We carried out the experiments using the BOU dataset on metro vehicles in South Korea. Experimental results demonstrate that the ensemble model outperforms other autoencoder-based models, which shows the effectiveness of our ensemble model for detecting BOU anomalies on metro trains. To the best of the authors’ knowledge, this work is the earliest proposal which employs an ensemble of recurrent autoencoders for detecting abnormalities of the BOU in the brake systems on metro vehicles. The following is a summary of our contribution to this study:
■ We constructed a novel ensemble model to detect abnormalities of the BOU data on metro trains using an ensemble of recurrent autoencoders.
■ We presented a novel method that contains three steps: 1) extract BC and AC pressures from the BOU data and divide it into subsequences, 2) train our ensemble model which consists of biLSTM and biGRU autoencoders for our task, and 3) detect anomalies from test dataset by computing the mean absolute error (MAE).
■ We carried out an experiment using the BOU dataset on the metro vehicles in South Korea to demonstrate the effectiveness of our proposed ensemble model.
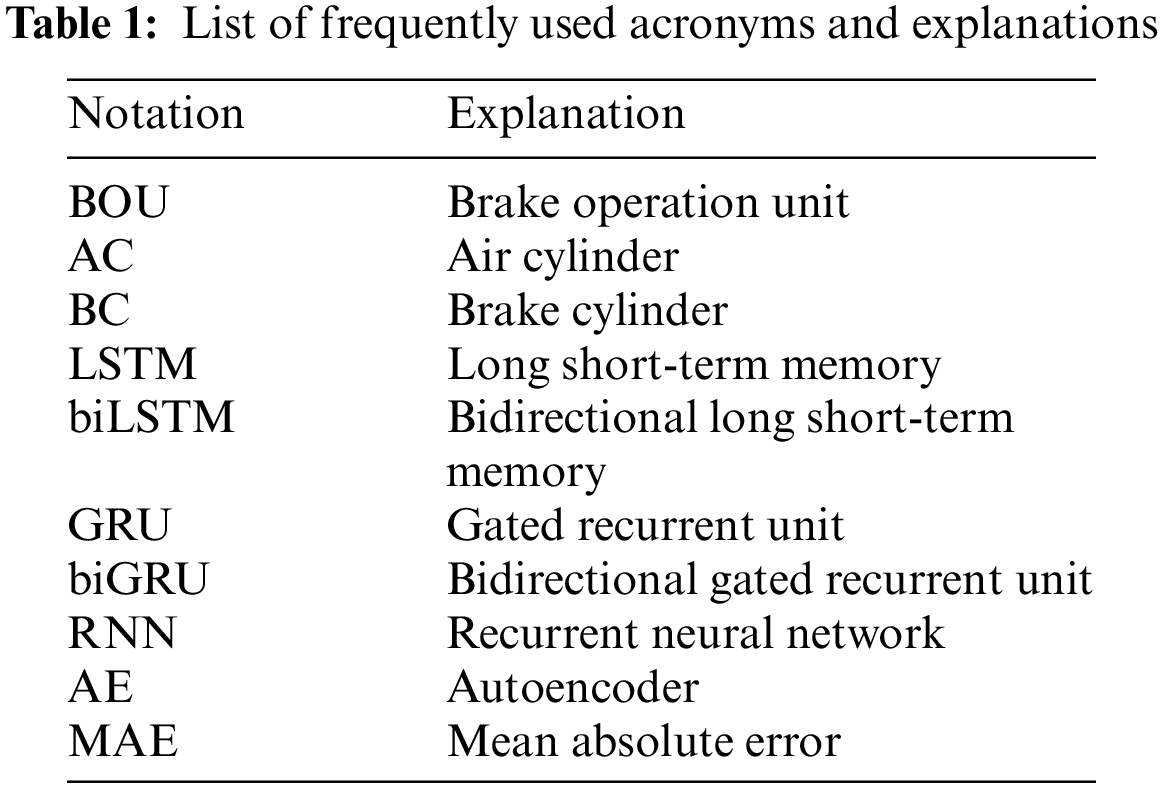
Tab. 1 shows a list of frequently used acronyms and explanations for readers to easily look up unfamiliar acronyms. The rest of this work is organized as follows. In Section 2, the related works are described. In Section 3, we introduce a detailed description of our proposed method. In Section 4, the experimental results are given. Finally, Section 5 concludes this work.
Recently, time-series anomaly detection has drawn attention in several fields including machine learning [3–7], statistics [8–10], data mining [11–13]. Supervised, unsupervised, or semi-supervised learning can be generally used for anomaly detection depending on whether the labeled dataset is available or not. Supervised learning methods require labeled data samples for training the model. However, these methods cannot detect unknown anomalies. Also, domain specialists are needed to label the data samples since most anomaly detection datasets are unlabeled datasets. Furthermore, manual labeling of a huge number of training dataset is a very exhasitive and cost/time-consuming works. Therefore, in the following subsections, we present unsupervised learning methods for detecting anomalies. Over the past few years, various unsupervised learning methods for detecting anomalies have been introduced. These methods can be divided into two categories: 1) conventional machine learning-based approaches and 2) deep learning-based approaches.
2.1 Traditional Machine Learning-based Methods
The data transformation technique such as Principal component analysis (PCA) for reducing the dimension of the data [14], can be used for anomaly detection. The authors in [15] presented a method to detect abnormalities using a PCA. In their method, the correlation matrix was used for calculating the principal component scores. The authors in [16] presented a method which uses a kernel-PCA for detecting novelty. First, they used the Gaussian kernel function for mapping the input data into higher dimensional space. Then, they extracted the principal components of the data point distribution. After that, they measured the novelties by computing the squared distance to the corresponding PCA subspace. The authors in [17] presented the PCA-based algorithm to detect abnormalities. First, they calculated an orthogonal distance between the data point and the PCA subspace. After that, the score distance was computed using Mahalanobis distance. If the distance is large, the data point is considered as an anomaly.
The distance-based techniques can be used as the unsupervised approaches for detecting anomalies [18]. The authors in [19] introduced a clustering-based technique for detecting unsupervised intrusion. First, the dataset was grouped into clusters using an incremental clustering method. After that, these clusters were labeled as either “normal” or “attack” by calculating the ratio of total points and included data points. Then, they used the labeled clusters to classify new data. The authors in [20] proposed a method which employs both a k-nearest neighbor (kNN) algorithm and a clustering algorithm for detecting anomalies using a telemetry dataset. First, they used kNN to select a set of data points near to normality. They regard the data points that are significantly apart from their closest neighbors to be anomalies. Then, they applied the single linkage clustering method to the selected data points in order to create a model. After that, they calculated the distances between the clusters and new data points. They regard the data points with a distance greater than the threshold to be anomalies. The authors in [21] introduced the local outlier factor (LOF) algorithm that assigns a degree of outlierness to each item based on how separated it is from its surrounding neighborhoods. They assumed that the data point distribution is spherical. The approach, on the other hand, cannot accurately quantify the local density if the data point distribution is linear. The authors in [22] presented a cluster-based local outlier factor (CBLOF) technique that uses the clustering algorithm rather than the kNN to give the degree of being an outlier to each item. The authors in [23] introduced a novel method to detect anomalies using the kNN. They measured the anomaly score of each data point by calculating the distance from the data point to its k-th nearest neighbors. After that, the data point is sorted based on its anomaly score. Then, the first n data points out of all the sorted data points were considered to be anomalies.
The one-class support vector machine (OC-SVM) can be utilized for detecting abnormalities in a semi-supervised or an unsupervised manner. The authors in [24] proposed a method for detecting novelty using the unsupervised OC-SVM that is trained on the entire dataset. However, if the training dataset contains anomalous data, the model's decision boundary will shift toward the anomalous data. As a result, the learned model cannot detect novelty accurately. To tackle this problem, The authors in [25] introduced an enhanced OC-SVM model which contains the robust eta-SVM and OC-SVM.
The above-mentioned methods can be also employed for detecting abnormalities in time-series data. The authors in [26] presented a model for detecting novelty in time-series data using OC-SVM. In their approach, the time-delay embedding process was first used for converting time-series data into a set of vectors [27]. They then applied OC-SVM to these vectors to finally detect anomalies. The authors in [28] introduced a method for anomaly detection in time-series data using the meta-feature based OC-SVM. They used PCA or singular value decomposition (SVD) algorithm for reducing the dimension of multivariate time-series data to one-dimensional sequences. Then, they extracted six meta-features from the one-dimensional data. Then, they applied OC-SVM to these six meta-features to finally detect abnormalities. The authors in [29] presented a kNN-based algorithm which eliminates noisy data from sensor signals. They first calculated the difference between the data points and the median value of their k-th nearest neighbors. Then, they compared the differences to an appropriate threshold value. However, it is difficult to configure a proper threshold value.
2.2 Deep Learning-based Methods
In the past few years, deep learning-based techniques have been successfully employed for the task of time-series anomaly detection. The authors in [30] introduced a model called DeepAnT for time-series anomaly detection in an unsupervised manner. The model consists of an anomaly detector that calculates the anomaly score from the actual value and predicted value using the Euclidean distance and a time- series predictor for the time-series regression problem using a convolutional neural network (CNN). The authors in [31] introduced a novel method for detecting abnormalities using LSTM autoencoder and a two-dimensional convolutional autoencoder. In their approach, the features were first expanded by the statistical aspect. Then, the anomaly score was calculated based on the difference between the reconstructed features and expanded features from the autoencoder. After that, the features were sorted based on the anomaly score. Outliers are defined as the top 5% of the feature vectors. The authors in [32] introduced a Deep Autoencoding Gaussian Mixture Model (DAGMM) which employs both Gaussian Mixture Model (GMM) and autoencoder model. They first used an autoencoder to obtain latent representations by reducing the dimension of input data. After that, GMM is used for estimating the density of the representations. However, they do not consider the temporal dependence in time-series data. The authors in [33] employed stochastic variables that can estimate the probability distribution of time-series data to enhance the performance of the recurrent neural network (RNN). The authors in [34] introduced a method which uses both Variational autoencoder (VAE) and LSTM. In their method, the feedforward layer in VAE was substituted with a LSTM layer. However, the underlying assumption in their method is that the time-series data is linear and follows a particular statistical distribution. Because of this assumption, the approach is inapplicable to a wide range of real-world problems. The authors in [35] introduced an LSTM-based encoder-decoder model which is similar to seq2seq models for detecting anomalies in time-series data. First, the model was trained for reconstructing normal time-series data. Then, reconstruction error was used to detect anomalies. The authors in [36] proposed a method for detecting spacecraft anomalies. The method used LSTM for predicting multivariate time-series. They detected anomalies by calculating the prediction errors.
In this study, we focus on the anomaly detection task in a multivariate time-series data derived from the BOU data on metro vehicles. In our proposed method, we use an RNN-based autoencoder similar to [36]. The difference is that we use the ensemble of two different RNN-based autoencoders to enhance the performance. Also, we use dropout as a stochastic regularization method to remove statistical noise that frequently occurs in the BOU data of the metro trains.
In this section, we first describe the overall framework of our proposed ensemble method. Then, we explain the details of each component.
The framework of our proposed ensemble method for the anomaly detection of the BOU data is shown in Fig. 2. First, the input BC and AC signals from BOU data are standardized as a pre-processing step (Section 3.1). Second, the pre-processed BC and AC signals from training dataset (normal) are fed into both the biLSTM and biGRU autoencoders (Section 3.2). The reconstruction errors (anomaly scores) from both biLSTM and biGRU autoencoder models learned from normal BOU data are averaged and used for detecting anomalies of the abnormal BOU data (Section 3.3).

Figure 2: Framework of our proposed ensemble model for detecting BOU anomalies
Data standardization is normally required as a pre-processing step to create a robust machine learning model. If data samples have a variance which is orders of magnitude larger than others or do not follow the standard normal distribution, they may dominate the objective function. Consequently, the machine learning model is not capable of learning from other data samples correctly. Therefore, as our data pre-processing step, we standardized the BC and AC signals from our BOU data.
3.2 Recurrent Neural Network-based Autoencoders for Anomaly Detection
3.2.1 Long Short-Term Memory (LSTM)
LSTM is a special type of Recurrent Neural Network (RNN) that aims at solving a sequence prediction task by allowing the network to learn order dependence. LSTM has three types of gates to regulate information flow: an input gate, and an output gate, and a forget gate. Each gate consists of a point-wise multiplication operation and a sigmoid activation function that produces values between 0 and 1, indicating how much of the incoming data should be allowed through. The LSTM cell can be formulated as follows:
where W is the weight matrix, b is the bias,
3.2.2 Gated Recurrent Unit (GRU)
GRU is a type of RNN and very similar to LSTM except that it has fewer parameters. It also has gated units like LSTM that control the information flow inside the unit. However, it doesn't have separate memory cells. Unlike LSTM, GRU exposes its full content since it does not have an output gate. The standard formulation of a single GRU cell is defined as follows:
where W is the weight matrices, b is the biases,
3.2.3 Bidirectional Recurrent Neural Network
In the traditional RNN-based architectures such as LSTM and GRU, the information can only be passed in a forward direction. Hence, each current output depends only on all the previous inputs. In some applications such as speech recognition and machine translation, the context information from both previous and later time steps is required to make predictions about the current output. Therefore, bidirectional RNN architectures (biLSTM and biGRU) were introduced for treating all the inputs equally. It consists of forward and backward hidden states. The outputs of the two opposite directional networks (forward and backward) are concatenated at each time step for generating the final hidden layer that is used to generate the output layer.
Autoencoder is a type of artificial neural network which aims to produce an output identical to the input. The autoencoder consists of five elements: an input layer, an output layer, an encoder, a decoder, and a latent space. The input data are compressed into a latent code by the encoder. On the other hand, the latent code is decompressed into the output data by the decoder. Then, the input data are compared with the reconstructed output data to update the weights of the autoencoder via the back-propagation method. RNN-based autoencoder is the special type of autoencoder to deal with sequential data (e.g., time-series data) using an RNN-based architecture (LSTM or GRU). RNN-based autoencoder is commonly used for time-series anomaly detection since it can learn data patterns over very long sequences.
3.3 Anomaly Detection Using Ensemble of RNN-based Autoencoders
We train our biLSTM and biGRU autoencoder models using BC and AC pressure data from the BOU dataset which consists of only normal subsequences. In the testing phase, BC and AC pressure data from the BOU dataset that consists of both normal and abnormal subsequences which are used as an inpit for the network. To detect anomalies from test dataset which consists of abnormal subsequences, the mean absolute errors (MAEs) between original subsequences and reconstructed subsequences from both biLSTM and biGRU autoencoders are calculated. As an ensemble step, the total error is calculated by averaging two MAEs from biLSTM and biGRU autoencoders. When the error is greater than a certain threshold, we can consider that example an anomaly. Fig. 3 shows the diagram of our proposed anomaly detection process.

Figure 3: Diagram of our proposed anomaly detection process
We conduct the experiments on the BOU dataset which contains both normal and abnormal BOU data on metro trains in South Korea. The operating organization is Korea Railroad Corporation (KORAIL) and the train manufacturer is Hyundai Rotem. We used extracted Train Control and Management System (TCMS) data from KORAIL's 40 trains delivered in 2019. Especially, we used the TCMS data of the BOU and ECU devices operated between Incheon and Seoul. The BOU dataset contains normal and abnormal BOU data that were both extracted for an hour every 0.25 s. In abnormal BOU data, train experts manually labeled the anomaly points. We use BC and AC pressure data from the BOU data for building the anomaly detection model. In the training phase, the normal BOU data was used for learning the normality of BC pressure data. In the testing phase, the abnormal BOU data was used to evaluate our proposed ensemble model for verifying the effectiveness of our proposed model in terms of anomaly detection.
In our experiment, we used Python 3.8.10 as our programming language, which is widely used to build machine learning and deep learning models. In addition, we installed Anaconda 4.10.3 for scientific computing and large-scale data processing. Pandas 1.2.4 and NumPy 1.19.5 libraries were used for simplifying matrix operations. We used TensorFlow 2.5.0 and Keras 2.4.3 libraries to develop a deep learning model. Especially, using Keras library, it is easy to configure network model since Keras provides functions such as data pre-processing and deep learning layers in block form. Using aforementioned libraries, we designed five different recurrent autoencoder models for comparison: 1) long short-term memory autoencoder (LSTM-AE), 2) gated recurrent unit autoencoder (GRU-AE), 3) bi-directional long short-term memory autoencoder (biLSTM-AE), 4) bi-directional gated recurrent unit autoencoder (biGRU-AE), and our proposed ensemble model which combines biLSTM-AE and biGRU-AE. All recurrent autoencoder models use two hidden layers where each hidden layer consists of multiple memory cells as most of the works also use two hidden layers for detecting anomalies in different tasks. Also, during our empirical experiments, we observed that the model with two hidden layers outperforms the model with single hidden layer and is sufficiently enough to detect anomalies. We also tested the model with more than two layers. However, the performance is even worse than the model with two layers due to the overfitting problem. The extracted BC and AC data are fed in to our models in the form of sequences of length 40 using a sliding window algorithm. We used adaptive moment estimation (Adam) as our optimizer for training the autoencoder-based models. The initial learning rate was set to 0.0001. We trained all recurrent autoencoder models with 32 batch sizes for 40 epochs. All experiments were carried out on a PC with an NVIDIA GeForce RTX 3090 GPU and it took about 0.00039 s for inference of each subsequence.
We use four different evaluation metrics (i.e., precision, call, F1-score, and detection accuracy) to compare different models. The precision, recall, and F1-score can be formulated as follows:
where True Positive (TP) denotes the number of examples which are correctly predicted as an anomaly class, False Negative (FN) denotes the number of examples which are incorrectly predicted as not belonging to an anomaly class, and False Positive (FP) denotes the number of examples which are incorrectly predicted as an anomaly class. In addition, we defined the detection accuracy as the ratio of correctly classified regions to the total regions as follows:
where P denotes the set of peaks from test dataset and IoUi denotes the intersection over union (IoU) for i-th peak that can be formulated as follows:
where TPi, FPi, and FNi are TP, FP, and FN for the region of the i-th peak. In our experiment, the threshold for IOU is set to 0.5.
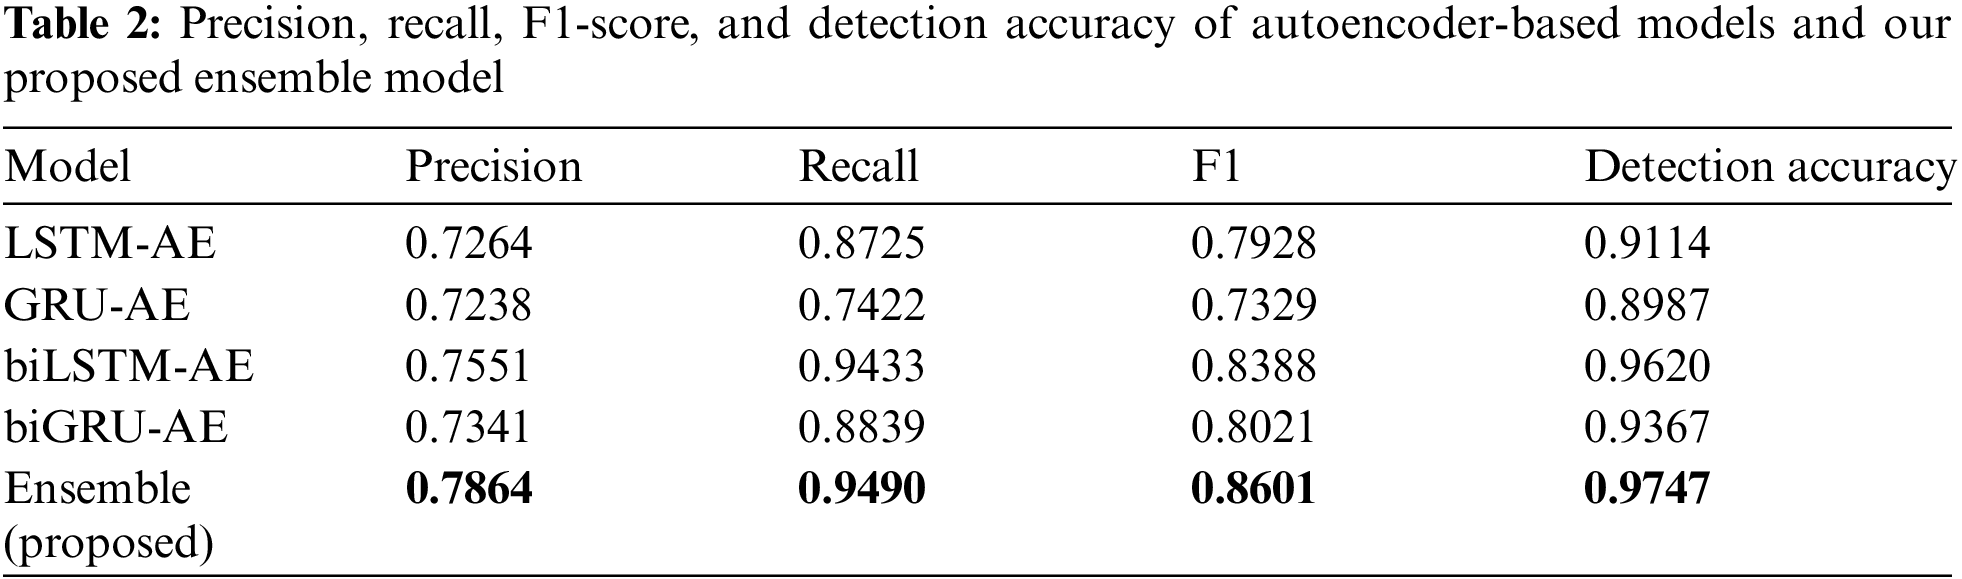
The predicted anomalies using our proposed ensemble model and the labeled anomalies are illustrated in Fig. 4. In addition, Tab. 2 shows the precision, recall, F1-score, and detection accuracy of four different autoencoder-based models and our proposed ensemble model. From these results, three observations were made.
■ Observation 1. Our proposed ensemble model can detect anomalies around the peak well.
■ Analysis. Fig. 3 demonstrates that our proposed ensemble model can detect anomalies around the peak well. This is because our anomaly detection model is based on both biLSTM and biGRU models which can capture long-range correlations between BC and AC pressure data efficiently.
■ Observation 2. Bi-directional RNN-based models outperform unidirectional RNN-based models.
■ Analysis. Tab. 2 shows that bi-directional RNN-based models (biLSTM-AE and biGRU-AE) show better performance than unidirectional RNN-based models (LSTM-AE and GRU-AE). This is because bi-directional RNN-based models use more contextual information (both left and right context) for prediction than unidirectional RNN-based models which use left context only.
■ Observation 3. Ensemble of biLSTM and biGRU autoencoders outperforms other models in terms of precision, recall, F1-score, and detection accuracy.
■ Analysis. Tab. 2 demonstrates that the ensemble of biLSTM and biGRU autoencoders performs best among other models. This is because the ensemble model combines the strengths of both the biLSTM and biGRU models by averaging their anomaly scores.

Figure 4: The predicted anomalies and the labeled anomalies
We have introduced a novel methodology to detect BOU abnormalities on metro vehicles using an ensemble of recurrent autoencoders. In our proposed framework, BC and AC pressure data from the BOU data are first extracted. Then, the extracted BC and AC pressure data are divided into subsequences that are fed into both biLSTM and biGRU autoencoders. The biLSTM and biGRU autoencoders are trained using training dataset that only contains normal subsequences. To detect anomalies from test dataset which consists of abnormal subsequences, the mean absolute errors (MAEs) between original subsequences and reconstructed subsequences from both biLSTM and biGRU autoencoders are calculated. As an ensemble step, the total error is calculated by averaging two MAEs from biLSTM and biGRU autoencoders. When the error is greater than a certain threshold, we can declare that example an abnormality. We carried out the experiments using the BOU dataset on metro vehicles in South Korea. Experimental results showed that our proposed ensemble method can detect BOU abnormalities well. Future work will include parameter optimization for investigating the influence on different parameter settings. Also, we plan to further use the energy-efficient fault-tolerant scheme [37] to enhance the reliability of our system and the knowledge distillation technique [38] to reduce the size of our ensemble model and deploy it on a real-time anomaly detection system. In addition, we plan to apply our proposed ensemble model for enhancing the performance of the existing model [39] for the different anomaly case of BOU data.
Funding Statement: This research is supported by the Korea Agency for Infrastructure Technology Advancement (KAIA) grant funded by the Ministry of Land, Infrastructure and Transport (Grant21QPWO-B152223-03).
Conflicts of Interest: The authors declare that they have no conflicts of interest to report regarding the present study.
1. R. Louf, C. Roth and M. Barthelemy, “Scaling in transportation networks,” PLoS One, vol. 9, no. 7, pp. e102007, 2014. [Google Scholar]
2. C. Gershenson and L. A. Pineda, “Why does public transport not arrive on time? The pervasiveness of equal headway instability,” PLoS One, vol. 4, no. 10, pp. e7292, 2009. [Google Scholar]
3. S. Guha, N. Mishra, G. Roy and O. Schrijvers, “Robust random cut forest based anomaly detection on streams,” in Proc. of the 33rd Int. Conf. on Machine Learning, New York, NY, USA, pp. 2712–2721, 2016. [Google Scholar]
4. N. Laptev, S. Amizadeh and I. Flint, “Generic and scalable framework for automated time-series anomaly detection,” in Proc. of the 21th ACM SIGKDD Int. Conf. on Knowledge Discovery and Data Mining, Sydney, Australia, pp. 1939–1947, 2015. [Google Scholar]
5. A. Lavin and S. Ahmad, “Evaluating real-time anomaly detection algorithms–the numenta anomaly benchmark,” in Proc. of the 2015 IEEE 14th Int. Conf. on Machine Learning and Applications (ICMLA), Miami, FL, USA, pp. 38–44, 2015. [Google Scholar]
6. Z. Xu, K. Kersting and L. Von Ritter, “Stochastic online anomaly analysis for streaming time series,” in Proc. of the Int. Joint Conferences on Artificial Intelligence (IJCAI), Melbourne, Australia, pp. 3189–3195, 2017. [Google Scholar]
7. S. Dubey, A. Boragule, J. Gwak and M. Jeon, “Anomalous event recognition in videos based on joint learning of motion and appearance with multiple ranking measures,” Applied Sciences, vol. 11, no. 3, pp. 1344, 2021. [Google Scholar]
8. J. P. Burman and M. C. Otto, “Census bureau research project: Outliers in time series,” in Bureau of the Census, SRD Res. Rep.CENSUS/SRD/RR-88114, Suitland, MD, USA, 1988. [Google Scholar]
9. A. Siffer, P. A. Fouque, A. Termier and C. Largouet, “Anomaly detection in streams with extreme value theory,” in Proc. of the 23rd ACM SIGKDD Int. Conf. on Knowledge Discovery and Data Mining, Halifax, NS, Canada, pp. 1067–1075, 2017. [Google Scholar]
10. O. Vallis, J. Hochenbaum and A. Kejariwal, “A novel technique for long-term anomaly detection in the cloud,” in Proc. of the 6th USENIX Workshop on Hot Topics in Cloud Computing (HotCloud 14), Philadelphia, PA, USA, pp. 15, 2014. [Google Scholar]
11. E. Keogh, S. Lonardi and B. Y. C. Chiu, “Finding surprising patterns in a time series database in linear time and space,” in Proc. of the Eighth ACM SIGKDD Int. Conf. on Knowledge Discovery and Data Mining, Edmonton, AB, Canada, pp. 550–556, 2002. [Google Scholar]
12. S. Muthukrishnan, R. Shah and J. S. Vitter, “Mining deviants in time series data streams,” in Proc. of the 16th Int. Conf. on Scientific and Statistical Database Management, Santorini, Greece, pp. 41–50, 2004. [Google Scholar]
13. P. Sun, S. Chawla and B. Arunasalam, “Mining for outliers in sequential databases,” in Proc. of the 2006 SIAM Int. Conf. on Data Mining, Bethesda, MD, USA, pp. 94–105, 2006. [Google Scholar]
14. M. Li, X. Yu, K. H. Ryu, S. Lee and N. Theera-Umpon, “Face recognition technology development with gabor, PCA and SVM methodology under illumination normalization condition,” Cluster Computing, vol. 21, no. 1, pp. 1117–1126, 2018. [Google Scholar]
15. R. Kwitt and U. Hofmann, “Robust methods for unsupervised PCA-based anomaly detection,” in Proc. of the IEEE/IST Workshop on Monitoring, Attack Detection and Mitigation, Tübingen, Germany, pp. 1–3, 2006. [Google Scholar]
16. H. Hoffmann, “Kernel PCA for novelty detection,” Pattern Recognition, vol. 40, no. 3, pp. 863–874, 2007. [Google Scholar]
17. P. J. Rousseeuw and M. Hubert, “Anomaly detection by robust statistics,” Wiley Interdisciplinary Reviews: Data Mining and Knowledge Discovery, vol. 8, no. 2, pp. e1236, 2018. [Google Scholar]
18. M. Goldstein and S. Uchida, “A comparative evaluation of unsupervised anomaly detection algorithms for multivariate data,” PloS One, vol. 11, no. 4, pp. e0152173, 2016. [Google Scholar]
19. S. Jiang, X. Song, H. Wang, J. J. Han and Q. H. Li, “A Clustering-based method for unsupervised intrusion detections,” Pattern Recognition Letters, vol. 27, no. 7, pp. 802–810. 2006. [Google Scholar]
20. Y. Gao, T. Yang, M. Xu and N. Xing, “An unsupervised anomaly detection approach for spacecraft based on normal behavior clustering,” in Proc. of the 2012 Fifth Int. Conf. on Intelligent Computation Technology and Automation, Zhangjiajie, China, pp. 478–481, 2012. [Google Scholar]
21. M. M. Breunig, H. P. Kriegel, R. T. Ng and J. Sander, “LOF: Identifying density-based local outliers,” in Proc. of the 2000 ACM SIGMOD Int. Conf. on Management of Data, Dallas, TX, USA, pp. 93–104, 2000. [Google Scholar]
22. Z. He, X. Xu and S. Deng, “Discovering cluster-based local outliers,” Pattern Recognition Letters, vol. 24, no. 9–10, pp. 1641–1650, 2003. [Google Scholar]
23. S. Ramaswamy, R. Rastogi and K. Shim, “Efficient algorithms for mining outliers from large data sets,” in Proc. of the 2000 ACM SIGMOD Int. Conf. on Management of Data, Dallas, TX, USA, pp. 427–438, 2000. [Google Scholar]
24. B. Schölkopf, R. C. Williamson, A. J. Smola, J. Shawe-Taylor and J. C. Platt, “Support vector method for novelty detection,” in Proc. of the Neural Information Processing Systems (NIPS), Denver, CO, USA, vol. 12, pp. 582–588, 1999. [Google Scholar]
25. M. Amer, M. Goldstein and S. Abdennadher, “Enhancing one-class support vector machines for unsupervised anomaly detection,” in Proc. of the ACM SIGKDD Workshop on Outlier Detection and Description, Chicago, IL, USA, pp. 8–15, 2013. [Google Scholar]
26. J. Ma and S. Perkins, “Time-series novelty detection using one-class support vector machines,” in Proc. of the Int. Joint Conf. on Neural Networks, Portland, OR, USA, vol. 3, pp. 1741–1745, 2003. [Google Scholar]
27. N. H. Packard, J. P. Crutchfield, J. D. Farmer and R. S. Shaw, “Geometry from a time series,” Physical Review Letters, vol. 45, no. 9, pp. 712, 1980. [Google Scholar]
28. M. Hu, Z. Ji, K. Yan, Y. Guo, X. Feng et al., “Detecting anomalies in time series data via a meta-feature based approach,” IEEE Access, vol. 6, pp. 27760–27776, 2018. [Google Scholar]
29. S. Basu and M. Meckesheimer, “Automatic outlier detection for time series: An application to sensor data,” Knowledge and Information Systems, vol. 11, no. 2, pp. 137–154, 2007. [Google Scholar]
30. M. Munir, S. A. Siddiqui, A. Dengel and S. Ahmed, “Deepant: A deep learning approach for unsupervised anomaly detection in time series,” IEEE Access, vol. 7, pp. 1991–2005, 2018. [Google Scholar]
31. T. Kieu, B. Yang and C. S. Jensen, “Outlier detection for multidimensional time series using deep neural networks,” in Proc. of the 19th IEEE Int. Conf. on Mobile Data Management (MDM), Aalborg, Denmark, pp. 125–134, 2018. [Google Scholar]
32. B. Zong, Q. Song, M. R. Min, W. Cheng, C. Lumezanu et al., “Deep autoencoding Gaussian mixture model for unsupervised anomaly detection,” in Proc. of the Int. Conf. on Learning Representations, Vancouver, BC, Canada, 2018. [Google Scholar]
33. M. Fraccaro, S. K. Sønderby, U. Paquet and O. Winther, “Sequential neural models with stochastic layers,” In Advances in Neural Information Processing Systems 29 (NIPS), Vol. 29, pp. 2199–2207, 2016. [Google Scholar]
34. D. Park, Y. Hoshi and C. C. Kemp, “A multimodal anomaly detector for robot-assisted feeding using an lstm-based variational autoencoder,” IEEE Robotics and Automation Letters, vol. 3, no. 3, pp. 1544–1551, 2018. [Google Scholar]
35. P. Malhotra, A. Ramakrishnan, G. Anand, L. Vig, P. Agarwal et al., “LSTM-Based encoder-decoder for multi-sensor anomaly detection,” arXiv Preprint, arXiv:1607.00148, 2016. [Google Scholar]
36. K. Hundman, V. Constantinou, C. Laporte, I. Colwell and T. Soderstrom, “Detecting spacecraft anomalies using lstms and nonparametric dynamic thresholding,” in Proceedings of ICML 2016 Anomaly Detection Workshop, New York, NY, USA, 2016. [Google Scholar]
37. G. Mehmood, M. Z. Khan, S. Abbas, M. Faisal and H. U. Rahman, “An energy-efficient and cooperative fault-tolerant communication approach for wireless body area network,” IEEE Access, vol. 8, pp. 69134–69147, 2020. [Google Scholar]
38. J. Kang and J. Gwak, “Ensemble learning of lightweight deep learning models using knowledge distillation for image classification,” Mathematics, vol. 8, no. 10, pp. 1652, 2020. [Google Scholar]
39. J. Kang, C. S. Kim, J. W. Kang and J. Gwak, “Anomaly detection of the brake operating unit on metro vehicles using a one-class LSTM autoencoder,” Applied Sciences, vol. 11, no. 19, pp. 9290, 2021. [Google Scholar]
 | This work is licensed under a Creative Commons Attribution 4.0 International License, which permits unrestricted use, distribution, and reproduction in any medium, provided the original work is properly cited. |