DOI:10.32604/cmc.2022.024193
| Computers, Materials & Continua DOI:10.32604/cmc.2022.024193 | |
| Article |
Semantic Pneumonia Segmentation and Classification for Covid-19 Using Deep Learning Network
1Department of Mathematics, Faculty of Science, Arish University, Arish, 45511, Egypt
2Department of Information Systems, Faculty of Computers and Information, Mansoura University, Mansoura, 35511, Egypt
3Department of Information Technology, Faculty of Computers and Information, Mansoura University, Mansoura, 35511, Egypt
4Centro Singular de Investigación en Tecnoloxías Intelixentes (CiTIUS), Universidade de Santiago de Compostela, Santiago de Compostela, 15705, Spain
5Information Systems Department, Faculty of Computers and Artificial Intelligence, Benha University, Benha, 13512, Egypt
6Department of Information and Communication Engineering, Inha University, Incheon, 22212, Korea
*Corresponding Author: Kyung Sup Kwak. Email: kskwak@inha.ac.kr
Received: 08 October 2021; Accepted: 29 December 2021
Abstract: Early detection of the Covid-19 disease is essential due to its higher rate of infection affecting tens of millions of people, and its high number of deaths also by 7%. For that purpose, a proposed model of several stages was developed. The first stage is optimizing the images using dynamic adaptive histogram equalization, performing a semantic segmentation using DeepLabv3Plus, then augmenting the data by flipping it horizontally, rotating it, then flipping it vertically. The second stage builds a custom convolutional neural network model using several pre-trained ImageNet. Finally, the model compares the pre-trained data to the new output, while repeatedly trimming the best-performing models to reduce complexity and improve memory efficiency. Several experiments were done using different techniques and parameters. Accordingly, the proposed model achieved an average accuracy of 99.6% and an area under the curve of 0.996 in the Covid-19 detection. This paper will discuss how to train a customized intelligent convolutional neural network using various parameters on a set of chest X-rays with an accuracy of 99.6%.
Keywords: SARS-COV2; COVID-19; pneumonia; deep learning network; semantic segmentation; smart classification
The emerging Covid-19 pandemic continues to harm global health, the economy, and well-being. According to the World Health Organization (WHO), it is worth noting that this disease was detected in late 2019 in Wuhan's Chinese city and later in all parts of the world, which led to it being considered a pandemic. The current confirmed cases of this disease exceed 140 million cases, and the number of deaths is 3 million confirmed cases [1]. There are nearly 600,000 confirmed cases in the world within one week, and this number is large compared to the rest of the endemic diseases in the world. It is worth noting that the number of injured and recovered patients without being recorded is double this number.
This led to the imposition of restrictions and a complete closure on travel, global trade, and movement to reduce the number of injuries, which led to the deterioration of the gigantic and emerging economies. The covid-19 virus consists of more than one strain and develops gradually, which has made it challenging to discover and develop a solid vaccine for eradicating this disease so far [2]. All this led to researchers’ participation in various parts of the world to establish rapid systems for early detection and isolation of infections to reduce the disease's spread and control it and return life to what it was before the pandemic. Therefore, early and accurate detection of pneumonia, blood clots, and severe acute respiratory syndrome associated with (SARS-CoV-2) is the focus of attention of the world and is considered one of the most the world's attention at present time. There are three different methods of detecting the disease inside hospitals and laboratories, such as blood analysis, x-rays, medical imaging, and other traditional methods that lead to an increase in the number of injuries between doctors and nurses through patients’ movement through different hospitals [3]. Therefore, there is an urgent need for early, accurate and electronic remote detection for early diagnosis and taking health measures without confrontation [4]. One of the common symptoms that we will rely on for early diagnosis of this disease, as it has been reported, is a lung injury that causes difficulty breathing and blood clotting as a primary indicator. Therefore, there are many challenges associated with this field, which can be summarized as follows [5–11]:
■ Chest X-Ray (CXR) image contain a wide variability and a diversity of features.
■ The diagnosis of any disease depends on linking symptoms together and extracting semantic features in real-time. Therefore, any diagnostic system requires high speed and accuracy in performing the tasks.
■ The classification and prediction processes using machine leaning algorithms may suffer from overfitting problems.
Also, some common symptoms such as high fever, severe fatigue, and dry cough were reported in some confirmed cases of COVID-19 [1]. Therefore, we may need to rely on these common symptoms for early diagnosis before the deterioration of the situation or the increase in injury cases or perhaps death. Therefore, we will first depend on the blood vessel clot inside the lung and differentiate between bacterial pneumonia, pneumonia associated with the emerging coronavirus, and a healthy lung. In this paper, our contributions will be as follows:
■ Conducting a comprehensive study of the related research to early detection of covid-19 and comparing them with our proposed model.
■ A proposed model was made to differentiate between cases infected with SARS-COV-2 or COVID-19 and bacterial pneumonia and the normal cases. The model was developed using artificial intelligence techniques and a pre-trained deep learning network for accurate and rapid injury cases.
■ The model was developed by using preprocessing methods to facilitate detection of the affected part and working on it to speed up the time and focus on the affected region (find the region of interest), such as using smart segmentation techniques and feature extraction methods.
■ More than one set of data was used from different sources and divided into learning and testing data using 10-fold cross-validation to refine the deep learning network and overcome overfitting problems.
This study offers an end-to-end machine learning-based system to recognize COVID-19 from CXR scans automatically. Semantic segmentation using DeepLabv3Plus architecture was used for detecting regions of interest in CXR. Pre-trained Convolutional neural networks (CNNs) models, ResNet18, ResNet50, and denseNet were applied to CXR images to extract and select the unique features. Two proposed algorithms and a novel proposed framework were used to improve performance and time consuming. Also, The iterative pruning model was used to reduce complexity and time consumed to obtain the optimum number of neurons, and the performance efficiency was not compromised. We used the average ratio of zeros (APoZ) with an abnormal CXR. The remainder of this article will be divided into the following parts: Related works will be discussed in Section 2. The proposed framework and algorithms will be discussed in Section 3. The results of different experiments will also be discussed and compared with other similar studies in Section 4. Finally, the various conclusions will be presented in Section 5.
We will review the different efforts of researchers from various prestigious scientific journals and the different methods and patterns of artificial intelligence that they have found for early detection of the emerging coronavirus disease. Unfortunately, there are different traditional methods for predicting, detecting, and responding to this disease based on knowledge of the places most affected by heart disease and diabetes. In addition to the understanding of population density and social distancing methods were used to detect and predict the COVID-19. However, all these traditional methods do not lead to a decrease in the rate of injuries and deaths. Therefore, artificial intelligence methods and deep learning outcomes have an important role in early detection and isolation of affected cases in a fast and inexpensive way [12–14].
It has been noted in most international research that the disease can be detected through a chest X-ray or a Computed tomography (CT) scan [14–16]. However, detection by means of a CT scan is more expensive than a CXR, but it is characterized by its accuracy. Therefore, the main challenge here is to raise the level of accurate detection through x-rays to be like a CT scan. It has also been observed that the disease can be detected by detecting peripherally distributed pneumonia that represents vitreous opacity and vascular thickening. However, this method may have a low accuracy rate if the extracted feature is not on the affected place, and this is what will be emphasized in our paper. CNNs are widely used in medical imaging and disease detection. In this paper, we review the latest research Contributions of deep learning application to detect COVID-19 from CXR images highlight challenges, and identify future investigations required [16–19].
Yang et al. [20] proposed the traditional deep learning neural network on a dataset of 275 chest x-rays to classify the images as normal or contain pneumonia. However, the accuracy of this method was very weak, as it was only 85% accurate. Maghdid et al. [21] proposed a pre-assigned AlexNet model to classify the CXR images as normal or contain pneumonia due to SARS-COV-2 with an accuracy of 94.1%. But the problem with this research is that it depends on a prior model and can be affected by overfitting and cannot extract the affected patterns only. Also, this model's accuracy is still poor, although it is higher than the previous research.
Bukhari et al. [16] relied on a previously assigned ResNet-50 form to detect CXR images as natural or contain pneumonia due to SARS-COV-2 with an accuracy of 98%. But the problem with this research is that it depends on a prior model as well. The deep web has been trained on a small number of images, and it can be affected by the overfitting problem. Although the model's accuracy is considered relatively high, it cannot be relied upon entirely in early diagnosis. Das et al. [22] introduced a network powered by Truncated Inception technology to classify CXR-positive images from normal states. They also used different data sets with an accuracy of 99%. But the main problem with this work is that it has non-clinical effects that are performed.
Pereira et al. [23] presented a proposal for hierarchical classification of CXR images and to detect whether they are normal or contain pneumonia depending on the hierarchy of different patterns and the training of a pre-trained CNN network for this purpose. They also used reconfiguration algorithms to solve the problem of data imbalance. With these two methods, they were able to achieve an accuracy level of 89%. However, despite this system's efficiency, the accuracy of this model is still weak and needs to be increased and used on a larger number of images. It is also relatively slow. Ozturk et al. [24] proposed a novel model for accelerated identification of SARS-COV-2 using CXR images to accommodate multi-class and multi-layered classifications of COVID-19 disease. Their schema obtained a classification efficiency of 98% and 87.02% for dual and multilayer classification, respectively. This research's problem lies in the technique's weakness for multi-layer classification and the time consumed for the classification is relatively high. Ucar et al. [25] proposed an innovative paradigm for quick analysis of SARS-COV-2 based on Deep Bayes-Squeeze Network technology. Their model achieved an accuracy rate of 98.3% for multiple classes. Despite its relatively high accuracy, the main problem with this research is that the time consumed for classification is relatively high.
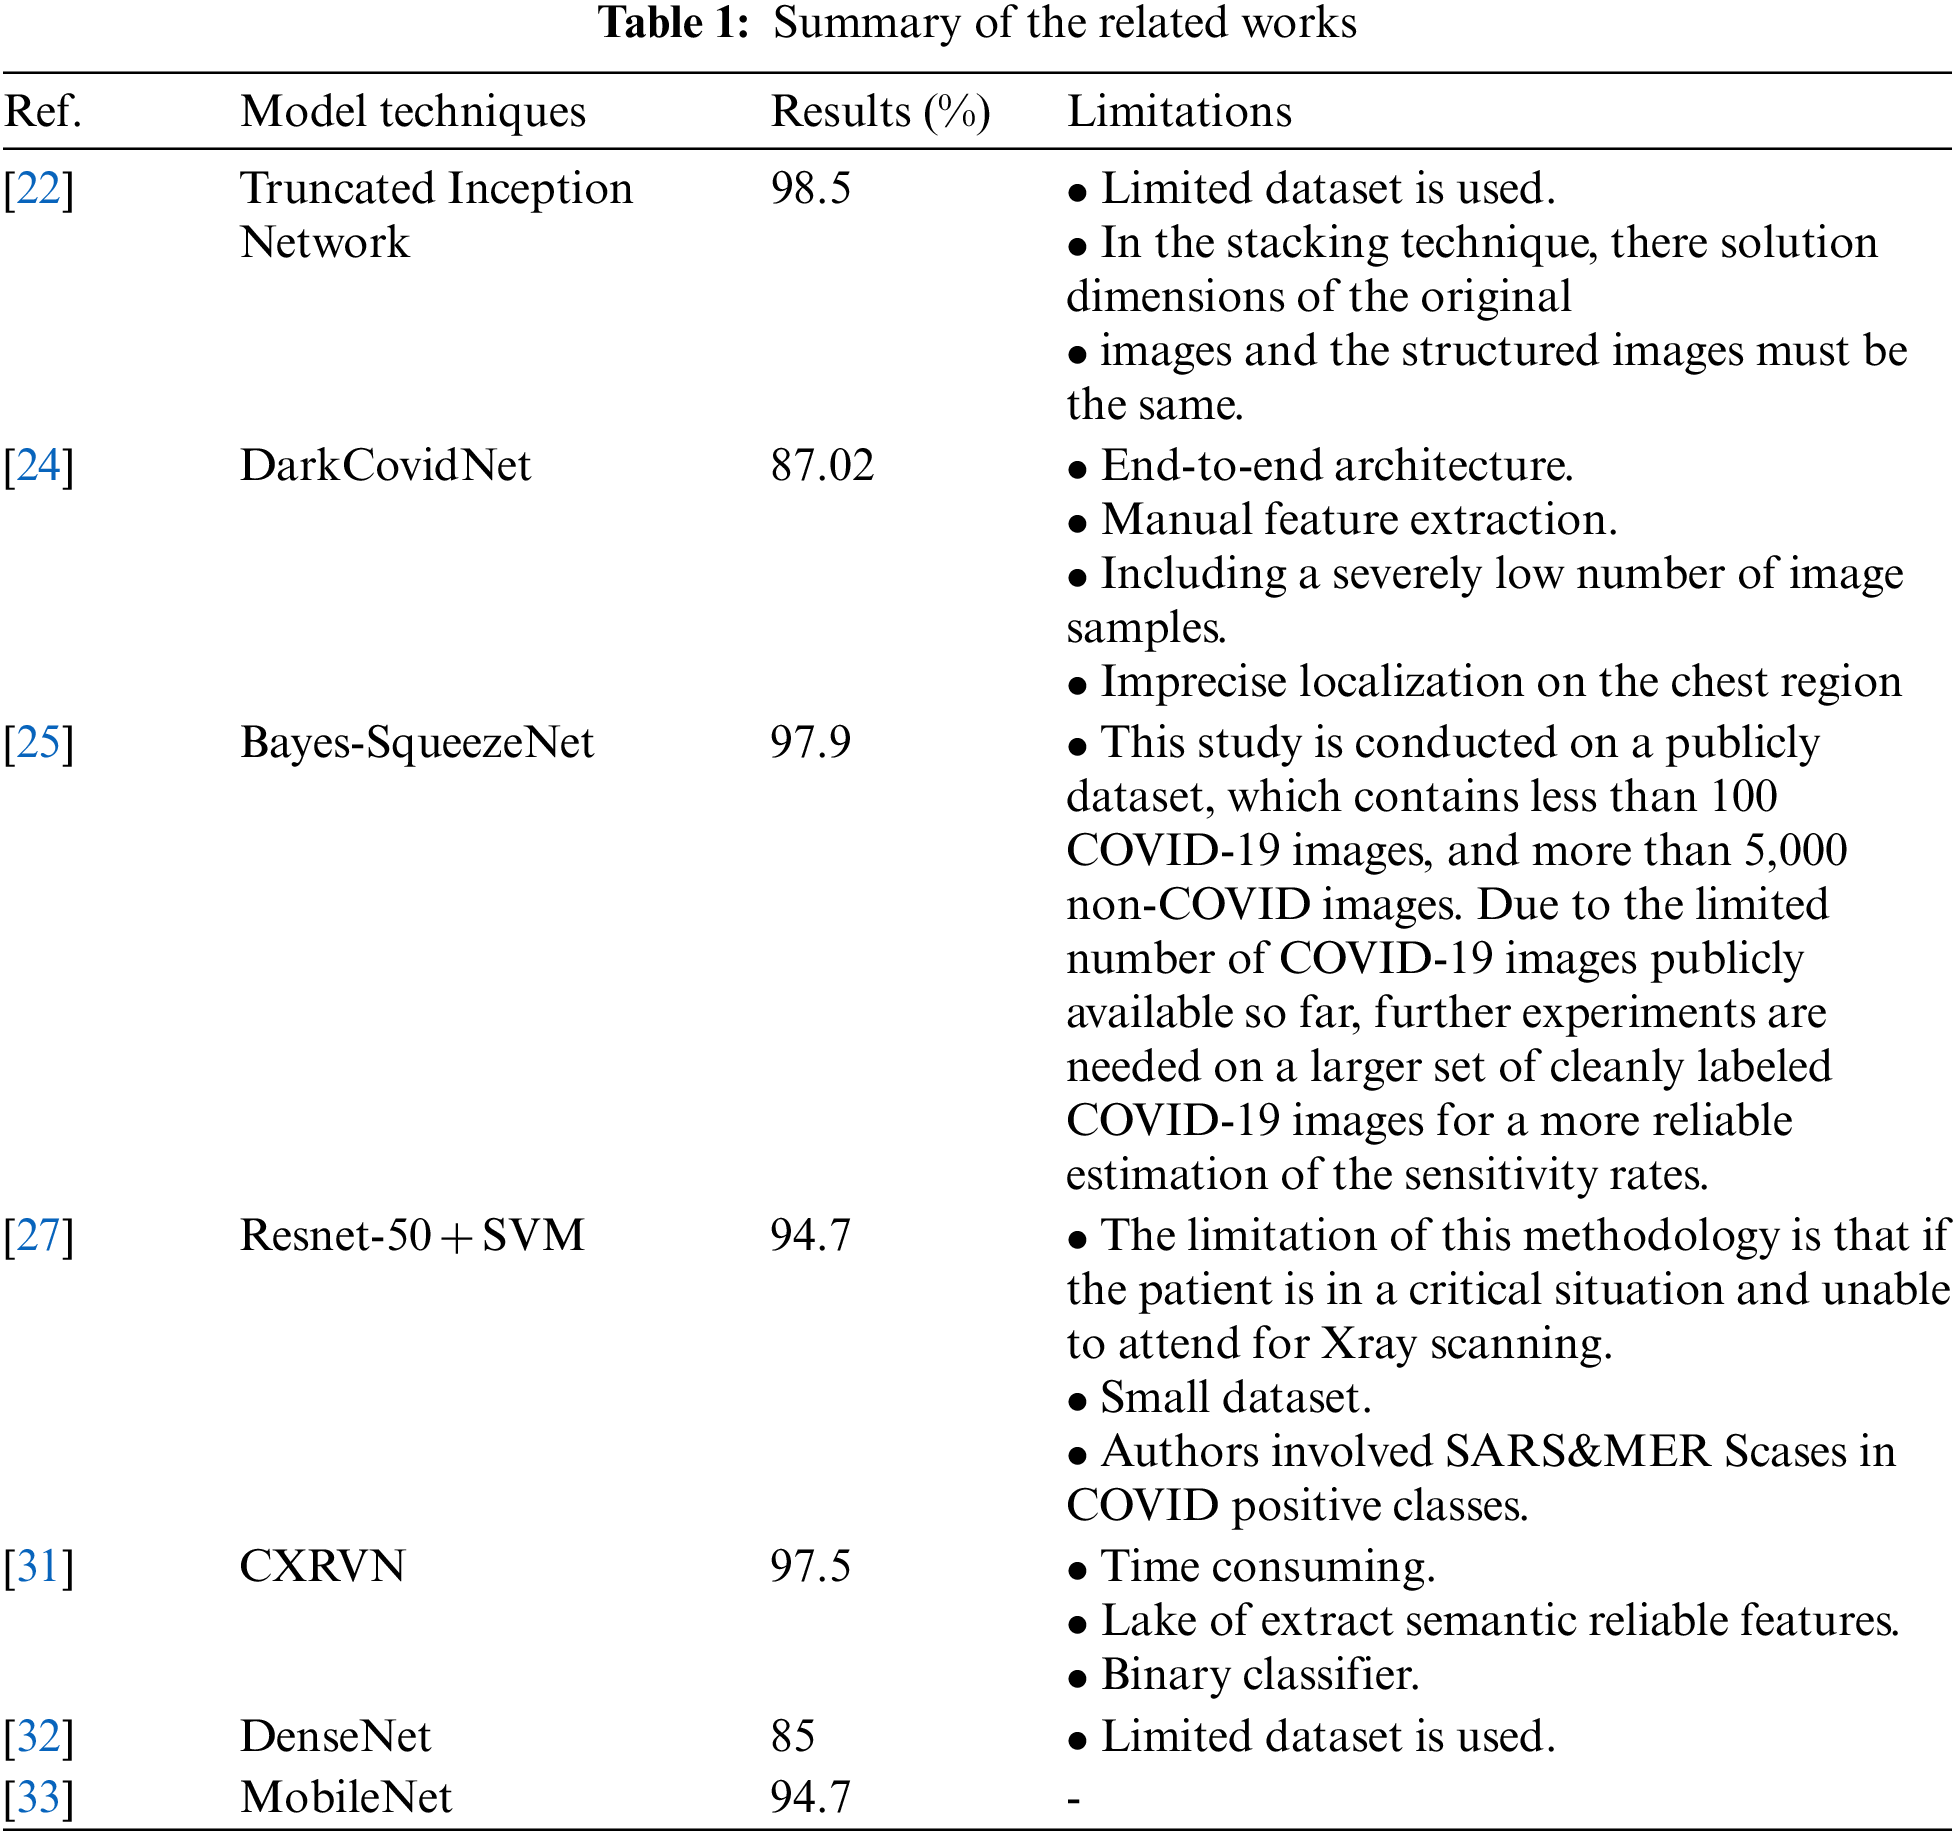
Alghamdi et al. [26] proposed deep learning neural network model based on Resnet-50 was previously customized to classify CXR images using 10-fold validation and the result was 97.28% accuracy. But the problem with this research is that it depends on a prior model that takes a long time to train because of the lack of focus on the affected area only. Also, the accuracy of this model is still unreliable because it is trained on a small data set, although it is relatively high. Ismael et al. [27] suggested a CNN schema based on pre-assigned Resnet-50 and SVM with linear core function to classify CXR images and obtained an efficiency of 94.7%. However, the problem with this research is that they used an insufficient amount of CXR images. Therefore, a recommendation to run the model on a more significant number of unbalanced data is required. The accuracy rate is still not satisfactory. Hassibi et al. [28] improved the generalization model for CNN and speeded up the network by selecting the extracted patterns using the second derivative in the Taylor series. This resulted in a 34% decrease in network parameters and improved mass classification performance. Rajaraman et al. [29] proposed a new custom CNN of ImageNet pretrained models on CXR collections. They combined use of knowledge transfer, iterative model pruning, and ensemble learning. They achieved an accuracy rate of 99%. Chen et al. [30] presented two collaborative networks to analyze multiple segmentation labels CXR images based on lung segmentation. The proposed scheme based on the self-adaptive weighted technique is employed to gross the contextual knowledge with Area Under Curve (AUC) = 0.82. Elzeki et al. [31] recommended a novel deep learning computer-aided model for examining and assessing CXR images called Chest X-Ray COVID Network (CXRVN) based on three distinctive CXR datasets. However, an accuracy demonstrated after GAN augmentation the reached 96.7%. The comparison and summary between related works are shown in Tab. 1.
3 Proposed Framework and Methods
In this section, the different stages of the proposed model will be explained. Fig. 1 shows the proposed framework. The proposed model contains two serial stages. The first stage is the preprocessing phase. It contains several sub-stages such as gray scale conversion, noise removal, adaptive histogram equalization, and semantic segmentation. Then, the second stage includes the classification and detection phase. This phase consists of a pre-trained CNN network with many hidden layers. Also, this stage can take the decision to predict if the image is normal, Bacterial Pneumonia, Covid-19 Pneumonia.
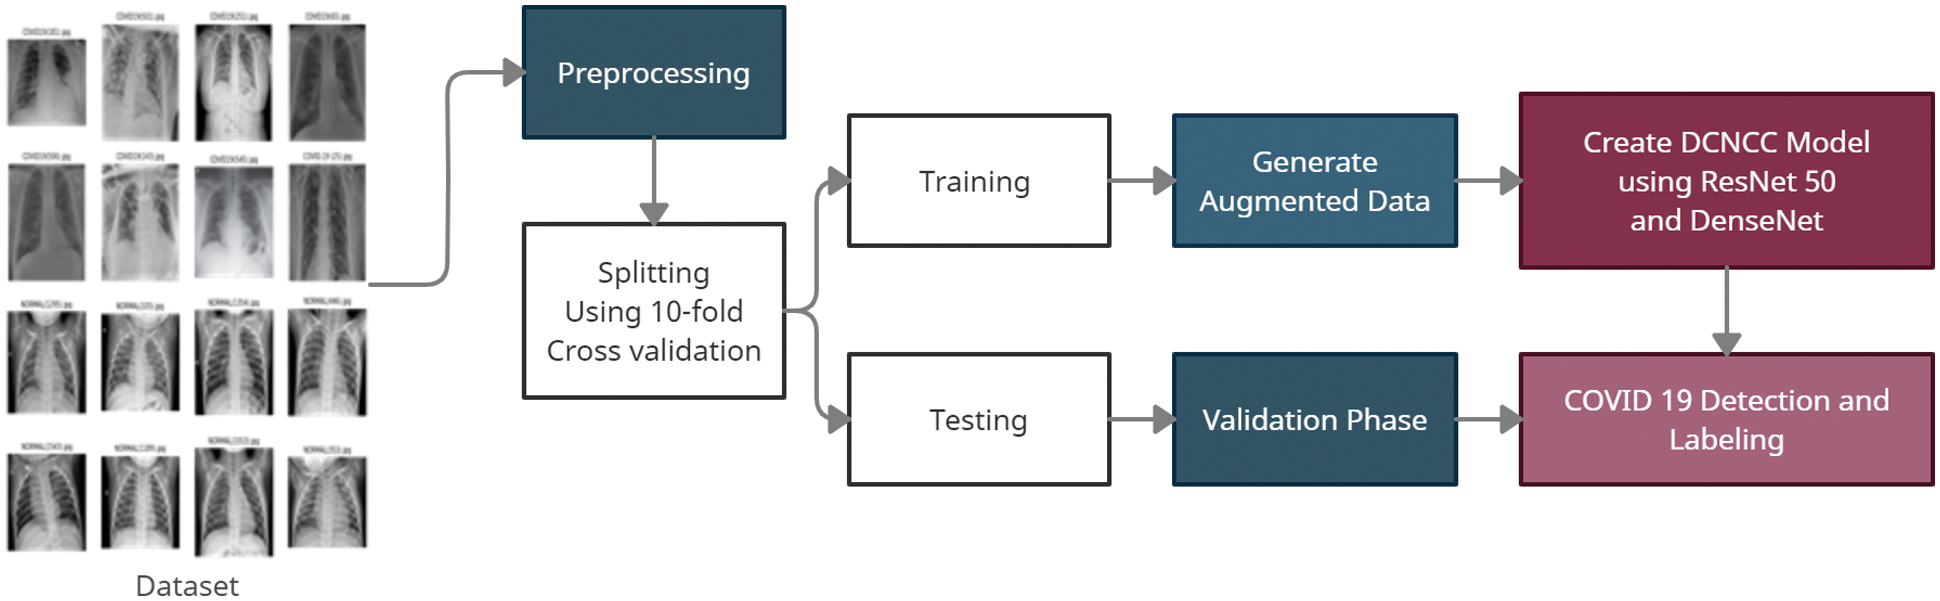
Figure 1: The proposed framework
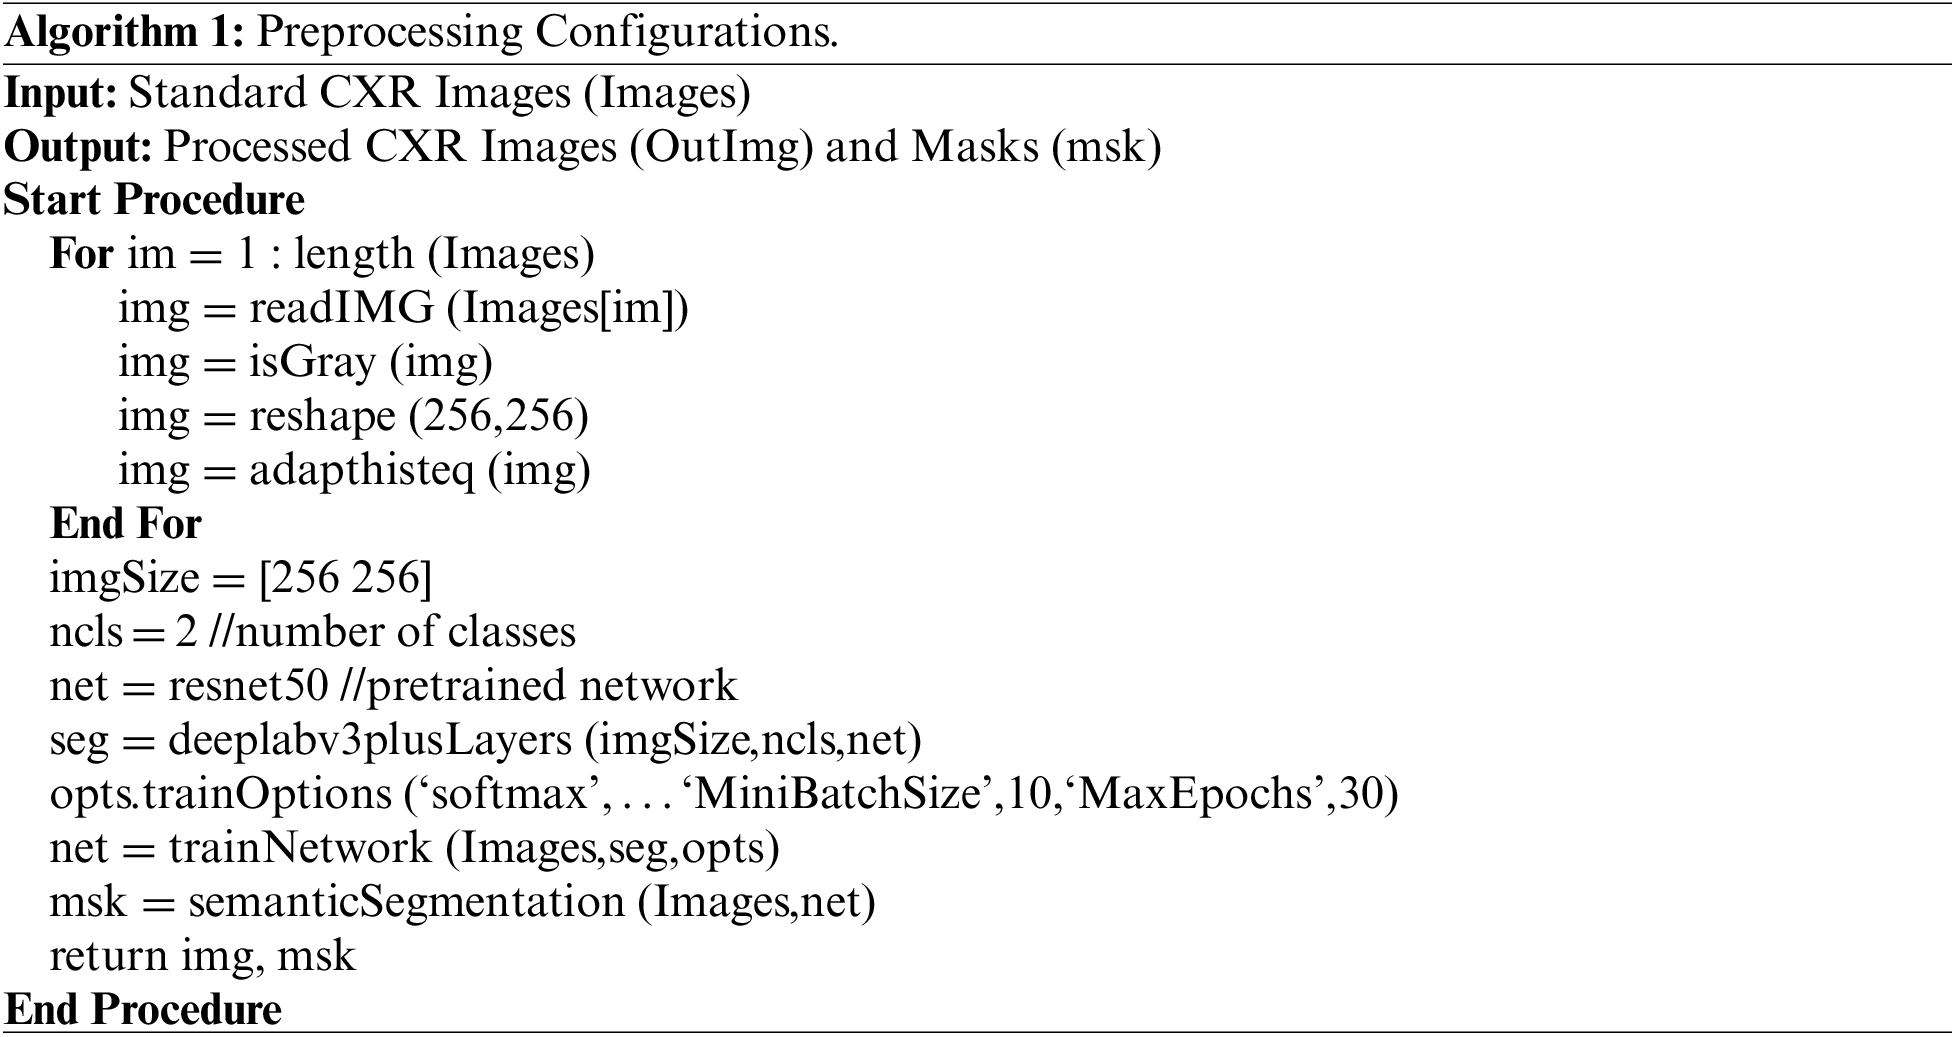
This phase takes the standard dataset as input and produces the segmented lungs as output. Fig. 2 shows the main sub-phases of this stage. Algorithm 1 shows the preprocessing steps [34–37].
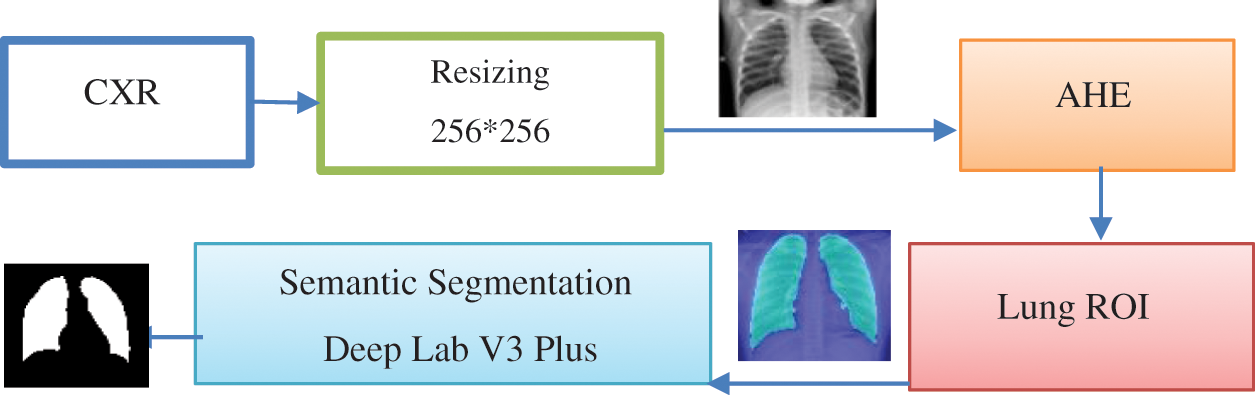
Figure 2: Main sub-phases in preprocessing stages
a) Input dataset includes two datasets of CXR images with 1024 × 1024 and 512 × 512 pixel resolution from different sources. The dataset was released for the different sources. The acquisition dataset involves natural and abnormal CXR images with normal and Covid-19 pneumonia.
b) Gray scale conversion, this sub-phase converts the RGB image into gray scale level. Based on the probability theory, the dynamic adaptive histogram equalization obtains the gray mapping of pixels to uniform and smooth gray levels [38]. Fig. 3 represents sample of original images including the normal and abnormal CXR.
c)
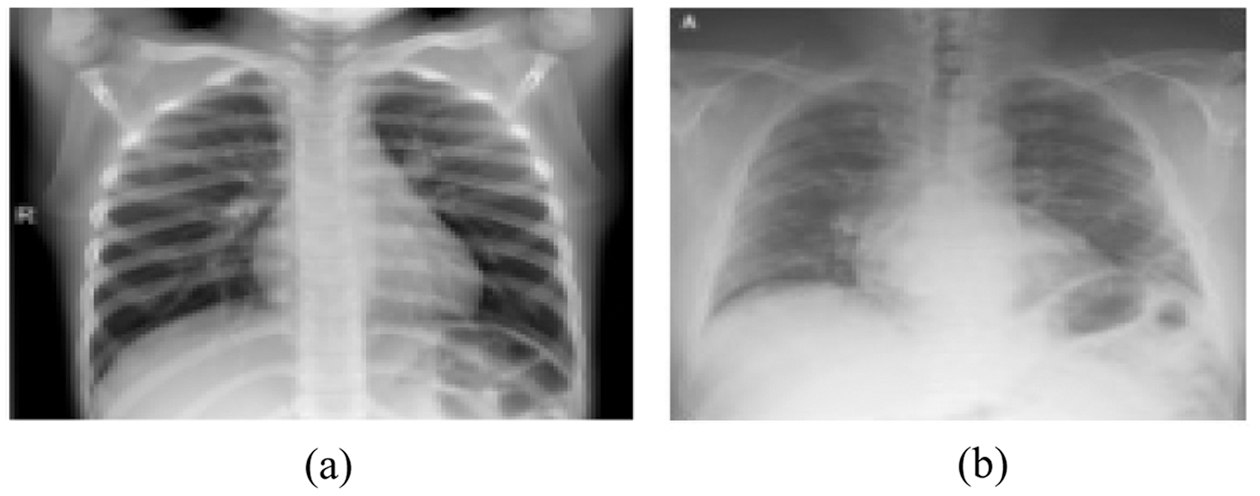
Figure 3: Original images (a) Normal CXR (b) Covid-19 pneumonia CXR
d) Adaptive histogram equalization (AHE), if n is the number of gray levels obtained in the original image, p is the number of pixels in the image with kth gray level, T is the whole number of pixels in the image. AHE is computed according to the Eq. (1). Fig. 4 represents sample of enhanced images after applying the AHE to every image in the dataset.
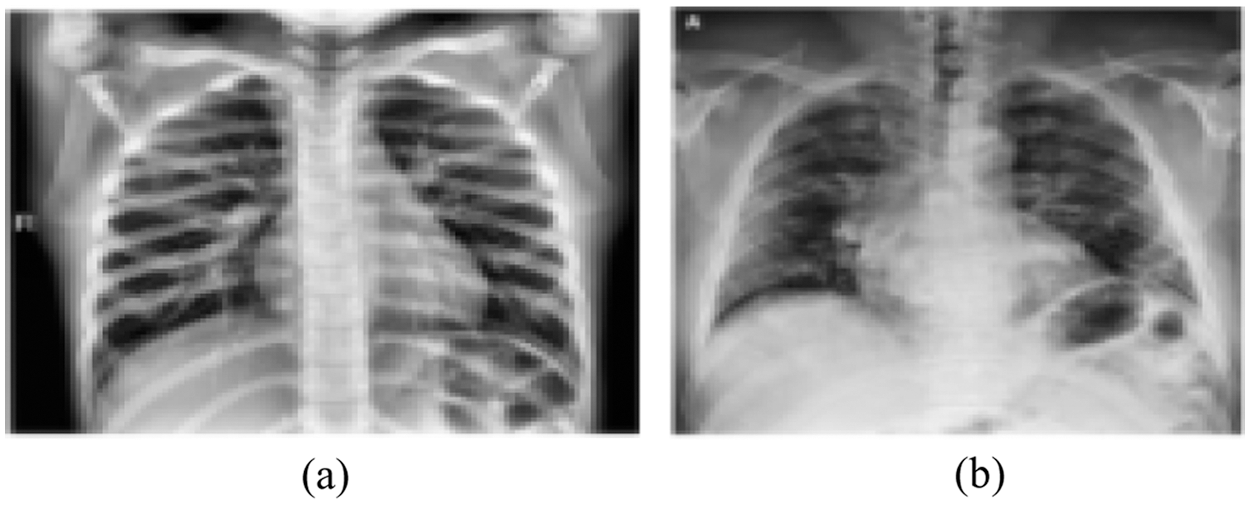
Figure 4: Enhanced images using adaptive histogram equalization (a) Normal CXR (b) Covid-19 pneumonia CXR
e) Semantic Segmentation, Deeplabv3plus is a model that segments images and obtain semantic labels based on a deep learning architecture. Fig. 5 represents DeepLabv3Plus architecture.
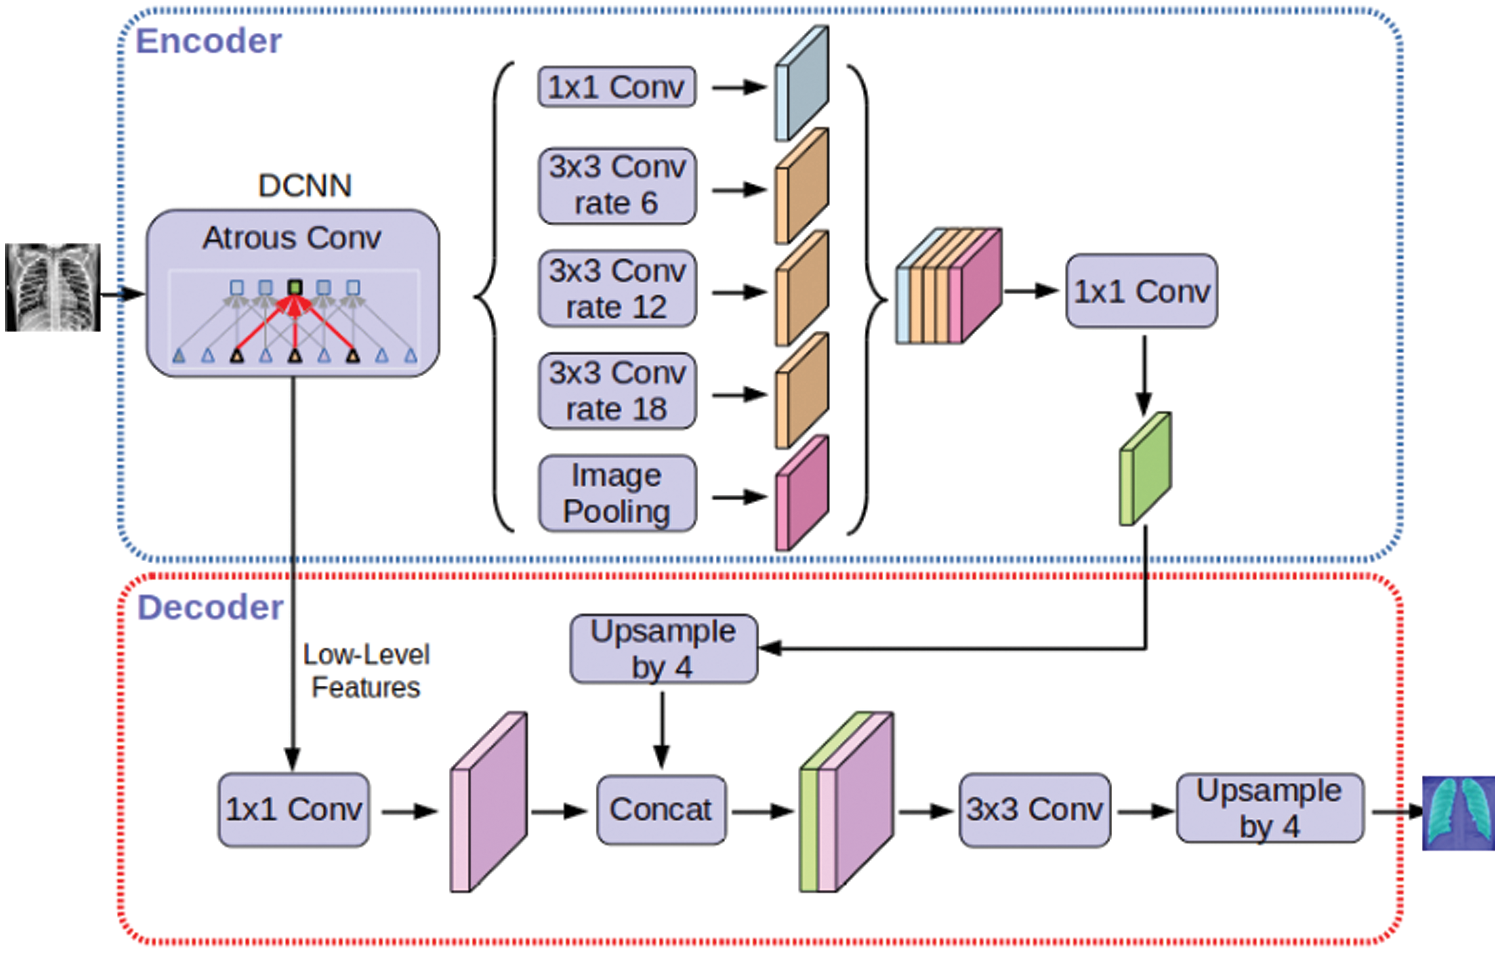
Figure 5: Deeplabv3Plus architecture
3.2 Deep CNN for Covid-19 Classification (DCNCC) Phase
This phase is the essential part of our proposed model to build a new innovative structure to classify the chest x-ray images of Covid-19 disease to determine the typical images and the abnormal images. The standard dataset is divided into training and testing datasets with 70% and 30% respectively. The data augmentation process is performed on the training dataset before applying the DCNCC phase with 10-fold cross validation to avoid overfitting problems. This complex neural network is the first innovative network specialized in image segmentation and analysis of Covid-19 CXR. The proposed model (DCNCC) architecture is represented in Fig. 6. The proposed deep neural network consists of three wrapping layers, three collocation layers, and one fully interconnected layer. Data augmentation represented in Fig. 5 is a regularization procedure that produces a tremendous volume of practical units through applying various conversions such as rotating, resizing, flipping, shifting, and changing the brightness conditions. Transfer learning concept is based on description learning with the underlying premise that some patterns are common to several various tasks. In Fig. 5, we use 256 * 256 processed training CXR size to enter the semantic convolutional network. Also, we use three convolutional blocks. Each block includes a batch normalization, ReLU activation function, max pooling, dropout and flatten. The rectified linear unit (ReLU) is used as the hidden layers to allow faster learning.
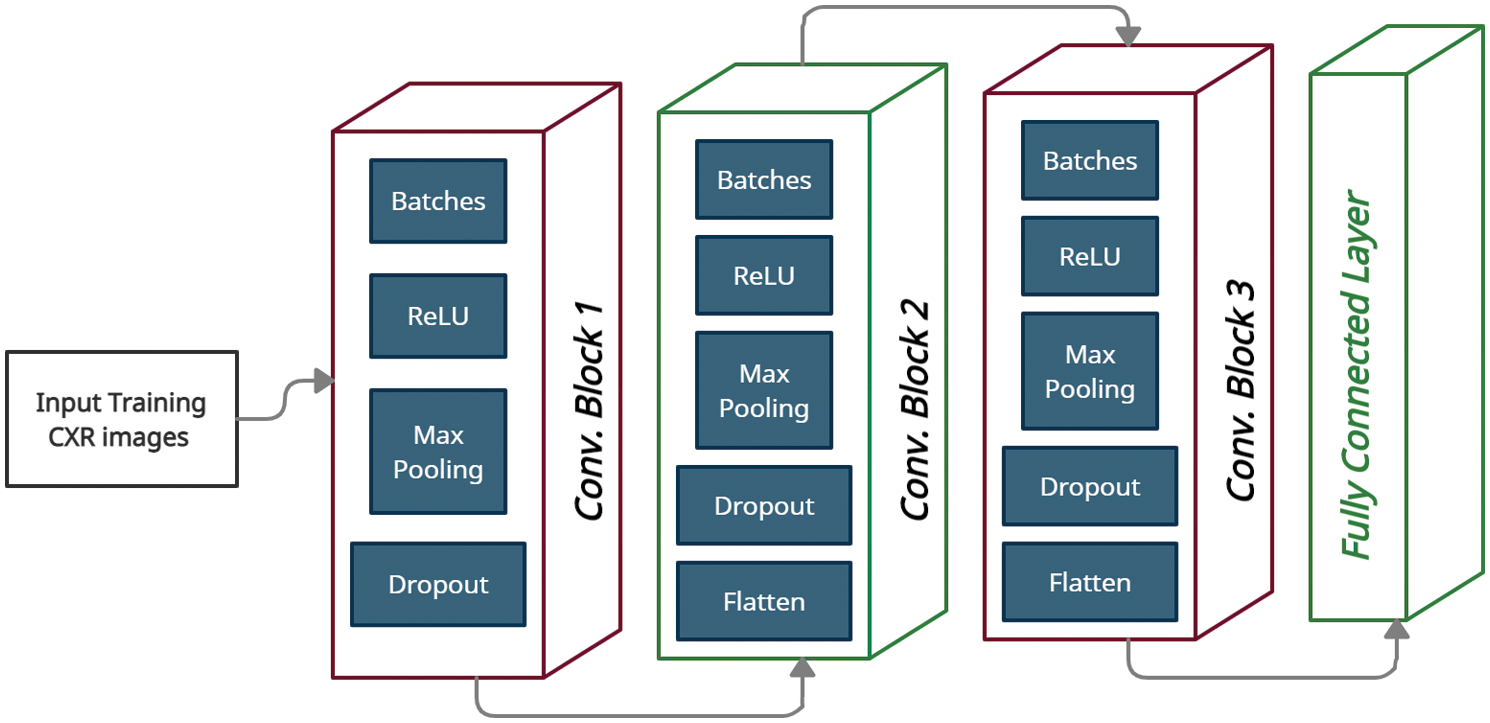
Figure 6: Proposed DCNCC model
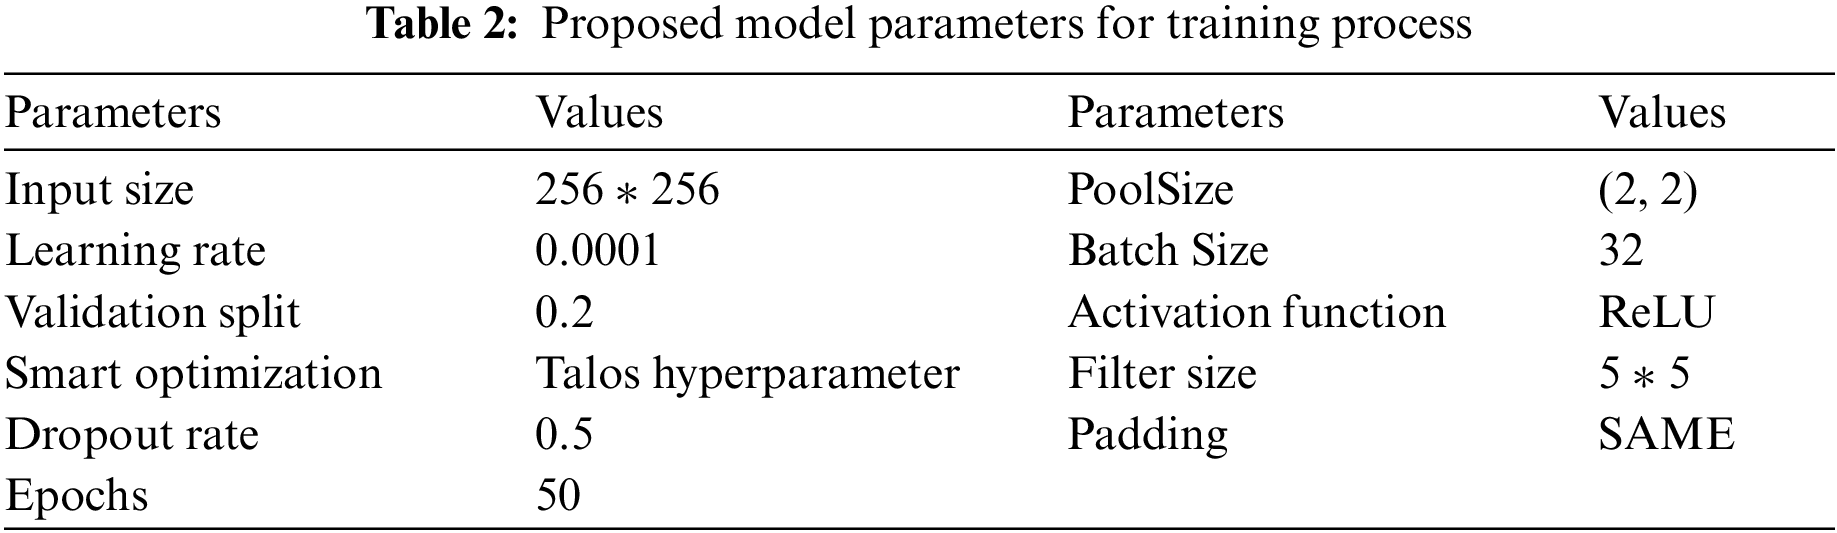
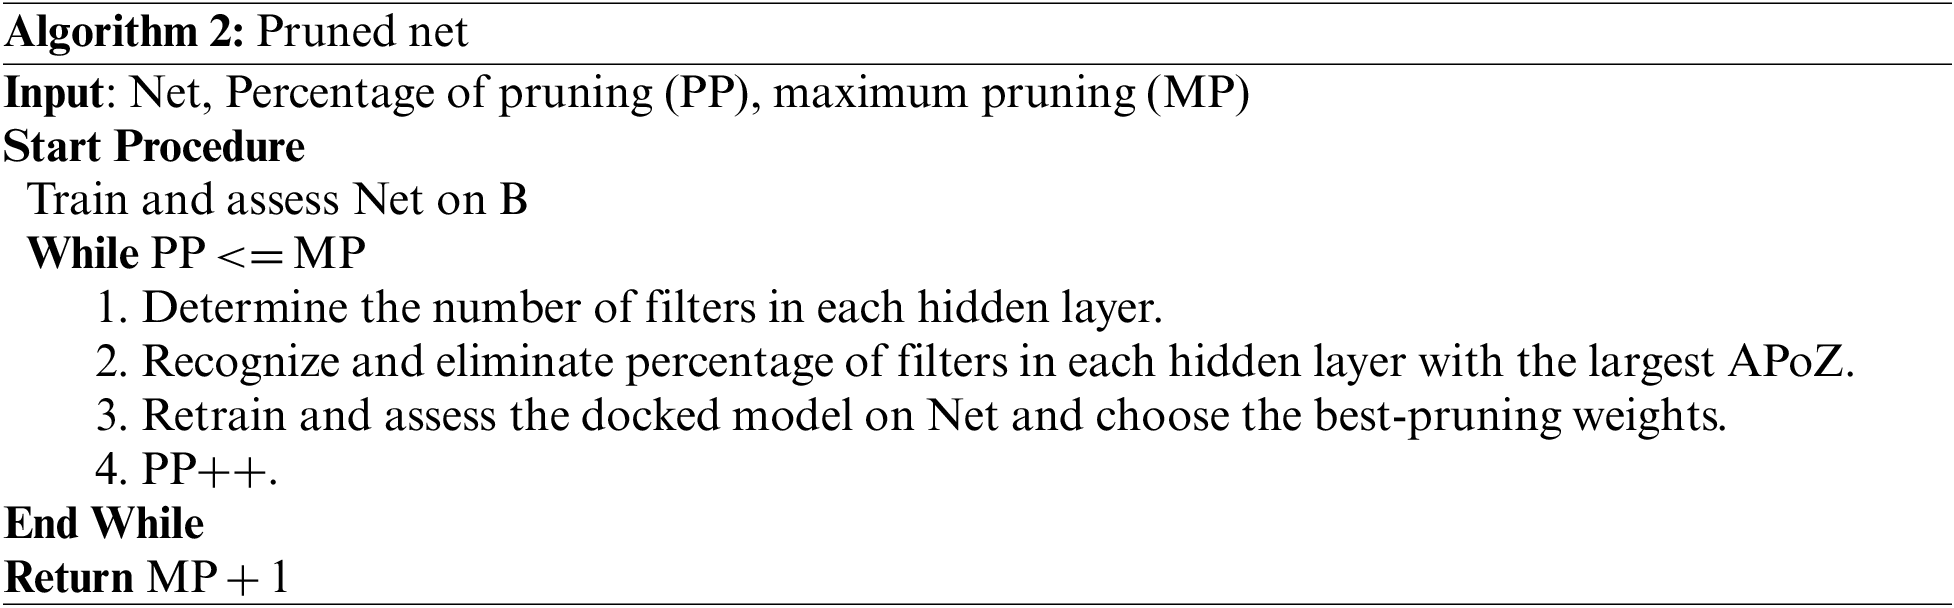
ReLU has a great advantage over sigmod and tanh. We use hybrid optimization algorithms Butterfly Optimization Algorithm (BOA), particle swarm optimization (PSO) and modified salp swarm algorithm (SSA). Fig. 7 represents the steps of creating DCNCC layers and Network. Tab. 2 shows the overall parameters used in the proposed DCNCC training network. The iterative pruning model was used to reduce complexity and time consumed to obtain the optimum number of neurons, and the performance efficiency was not compromised. We used the average ratio of zeros (APoZ) with an abnormal CXR. Algorithm 2 shows the iterative pruning of Net steps.
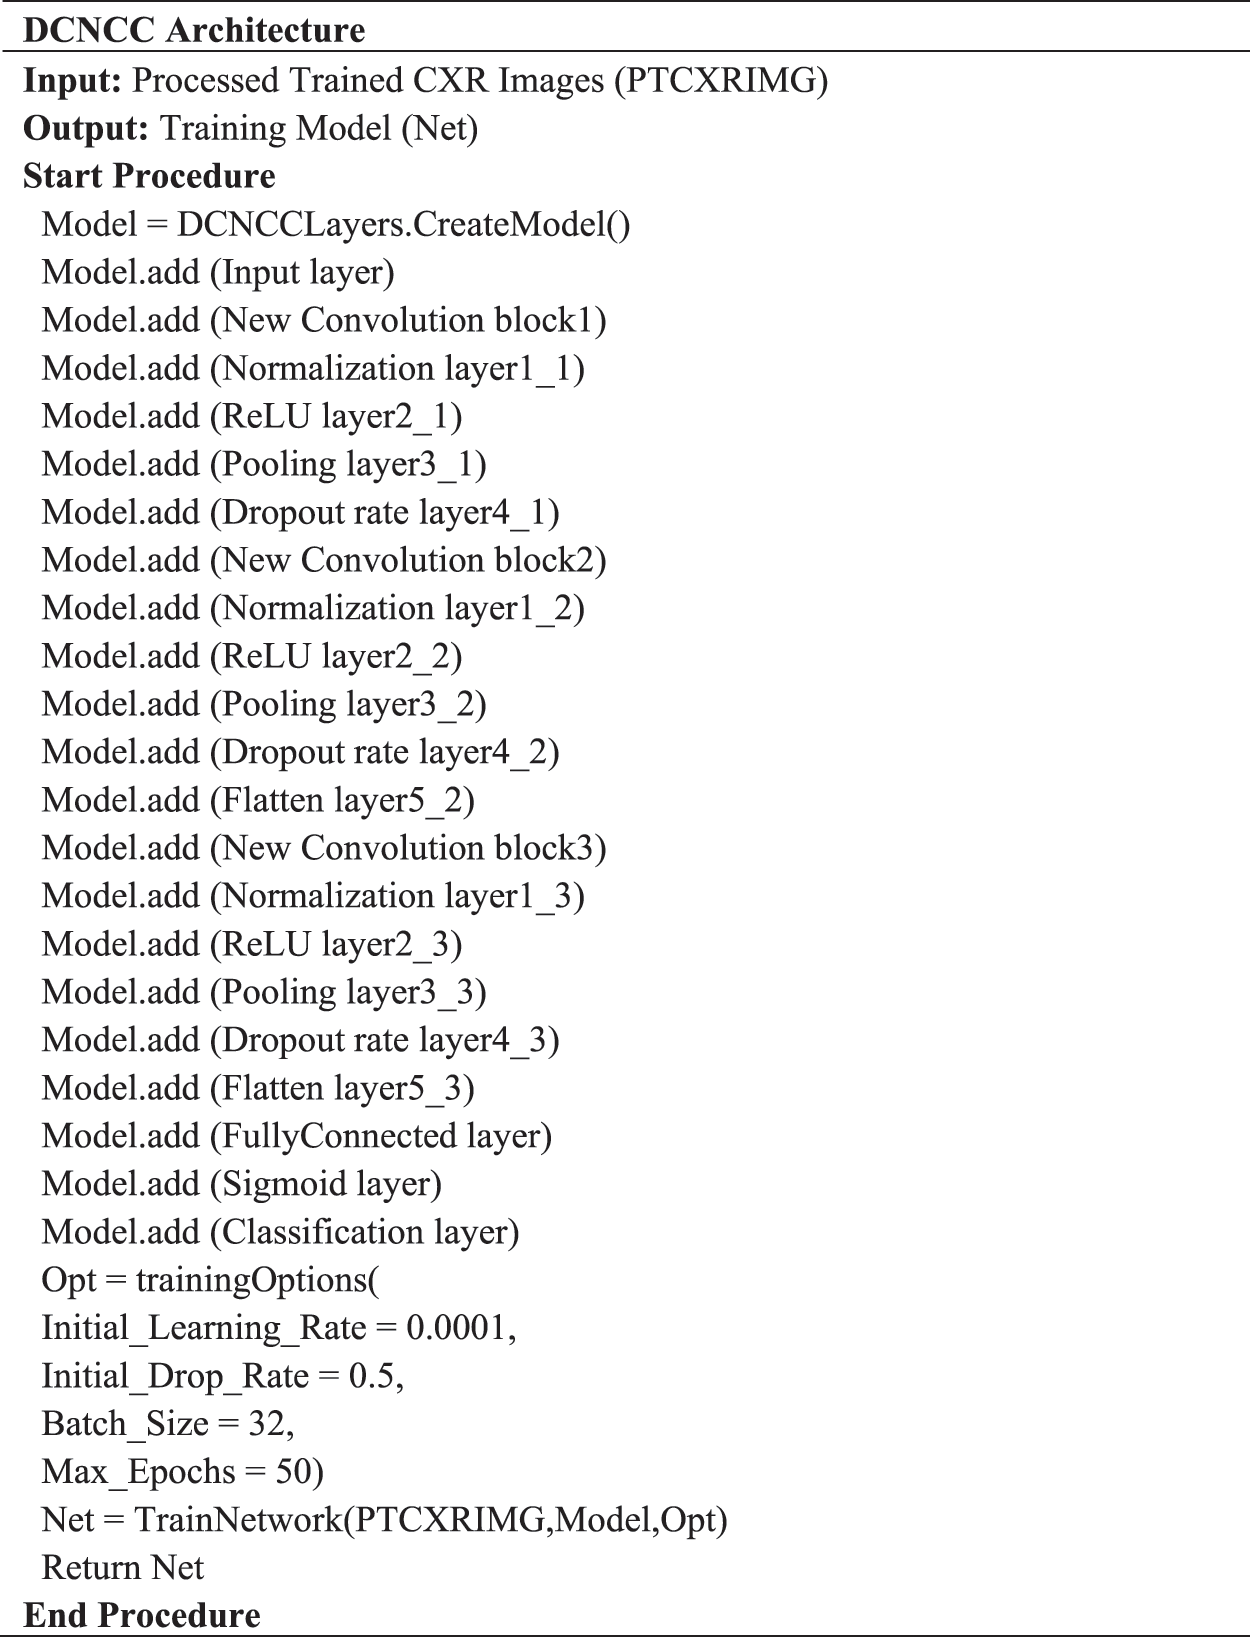
Figure 7: DCNCC architecture
In this section, the practical experiments will be explained. Firstly, the type and size of the data used will be described. Secondly, the results of each trial experiment will be presented and discussed. Finally, comparisons between the proposed model and the rest of the relevant models will be explained. The experiments of this research were carried out using two tools. Firstly, MATLAB version 2021, Intel Core i7 CPU, and 8 GB RAM were used to perform semantic segmentation. Secondly, Google Cola, Tensor Processing Unit (TPU), and 32 GB RAM were used to perform data augmentation, pruning, and deep learning processes.
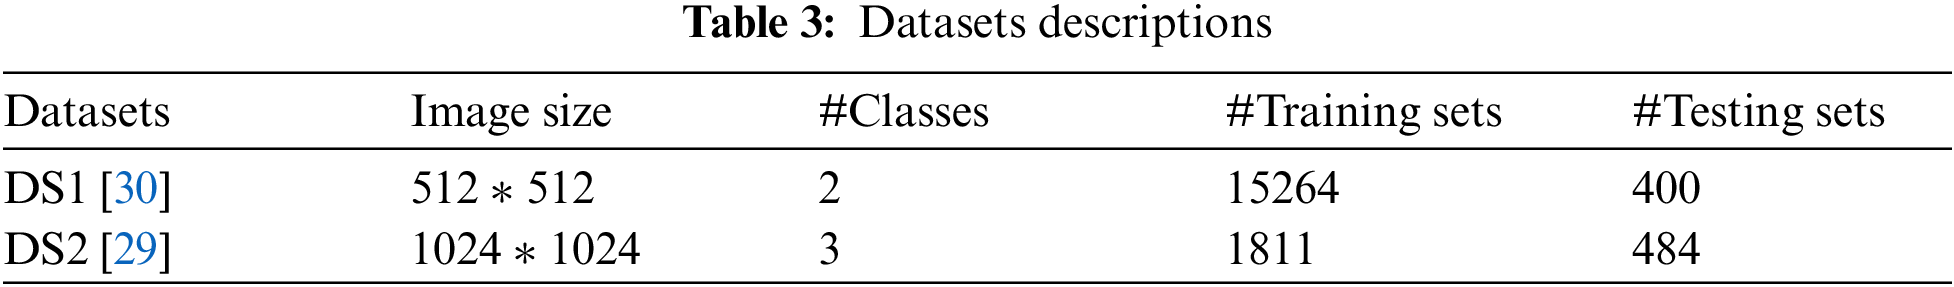
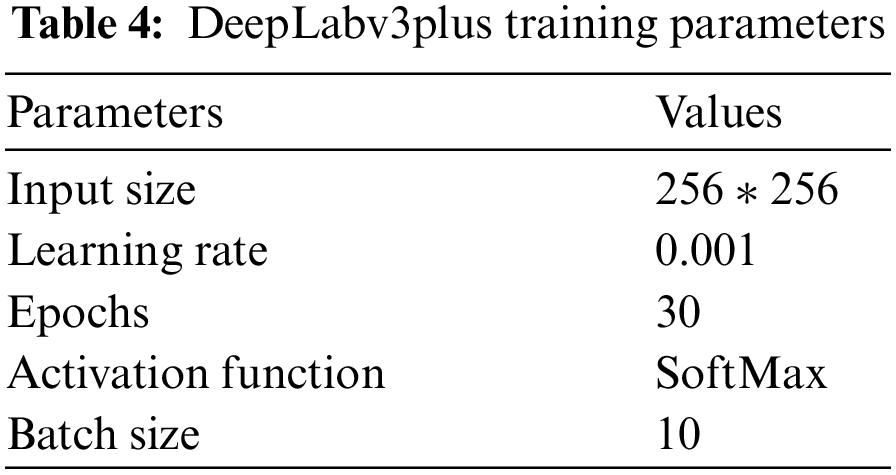
Experiments were carried out on two types of datasets, as shown in Tab. 3. The first dataset (DS1) contains two classes (positive and negative labels). DS1 has 15264 images of the training process and 400 images of the testing process. The second dataset (DS2) contains three classes (COVID-19 pneumonia, bacterial pneumonia, and normal labels). DS2 has 1811 images of the training process and 484 images of the testing process. Tab. 4 represents the configuration parameters used in training process [39].
We use four metrics to evaluate the proposed framework. These metrics are sensitivity, specificity, accuracy, and f-measure. These measurement's equations are used as follows:
where TP = True Positive, FN = False Negative, FP = False Positive and TN = True Negative.
a) First Experiment
The first experiment, pre-trained networks such as ResNet 50 with many epochs (20, 30, 40, 50 and 60) and without data augmentation are conducted with 500 extracted features. In this experiment, we found that with 50 epoch achieved highest accuracy 92.3% and with 60 epoch the accuracy curve was decreased because of overtraining.
b) Second Experiment
The second experiment, data augmentation to increase size of data and pre-trained networks (ResNet 50 and DenseNet) with 1000 extracted features are conducted but without semantic segmentation. In this experiment, we found that with 50 epoch achieved highest accuracy 95.1%.
c) Third Experiment
The third experiment, data augmentation, pre-trained networks (ResNet 50 and DenseNet) with 1200 extracted features and semantic segmentation using Deeplabv3Plus are applied but without prunning. In this experiment, we found that with 50 epoch achieved highest accuracy 96.6%.
d) Last Experiment
The last experiment, data augmentation, pre-trained networks (ResNet 50 and DenseNet) with 1000 extracted features, semantic segmentation using Deeplabv3Plus, and data pruning are applied. In this experiment, we found that with 50 epoch achieved highest accuracy 99.6%.
4.2.3 Comparison between Different Experiments
We conducted four experiments to find more rapid, robust, and accurate training and classification configuration factors. Datasets are divided into 70% for training and 30% for testing. Several ratios of training and testing data were used to test the best one. 80:20 for training and testing respectively was used and output accuracy of 97% using full features. Also, 70:30 for training and testing respectively was used and output accuracy of 99% using full features. Also, 60:40 for training and testing respectively was used and output accuracy of 96% using full features. We use 10-fold cross validation to avoid overfitting problems. Data augmentation is used to increase size of data and overcome unbalanced data. Our system can adapt to any input image, carefully identify regions of interest and extract semantic features from them. The first experiment, pre-trained networks such as ResNet 50 with many epochs (20, 30, 40, 50 and 60) and without data augmentation are conducted with 500 extracted features. In this experiment, we found that with 50 epoch achieved highest accuracy 92.3% and with 60 epoch the accuracy curve was decreased because of overtraining. The second experiment, data augmentation to increase size of data and pre-trained networks (ResNet 50 and DenseNet) with 1000 extracted features are conducted but without semantic segmentation. In this experiment, we found that with 50 epoch achieved highest accuracy 95.1%. The third experiment, data augmentation, pre-trained networks (ResNet 50 and DenseNet) with 1200 extracted features and semantic segmentation using Deeplabv3Plus are applied but without prunning. In this experiment, we found that with 50 epoch achieved highest accuracy 96.6%. The last experiment, data augmentation, pre-trained networks (ResNet 50 and DenseNet) with 1000 extracted features, semantic segmentation using Deeplabv3Plus, and data pruning are applied. In this experiment, we found that with 50 epoch achieved highest accuracy 99.6%. We analyzed and enumerated the model's performance during the learning phase. We used traditional measurement methods such as Sensitivity (SN), Specificity (SP), Accuracy (AC), and F1score (F1-S) to measure the model's efficiency. Fig. 8 represents the detailed confusion matrix for DS1 and DS2. In Fig. 8a, the label 0 represents class 1 for COVID19. Also, the label 1 represents class 2 for normal cases. In Fig. 8b, the label 0 represents class 1 for bacteria cases. Also, the label 1 represents class 2 for COVID19 cases. Also, the label 2 represents class 3 for normal cases. Tabs. 5 and 6 are summarized the Sensitivity (SN), Specificity (SP), Accuracy (AC), and F1score (F1-S) for DS1 and DS2 using (RESNET-50+ DenseNet) respectively. Figs. 9–11 are showed the training and validation accuracy and loss respectively using 50 epochs with 700 iterations.
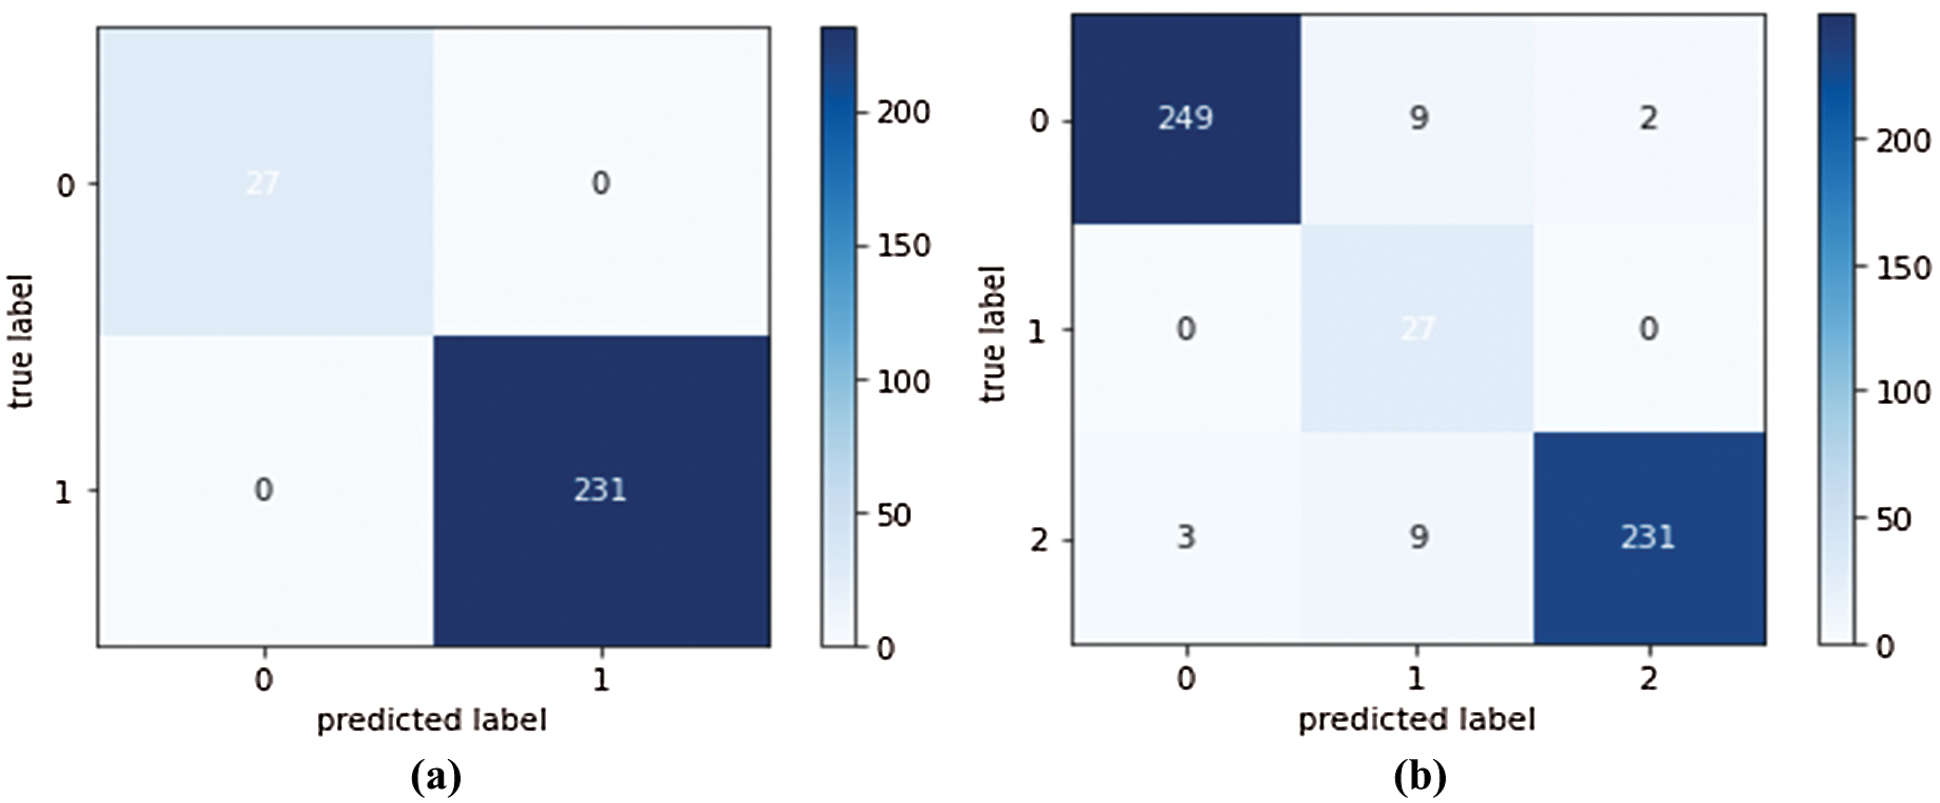
Figure 8: (a) Confusion matrix of the first experiment using DS1 (b) Confusion matrix of the second experiment using DS2
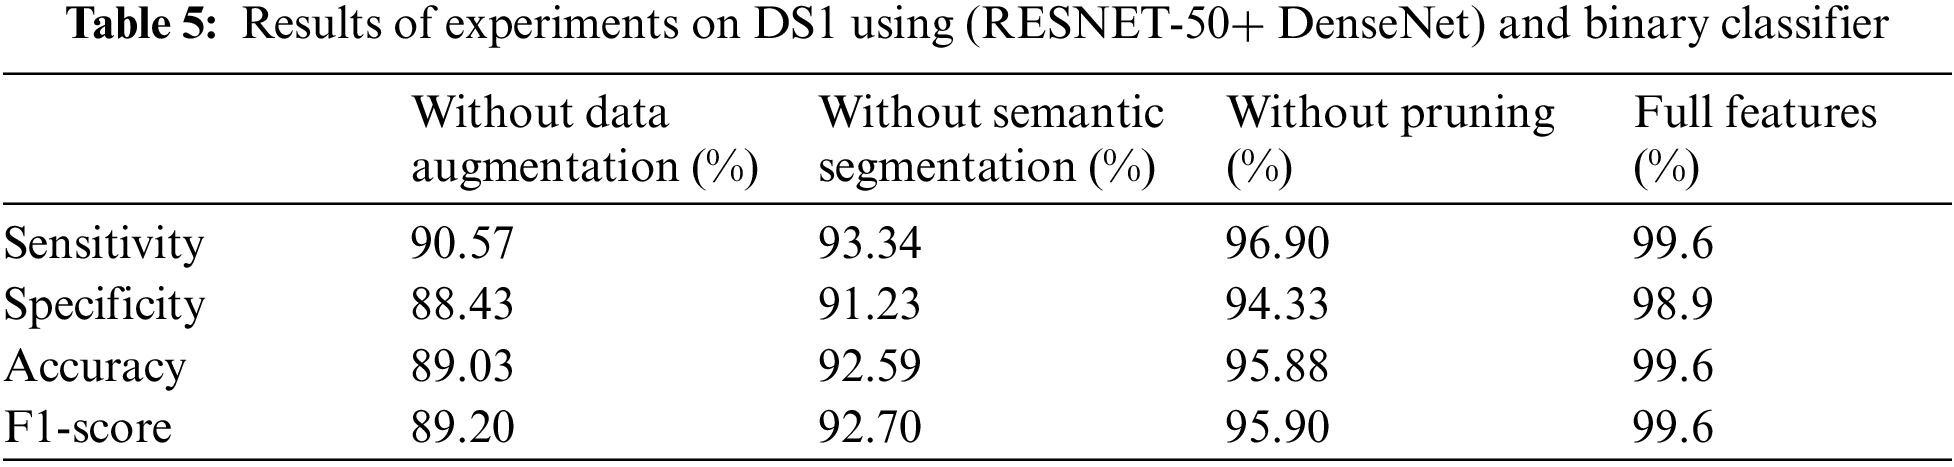
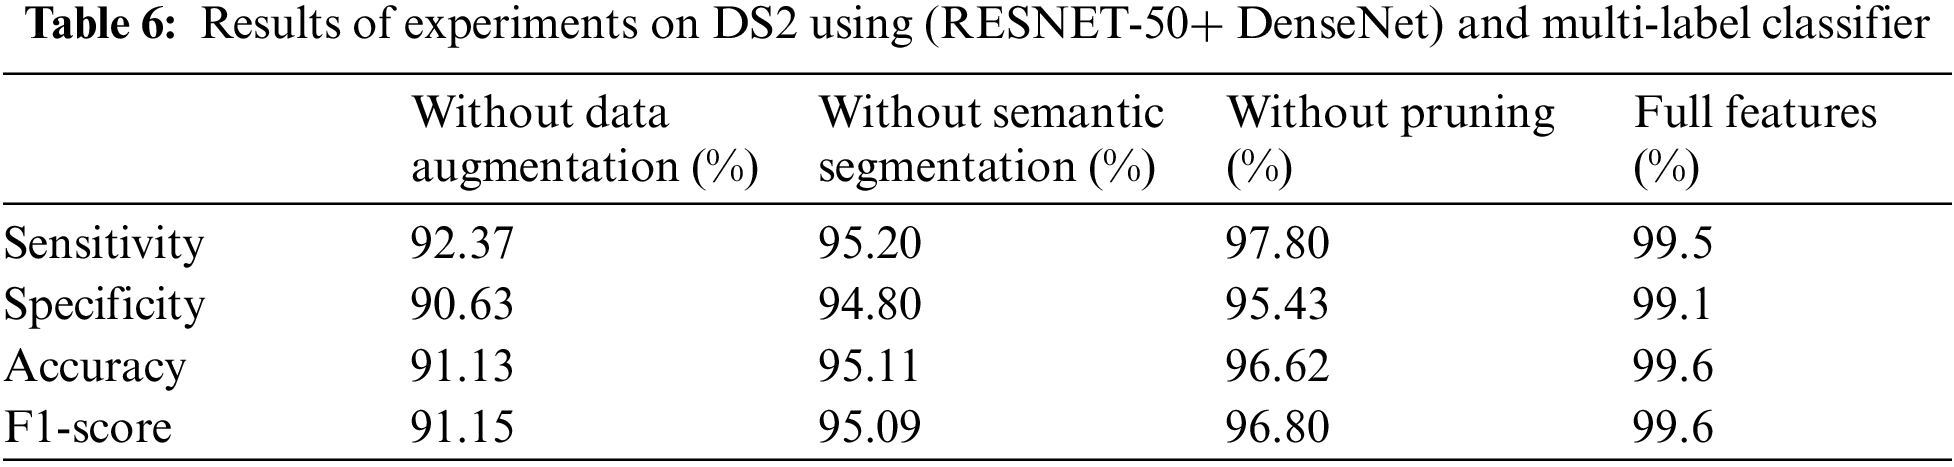
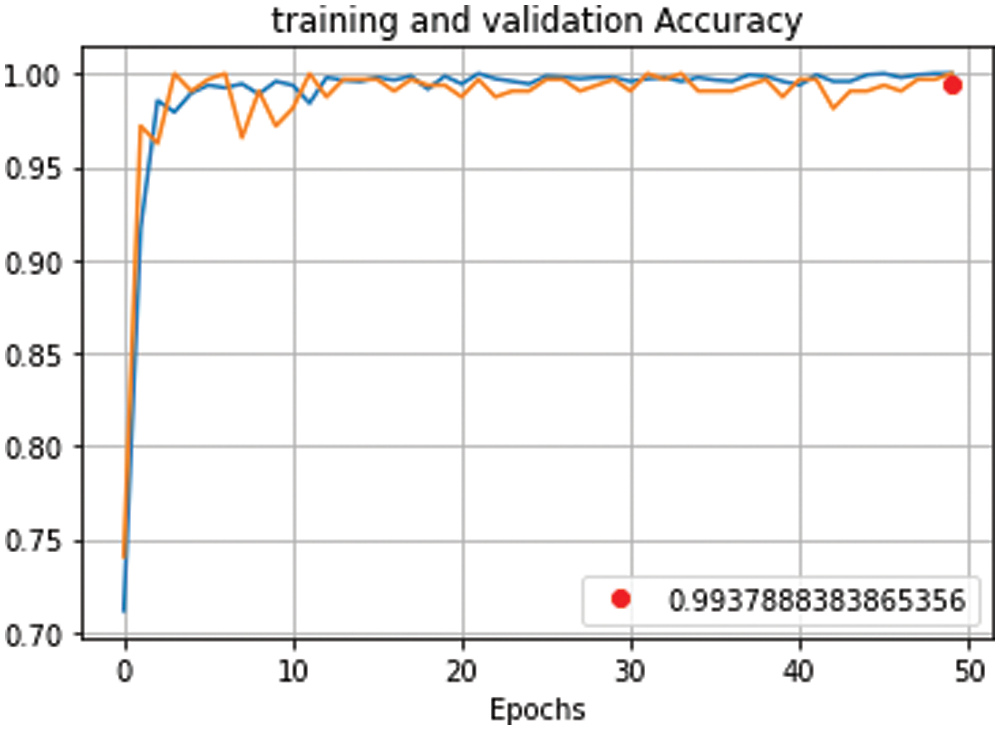
Figure 9: Training and validation accuracy curve for proposed model using (RESNET-50+ DenseNet), 700 iterations and 50 epochs
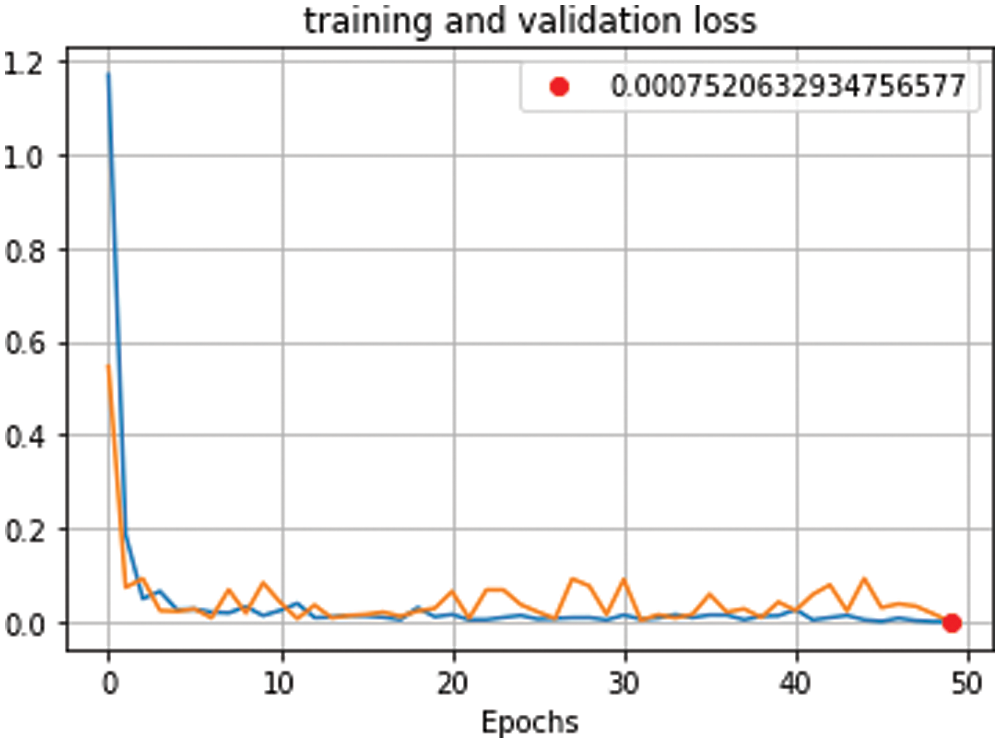
Figure 10: Training and validation loss curve for proposed model using (RESNET-50+ DenseNet), 700 iterations and 50 epochs
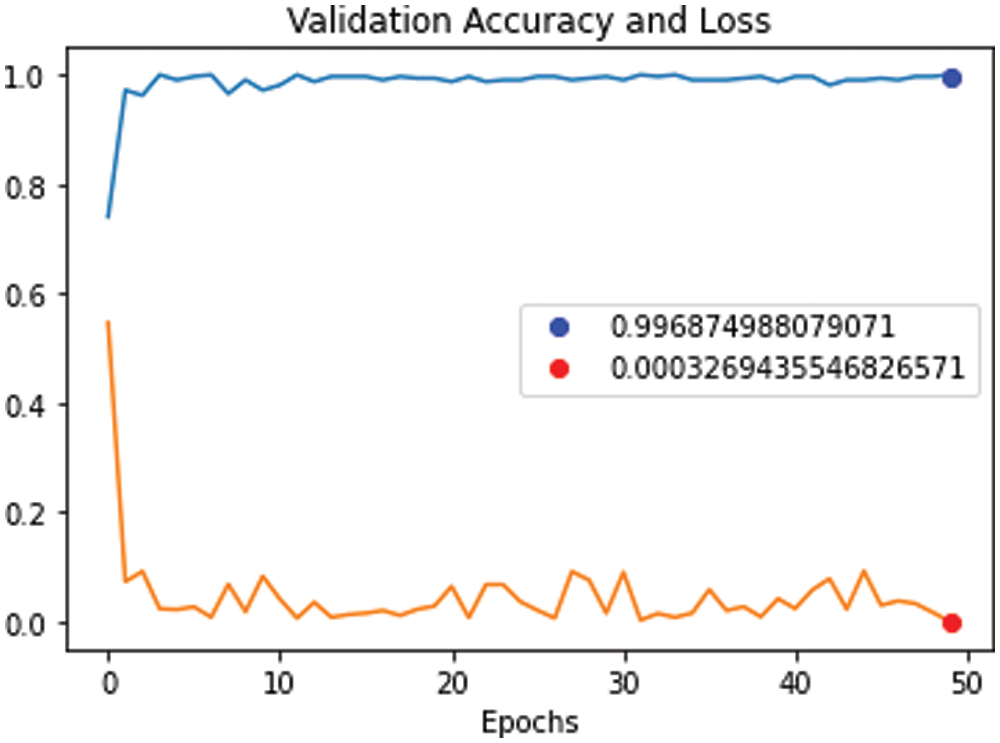
Figure 11: Validation accuracy curve against validation loss curve for proposed model using (RESNET-50+ DenseNet), 700 iterations and 50 epochs
In each experiment, a new technique such as (data augmentation, hybrid CNN, semantic segmentation, and data pruning) was added to increase the number of distinct features, which can increase the accuracy of the diagnosis. But it increases the time consumption. So, we use semantic segmentation to find Region of Interest (ROI) to decrease time consumption. In the Tab. 7, we found that the proposed method achieved the highest accuracy rate, but it still consumes some additional time. A comparison was made between the average of our experiments and the results of others. In Tab. 7 and Fig. 12, the statistical average is shown between the proposed model and the rest of the modern models that discuss the same issue. We clearly found that the proposed model provided the highest accuracy and shortest time consuming as shown in Tab. 7 and Fig. 12.
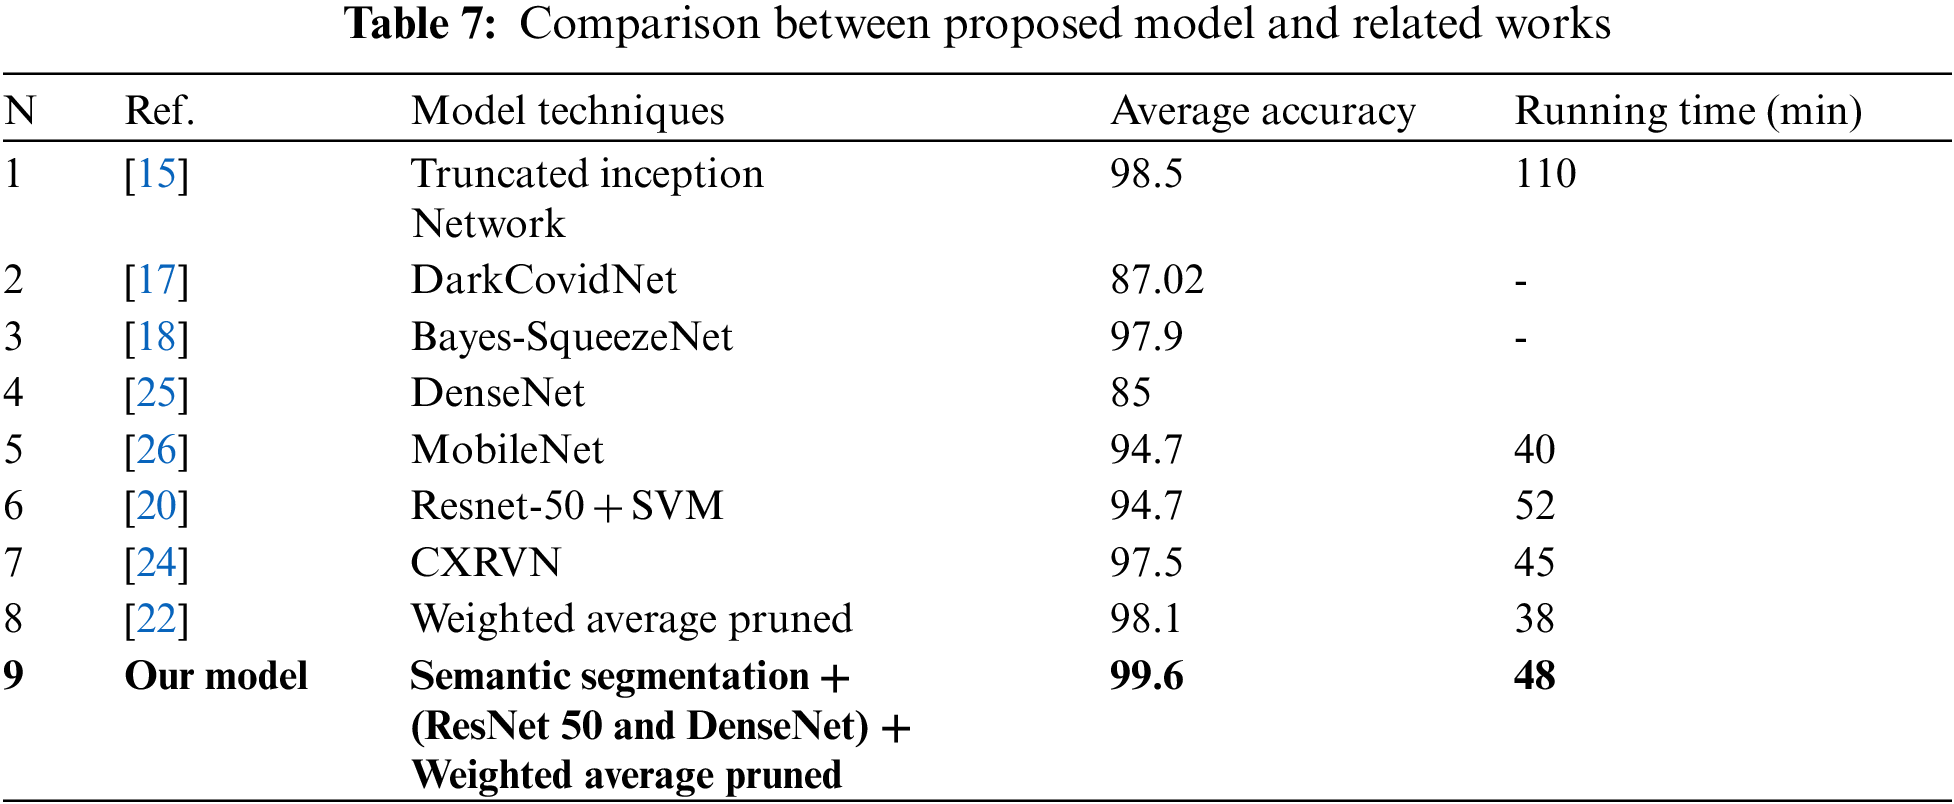
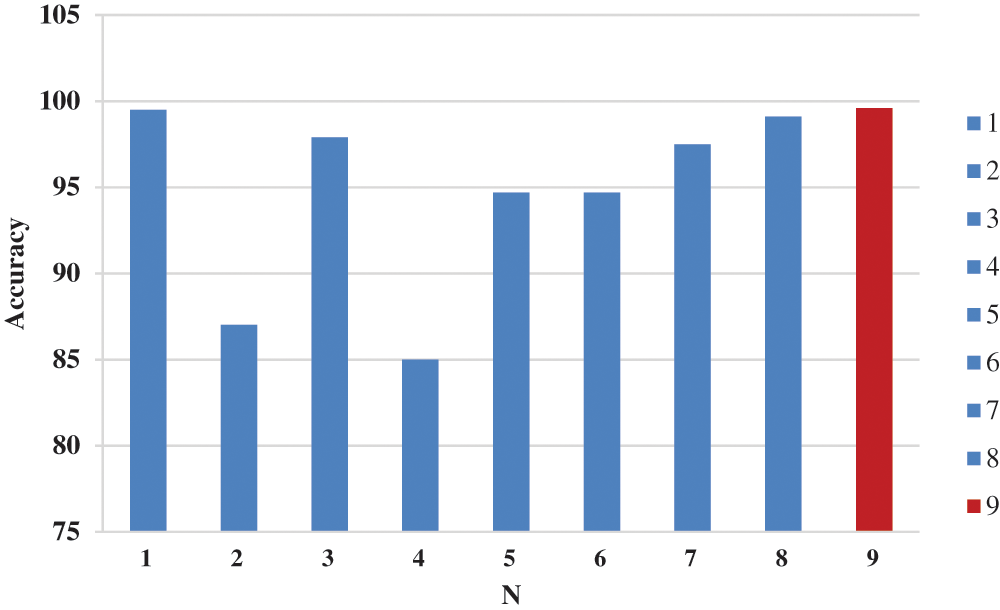
Figure 12: Accuracy chart between proposed model and related works
In this article, we build a proposed model called DCNCC to classify and detect CXR images of COVID-19. The proposed model was worked out in two stages. The first stage is optimizing the images by using dynamic adaptive histogram equalization, semantic segmentation using DeepLabv3Plus, and augmenting data by flipping horizontally, rotating, and flipping vertically. The second stage builds a custom CNN model by using several pre-trained ImageNet and comparing them to repeatedly trim the best-performing models to reduce complexity and improve memory efficiency. Several experiments were done using different techniques and parameters and the evaluations indicated that the performance of the proposed model using three hidden layers of CNN is improved greatly. Furthermore, the proposed model achieved an average accuracy of 99.6% and an area under the curve of 0.996 in the COVID-19 detection.
Data Availability: “GitHub-education454/datasets” Available online: https://github.com/education454/datasetshttps://, “COVID-19 X-ray image classification | Kaggle” Available online: https://www.kaggle.com/c/stat946winter2021/data.
Funding Statement: This work was supported by the National Research Foundation of Korea-Grant funded by the Korean Government (Ministry of Science and ICT)-NRF-2020R1A2B5B02002478). There was no additional external funding received for this study.
Conflicts of Interest: The authors declare that they have no conflicts of interest to report regarding the present study.
1. “WHO Coronavirus (COVID-19) Dashboard | WHO Coronavirus (COVID-19) Dashboard With Vaccination Data.” [Online]. [Accessed: 20-Septemper-2021]. [Google Scholar]
2. “WHO warns that few have developed antibodies to Covid-19 | Health | The Guardian.” [Online]. [Accessed: 21-Septemper-2021]. [Google Scholar]
3. “Advice on the use of point-of-care immunodiagnostic tests for COVID-19.” [Online]. [Accessed: 21-Septemper-2021]. [Google Scholar]
4. K. Muhammad, S. Khan, J. Del Ser and V. H. C. D. Albuquerque, “Deep learning for multigrade brain tumor classification in smart healthcare systems: A prospective survey,” IEEE Transactions on Neural Networks and Learning Systems, vol. 32, no. 2, pp. 507–522, 2021. [Google Scholar]
5. S. Toraman, T. B. Alakus and I. Turkoglu, “Convolutional capsnet: A novel artificial neural network approach to detect COVID-19 disease from X-ray images using capsule networks,” Chaos, Solitons & Fractals, vol. 140, pp. 110122, 2020. [Google Scholar]
6. K. Gao, J. Su, Z. Jiang, L. L. Zeng, Z. Feng et al., “Dual-branch combination network (DCNTowards accurate diagnosis and lesion segmentation of COVID-19 using CT images,” Medical Image Analysis, vol. 67, pp. 101836, 2021. [Google Scholar]
7. M. J. Horry, S. Chakraborty, M. Paul, A. Ulhaq, B. Pradhan et al., “COVID-19 detection through transfer learning using multimodal imaging data,” IEEE Access, vol. 8, pp. 149808–149824, 2020. [Google Scholar]
8. F. Ucar and D. Korkmaz, “COVIDiagnosis-Net: Deep Bayes-SqueezeNet based diagnosis of the coronavirus disease 2019 (COVID-19) from X-ray images,” Medical Hypotheses, vol. 140, pp. 109761, 2020. [Google Scholar]
9. M. Rahimzadeh and A. Attar, “A modified deep convolutional neural network for detecting COVID-19 and pneumonia from chest X-ray images based on the concatenation of Xception and ResNet50V2,” Informatics in Medicine Unlocked, vol. 19, pp. 100360, 2020. [Google Scholar]
10. W. M. Shaban, A. H. Rabie, A. I. Saleh and M. Abo-Elsoud, “A new COVID-19 patients detection strategy (CPDS) based on hybrid feature selection and enhanced KNN classifier,” Knowledge-Based Systems, vol. 205, pp. 106270, 2020. [Google Scholar]
11. M. Nour, Z. Cömert and K. Polat, “A novel medical diagnosis model for COVID-19 infection detection based on deep features and Bayesian optimization,” Applied Soft Computing, vol. 97, pp. 106580, 2020. [Google Scholar]
12. F. Xing, Y. Xie, H. Su, F. Liu and L. Yang, “Deep learning in microscopy image analysis: A survey,” IEEE Transations on Neural Networks and Learning Systems, vol. 29, no. 10, pp. 4550–4568, 2018. [Google Scholar]
13. F. Altaf, S. M. S. Islam, N. Akhtar and N. K. Janjua, “Going deep in medical image analysis: Concepts, methods, challenges, and future directions,” IEEE Access, vol. 7, Institute of Electrical and Electronics Engineers Inc., pp. 99540–99572, 2019. [Google Scholar]
14. S. Rajaraman and S. K. Antani, “Modality-specific deep learning model ensembles toward improving TB detection in chest radiographs,” IEEE Access, vol. 8, pp. 27318–27326, 2020. [Google Scholar]
15. L. Wang, Z. Q. Lin and A. Wong, “COVID-Net: A tailored deep convolutional neural network design for detection of COVID-19 cases from chest X-ray images,” Scientific Reports, vol. 10, no. 1, pp. 1–12, 2020. [Google Scholar]
16. S. U. Bukhari, S. S. K. Bukhari, A. Syed and S. S. H. Shah, “The diagnostic evaluation of convolutional neural network (CNN) for the assessment of chest X-ray of patients infected with COVID-19,” medRxiv, vol. 3, pp. 2020.03.26.20044610, 2020. [Google Scholar]
17. H. C. Shin, H. R. Roth, M. Gao, L. Lu, Z. Xu et al., “Deep convolutional neural networks for computer-aided detection: CNN architectures, dataset characteristics and transfer learning,” IEEE Transactions on Medical Imaging, vol. 35, no. 5, pp. 1285–1298, 2016. [Google Scholar]
18. E. E. Hemdan, M. A. Shouman and M. E. Karar, “COVIDX-Net: A framework of deep learning classifiers to diagnose COVID-19 in X-ray images,” arXiv, 2020. [Google Scholar]
19. S. Basu, S. Mitra and N. Saha, “Deep learning for screening COVID-19 using chest X-Ray images,” in IEEE Symp. Series on Computational Intelligence, Canberra, ACT, Australia, pp. 2521–2527, 2020. [Google Scholar]
20. X. Yang, X. He, J. Zhao, Y. Zhang, S. Zhang et al., “COVID-CT-dataset: A CT scan dataset about COVID-19,” arXiv preprint arXiv:2003.13865, 2020. [Google Scholar]
21. H. S. Maghdid, A. T. Asaad, K. Z. Ghafoor, A. S. Sadiq and A. S. Mirjalili et al.,, “Diagnosing COVID-19 pneumonia from X-ray and CT images using deep learning and transfer learning algorithms,” in Multimodal image exploitation and learning 2021, vol. 11734, p. 117340E, International Society for Optics and Photonics, 2021. [Google Scholar]
22. D. Das, K. C. Santosh and U. Pal, “Truncated inception net: COVID-19 outbreak screening using chest X-rays,” Physical Engineering Sciences in Medicine, vol. 43, no. 3, pp. 915–925, 2020. [Google Scholar]
23. R. M. Pereira, D. Bertolini, L. O. Teixeira, C. N. Silla and Y. M. G. Costa, “COVID-19 identification in chest X-ray images on flat and hierarchical classification scenarios,” Computer Methods and Programs in Biomedicine, vol. 194, pp. 105532, 2020. [Google Scholar]
24. T. Ozturk, M. Talo, E. A. Yildirim, U. B. Baloglu, O. Yildirim et al., “Automated detection of COVID-19 cases using deep neural networks with X-ray images,” Computers in Biology and Medicine, vol. 121, pp. 103792, 2020. [Google Scholar]
25. F. Ucar and D. Korkmaz, “COVIDiagnosis-Net: Deep Bayes-SqueezeNet based diagnosis of the coronavirus disease 2019 (COVID-19) from X-ray images,” Medical Hypotheses, vol. 140, pp. 109761, 2020. [Google Scholar]
26. A. N. Alghamdi and A. S. Abdel-Moneim, “Convalescent plasma: A potential life-saving therapy for Coronavirus disease 2019 (COVID-19),” Frontiers in Public Health, vol. 8, p. 437, 2020. [Google Scholar]
27. A. M. Ismael and A. Şengür, “Deep learning approaches for COVID-19 detection based on chest X-ray images,” Expert System Application, vol. 164, pp. 114054, 2021. [Google Scholar]
28. B. Hassibi, D. G. Stork and G. J. Wolff, “Optimal brain surgeon and general network pruning,” in IEEE Int. Conf. on Neural Networks, San Francisco, CA, USA, pp. 293–299, 1993. [Google Scholar]
29. S. Rajaraman, J. Siegelman, P. O. Alderson, L. S. Folio, L. R. Folio et al., “Iteratively pruned deep learning ensembles for COVID-19 detection in chest X-Rays,” IEEE Access, vol. 8, pp. 115041–115050, 2020. [Google Scholar]
30. B. Chen, Z. Zhang, J. Lin, Y. Chen and G. Lu, “Two-stream collaborative network for multi-label chest X-ray image classification with lung segmentation,” Pattern Recognition, vol. 135, pp. 221–227, 2020. [Google Scholar]
31. O. M. Elzeki, M. Shams, S. Sarhan, M. A. Elfattah and A. E. Hassanien, “COVID-19: A new deep learning computer-aided model for classification,” PeerJ Computer Science, vol. 7, pp. 1–33, 2021. [Google Scholar]
32. W. Wang, Y. Xu, R. Gao, R. Lu, K. Han et al., “Detection of SARS-CoV-2 in different types of clinical specimens,” Journal of the American Medical Association, vol. 323, no. 18, pp. 1843–1844, 2020. [Google Scholar]
33. A. Rehman, S. Naz, A. Khan, A. Zaib and I. Razzak, “Improving coronavirus (COVID-19) diagnosis using deep transfer learning,” medRxiv, vol. 4, pp. 2020.04.11.20054643, 2020. [Google Scholar]
34. N. A. Hikal and M. M. El-Gayar, “Enhancing IoT botnets attack detection using machine learning-IDS and ensemble data preprocessing technique,” In: Ghalwash A., El Khameesy N., Magdi D., Joshi A. (eds) Internet of Things—Applications and Future. Lecture Notes in Networks and Systems, vol. 114, pp. 89–102, Singapore: Springer, https://doi.org/10.1007/978-981-15-3075-3_6. 2020. [Google Scholar]
35. M. M. El-Gayar, N. E. Mekky, A. Atwan and H. Soliman, “Enhanced search engine using proposed framework and ranking algorithm based on semantic relations,” IEEE Access, vol. 7, pp. 139337–139349, 2019. [Google Scholar]
36. “GitHub-education454/datasets.” [Online]. Available: https://github.com/education454/datasets. [Accessed: 21-Apr-2021]. [Google Scholar]
37. “COVID-19 X-ray image classification | Kaggle.” [Online]. Available: https://www.kaggle.com/c/stat946winter2021/data. [Accessed: 21-Septemper-2021]. [Google Scholar]
38. M. M. El-Gayar, H. Soliman and N. Meky, “A comparative study of image low level feature extraction algorithms,” Egyptian Informatics Journal, vol. 14, no. 2, pp. 175–181, 2013. [Google Scholar]
39. “GitHub-VainF/DeepLabV3Plus-Pytorch: DeepLabv3, DeepLabv3+ and pretrained weights on VOC & Cityscapes.” [Online]. Available: https://github.com/VainF/DeepLabV3Plus-Pytorch. [Accessed: 21-Septemper-2021]. [Google Scholar]
 | This work is licensed under a Creative Commons Attribution 4.0 International License, which permits unrestricted use, distribution, and reproduction in any medium, provided the original work is properly cited. |