DOI:10.32604/cmc.2022.024205
| Computers, Materials & Continua DOI:10.32604/cmc.2022.024205 | |
| Article |
Voice to Face Recognition Using Spectral ERB-DMLP Algorithms
1School of Engineering and Natural Science, Altinbas University, 34217, Turkey
2College of Engineering, Electrical and Electronic Engineering, Misurata University, Libya
*Corresponding Author: Fauzi A. Bala. Email: fauzi.bala@ogr.altinbas.edu.tr
Received: 08 October 2021; Accepted: 18 March 2022
Abstract: Designing an authentication system for securing the power plants are important to allow only specific staffs of the power plant to access the certain blocks so that they can be restricted from using high risk-oriented equipment. This authentication is also vital to prevent any security threats or risks like compromises of business server, release of confidential data etc. Though conventional works attempted to accomplish better authentication, they lacked with respect to accuracy. Hence, the study aims to enhance the recognition rate by introducing a voice recognition system as a personal authentication based on Deep Learning (DL) due to its ability to perform effective learning. The study proposes Equivalent Rectangular Bandwidth and Deep Multi-Layer Perceptron (ERB-DMLP) as it has the ability to perform efficient and relevant feature extraction and faster classification. This algorithm also has the ability to establish effective correlation between voices and images and achieve the semantic relationship between them. Voice pre-processing is initially performed to make it suitable for further processing by removing the noise and enhancing the quality of signal. This process is also vital to minimize the extra computations so that the overall efficacy of the system can be made flexible by considering the audio files as features and the images as labels to identify a person’s voice by classifying the extracted features from the ERB Feature Extraction. This is then passed as the input into DMLP model to classify the persons, and trained the model to make an accurate classification of audio with corresponding image labels, and perform the performance test based on the trained model. Flexibility, relevant feature extraction and faster classification ability of the proposed work has made it explore better outcomes that is confirmed through results.
Keywords: Authentication system; power plant; equivalent rectangular bandwidth; deep multi-layer perceptron; convolution neural network
Power plant also known as power station and at times generating plant or generating station is a facility in industries for electric power generation. These industries have to be secured by maintaining strict measures so that unauthorized persons can be prevented from attaining access to the serious equipment. On the other hand, Voice communications permits huge quantities of information exchange that makes it an ideal medium for communication in comparison to other probable alternatives [1]. Using various mediums like communication for securing the power station is significant. In big industries like power generating industry, the staff’s access control is vital for purposes of integrity. It has also been stated that human errors were the main reason for all the economic losses occurring in power stations [2].
The study introduces an effective access control for humans to impose authentication for accessing few confidential or sensitive departments/sections of power stations. In these nuclear stations, trained and highly qualified staffs have been needed where the errors due to humans have been found to possess serious impact on the cost and safety [3].
Conventionally, several earlier researches have introduced resource management reformation and responsibilities re-planning to control all the human errors [4]. This study introduces a robust Speaker Recognition System (SRS) which could grant permission to access only the authorized power plant through a voice analysis. Language has been introduced due to several human descents residing in various geographical areas. These languages vary in accordance with the location and surroundings nature that has been human inhabited. In recent years, various kinds of native tongues and accents have been found [5]. The SRS have been utilized as a solution to assist the systems for enforcing security and privacy. A recommendation has also been afforded that the service providers utilized it for preventing various autonomous attacks thereby protecting all the personal data. As voice varies with person, a system to identify voice has been introduced that rely upon a circumstance that each of the human voice generation systems have been differently structured [6]. In voice generation process, the Vocal Tract (VT) has been stated as the significant factor. The speech tone is directly impacted by the shape of the VT and objects that have been accessible within mouth like teeth count [7]. These speech systems experience various kinds of challenges that are important for modelling process of the speakers. Moreover, an arbitrary voice signal has been used to represent the basic challenges faced by the SRS. The random nature of the voice signal could be achieved from characteristics of electric fluctuation over time. The signal information might vary with time that makes it complex to depend upon the frequency information for VT process modulation [8,9]. On the other hand, the speech identification process encompasses of two varying phases. Initial phase indicates the speaker identification system dependent on text, simply relying upon the correct voice imprint during the training and testing stage. A time domain analysis has been used to execute these systems. It also possesses certain drawbacks stating that the overall matching amongst the training and testing data is vital. However, it is nearly not possible [10,11]. On the other hand, the speaker identification system independent on text might be found in accordance with the signal frequency analysis. This has been carried out through the use of frequency domain analysis namely Fourier Transformation (FT). The central demerit of this proposed approach includes the voice inconsistency to reality. Besides, the voice signals are typical time varying signals as its spectral information change in accordance with time [12].
With regard to the above cases, the traditional models don’t seem to possess the suitable capability for securing the power plants using voice recognition system that accommodates altering nature of the voice signal. Nevertheless, the traditional models might use the FT as one of the significant techniques for analyzing frequency. Supplementary approaches namely convolution, zero-crossing and correlation have been usually used as a time domain method for speech signal analysis. It has been found that the conventional voice identification approaches are not consistent to solve the time varying nature of the voice signal. However, securing the power plants is highly essential for protecting property, society, people and environment from the harmful impacts of ionizing radiation. Inspired by this, the present study aims to develop a secure personal authentication system for power plants utilizing voice recognition based on DL as DL typically possess the ability to perform effective learning.
The main contributions of this study are listed here.
Using the proposed ERB for extracting only the relevant features.
To develop a voice-based authentication system for power plants to improve its security through the introduced hybrid ERB-DMLP.
To analyses the performance of the proposed system by get important results through measurements of important namely accuracy, precession, recall, and f1-score. This analysis helps to evaluate the efficiency of the introduced techniques and also use confusing matrix that let more detailed analysis for measurements.
The paper is organized in the following way. All the fundamental concepts related to the significance of securing the power plants are discussed in Section 1. Then, all the existing techniques used in this context along with its research gaps are presented in Section 2. Subsequently, the overall proposed system is comprehensively explained in Section 3. Results obtained after implementing the proposed system is discussed in Section 4. Finally, the overall system is concluded in section V along with the future work to be undertaken in this area.
Various methodologies and approaches used by the existing system for securing the power plants through various authentication systems are presented in this section.
Security in power plants is essential. Accordingly, the Cyber Physical Systems (CPS) comprise of various systems utilised for physical manipulation and critical infrastructure monitoring like industrial systems, security systems especially power plant systems. A Nuclear Power Plant (NPP) control systems and instrumentation deploy several control systems that organise viable and safe neutronics control as well as the electrical sub-systems including the complete power controlling system. In the industrial plants like NPPs, the operations of the system have been undertaken by the embedded controllers co-ordinated by Supervisory Control and Data Acquisition (SCADA) software. A control-aware attack on the software or controller could make the control system for functioning in an un-safe mode or at times to shut down the plant completely. These malware attacks could lead to high cost for the organisation to clean up, recover as well as maintain activity. The operational mode of SCADA systems produces more log files. These have been found to be valuable for plant behaviour analysis and diagnosis at the time of ongoing attack. Nevertheless, they remain difficult and bulky for inspection in a manual way.
Main aim of assessing vulnerability have been to find and highlight all the susceptibilities occurring in the system. This permits to analyse the weakness as well as most serious issues to be initially solved. Conventionally, the vulnerability assessment techniques would handle with physical system analysis related with the NPP. Conversely, the development of computer networks and digital control systems have made these techniques to be enhanced for including these basic systems as well as vulnerability issues. In addition, the digital systems were utilized in NPPs from 1980s. These systems were used only for Non-Safety Control Systems (NSCS). It also did not require any vulnerability assessment technique. All the NPPs have been designed by integrating digital control and instrumentation systems as the support for protection, monitoring and display, control alarms. This results in new vulnerabilities like critical alarm suppression, data displays in a disrupted way or any unauthorised access to system security from all the connected networks [13]. An analysis has also been carried out to find all the incidents of cyber-vulnerability at the nuclear installations in addition to critical facilities that affords the vulnerability assessment enhancements that have to be undertaken [14]. The Nuclear Regulatory Commissions (NRCs) introduced vulnerability assessment technique that laid the framework for an efficient technique. However, there exists various key integrations as well as alterations that have to be carried out to enhance its efficiency. These comprise of comprehensive digital component and system inventory, enhanced penetration testing and usage, vulnerability database use as well as software analysis, risk redefinitions for utilization in cybersecurity context and lastly high vulnerability assessment [15]. The existing studies have also used various data mining (DM) methods like computation and least square approximation (LSA) techniques. These could be utilized in log analysis and take necessary actions when needed.
This paper explored algorithms and techniques to develop efficient monitoring strategy in contradiction to the control-aware cyber-attacks. To classify the genuineness of packets, the soft computing has applied. The complexities of it’s are reduce when the features are reduced in data set [16]. Its methods have also been explored like computational geometric technique and LSA that could be efficient in monitoring the design phase. This study afforded insights into predictive observation of its efficacy by simulations of attack on a Four Tank Model (FTM) and also using the computation methodology for diagnosing it. The efficacy of LSA and Convex Hull Approach (CHA) for detecting anomaly has been tested through the use of FTM test-bed. In addition, the computational geometric methods like CHA and LSA have various merits in examining the complex log data that have been attained from SCADA server as well as in anomaly detection. CSE (Control System Engineers) have awareness about several statistical methods for detecting faults in control systems. Nevertheless, employing these methods in control system security in contradiction to cyber-attacks have also been unexamined. NPPs also possess server-logging configurations to store the historic data in addition to the output of low-level controllers. A substitute for online monitoring methods would be using these algorithms as an offline monitor. In accordance with this, the article [17] explored a fault-diagnosis technique that rely on Deep Belief Network (DBN) and Correlation Analysis (CA). Feature selection ability of CA has been used for reducing dimensionalities and DBN for identifying faults. These techniques have been validated with a fault dataset comprising of seven fault kinds with sixty-four parameters. Initially, the dimension of the dataset has been minimized under varied correlation coefficients. Subsequently, the study trained a DBN by utilizing the dataset. This later compared the network accuracy ad convergence speed of the training stage through the use of threshold technique. Outcomes explored high training speed and convergence if the threshold value is 0.233.
In the same way, various techniques were focused by many studies. This study illustrated the introduced fault diagnosis model’s performance by the utilizing Personal Computer Transient Analyser (PCTRAN). Additionally, the study compared the results of fault diagnostics from Back Propagation-Neural Network (BP-NN) and Support Vector Machine (SVM) with other existing techniques. Outcomes attained from the comparative analysis explored that the introduced technique possess obvious merits over supplementary techniques and this would be profound important to diagnose the faults occurring in the NPP. This study has to be further enhanced to improvise its accuracy. Efficient measures for securing the NPP using Big Data Analysis (BDA) has been used in this study [18]. This study introduced security measure that rely on classifying the incidents of past attacks and BDA method that performs data processing generated from each security equipment. Control system’s security has been anticipated to be supported via these efficient measures. Traditional behaviour analysis utilized a passive technique that rely on the previous data. This paper introduced an alternative technique that could detect threats quicker which rely on the pattern analysis to prevent the personal information leakage. In this manner, it will also be possible for extracting behaviours that try to leak any critical information through a monitoring system that observes access by use of web users and also track these hackers.
From the analysis of various existing systems in securing NPP, DL have gained attention in recent years [19] The DL methods possess various applications. Decision fusion, transfer learning, human activity recognition, class imbalance issues have attained enhancement in accuracy and performance. It has been concluded that the DL methods have gained more interest in every field where the traditional ML methods have been applicable. Finally, it has been said that DL is an efficient approach and could affords the researchers to evaluate incredible and hidden issues quickly that are related with application for generating accurate and better outcomes [20,21]. DL techniques like Deep Boltzmann Machine (DBM), Recursive Neural Network (RNN), Auto Encoder (AE) and Convolutional Neural Network (CNN) have been attracted recently [22]. These DL techniques as well as their corresponding layer wise architectures have been elaborated by relying on classifying several emotions. The main thing to note it these techniques afford easier training of model and shared weight efficiency [23]. Likewise, this study [24] recommended a technique for estimating combined NPP risk by employing the factors of cyber security to external Platform Security Architecture (PSA) model. Outcomes revealed that the introduced integrated cyber security and safety risk analysis technique could assess the complete NPP risk scope and impacts of security controls of the proposed system like RS-015 in a quantitative way. The system has to be further enhanced to increase the security of NPP [25]. Though various traditional methods have been suggested and obtained satisfactory outcomes, they have to be further improved in terms of recognition rate. These methods are also inconsistent in solving the time varying nature of the voice signal. These significant issues have to be resolved for effective voice recognition.
The study aims to introduce an authentication system for securing the power plant based on DL. Though traditional works focused to accomplish this, it lacked in terms of recognition rate. To solve this, this research introduces a voice recognition system as a personal authentication to restrict specific staffs of power plants from accessing high risk machineries y proposing ERB-DMLP that rely on DL. Generally, these models possess the capability to perform effective learning. It also has the ability of automatic feature deduction with fine-tuning to attain the preferred outcomes. Automatic learning could also be performed by methods based on DL even on any alterations that explore its robustness. It can be employed for numerous data types and applications. Due to these advantageous merits of DL, the study introduces methods based on it. Robust Spectorial based ERB is introduced for performing feature extraction as it is capable of including all the micro-scaled voice signals needed for further processing. This assists in effective classification. In addition, DMLP (Deep Multi-Layer Perceptron) is proposed for classification as it has the ability to perform faster classification which makes it explore better recognition rate. Various stages involved in these processes are outlined as shown in Fig. 1.
A speech extraction style has been applied to recover speech recognition when the signals are disparate with noise. regression of the speech recognition performance is reason by variation between the sample training and the recognition environment because to untrue voice against non-voice classification at low Signal-to-Noise Ratios (SNRs). We used the equivalent rectangular bandwidth ERB it is filter bank cepstrum mechanism is to extract a speech feature and removing noise. By this technique to construct a learning model using the vocal model to get better the speech recognition rate. The ERB filter bank cepstrum was examined in a computational auditory scene analysis system, which analyses the properties of the speech signal.
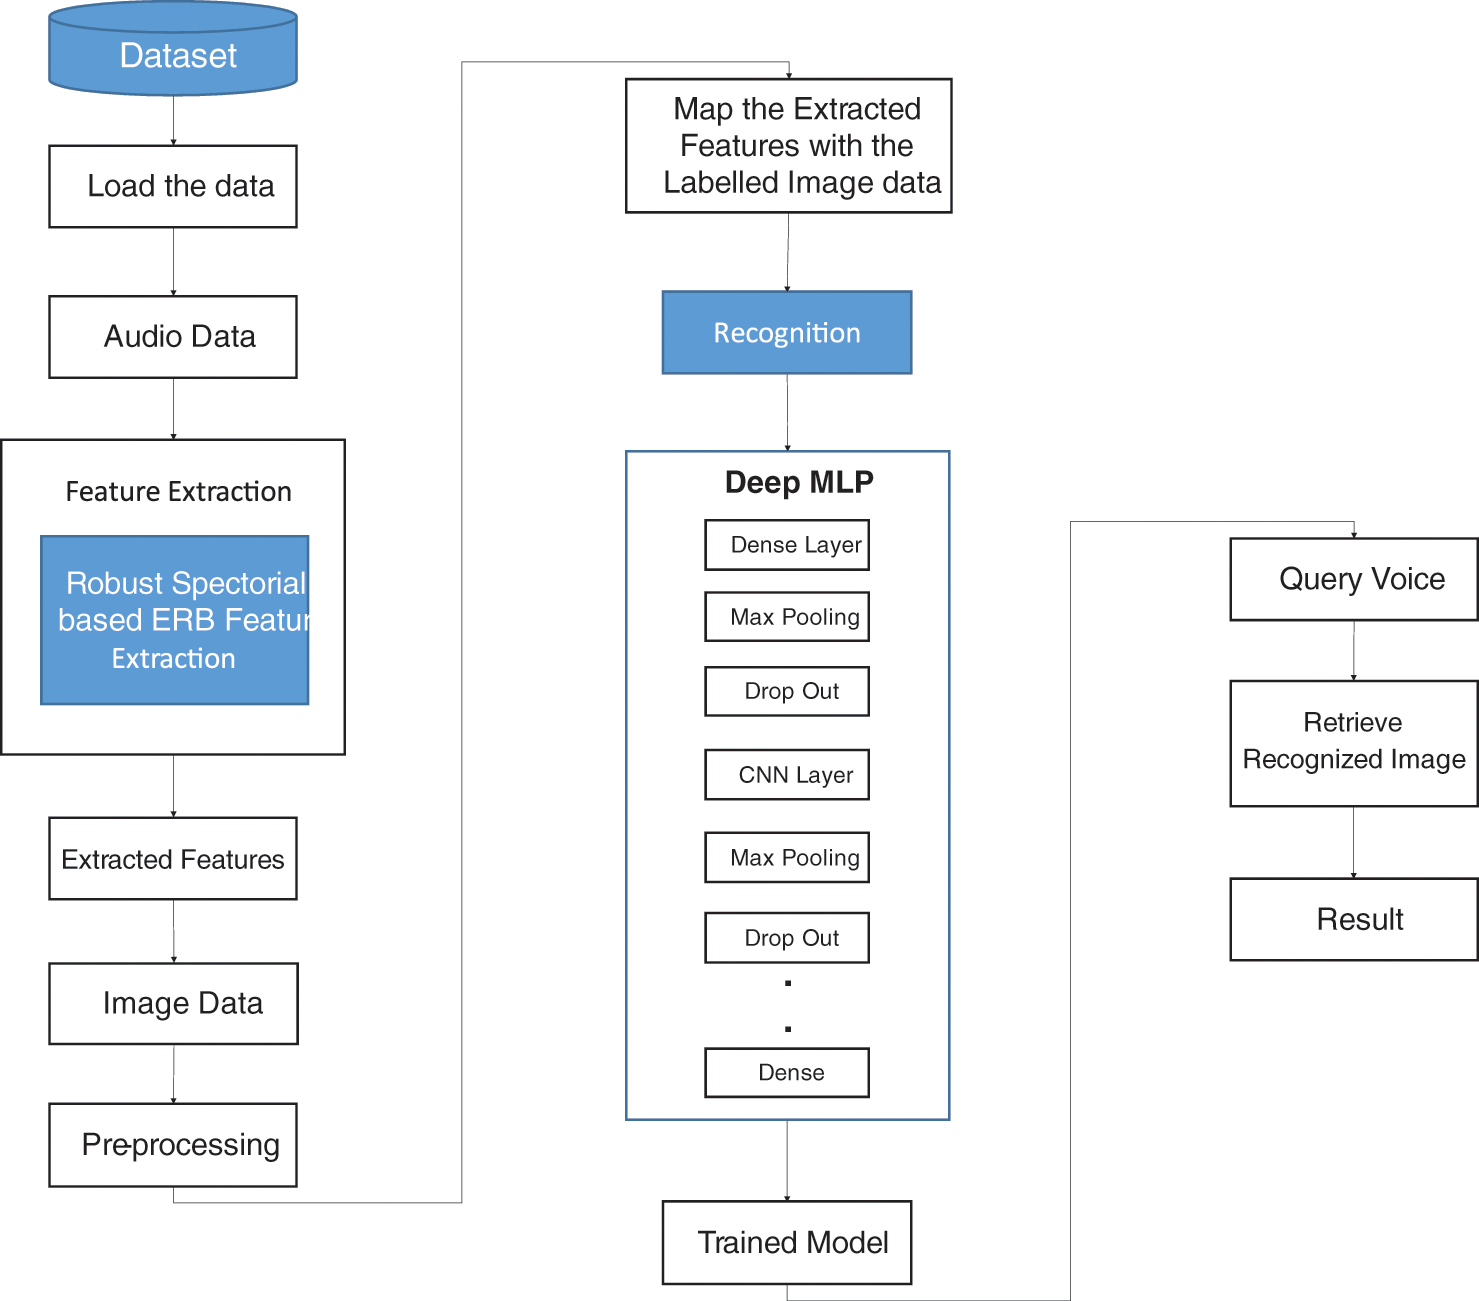
Figure 1: Overall view of the proposed system
Initially, the voice dataset is loaded and followed by features extraction is performed through ERB, then converting audio data to image data and applying computer vision models. After this, re-processing is carried out for further efficient processing. The next stage is mapping the extracted features with the labelled image data, then it will enter the recognition stage, where feature mapping and optimisation is performed through the proposed hybrid Deep Multi-Layer Perceptron (DMLP). Then comes the stage of training and testing, through which the required classification is obtained, thus determining the voice corresponding to the person’s image. Finally, the performance analysis is also undertaken to determine the extent to which the proposed system is better than the existing system. And therefore, illustrated the importance of training and testing done are obtained by the algorithm used via compare the obtained classification values with the analysis of the confusion algorithm
3.1 Speech Signal Pre-processing
Speech signal illustrated in the Fig. 2 it need to pre-processing to the expansion or development of a speaker recognition system, that means isolate the voiced region from the silence, where extraction of the voiced part (samples group) of the speech signal, due to the decrease in computational complicated and explore the overall alterations that are employed to the signal before crossing it for analysis. This procedure leads to the voice based recognition systems to be effective. SRS can handle different speakers, where used dataset for our process which consists of audio files attached to images which assuming they act as labels.
• Input: Audio files, corresponding person’s images.
• Output: Predicted image for the given audio the verification starts by matching the corresponding index with the voice records in this database.
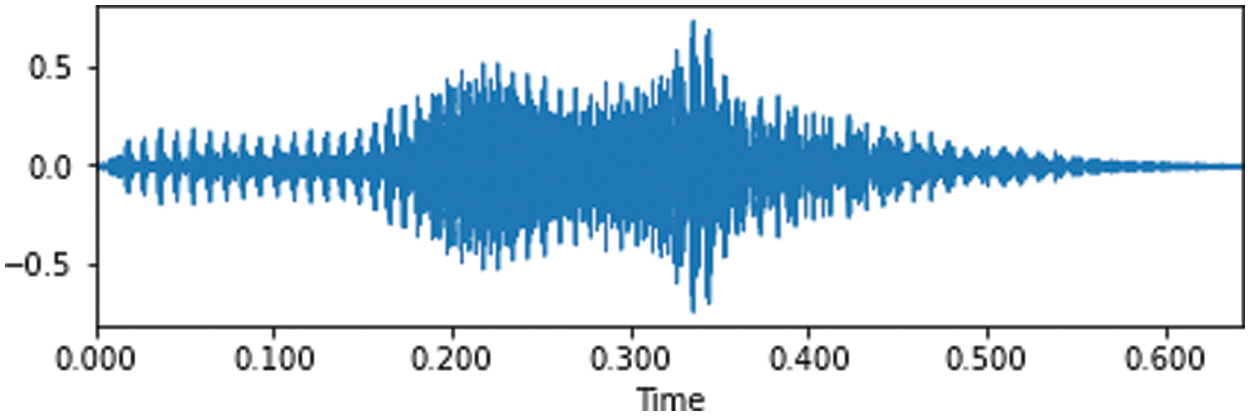
Figure 2: Time domain waveform
A speech or speaker signal is composed of number of parameters. Suitable choice of feature vectors is the significant function in speech recognition, so the feature vectors can be classified as long-time and short-time feature vectors. The long-time ones are estimated over the entire length of the utterance. The short-time ones are determined over window of usually less than 100 Ms. The long-time approach identifies emotions more efficiently.
There are many scales of logarithmic frequency that have been suggested being the most pertinent of the voice recognition and it around, such as the critical-band rate (CBR) scale, the Mel scale and the Equivalent Rectangular Bandwidth (ERB) induced scale, where used calculate the critical bandwidth at different center frequencies, and also in the determine of equal difference in perception of pitches or levels regarding to those it. Feature extraction mechanism beginning with a filter-bank where each filter has its center frequency and bandwidth defined along of frequency scales.
Traditional speaker features such as MFCC features usually do not perform well under noisy conditions, because extracted features are deformed by noise, causing ill-matched, probability compute. In the other hand we find a novel speaker feature, such as Gammatone Cepstral Coefficient (GTCC), based on an auditory periphery pattern show that this feature captures speaker specifics and implement better than conventional speaker features under the noisy. Also, based on equivalent rectangular bandwidth (ERB) scale, has accurate at lower frequencies.
Gammatone filter described by an impulse response resulting from gamma distribution and sinusoidal tone is frequently used in audio filters in the audio system.
gammatone filter bank pass the signal (dismantling) it through a bank of gammatone filters equally spaced on the ERB scale where Gammatone filter banks were designed to model the human auditory system.
3.2.2 Equivalent Rectangular Bandwidth (ERB)
ERB is the bandwidth of a rectangular filter to pass the energy of the filter as shown the Fig. 3.
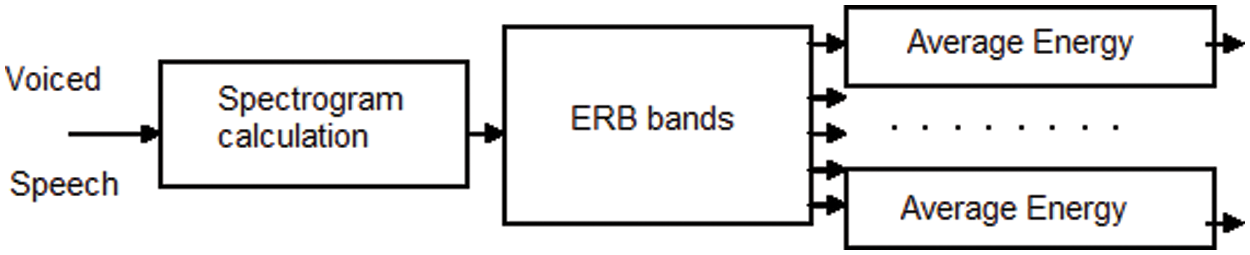
Figure 3: Time-frequency feature extraction from spectrograms
Where the relation between the ERB of the human auditory filter and the center frequency has been studied extensively using analysis terms to approximate measurement data from psychoacoustic experiment. Fig. 4 shows the time domain spectrogram, spectrograms are often a useful pre-processing step.
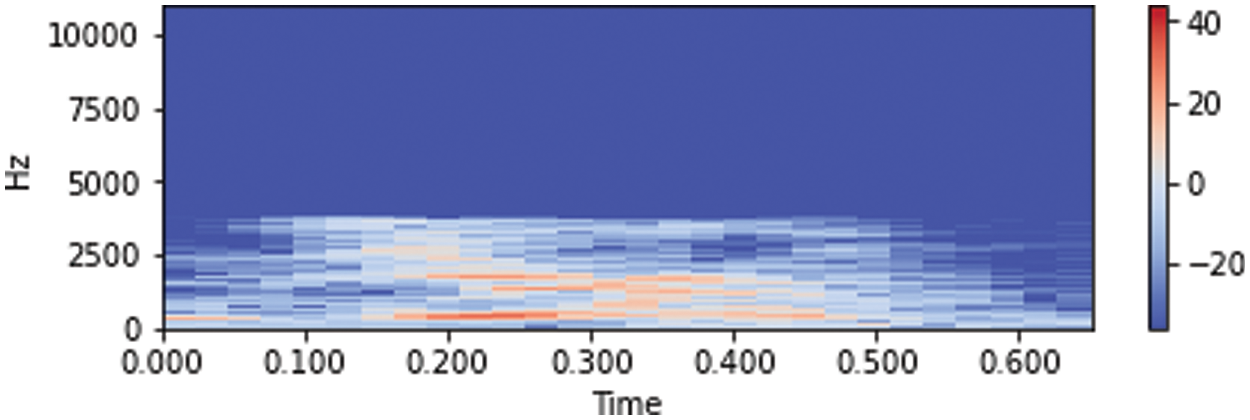
Figure 4: Spectrograms of the audio data
The equation can be rewritten, because the ERB of human auditory system may vary with age and sound level and from one listener to another, so the bandwidth of human auditory filters can be approximated by the equation:
It can also be reformulated as follows
The Eq. (2) is applied in numerous auditory studies for selecting the center frequencies of the auditory filter bank. Fig. 5 show the ERB filter bank.
The Fig. 6 closely the human auditory perception of pitch, which more sensitive to lower frequencies than to higher frequencies. The scale remains linear for lower frequencies even to 1 KHz, after which becomes logarithmic.
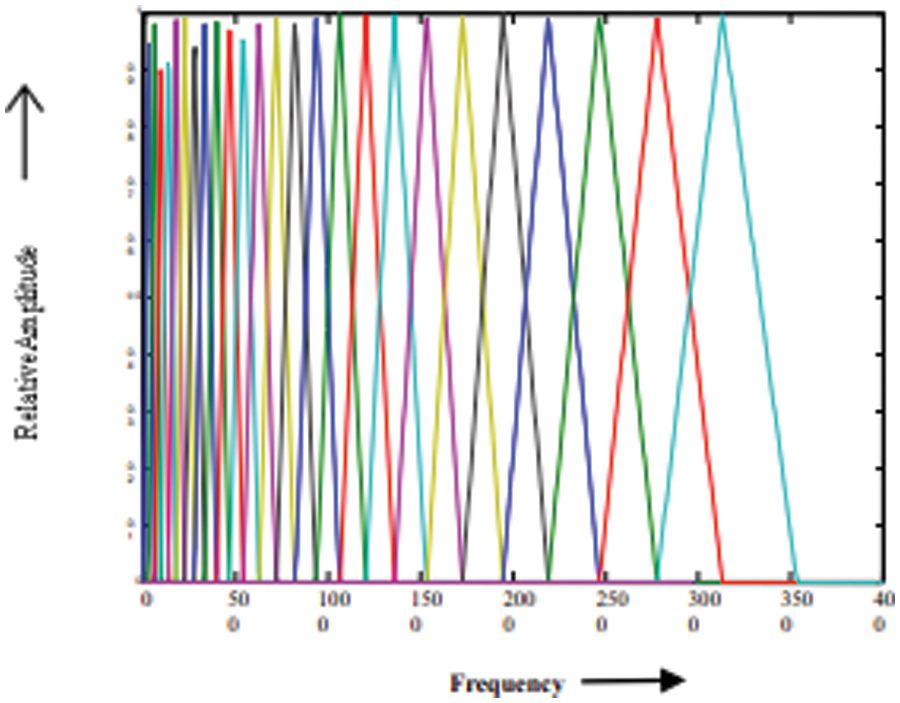
Figure 5: ERB scale filter bank
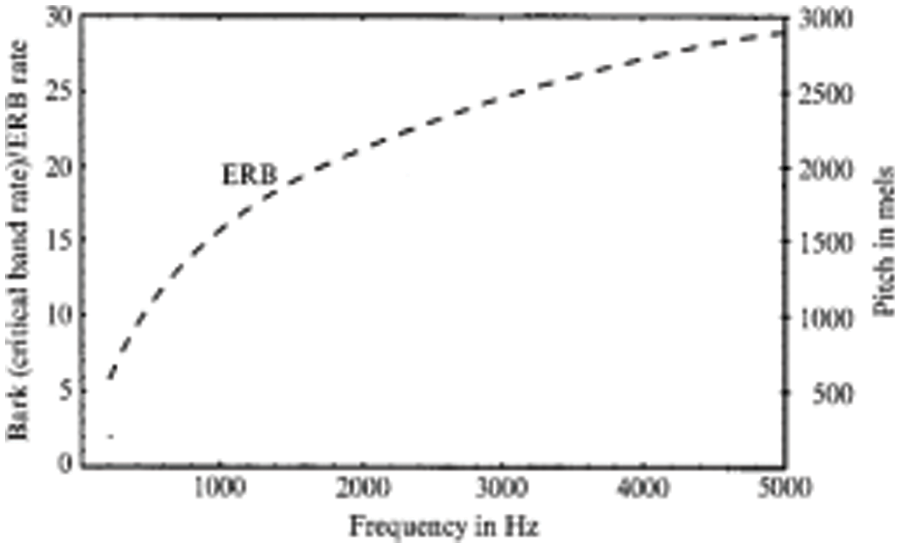
Figure 6: ERB scale
In general, a voice recognition system consists of several stages. The premier step is to collect the necessary voice speech samples to make the speech database. It is the start to the speech recognition system.
This speech signal is to be processed to identify the identical speaker. So, the signal is to be pre-processed firstly. This it will better the quality of the input signal. From this signal the features are to be gather. The system has to use a classifier in order to classify the speech signals. By using these features extracted from the signals, the classifier is to be trained. After completing the training, the system becomes recognized with the various parameters and their features, subsequently when another speech signal is allowed, it will properly classify it.
This stage is known a recognition stage, where feature mapping and optimization is performed through the proposed hybrid DMLP. Based on the trained neural network on Voice features, where MLP minimizes the loss function by repeatedly updating these weights. The algorithm stops when it reaches a preset maximum number of iterations; or when the improvement in loss this mean the model indirectly learned the function that maps the inputs to the outputs. This procedure it requires a “large” number of parameters to process multidimensional data. MLP, CNN combined to make the most of each. MLP, CNN don’t do everything, but much of its success comes from identifying its purpose and the good option of some parameters, such as Loss function.
3.5 Training and Classification
Classification task is a learning the algorithm that attention of the training data set to determine, or learn the variables that will predict a good prophetic model, where the goal is to produce a trained (fitted) model that generalizes well to new, unknown data. Classification of machine learning models can be validated by accuracy estimation techniques, which splits the data in a training and test set (conventionally 2/3 training set and 1/3 test set designation) and evaluates the performance of the training model on the test set. In classification.
The proposed system is implemented and the obtained results are presented in this part. Moreover, the dataset considered in this study were also explored. the performance metrics considered for the analyzing the performance of the introduced system is also discussed. These results were revealed the degree to which the proposed system is better than the existing system. Performance metrics were used in machine learning are used to appreciate how well machine learning algorithms perform that used which included accuracy and classification that include, precision, recall and F1-score. These it helps understand the strengths, weakness and limitations of these models when making forecasts in new placements. Tab. 1 and Fig. 7 shows the results obtained. Also discussed this section the accuracy and its relation to the loss, which resulted on the layers of the deep neural network and the parameters that it used and unused. And through the results obtained through the confusion matrix or as it is called the error matrix, the accuracy of the algorithm showed how well the results matched the classification report.
Accuracy is the number of times a machine learning model will correctly predict a given result out of the total number of times it predicted.
But it doesn’t tell us anything about the errors machine learning models make on new data we haven’t seen before as shown Fig. 8.
TP: number of True Positives, TN: True Negatives
FN: False Negatives, and FP: False Positives.
These terms can be expressed as Fig. 9.
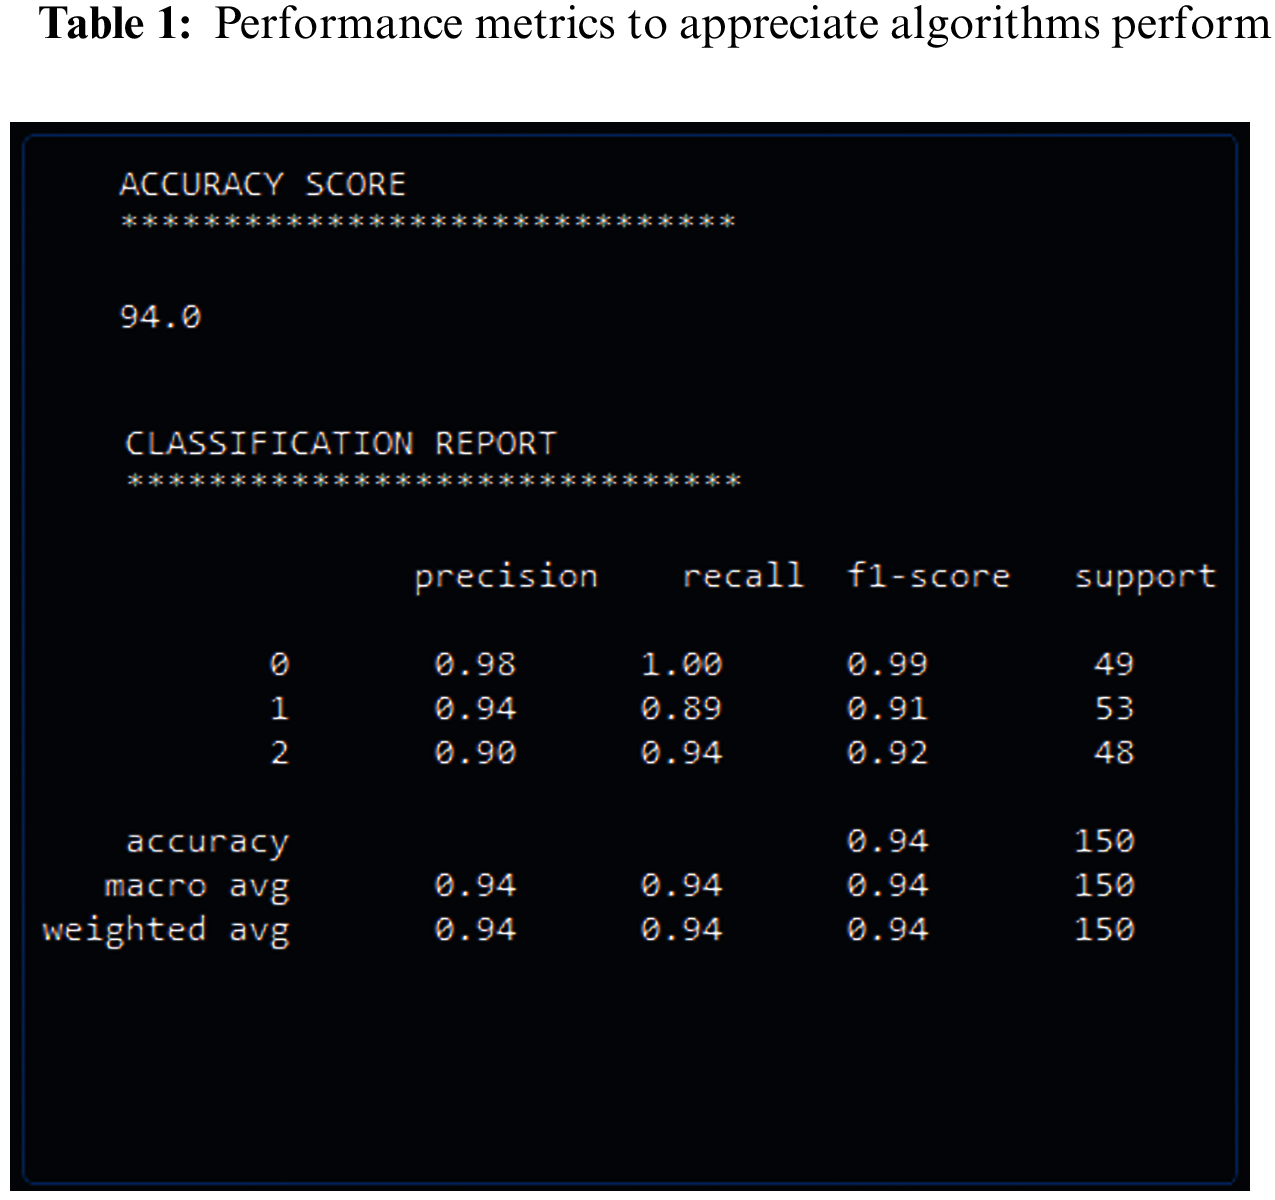
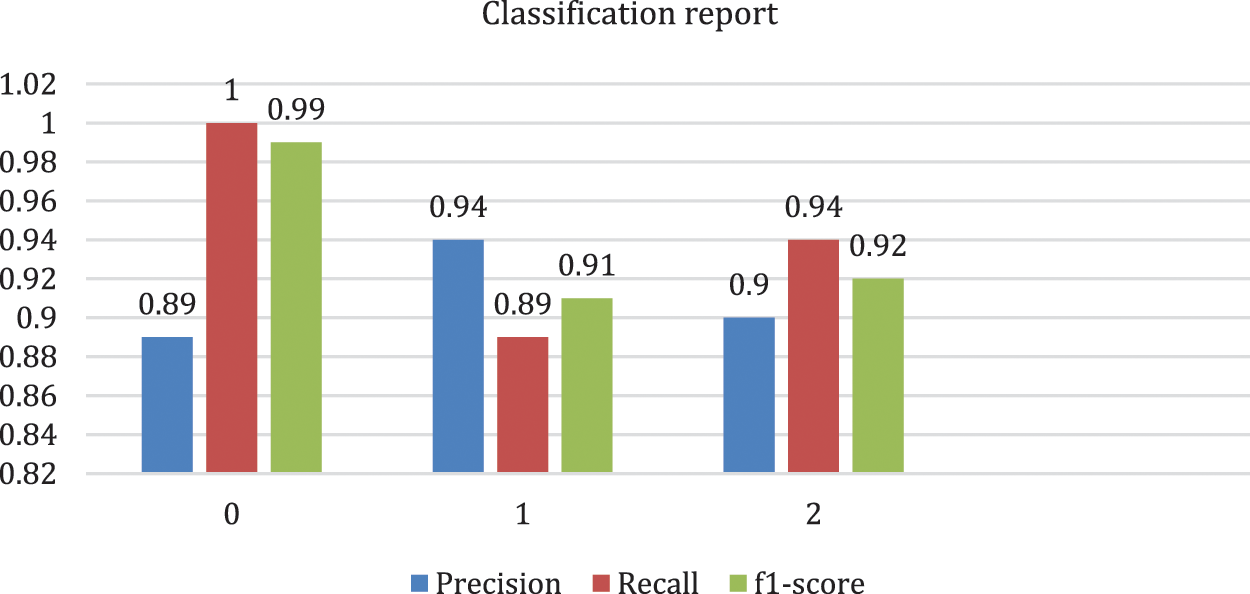
Figure 7: The basic important metrics in the classification report
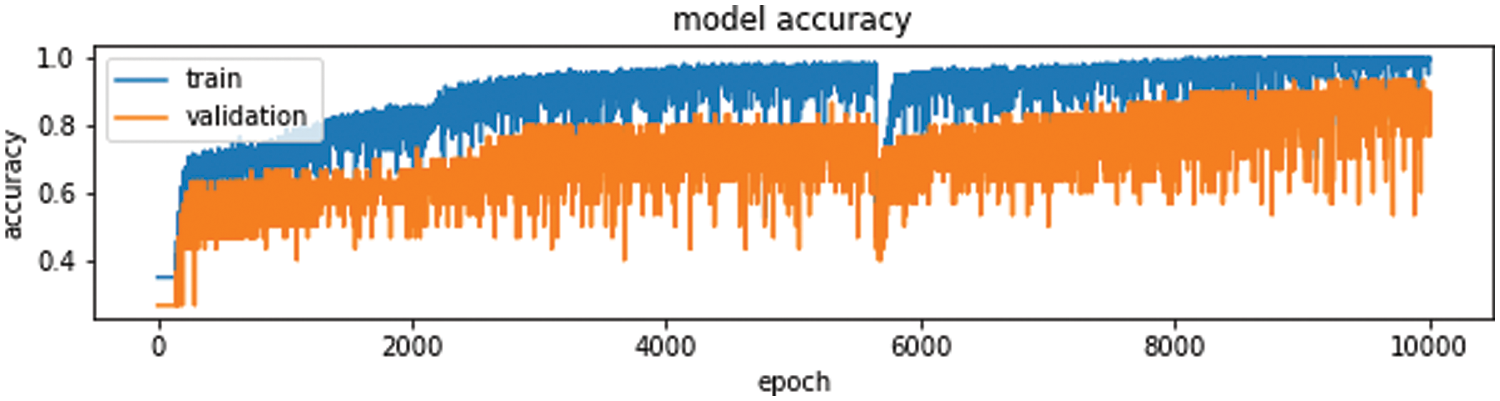
Figure 8: Training and validation accuracy
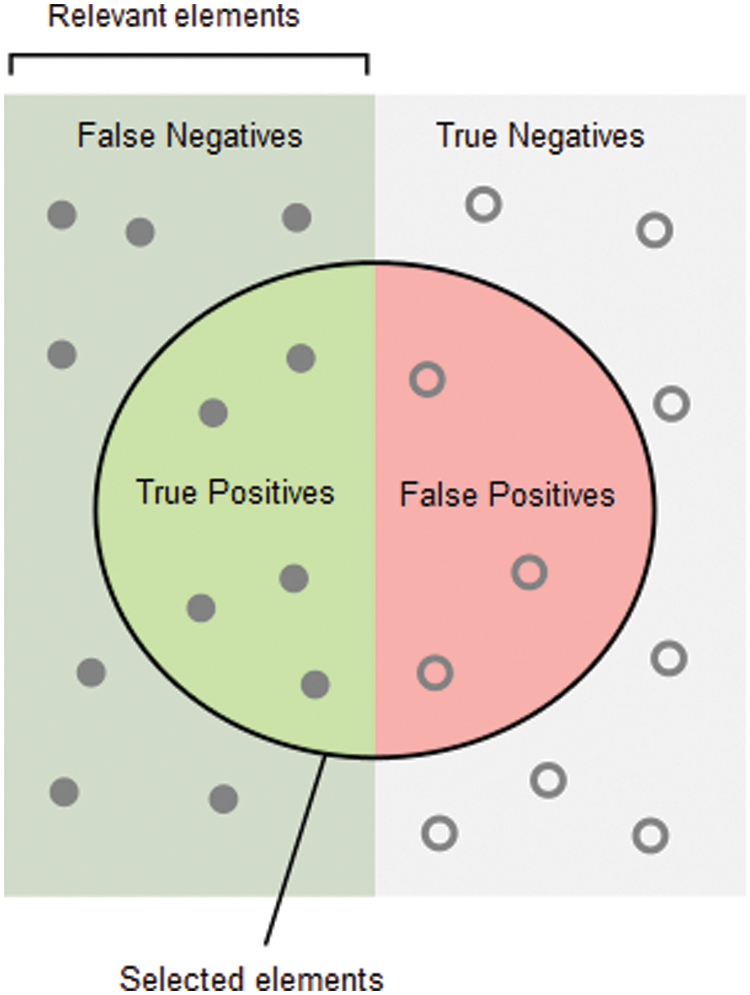
Figure 9: Expression terms
The precision is intuitively the ability of the classifier not to label as positive a sample that is negative.
The recall is the ability of the classifier to find all the positive samples
The F1 score a weighted average of the precision and recall, where an F1 score reaches its best value at 1 and worst score at 0.
To optimize a machine learning algorithm, there is a so-called loss function, considered better is the best way to evaluate the quality of a function by calculating the difference between the predicted values and the real ones, where it calculated on training and testing and its interpretation is based on how well the doing for the model.
The objective of training a model is to find a set of weights and biases that have low loss. Higher loss is the bad prediction for model, so if the predictions are ideal, the loss is zero. The Fig. 10 show loss function.
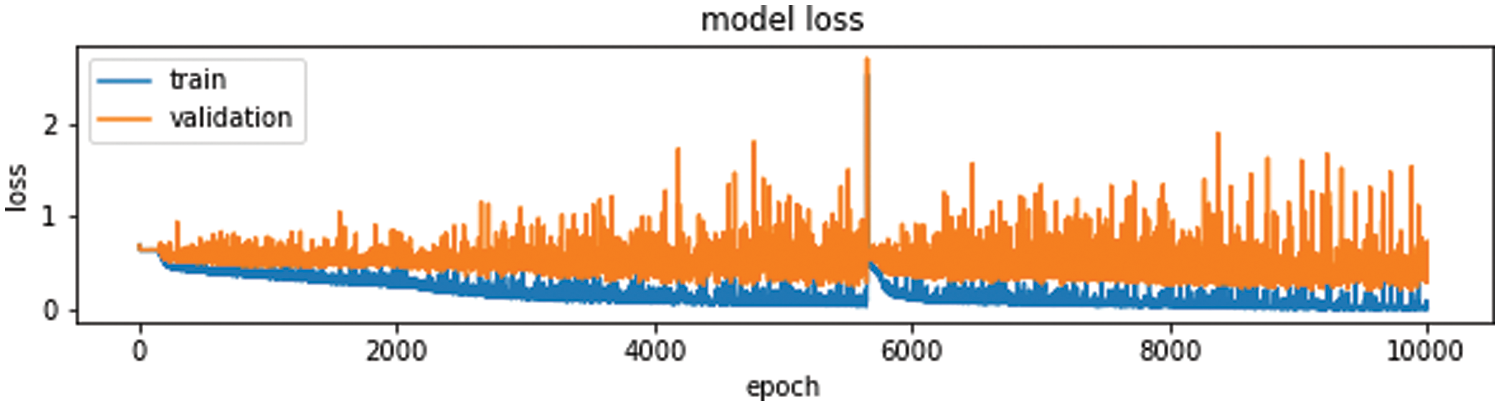
Figure 10: Training and validation loss
frequently would observe that accuracy increase with the decrease the loss, but is not always. Accuracy and loss have different definitions and measure different things. They often appear to be inversely proportional but there is no mathematical relationship between these two metrics. The accuracy doesn’t talk about the errors machine learning models make on new data we haven’t seen before.
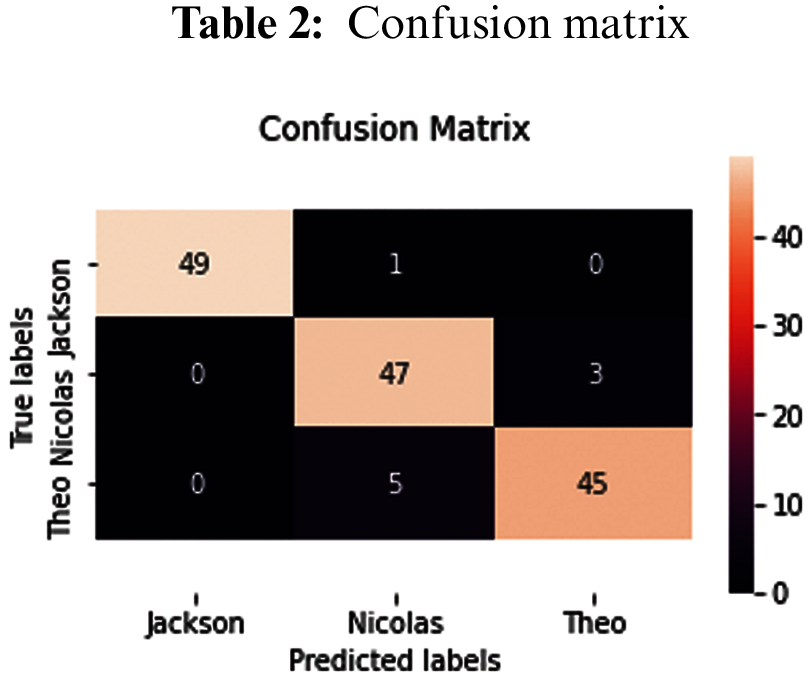
One of issue of statistical classification is obtain a confusion matrix, that also known as an error matrix or table of confusion. confusion matrix is a 2-D matrix which represent the overall performance of the model or algorithm. Each row of the matrix illustrates the instances in a true class while each column represents the instances in a prophesy class, or vice versa. It is a special kind of error table, with two dimensions (“actual” and “predicted”) that reports the number of true positives (TP), true negatives (TN), false positives (FP)and false negatives (FN) as shown in Tab. 2. This let more detailed analysis than mere proportion of correct classifications (accuracy), where accuracy will yield deceptive results if the data set is unbalanced; that is, when the numbers of observations in different classes vary highly.
Through the confusion matrix, we find that the classes that are correctly categorized in the main axis and the classes that are misclassified are zeros.
SRS deals with various speakers. Accordingly, preparing the dataset is the significant step of pre-processing. A simple speech dataset made up off recordings of pronounced digits in ‘wav’ files at 8 kHz, where contains encompassing 1500 record which has been collected from speakers. The test set officially be composed of the 10% of the recordings and 90% of the training set as shown Fig. 11.
https://www.kaggle.com/divyanshu99/spoken-digit-dataset.
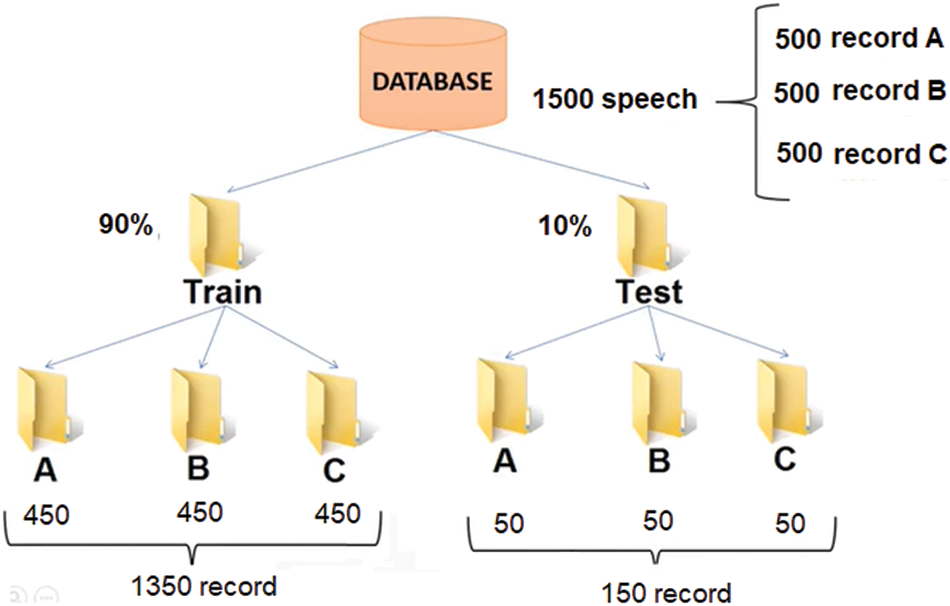
Figure 11: Dataset recording
Performance of the introduced system is comparatively analysed by considering the test error and validation error. Various methods such as spectrogram, mel-spectrogram, scalogram (morse), smoothed spectrogram, scalogram (morlet), scalogram (bump) and smoothed spectrogram + scalogram (bump) + mel-spectrogram are considered for analysis. The obtained results are tabulated in Tab. 3 and graphically presented in Fig. 12.
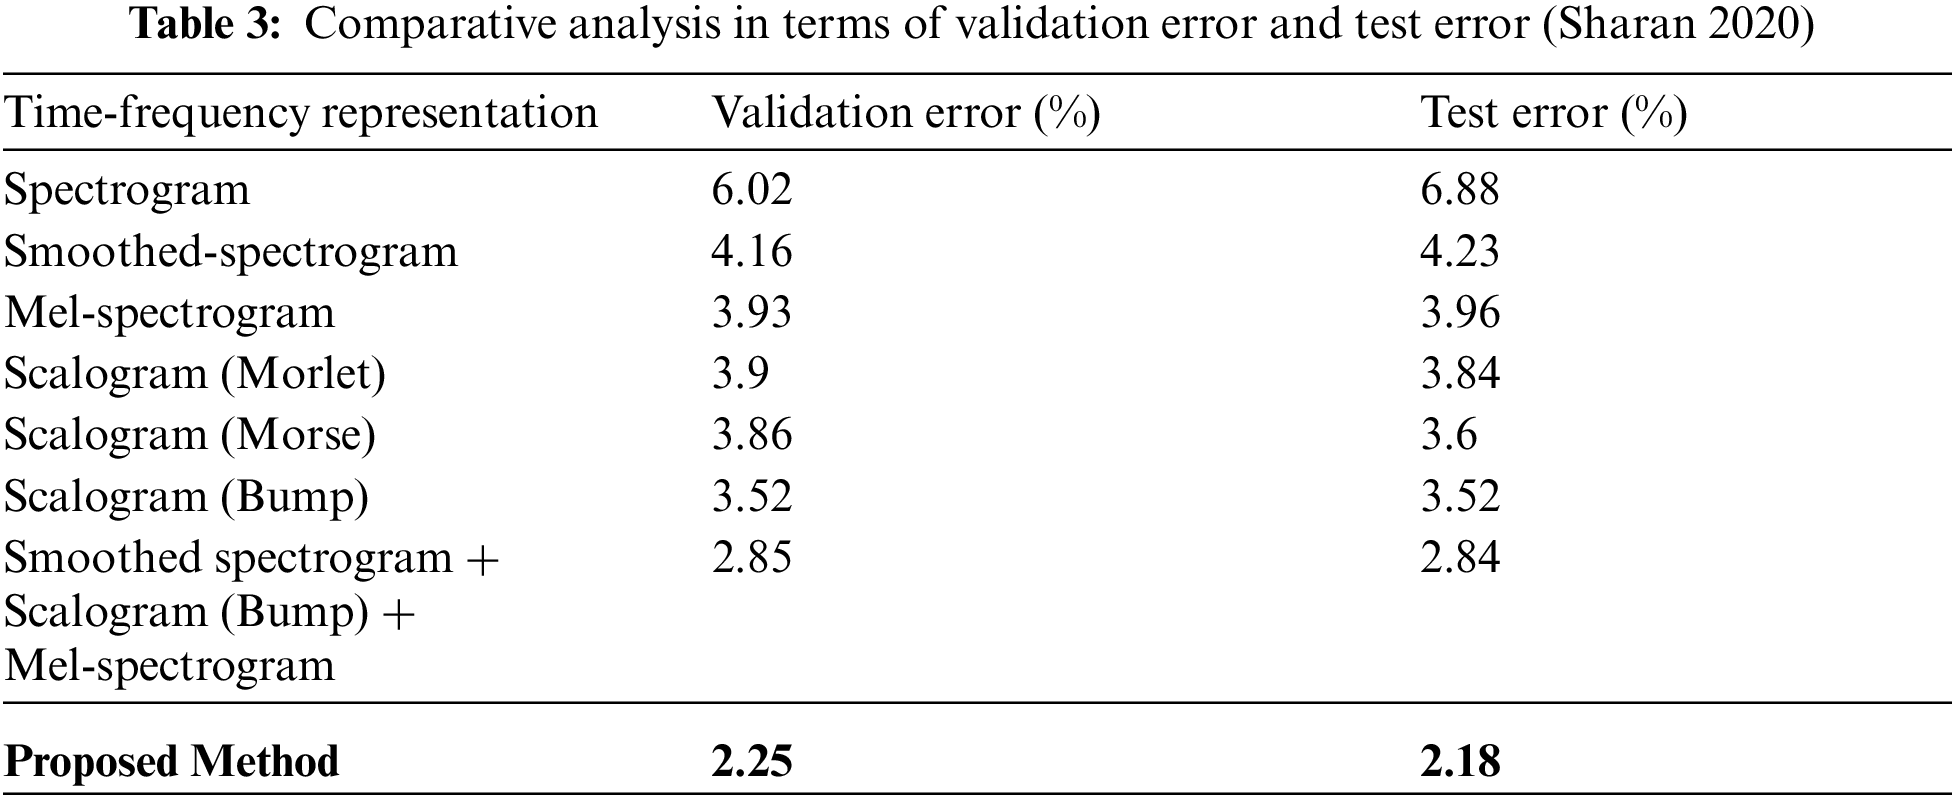
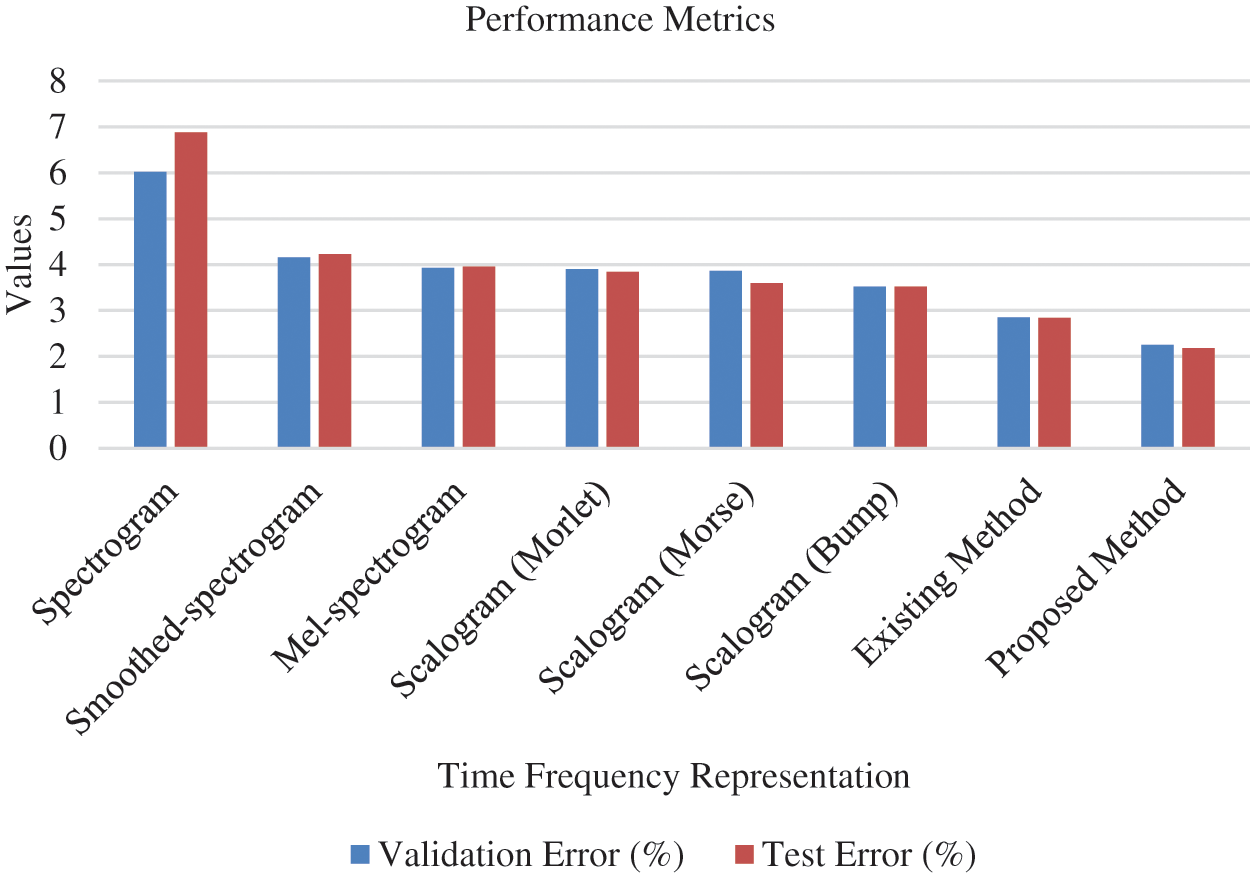
Figure 12: Analysis with respect to validation error and test error (Sharan 2020)
From the results, it is explored that the minimum validation has been shown by smoothed spectrogram+ scalogram (bump) + mel-spectrogram with 2.85% (Sharan 2020). However, the proposed method performed better than the considered traditional methods by exposing 2.25% as validation error. Similarly, the test error of the proposed work has been found to be minimum than conventional methodologies by showing 2.18%. As minimum error has been exhibited by introduced system it is effective than existing methods. In addition comparative analysis is carried out by analyzing the classification performance of traditional (MFCC-Deep CNN, Cepstral-VQ, MFCCLPC-SVM and MFCC-VQ) and introduced methods. Obtained outcomes have been exposed in Tab. 4 and Fig. 13.
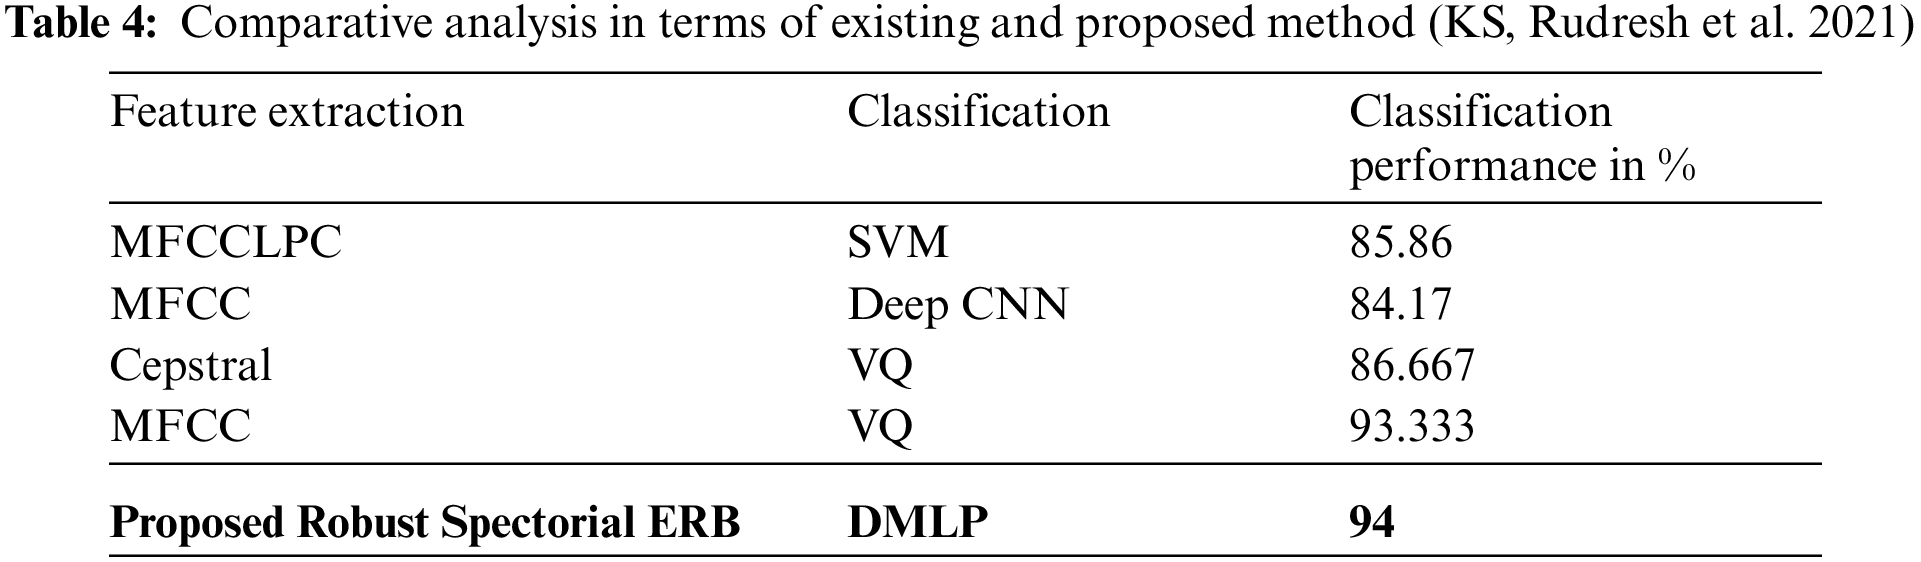
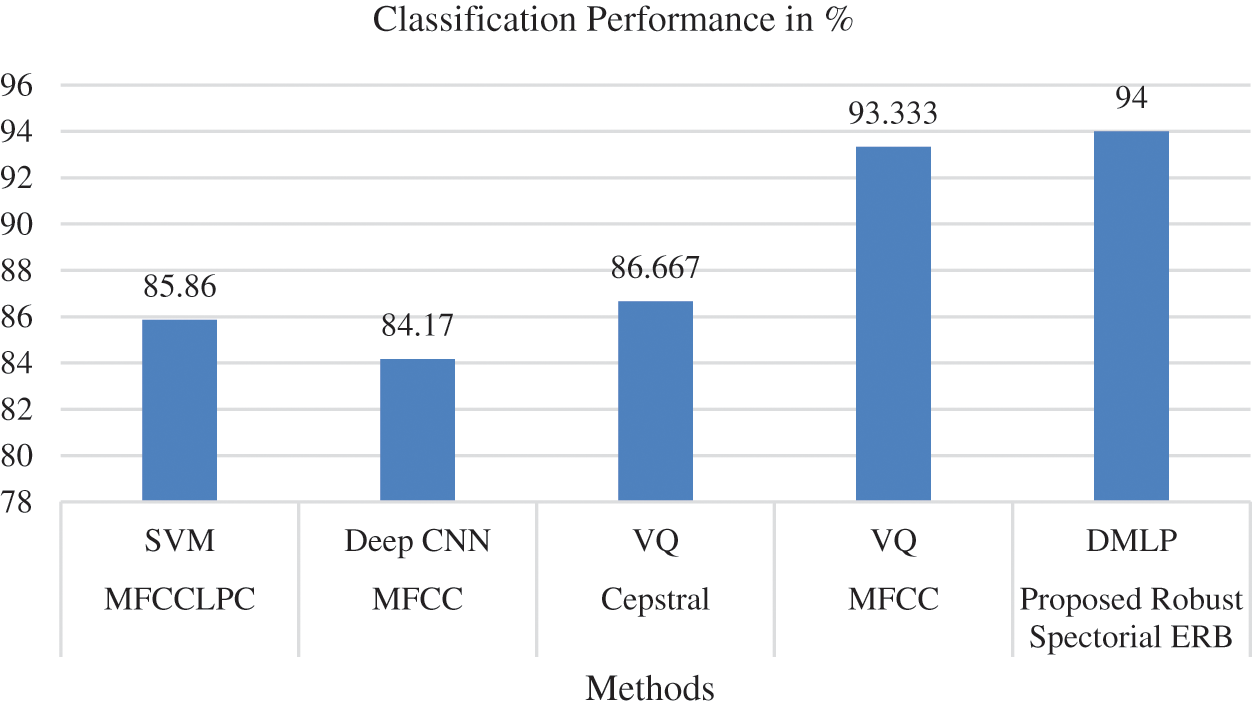
Figure 13: Analysis with respect to classification performance (KS, Rudresh et al. 2021)
From the analytical results, the classification performance of traditional MFCC-VQ showed better classification performance at a rate of 93.33%. But, the proposed work has shown superior performance than MFCC-VQ by showing 94% that proves its effectiveness in voice recognition. Thus, the minimum error rate and maximum classification accuracy of the introduced Robust Spectorial ERB-DMLP confirmed its effective performance. Efficient learning, relevant feature extraction and fast classification ability of the proposed system have made it explore effective performance which is an added advantage.
The study intended to introduce DL based methods for voice recognition as an authentication system to restrict the staffs of power plants from accessing other blocks except their corresponding blocks. This is needed to avoid any hazardous risks. Accordingly, time and frequency domain have been the significant aspects for speech processing. Combining this leads to an efficient voice recognition system. Thus, this study combined these two aspects by proposing EBR for relevant feature extraction. Feature mapping has been performed and the recognition accuracy has been improved through the proposed hybrid EBR-DMLP. The efficacy of the proposed system is confirmed through the results. An analysis has been carried out with respect to accuracy, precision, recall and f1-score. The outcomes revealed that the proposed system was able to afford high accuracy of 94% thereby minimizing errors and also recognises the voice faster. These results prove the efficiency of the introduced system and shows its high applicability as a personal authentication system for power plants. This study can further be improved in terms of accuracy by using other DL models. Comparative analysis was also undertaken with respect to validation error, test error and classification performance, the results proved the efficiency of the introduced system and shows its high applicability as a personal authentication system for power plants. This study can further be improved in terms of accuracy by using other DL models.
Funding Statement: The authors received no specific funding for this study.
Conflicts of Interest: The authors declare that they have no conflicts of interest to report regarding the present study.
1. M. Abou-Zleikha, Z. Tan, M. Christensen and S. Jensen, “A discriminative approach for speaker selection in speaker de-identification system,” in 2015 23rd European Signal Processing Conf. (EUSIPCO), London, pp. 2102–2106, 2015. [Google Scholar]
2. A. Levenda, I. Behrsin and F. Disano, “Renewable energy for whom? A globle systematic review of the enviromental justice implications of renewable energy technologies,” Energy Research & Social Science, vol. 71, no. 2, pp. 101837, 2021. [Google Scholar]
3. S. Asongu and N. Odhiambo, “Inquality, finance and renewable energy consumption in Sub-Saharan Africa,” Renewable Energy, vol. 165, no. 1, pp. 678–688, 2021. [Google Scholar]
4. S. Naderi, M. Banifateme, O. Pourali, A. Behbahaninia, I. MacGill et al., “Accurat capacity factor calculation of waste-to-energy power plants based on availability analysis and design/off-design performance,” Journal of Cleaner Production, vol. 275, no. 1, pp. 123167, 2020. [Google Scholar]
5. X. Fan and J. Hansen, “Speaker identificatioin with whispered speech based on modified LFCC parameters and feature mapping,” in 2009 IEEE Int. Conf. on Acoustics, Speech and Signal Processing, Taipei, Taiwan, pp. 4553–4556, 2009. [Google Scholar]
6. B. Wang, J. Zhao, X. Peng and B. Li, “A novel speaker clustering algorithm in speaker recognition system,” in 2006 Int. conf. on Machine Learning and Cybernetics, Dalian, IEEE, pp. 3298–3302, 2006. [Google Scholar]
7. B. Nagaraja and H. Jayanna, “Efficient window for monolingual and crosslingual speaker identification using MFCC,” in 2013 Int. Conf. on Advanced Computing and Communication Systems, Coimbator, IEEE, pp. 1–4, 2013. [Google Scholar]
8. F. Chowdhury, S. Selouani and D. O'Shaughnessy, “Distributed automatic text-independent speaker identification using GMM-UBM speaker models,” in 2009 Canadian Conf. on Electrical and Computer Engineering, IEEE, John's, NL, Canada, pp. 372–375, 2009. [Google Scholar]
9. E. Tazi and N. El Makhfi, “An hybrid front-end for robust speaker identification unde noisy conditions,” in 2017 Intelligent System Conf. (IntelliSys), London, pp. 764–768, 2017. [Google Scholar]
10. R. Martsyshyn, M. Medykovskyy, L. Sikora, Y. Miyushkovych, N. Lysa et al., “Technology of speaker recognition of multimodal interfaces automated systems under stress,” in 2013 12th Int. Conf. on the Experience of Designing and Application of CAD Systems in Microelectronics (CADSM), Lviv, pp. 447–448, 2013. [Google Scholar]
11. N. Jawarkar, R. Holambe and T. Basu, “Speaker identification using whispered,” in 2013 Int. Conf. on Communication System and Network Technologies, Gwalior, IEEE, pp. 778–781, 2013. [Google Scholar]
12. A. Maazouzi, N. Aqili, A. Aamoud, M. Raji and A. Hammouch, “MFCC and similarity measurements for speaker identification systems,” in 2017 Int. Conf. on Electrical and Information Technologies (ICEIT), Rabat, pp. 1–4, 2017. [Google Scholar]
13. Y. Chao, “Speaker identification using pairwise log-likelihood ratio measures,” in 2012 9th Int. Conf. on Fuzzy Systems and Knowledge Discovery, Chongqing, IEEE, pp. 1248–1251, 2012. [Google Scholar]
14. J. Peterson, M. Hany and R. Borrelli, “An overview of methodologies for cybersecurity vulnerability assesments conducted in nuclear power plants,” Nuclear Engineering and Desigh, vol. 346, pp. 75–84, 2019. [Google Scholar]
15. H. Gawand, A. Bhattacharjee and K. Roy, “Securing a cyber physical system in nuclear power plants using least square approximation and computational geometric approach,” Nuclear Engineering and Technology, vol. 49, no. 3, pp. 484–494, 2017. [Google Scholar]
16. H. Alsaadi, O. Ucan and O. Bayat, “An adapting soft computing model for intrusion detection system,” Comutational iIntrlligence Journal, vol. 30, no. 10, pp. 2201, 2021. [Google Scholar]
17. B. Peng, H. Xia, Y. Liu, B. Yang, D. Guo et al., “Research on intelligent fault diagnosis method for nuclear power plant based on correlation analysis and deep belief network,” Progres in Nuclear Energy, vol. 108, pp. 419–427, 2018. [Google Scholar]
18. S. Lee and J. Huh, “An effective security measures for nuclear power plant using big data analysis approach,” The Journal of Supercomputing, vol. 75, no. 8, pp. 4267–4294, 2019. [Google Scholar]
19. S. Dargan, M. Kumar, M. Ayyagari and G. Kumar, “A survey of deep learning and its applications: a new paradigm to machine learning,” Archives of Computational Methods in Engineering, pp. 1–22, CIMNE, Barcelona, 2019. [Google Scholar]
20. N. Kumar, K. Sudhakar, M. Samykano and V. Jayaseelan, “On the technologies empoering droes for intelligent monitoring of solar photovolatic power plants,” Procedia Computer Science, vol. 133, pp. 585–593, 2018. [Google Scholar]
21. H. Cho and T. Woo, “Cyber security in nuclear industry-analytic study from the terror incident in nuclear power plants (NPPs),” Annals of Nuclear Energy, vol. 99, no. 1, pp. 47–53, 2017. [Google Scholar]
22. R. Khalil, E. Jones, M. Babar, T. Jan, M. Zafar et al., “Speech emotion recognition using deep learning techniques: A review,” IEEE Access, vol. 7, no. 8, pp. 117327–117345, 2019. [Google Scholar]
23. T. Wheeler, M. Denman, R. Williams, N. Martin and Z. Jankovsky, “Nuclear power plant cyber security discrete dynamic event tree analysis (LDRD 17-0958) FY17 report,” Sandia National Lab. (SNL-NMNew Mexico, USA, 2017. [Online]. Available: http://www.osti.gov/bridge. [Google Scholar]
24. S. Hana and P. Seonga, “Development of a nuclear power plant safety and cyber security combined risk analysis method based on probabilistic safety assessment,” Screenm, vol. 9, no. 10, pp. 11, 2012. [Google Scholar]
25. H. Alsaadi, R. Almuttairi, O. Bayat and O. Ucan, “Computational intelligence algorithms to handle dimensionality reduction for enhancing intrusion detection system,” Journal of Information Scince and Engineering, vol. 36, pp. 293–308, 2020. [Google Scholar]
 | This work is licensed under a Creative Commons Attribution 4.0 International License, which permits unrestricted use, distribution, and reproduction in any medium, provided the original work is properly cited. |