DOI:10.32604/cmc.2022.024965
| Computers, Materials & Continua DOI:10.32604/cmc.2022.024965 | |
| Article |
Deep Learning Based Classification of Wrist Cracks from X-ray Imaging
1Department of Computer Science, National College of Business Administration & Economics Lahore, Multan, 60000, Pakistan
2Department of Computer Science, School of Systems and Technology, University of Management and Technology, Lahore, 54000, Pakistan
3Faculty of Computing and Informatics, University of Malaysia Sabah, Jalan UMS, Kota Kinabalu, 88400, Sabah, Malaysia
4Department of Computer Science, Federal Urdu University of Arts, Science and Technology, Islamabad, Pakistan
*Corresponding Author: Hassaan Malik. Email: f2019288004@umt.edu.pk
Received: 06 November 2021; Accepted: 30 December 2021
Abstract: Wrist cracks are the most common sort of cracks with an excessive occurrence rate. For the routine detection of wrist cracks, conventional radiography (X-ray medical imaging) is used but periodically issues are presented by crack depiction. Wrist cracks often appear in the human arbitrary bone due to accidental injuries such as slipping. Indeed, many hospitals lack experienced clinicians to diagnose wrist cracks. Therefore, an automated system is required to reduce the burden on clinicians and identify cracks. In this study, we have designed a novel residual network-based convolutional neural network (CNN) for the crack detection of the wrist. For the classification of wrist cracks medical imaging, the diagnostics accuracy of the RN-21CNN model is compared with four well-known transfer learning (TL) models such as Inception V3, Vgg16, ResNet-50, and Vgg19, to assist the medical imaging technologist in identifying the cracks that occur due to wrist fractures. The RN-21CNN model achieved an accuracy of 0.97 which is much better than its competitor`s approaches. The results reveal that implementing a correct generalization that a computer-aided recognition system precisely designed for the assistance of clinician would limit the number of incorrect diagnoses and also saves a lot of time.
Keywords: Wrist cracks; fracture; deep learning; X-rays; CNN
In emergency departments (ED), missed crack radiographs are one of the most common causes of diagnostic errors [1,2]. On radiographs, interpretation faults contributed by environmental aspects and humans, like clinician fatigue, weakness, interruption, less time, and poor review conditions. Computerized investigation of radiographs, which are predictable, would be costly to expand the working of radiologists and emergency clinicians. Recent developments in the area of computer vision, a deep learning approach called Convolutional Neural Network (CNN) have acquired a lot of grips. To overcome the diagnostic mistake, CNN learns selective features through pixel information of huge image datasets. Rapid advancements in the architectures of CNN have coupled with a statistical increment in hardware computational power to acquire the performance of human levels like image classification, handwriting recognition, and facial recognition [3,4]. Previous studies show that applying deep learning techniques has produced promising results for the analysis of images in the medical field such as tuberculosis classification on chest X-rays, mammographic mass classifications, diabetic retinopathy classification, and bone age assessment [5–8]. In crack detection, some of the previous studies have shown the viability of CNN on X-ray Images [9–11] acquired 83% accuracy for cracks diagnosis by using a network that is trained on a heterogeneous collection of the ankle, hand, and wrist. A model trained on 1389 lateral wrist X-rays was able to obtain 0.954 of an area under the curve (AUC) [10]. The actual region of the abnormality was not localized by these deep learning systems because entire X-ray images both cracks and non-cracks categories were based on binary classification. Due to such black-box models, it was not so easy for clinicians to assure wide classification labels, as it is not apparent that how the network gets to the results. Abnormality location information is important to support the results of classification by providing graphic proofs that are easily demonstrable by medical clinicians. The CNN object detection is an addition of image classification representation that not only classifies and identifies objects but can also confine the area of every object by illustrating a proper box around it [12]. As a result of treating cracks as an object, we hypothesized that CNN object detection [13–16] can be utilized to localize and identify cracks on wrist X-ray imaging.
The latest development in deep learning [17–19] has allowed the development of computer prototypes that can exactly solve many graphical assignments relating to object localization, classification, and recognition [20]. Deep learning has uncovered huge introductory potential at assignments inside clinical imaging, for example, anticipating the furthest point of diabetic retinopathy from retinal fundus images [21], categorizing skin wounds [22], and examining histopathology [23,24]. Deep learning prototypes are different from the technology used by primary CAR systems in that they do not depend on pre-defined illustrations of low-level visual structures within images. Sub-specialized professionals can educate models to carefully identify cracks by classifying them in massive radiographs datasets because models usually learn by examples. This is an extraordinary methodology, fixated on improving the analytic abilities of clinicians and radiologists relatively changing them by the usage of an algorithm. With an adequate supply of skillfully labeled instances, a suitably designed model can learn to match the findings of those skilled clinicians who provided the labels.
In the past, Computer-Aided Recognition (CAR) in radiology was not so successful to attain improvements in diagnostic correctness, decreasing clinician sensitivity and leading to needless additional diagnostic tests. With the arrival of deep-learning approaches to CAR, there is an immense enthusiasm about its applications to medicine; however, there is slight evidence representing enhanced diagnostic accuracy in clinically-relevant applications. For this study, we designed a residual network-based 21-layers of convolution neural network (RN-21CNN), trained on a high-quality labels wrist fracture dataset that could generate an automated cracks recognition, proficient in rivaling diagnostic acumen of a squad of professional orthopedic specialists. Most of the previous research studies [20–24] believe that residual network is the significant choice for classifying and indexing the image feature characteristics of the small region wrist cracks. Some limitations with the residual network are also observed. When the model gets deeper, it becomes more and more difficult for the layers to propagate the information from shallow layers due to which the information is lost. Therefore, to overcome this issue, the residual network is combined with a 21-layer of CNN model. The designed classifier assists the less skilled emergency clinicians, their crack recognition specificity and sensitivity can be meaningfully improved. We also reveal that ability to accurately observe cracks significantly improves when emergency medicine clinicians are provided with the support of a trained model.
In summary, the major contribution of this study is stated below:
1. The RN-21CNN model is applied to accurately classify the crack regions in an X-ray image to relieve clinicians’ burden.
2. The model can extract the features for bone crack identification. As we demonstrate in the experiment, our model can better reflect the crack line.
3. The RN-21CNN model has achieved the highest classification accuracy of 97.0% as compared to the four well-renowned pre-trained classifiers and state-of-the-art classifiers in terms of accuracy, specificity, sensitivity, and f1-score.
This manuscript is structured as follows. State-of-the-art is discussed in Section 2. In Section 3, the context of materials and methods is presented. Section 4 consists of extensive experimental results and their discussions. The conclusion and future work of this study is described in Section 5.
Continuous developments in deep learning (DL) research have resulted in the creation of automated versions that can accurately resolve a variety of observable tasks, such as recipient recognition, limitation, and clustering. Inside clinical imaging, DL has demonstrated tremendous achievements, such as foreseeing the seriousness of diabetic retinopathy from retinal fundus images, ordering skin sores, and dissecting histopathology. DL taking in models varies from the innovation utilized by early CAR frameworks in that they do not depend on predefined portrayals of low-level visual highlights inside images. Alternatively, they can figure out how to find task-explicit visual highlights that help precise clinical translations. This is a unique strategy, as it focuses on increasing physicians’ and radiologists’ suggestive abilities rather than relying on a computation to replace them. The model had a sensitivity of 93.9% and a specificity of 94.5% [25]. This information lends itself impeccably to Machine Learning (ML). In the field of general imaging and computer vision, DL is the leading AI instrument. Deep knowledge alludes to procedures that expand on improvements in counterfeit neural organizations in which numerous organization layers are added to build the levels of reflection and execution. The sensitivity and specificity of the model were 0.88 and 0.90, accordingly [26].
DL calculations have indicated pivotal execution in an assortment of advanced undertakings, particularly those identified with images. They have frequently coordinated or surpassed human implementation. Since radiology’s clinical field generally depends on separating valuable data from photographs, it is a very familiar product territory for DL, and exploration here has quickly filled in later a long time. The model presented by [27] used for the detection of wrist crack has achieved the accuracy of 91.2% sensitivity was 95.7%, specificity was 82.5%, and AUC was 0.918. Convolutional neural networks “learn,” separating highlights from the pixel data of massive images datasets to fit the diagnostic issue. Consistent enhancements of Convolutional neural networks structures combined with a mathematical increment in equipment computational force have empowered deep learning convolutional neural networks to accomplish human-level execution in lay assignments, such as facial acknowledgment and penmanship acknowledgment, and characteristic world images characterization. The sensitivity, specificity, and AUC for each image were 95.7 percent, 82.5 percent, and 0.918 percent, respectively [28]. Wrist cracks are the most ordinary sort of breaks found in crisis divisions; they are assessed to be 18% of the damages found in grown-ups and 25% of cracks found in youngsters. They are usually distinguished in EDs by specialists analyzing horizontal and posterior-anterior radiographs [29]. In this exploration, we will take a deep examination of the wrist break. Crack alludes to the total or inadequate loss of bone, alveolar plate, or joint surface, frequently joined by harm to delicate tissues or organs around the bone. The break of the lower arm happens when in any event, one of the two significant bones of the territory between the elbow and the wrist-sweep also, ulna–is broken, and regularly it goes with separation. It is led the way about by further double-edged power in drop-down issues when the victim puts one’s hand on the floor with unequal position or the rapid competency by a car crash or injury. The backhanded force causes an angled or twisting crack, and the instantaneous power causes a horizontal break of the spiral and ulna [30].
A deep learning strategy is designed and applied to the crack location in arm bone X-rays. The fundamental upgrades incorporate three perspectives. Initially, another spine network is set up dependent on the highlight pyramid design to acquire fractal data. Second, an image preprocessing method, including opening activity and pixel esteem change, is created to improve unique images’ differentiation. Third, the open field change containing anchor scale decreases, and small ROIs development is abused to discover more breaks [31]. Radiologists decipher X-beam tests by outwardly assessing them to observe the occurrence of breaks in different bones. Understanding radiographs is a tedious and exceptional cycle, including manual assessment of gaps. Likewise, clinicians’ lack in restoratively under-resourced zones, inaccessibility of master radiologists in occupied clinical properties, or weariness caused because of requesting outstanding tasks at hand could prompt bogus discovery rate what is more, helpless recuperation of the breaks. An exhaustive report is granted here covering crack finding to help agents create models that naturally recognize breaks in human bones [32]. The bone is a significant part of the human body. Bone gives the capacity to move the body. Bone cracks are expected in the human body. The specialists utilize the X-beam images to analyze the broken bone. The manual break location strategy is tedious, and the blunder likelihood chance is high. The human body comprises numerous kinds of bone. Bone cracks are mainly caused by a car accident or a horrifying drop. The bone-breaking danger is high in mature individuals due to the more fragile bone. The broken bone mends by giving appropriate treatment to the patient. The specialist utilizes x-beam or magnetic resource imaging (MRI) images to analyze the cracked bone. The little break in the bone becomes hard to investigate by the specialist. The manual cycle for determining the broken bone is tedious, and the mistake likelihood is likewise high. Consequently, it is necessary to build up a PC-based framework to lessen the time and the possibility of broken bone finds. In [33], a deep CNN architecture with the extension of the common U-Net was designed for the task of detecting and localizing wrist fractures. The model achieved significant results such as AUC of 0.967, 93.9% sensitivity, and 94.5% specificity. Bone break discovery and order have been broadly discussed, and numerous analysts have proposed various strategies to handle this issue. Despite this, a general methodology ready to order all the cracks in the human body has not yet been characterized. We expect to break down and assess a choice of papers, picked by their delegate approach, where the creators applied diverse, deep learning methods to arrange bone breaks, all together to choose the qualities of every one of them and attempt to depict a summed up methodology. The innovation used for the first conclusion is generally X-beam, which is a methodology that has been utilized for more than 100 years and is still much of the time used. It is trying for specialists to assess X-beam images: initially, X-beam could shroud specific bone; also, a ton of involvement is expected to effectively characterize various kinds of breaks; thirdly, specialists frequently have to act in crisis circumstances and might be compelled by weakness [34].
This section contains the methodology of this study.
The dataset Hassaan et al. [35] has been used to evaluate and train the RN-21CNN model. The dataset was created on an X-ray Medical Imaging from patients of different ages varies from 18 to 35 years, at Al-Huda Digital X-ray Lab, Multan, Pakistan. The dataset contains a total of 193 X-ray images including 111 fracture images and the rest are normal. The dataset is manually annotated by orthopedics who have more than 10 years of experience. The sample wrist cracks X-ray images are shown in Fig. 1.

Figure 1: Graphic sample of a male’s wrist radiograph (a) crack wrist, and (b) normal
Images that are collected as samples are of various sizes. So, images were re-scale to 150 × 150 resolutions. For a better training process, data normalization was performed. As a result, the dataset is set to be fixed size of resolution and feed to the residual network-based CNN model for the training process. To avoid overfitting, we expand the size of a dataset at the time of training by applying various types of data augmentation techniques such as lateral and posterior flip, rotation, zoom and width, and height shift. After applying data augmentation techniques, a total of 1544 wrist cracks X-ray images (including 888 fracture images and 656 images are normal) are used for training, validation and testing the model. The graphical representation of the augmented sample images is shown in Fig. 2.

Figure 2: Sample images after applying data augmentation; (a) original; (b) lateral flip; (c) posterior flip; (d) rotation; (e) zoom; (f) width shift
Initially, the concept of classification of wrist cracks medical imaging task under consideration to manage the appropriate design and development of the RN-21CNN model. Normally, the features used in X-rays imaging include shape, texture, spatial relationship, and target color. The basic difference in wrist crack type is wrist texture feature, so, normally researchers select features that are local to describe images. Though texture is a simple and instinctive graphical concept and a lot of research studies have not shown the common definition of the textures available [36,37]. We have designed the architecture of the RN-21CNN model shown in Fig. 3. The RN-21CNN model has been built on a network called a residual network. In mathematical statistics, the residual network contains the variation between predicted and real values. By presenting the residual thought to eliminate the identical portion, therefore underline the slight variations, let our model emphasize learning these small replacements. Researchers have revealed that this technique [38–40] resolves the issue that fitting effects become poor as neural network layers increases. Hence convoluted by a series of 21-layers and after pre-processing the network’s input is adjusted to a 150 × 150 image block. Then in the Convolutional layer, we choose a filter size of 1 × 1 and 3 × 3. We now use a convolution portion smaller than 5 × 5 and 7 × 7 and the rectified linear unit (ReLU) function to achieve more non-linear activation. By this means, we easily can make sure that every neuron is minor sufficiently trained to the input’s accessible field to record local texture features related to preferred output. Though the earlier Convolutional network performance as well, in this situation the whole network could not get exact output. Due to its small size and excessive dimensionality reduction, several of the data that is intensely associated with the objective is straightforwardly ignored by earlier Convolutional networks. As a result, we have given a residual network-based CNN model to ensure that the native network’s objective is maintained and that the image’s size aim is decreased.

Figure 3: RN-21CNN architecture for the classification of patient’s wrist crack
Standards of increasing the convolution are presented in Fig. 4. As a result, increasing the convolution supports increases the receptive area of the Convolutional section, which prevents considerable damage to the feature map’s resolution. After each convolution layer, a batch normalization layer is added to ensure that non-linear input value modification occurs in the sensitive input area, avoiding the issues of gradient vanishing caused by increasing training and architectural complexity. The result of the preceding convolution layer is followed by the global average pooling layer, which calculates the average of all feature maps. The number of feature maps in the resultant layer is equal to the number of feature maps in the preceding layer, and it can include two entirely associated layers. There are 2 nodes, the first layer contains 128 nodes and the second node is known as the classification layer. Before the global pooling layer, we have appended a dropout layer to avoid overfitting the model with a parameter adjusted to 0.5. When the training process is modified and unavoidable units rely on detailed inputs, it randomly ends half of the neurons [38].

Figure 4: Three various dilated rates separate setting corresponding to (a) 3 × 3 dilated rate of 1 with convolution kernel, it is same as standard convolution operation, (b) 5× 5 convolution kernel with a dilated rate of 2, and (c) 3 × 3 dilated rate of 4 with convolution kernel, the accessible field is corresponding to a 9 × 9 standard convolution kernel
For the learning and understanding of a very complex and non-linear task, the activation task plays a vital role in the model of a neural network. As we know, the activation function presents the non-linear features to neurons, permitting the neural network to randomly estimate any non-linear function and can meaningfully influence the rate of convergence by selecting the activation function. The use of ReLU was demonstrated to reduce computational costs in comparison with the classical sigmoid alternatives and to prevent gradient vanishing [39–41]. Thus, reducing the over-fitting issue, the result caused by the ReLU of several neurons to be zero is mostly remarkable, which increases system sparsity and decreases the interdependence of the parameter. In this research study, for the activation of each of the convolutional layers, we have used the ReLU function. The first dense layer is used to activate the standard ReLU for the completely connected network layer, and a sigmoid is used to squeeze the 2D result into a probability distribution of classification.
3.4 Training Process of RN-21CNN Method
To reduce the cross-entropy loss purpose, we have applied Adam Optimizer [42] in this research study. Adam optimizer process is an addition of stochastic gradient descent process that repeatedly upgrades the weights of neural network dependent on training statistics. Unlike the conventional stochastic gradient descent (SGD) process, Adam Optimizer plans an autonomous adjustable rate of learning for various factors by computing the first sequence moment estimates and second sequence moment estimates of the gradient. The loss function value of cross-entropy represents the gap between the real outcome and the predictable outcome and the immensity of the worth straight reflects the proximity of their possible distribution. After relevant experimental tests, we have set the parameter as the default value to use the Adam optimizer parameter settings. In the initial stage of the model, for performing the patient’s wrist crack classification task, In the Wrist X-ray data set, we transfer pre-trained weight parameters to the existing neural network model. In addition, we have carried out the weight update with slight batch data, and the batch size is set to 64. On verification set, while model accuracy no longer increases, the rate of learning is decreased by 10 times and when the performance of the model is not shown in 20 epoch, the rate of learning will be decreased.
The main framework of this research study is presented in Fig. 5. and consists of three major steps: preprocessing, feature engineering, and transfer learning model [43–45]. Firstly, the authors have applied the preprocessing procedures and recognized the ROI, then fragmented the dataset into three sets by a ratio of 70%, 10%, and 20% for the training, validation, and testing, respectively. After this, we have applied the data augmentation techniques that have been discussed earlier in the data preprocessing section. The main objective behind the expansion of the dataset was avoiding the model from over-fitting [46–49]. All of the transfer learning classifiers weights were pre-trained on near about 1.3 M natural photographs of 1000 objects classes from the ILSVR database [12]. We also transformed the last classification layer of every pre-trained model of CNN with an individual neuron of sigmoid function [50] that outcomes the estimated probability that an applied input image is normal or fractured. We have also set the size of wrist radiographs to 224 × 224 for VGG-16 and VGG-19 and 299 × 299 for Inception V3 and ResNet-50 on every input to make it suitable and feed them to every single pre-trained model of CNN. The input image size of the RN-21CNN model is 150 × 150 resolutions. The layers of the RN-21CNN models utilized by feature classifiers take its direct preceding layer’s output as data, and its output layer is associated as a contribution to the succeeding layers. The feature selectors classifier comprises conv2 × 2, 64; conv2 × 2, 128; conv3 × 3, 256, conv3 × 3, 512, 2 × 2 size of the max-pooling layer, and a softmax activator among them. The convolution layer’s final output and max-pooling methodologies are associated into 2-D planes called feature maps. From all these models, when extracting the feature vector, the top convolutional blocks weight is frozen and the output containing the result of the final convolutional block is associated with the new features vector classifier. The feature classifier has positioned at the last layer of the model and it is only an Artificial Neural Network (ANN) utilized by dense layer [47–50].

Figure 5: Framework for the classification of wrist cracks
To attain the computations procedure like other classifiers, this feature classifier needs a single vector. Therefore, the feature vectors classifier’s resultant value is changed into a 1-D feature and this method is called “flattening”. Moreover, the convolution method’s final output layer is flattened to develop a single extended vector for the last dense layer to make use of in its concluding classification due to sigmoid operations. Additionally, between the dense layers and activation process, the softmax classifier is placed and was used to address the classification issues. By using binary cross-entropy loss, the loss function was calculated. To identify the optimal hyperparameters like learning rate, batch size, etc., we have also applied a grid search. Based on the initial learning rate (like 0.05 and 0.1 for models with random selections), all of the layers of the pre-trained model were fine-tuned by using a “stochastic gradient descent” (SGD) optimizer with the momentum of 0.9. The learning rate was reduced by a factor of 0.1 after twenty epochs. To avoid overfitting, early stopping of epochs was performed with the maximum execution of 500 epochs. For the RN-21CNN model, we have used a batch size of 64.
The evaluation of the viability of the transfer learning models was completed on the independent testing data in the K cross-validation fold (K = 5). We concisely evaluated and noticed the performance of the models on the testing set by calculating their sensitivity (also known as recall), accuracy (Acc), ROC, specificity (SP), and recall (R). Eqs. (1)–(4) given below represents accuracy, sensitivity, f1-score, and specificity values:
To calculate the performance of a binary classifier, the confusion matrix (CM) is applied on the set of wrist radiographs test data for which the true or correct values are known. True Positive (TP) and False Positive (FP) represent the value of classified images correctly and incorrectly respectively. In the same way, True Negative (TN) and False Negative (FN) contains the value of correct and incorrect examples of images. The Curve of AU (ROC) was also calculated.
In this section, we have discussed the details about the implementation of the method, the selected evaluation approach, and the experimental outcomes of the present study.
CNN-based pre-trained models’ evaluation on wrist crack database depends on trained validation test wrist crack. We trained the RN-21CNN model for the study on the training set of the dataset, to observe the diagnostics performance of the model, hyper-parameters are fine-tuned, on the validation part of a dataset, and after that test, the set is implemented for the evaluation of classification accuracy. To calculate the four metrics, for example, sensitivity, specificity, accuracy, and f1-score, the confusion matrix technique is applied. The RN-21CNN model’s AUC is also strategized to notify the effect of the model by comparing it with four famous architectures, particularly utilized for a finding of disease from clinical imaging The DL algorithms used in this experiment, including the RN-21CNN method, are implemented using the Keras structure, and the techniques that do not involve convolutional networks are coded in Python. Each experiment on a workstation has been conducted with 16GB GPU NVIDIA Ge-force GTX 1080Ti and 32 GB RAM on Microsoft Windows 10 Operating system.
To enhance our understanding of its performance, now the RN-21CNN model is visualized. Fig. 6. shows the partial filter outcome feature maps visualizations of the 1st convolutional layer of the RN-21CNN model. It will be noticed that the Convolutional layer has the capability for edge detection and their various belongings acquire the fundamental edge modes. Additionally, a feature map partial output of the max-pooling layer in the visualization network is shown in the Convolutional layer visualization (Fig. 5). After that, visual results of partial result feature maps of an added layer of primary bottleneck design and the final bottleneck design will be shown.

Figure 6: Partial visualization outcomes of the RN-21CNN method: (a) the conv layer, (b) the max-pooling layer, (c) the added layer of the first bottleneck design module, (d) the last adding layer
The evaluation methods for wrist X-ray image classification are based on a trained validation test system. On the training dataset, we trained our model by fine-tuning the hyperparameters for evaluating the RN-21CNN model, and then we applied the test set to the model. Based on the confusion matrix, we have used five metrics to evaluate the model’s performance in binary tasks: precision, f1-score, recall, and the accurate calculation of overall classification. Fig. 7. shows the training loss and accuracy validation of the RN-21CNN model to epochs. The 500 epochs were executed for the CNN model. The maximum obtained accuracy for training was 0.99, and that for validation was 0.95.

Figure 7: Training loss and accuracy validation of RN-21CNN model
For the correct classification of wrist cracks vs. normal wrist, these values indicate that our model learning rate is sound. The training loss was 0.021, and the validation loss was 0.026. The different performance metrics were measured for the effectual diagnosis of wrist cracks for the evaluation of the model. The confusion matrix of the RN-21CNN classifier and four pre-trained models are shown in Figs. 8 and 9., respectively. There were 77 normal wrists and 77 wrist cracks images in the test set. Actual cases are set along rows and the predicted ones are set along with columns in the confusion matrix.

Figure 8: Confusion matrix of our RN-21CNN model

Figure 9: Transfer learning methods of Confusion Matrix
For Vgg16, among 77 wrist crack cases, the detection rate of the model is 67 cases and misclassified 10 of the cases as normal. The exact class label of the model’s prediction of all normal cases for Vgg19, the detection rate of model is 72 cases and misclassified 5 of the cases as normal among 77 wrist crack cases. The exact class label predicated by ResNet is of 69 wrist crack cases and misclassified 8 of the cases as normal. The prediction rate of Inception V3 is 65 wrist crack cases and misclassified 12 cases as normal. For the RN-21CNN model, among 77 wrist crack cases, the model detected all of the 77 cases and misclassified 0 cases as normal. The evaluation matrices accuracy, recall, precision, and F1 score of classifiers for each class (normal wrist vs. wrist cracks) are presented in Tab. 1, and the visual representation is shown in Fig. 10. The Vgg-16 score on accuracy is 86%, the precision rate is 84.2%, the sensitivity rate is 89.4%, and the achieved F1 score is 86.7%. The Vgg-19 score for accuracy is 76%, the precision rate is 73%, the sensitivity rate is 89.4% and the F1 score is 75%. The accuracy rate achieve by ResNet 50 is 81%, the precision rate is 78%, the sensitivity rate is 84% and the F1 score is 80%. The Inception V3 accuracy score is 65%, the precision rate is 63%, the sensitivity rate is 68% and the F1 score is 64%. And ultimately RN-21CNN model achieved an accuracy rate of 97%, precision rate of 95%, sensitivity is 100%, and 97% F1-Score.
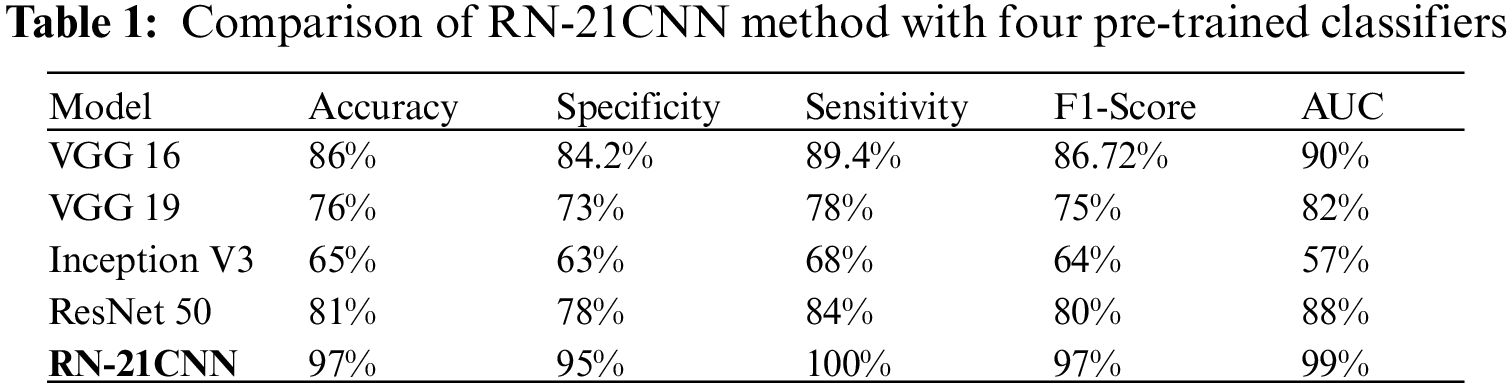

Figure 10: The output of RN-21CNN model, vgg16, vgg19, resnet50, and inception in terms of evaluation matrices
The classification of the sample images by the proposed system as fractured or normal images is shown in Fig. 11.

Figure 11: Test data predictions of a normal and fractured wrist
4.4 Comparison with State of the Art
Tab. 2 shows the comparison of our proposed model with different state-of-the-art classifiers in terms of many parameters such as accuracy, sensitivity, specificity, F1-score, and AUC as demonstrated our proposed model achieved significant results as compared to the prior state of the art.

The above experimental works illustrate that the RN-21CNN model is expressively trained on wrist cracks texture feature, and our model recognizes the region of crack accurately. Our method has quality medical diagnostics accuracy in the area of radiographs in the comparison to classification performance of other CNN models, having an accuracy of 97%. The results of the RN-21CNN have been duly verified by the orthopedic of Al-Huda digital X-ray laboratory. We have also discussed here the effectiveness of CNN-based pre-trained models in detecting normal and wrist cracks using X-ray imaging. Pre-trained models like VGG 16, VGG 19, Inception V3 and ResNet 50 were trained on a moderate-sized dataset with an image resolution of 224 × 224 for VGG 16 and VGG 19, and for Inception V3 and ResNet 50, the image resolution is set to 299 × 299 pixels. A cross-entropy loss function was used to train all four well-known pre-trained models, as well as the RN-21CNN model for classifying wrist cracks X-ray imaging in this study. In Tab. 1, the comparative screening performances of all pre-trained models tested are presented. It is examined that the fine-tuning of the VGG 16 model with pre-trained weights achieved the notable performance, with the highest AUC of 90%, specificity of 84.2%, sensitivity of 89.4%, and accuracy of 86%. The performances of the other contenders’ methodology of transfer learning procedures with pre-trained loads were marginally degraded. The VGG 19 model score a high AUC of 82% (specificity of 73%, sensitivity of 78%, and accuracy of 76%) as compared to Inception V3 and ResNet 50. The lowest performance was produced by the Inception V3 model with an AUC of 57%, specificity of 63%, the sensitivity of 68%, and accuracy of 65%. Additionally, as compared to other transfer learning classifiers, the RN-21CNN model has produced the finest classification accuracy of 97%. Generally, the overall binary problems of classification did not influence by the selection of pre-trained (CNN) architecture. When the number of CNN layers increases for the specific binary diagnostics dilemma, these networks did not perform significantly. This research study contains 193 X-ray Images for training, collected from the “Wrist X-ray” dataset [35]. Additionally, these X-ray Images were expanded for more training and variability purpose. These medical images were generated randomly via pixel and spatial level image transformations like rotation and scale shifting of the X-ray Images. The pre-trained model’s common denunciation in the workflow of medical imaging is that they often have to face problems in classification because of huge target domain divergence. In this dataset, annotated by the radiologists, all medical images were labeled manually. By fine-tuning the model using a small set of marked radiographs datasets, we observed that severe effects of domain deviation can be alleviated when moving data from a source domain to a target domain. Leading towards the model’s faster training and performance, this CNN is based on a pre-trained process that attains the mutual patterns of both domains. The diagnostic accuracy of our designed model, according to output generated by CNN is 97%, the f1-score is 97%, and the AUC of 99%. The RN-21CNN model has performed substantially in the classification process of wrist cracks as compared with other CNN-based pre-trained models. We have provided the comprehensive illumination that why prior arts show unsatisfactory diagnostics performance, the outputs generated by the different classifiers presented in Figs. 8. and 9., and in conjunction with the investigation of the nature of wrist crack medical imaging classification task. Initially, the four familiar radiographs classifiers comprise deep networks and final convolutional layers have reduced the feature map of spatial resolution which limits the model’s classification accuracy. Furthermore, the parameters used to fine-tune the algorithms have an impact on the model’s diagnostics performance, such as the choice of an appropriate activation function, loss function, learning rate, data augmentation measures, and other required hyperparameters settings. Through the analysis of experimental outputs, it is shown that the RN-21CNN model of classifying wrist cracks medical imaging has added significant output in the assistance of diagnostics medical images. The RN-21CNN model is more capable for the findings of the patterns of irregularities and extracting the discriminative sequences in classifying wrist cracks from medical imaging samples that achieved the highest accuracy output of 97%. The analysis demonstrates that the RN-21CNN model has added significant outcomes in assisting the medical clinicians in identifying wrist cracks and also comparing them with the previous studies. The output (see Tab. 2) achieved by [4,7,25] for the classification of wrist cracks is 91% (CNN), 50% (CNN), and 93% (CNN) respectively. Our method is more capable as compared to the state-of-the-art classifiers in classifying wrist cracks and achieved an accuracy of 97%. The results produced by the
In this study, we have presented an automated diagnostic tool to classify Wrist radiographs into regular and fractured. Orderly to understand the wrist tissues actual texture features, network architecture is designed by us with residual structures. This network has 21 Convolutional layers, which are followed by two dense layers and ReLU activation. The training process performed by Adam optimizer and dilated convolutions is used to minimize the cross-entropy loss function. While keeping up the depth of the model, the RN-21CNN model strategy is capable to evade the deficiency of highlight space information caused accordingly. Additionally, to break the issue of lacking information and to accelerate neural network training, we have utilized transfer learning. The wrist cracks database of radiographs, our method elaborates classification presentation higher to preceding art. We will continue to apply our approach and strategy to medical imaging analysis based on MRI and computed tomography (CT) in future research to improve our approach and strategy. Simultaneously, the technique can furthermore be appraised for the extension to those areas that are economically underdeveloped to support the growth of telemedicine training and to enhance the local medical imaging diagnosis level.
Funding Statement: The authors received no specific funding for this study.
Conflicts of Interest: The authors declare that they have no conflicts of interest to report regarding the present study.
1. B. Petinaux, R. Bhat, K. Boniface and J. Aristizabal, “Accuracy of radiographic readings in the emergency department,” The American Journal of Emergency Medicine, vol. 29, no. 1, pp. 18–25, 2011. [Google Scholar]
2. I. J. Goodfellow, Y. Bulatov, J. Ibarz, S. Arnoud and V. Shet, “Multi-digit number recognition from street view imagery using deep convolutional neural networks,” arXiv preprint arXiv:1312.6082, 2013. [Google Scholar]
3. K. He, X. Zhang, S. Ren and J. Sun, “Deep residual learning for image recognition,” in Proc. of the IEEE Conf. on Computer Vision and Pattern Recognition, Las Vegas, NV, USA, pp. 770–778, 2016. [Google Scholar]
4. L. Faes, K. W. Siegfried, J. F. Dun, L. Xiaoxuan, K. Edward et al., “Automated deep learning design for medical image classification by health-care professionals with no coding experience: A feasibility study,” The Lancet Digital Health, vol. 1, no. 5, pp. 232–242, 2019. [Google Scholar]
5. P. Lakhani and B. Sundaram, “Deep learning at chest radiography: Automated classification of pulmonary tuberculosis by using convolutional neural networks,” Radiology, vol. 284, no. 2, pp. 574–582, 2017. [Google Scholar]
6. V. Gulshan, P. Lily, C. Marc, C. S. Martin, W. Derek et al., “Development and validation of a deep learning algorithm for detection of diabetic retinopathy in retinal fundus photographs.” Jama, vol. 316, no. 22, pp. 2402–2410, 2016. [Google Scholar]
7. D. B. Larson, M. C. Chen, M. P. Lungren, S. S. Halabi, N. V. Stence et al., “Performance of a deep-learning neural network model in assessing skeletal maturity on pediatric hand radiographs,” Radiology, vol. 287, no. 1, pp. 313–322, 2018. [Google Scholar]
8. J. Olczak, F. Niklas, M. Atsuto, S. R. Ali, J. Anthony et al., “Artificial intelligence for analyzing orthopedic trauma radiographs: Deep learning algorithms—Are they on par with humans for diagnosing fractures?,” Acta Orthopaedica, vol. 88, no. 6, pp. 581–586, 2017. [Google Scholar]
9. D. Kim and T. MacKinnon, “Artificial intelligence in fracture detection: Transfer learning from deep convolutional neural networks,” Clinical Radiology, vol. 73, no. 5, pp. 439–445, 2018. [Google Scholar]
10. S. W. Chung, S. H. Seung, W. L. Ji, O. Kyung-Soo, R. K. Na et al., “Automated detection and classification of the proximal humerus fracture by using deep learning algorithm,” Acta Orthopaedica, vol. 89, no. 4, pp. 468–473, 2018. [Google Scholar]
11. O. Batchelor and R. Green, “The role of focus in object instance recognition,” in 2016 IEEE Int. Conf. on Image and Vision Computing New Zealand (IVCNZ), Palmerston North, New Zealand, pp. 1–5, 2016. [Google Scholar]
12. J. S. Whang, S. R. Baker, R. Patel, L. Luk and A. Castro III, “The causes of medical malpractice suits against radiologists in the United States,” Radiology, vol. 266, no. 2, pp. 548–554, 2013. [Google Scholar]
13. S. M. Williams, D. J. Connelly, S. Wadsworth and D. J. Wilson, “Radiological review of accident and emergency radiographs: A 1-year audit,” Clinical Radiology, vol. 55, no. 11, pp. 861–865, 2000. [Google Scholar]
14. W. R. Leeper, T. J. Leeper, K. N. Vogt, T. Charyk-Stewart, D. K. Gray et al., “The role of trauma team leaders in missed injuries: Does specialty matter?,” Journal of Trauma and Acute Care Surgery, vol. 75, no. 3, pp. 387–390, 2013. [Google Scholar]
15. C. D. Lehman, R. D. Wellman, D. S. Buist, K. Kerlikowske, A. N. Tosteson et al., “Diagnostic accuracy of digital screening mammography with and without computer-aided detection,” JAMA Internal Medicine, vol. 175, no. 11, pp. 1828–1837, 2015. [Google Scholar]
16. P. Taylor and H. W. Potts, “Computer aids and human second reading as interventions in screening mammography: Two systematic reviews to compare effects on cancer detection and recall rate,” European Journal of Cancer, vol. 44, no. 6, pp. 798–807, 2008. [Google Scholar]
17. L. A. Khoo, P. Taylor and R. M. Given-Wilson, “Computer-aided detection in the United Kingdom national breast screening programme: Prospective study,” Radiology, vol. 237, no. 2, pp. 444–449, 2005. [Google Scholar]
18. E. Azavedo, S. Zackrisson, I. Mejàre and M. H. Arnlind, “Is single reading with computer-aided detection (CAD) as good as double reading in mammography screening? A systematic review,” BMC Medical Imaging, vol. 12, no. 1, pp. 1–12, 2012. [Google Scholar]
19. Y. LeCun, Y. Bengio and G. Hinton, “Deep learning,” Nature, vol. 521, no. 7553, pp. 436–444, 2015. [Google Scholar]
20. A. Esteva, B. Kuprel, R. A. Novoa, J. Ko, S. Swetter et al., “Dermatologist-level classification of skin cancer with deep neural networks,” Nature, vol. 542, no. 7639, pp. 115–118, 2017. [Google Scholar]
21. K. Sirinukunwattana, S. E. A. Raza, Y. -W. Tsang, D. R. Snead, I. A. Cree et al., “Locality sensitive deep learning for detection and classification of nuclei in routine colon cancer histology images,” IEEE Transactions on Medical Imaging, vol. 35, no. 5, pp. 1196–1206, 2016. [Google Scholar]
22. D. C. Cireşan, A. Giusti, L. M. Gambardella and J. Schmidhuber, “Mitosis detection in breast cancer histology images with deep neural networks,” in Int. Conf. on Medical Image Computing and Computer-Assisted Intervention, Berlin, Heidelberg, Springer, pp. 411–418, 2013. [Google Scholar]
23. E. S. Kumar and C. S. Bindu, “Medical image analysis using deep learning: A systematic literature review,” in Int. Conf. on Emerging Technologies in Computer Engineering, London, UK, Springer, pp. 81–97, 2019. [Google Scholar]
24. R. Lindsey, A. Daluiski, S. Chopra, A. Lachapelle, M. Mozer et al., “Deep neural network improves fracture detection by clinicians,” Proceedings of the National Academy of Sciences, USA, vol. 115, no. 45, pp. 11591–11596, 2018. [Google Scholar]
25. D. Kim and T. MacKinnon, “Artificial intelligence in fracture detection: Transfer learning from deep convolutional neural networks,” Clinical Radiology, vol. 73, no. 5, pp. 439–445, 2018. [Google Scholar]
26. R. Ebsim, Automatic Detection of Wrist Fractures in Radiographs, University of Manchester, UK, 2019. [Google Scholar]
27. K. B. Kim, D. H. Song and S. -S. Yun, “Automatic segmentation of wrist bone fracture area by K-means pixel clustering from X-ray image,” International Journal of Electrical and Computer Engineering, vol. 9, no. 6, pp. 5205, 2019. [Google Scholar]
28. B. Guan, G. Zhang, J. Yao, X. Wang and M. Wang, “Arm fracture detection in X-rays based on improved deep convolutional neural network,” Computers & Electrical Engineering, vol. 81, pp. 106530, 2020. [Google Scholar]
29. D. Joshi and T. P. Singh, “A survey of fracture detection techniques in bone X-ray images,” Artificial Intelligence Review, vol. 53, no. 6, pp. 4475–4517, 2020. [Google Scholar]
30. D. Yadav and S. Rathor, “Bone fracture detection and classification using deep learning approach,” in 2020 Int. Conf. on Power Electronics & IoT Applications in Renewable Energy and its Control (PARC), Mathura, India, pp. 282–285, 2020. [Google Scholar]
31. L. Tanzi, E. Vezzetti, R. Moreno and S. Moos, “X-Ray bone fracture classification using deep learning: A baseline for designing a reliable approach,” Applied Sciences, vol. 10, no. 4, pp. 1507, 2020. [Google Scholar]
32. J. H. Moon and S. R. Steinhubl, “Digital medicine in thyroidology: A new era of managing thyroid disease,” Endocrinology and Metabolism, vol. 34, no. 2, pp. 124–131, 2019. [Google Scholar]
33. H. Malik, J. Jabbar and H. Mehmood, “Wrist fracture-X-rays,” Mendeley Data, version 1, 2020. [Google Scholar]
34. M. Tuceryan and A. Jain, “The Handbook of Pattern Recognition and Computer Vision, by In: C. H. Chen, L. F. Pau, P. S. P. Wang (Eds.),” Singapore: World Scientific Publishing Co, 1998. [Google Scholar]
35. M. Anthimopoulos, S. Christodoulidis, L. Ebner, A. Christe and S. Mougiakakou, “Lung pattern classification for interstitial lung diseases using a deep convolutional neural network,” IEEE Transactions on Medical Imaging, vol. 35, no. 5, pp. 1207–1216, 2016. [Google Scholar]
36. N. Srivastava, G. Hinton, A. Krizhevsky, I. Sutskever and R. Salakhutdinov, “Dropout: A simple way to prevent neural networks from overfitting,” The Journal of Machine Learning Research, vol. 15, no. 1, pp. 1929–1958, 2014. [Google Scholar]
37. A. Krizhevsky, I. Sutskever and G. E. Hinton, “Imagenet classification with deep convolutional neural networks,” Advances in Neural Information Processing Systems, vol. 25, pp. 1097–1105, 2012. [Google Scholar]
38. V. Nair and G. E. Hinton, “Rectified linear units improve restricted boltzmann machines,” Icml, vol. 1, no. 3, pp. 807–814, 2010. [Google Scholar]
39. D. Rolnick, A. Veit, S. Belongie, and N. Shavit, “Deep learning is robust to massive label noise,” arXiv preprint arXiv:1705.10694, 2017. [Google Scholar]
40. D. P. Kingma and J. Ba, “Adam: A method for stochastic optimization,” arXiv preprint arXiv:1412.6980, 2014. [Google Scholar]
41. E. C. Too, L. Yujian, S. Njuki and L. Yingchun, “A comparative study of fine-tuning deep learning models for plant disease identification,” Computers and Electronics in Agriculture, vol. 161, pp. 272–279, 2019. [Google Scholar]
42. C. Szegedy, S. Ioffe, V. Vanhoucke and A. A. Alemi, “Inception-v4, inception-resnet and the impact of residual connections on learning,” in Thirty-First AAAI Conf. on Artificial Intelligence, vol. 12, no. 3, pp. 4278–4284, 2017. [Google Scholar]
43. O. Russakovsky, J. Deng, H. Su, J. Krause, S. Satheesh et al., “Imagenet large scale visual recognition challenge,” International Journal of Computer Vision, vol. 115, no. 3, pp. 211–252, 2015. [Google Scholar]
44. C. Szegedy, W. Liu, Y. Q. Jia, P. Sermanet, S. Reed et al., “Going deeper with convolutions,” in Proc. of the IEEE Conf. on Computer Vision and Pattern Recognition, Boston, MA, USA, pp. 1–9, 2015. [Google Scholar]
45. V. Gulshan, L. Peng, M. Coram, M. C. Stumpe, D. Wu et al., “Development and validation of a deep learning algorithm for detection of diabetic retinopathy in retinal fundus photographs,” Jama, vol. 316, no. 22, pp. 2402–2410, 2016. [Google Scholar]
46. G. Litjens, T. Kooi, B. E. Bejnordi, A. A. A. Setio, F. Ciompi et al., “A survey on deep learning in medical image analysis,” Medical Image Analysis, vol. 42, pp. 60–88, 2017. [Google Scholar]
47. G. Huang, Z. Liu, L. Van Der Maaten and K. Q. Weinberger, “Densely connected convolutional networks,” in Proc. of the IEEE Conf. on Computer Vision and Pattern Recognition, Honolulu, HI, USA, pp. 4700–4708, 2017. [Google Scholar]
48. F. Chollet, “Xception: Deep learning with depthwise separable convolutions,” in Proc. of the IEEE Conf. on Computer Vision and Pattern Recognition, Honolulu, HI, USA, pp. 1251–1258, 2017. [Google Scholar]
49. C. Szegedy, V. Vanhoucke, S. Ioffe, J. Shlens and Z. Wojna, “Rethinking the inception architecture for computer vision,” in Proc. of the IEEE Conf. on Computer Vision and Pattern Recognition, Boston, MA, USA, pp. 2818–2826, 2016. [Google Scholar]
50. Y. Ma and Y. Luo, “Bone fracture detection through the two-stage system of crack-sensitive convolutional neural network,” Informatics in Medicine Unlocked, vol. 22, pp. 100452, 2021. [Google Scholar]
 | This work is licensed under a Creative Commons Attribution 4.0 International License, which permits unrestricted use, distribution, and reproduction in any medium, provided the original work is properly cited. |