DOI:10.32604/cmc.2022.026310
| Computers, Materials & Continua DOI:10.32604/cmc.2022.026310 | |
| Article |
Whale Optimization Algorithm Strategies for Higher Interaction Strength T-Way Testing
1Faculty of Information Science and Technology, Universiti Kebangsaan Malaysia, Bangi, 43600, Selangor, Malaysia
2Faculty of Computing, College of Computing and Applied Sciences, Universiti Malaysia Pahang, Pekan, 26600, Pahang, Malaysia
*Corresponding Author: Ali Abdullah Hassan. Email: ali87hassan@gmail.com
Received: 22 December 2021; Accepted: 10 March 2022
Abstract: Much of our daily tasks have been computerized by machines and sensors communicating with each other in real-time. There is a reasonable risk that something could go wrong because there are a lot of sensors producing a lot of data. Combinatorial testing (CT) can be used in this case to reduce risks and ensure conformance to specifications. Numerous existing meta-heuristic-based solutions aim to assist the test suite generation for combinatorial testing, also known as t-way testing (where t indicates the interaction strength), viewed as an optimization problem. Much previous research, while helpful, only investigated a small number of interaction strengths up to t = 6. For lightweight applications, research has demonstrated good fault-finding ability. However, the number of interaction strengths considered must be higher in the case of interactions that generate large amounts of data. Due to resource restrictions and the combinatorial explosion challenge, little work has been done to produce high-order interaction strength. In this context, the Whale Optimization Algorithm (WOA) is proposed to generate high-order interaction strength. To ensure that WOA conquers premature convergence and avoids local optima for large search spaces (owing to high-order interaction), three variants of WOA have been developed, namely Structurally Modified Whale Optimization Algorithm (SWOA), Tolerance Whale Optimization Algorithm (TWOA), and Tolerance Structurally Modified Whale Optimization Algorithm (TSWOA). Our experiments show that the third strategy gives the best performance and is comparable to existing state-of-the-arts based strategies.
Keywords: Software testing; optimization problem; swarm intelligence algorithm; combinatorial optimization; IoT
The Internet of Things (IoT) is a groundbreaking technology that allows users to connect with things (objects) via the Internet by granting things the ability to feel the environment and communicate with other objects and people. IoT has encouraged an ambitious and valuable new generation of services. Nowadays, cities are becoming smarter by implementing intelligent systems such as traffic control systems, water management systems, energy management systems, public transportation systems, to name a few. However, the design of IoT systems, software applications, and services make testing a tedious process [1]. This is because of its homogeneous and decentralized nature and tremendous data collection and processing [1].
Combinatorial testing (CT) is used in this scenario to reduce the number of test cases. CT uses a few numbers of test cases to examine the interactions among the software’s configurations (parameters). “a flaw is usually caused by interactions among a small number (say t) of parameters,” says the idea [2]. As a result, it’s crucial to look at all possible combinations of each t parameter since software system errors emerge when two or more system inputs interact [3].
There are two types of t-way testing procedures available: pure computational-based and artificial intelligence (AI)-based. Jenny [4], Test Configurations (TConfig) [5], Pairwise Independent Combinatorial Tool (PICT) [6], Generalized in-parameter-order strategy (IPOG) [7], and IPOG for multi-way testing (IPOG-D) [8] are pure computational-based approaches aiming at constructing a test set from the start based on the generalization of the Orthogonal Array (OA) to construct the test suite [8]. On the other hand, AI-based techniques such as Genetic algorithm (GA) [9], Particle Swarm Optimization algorithm (PSO) [10], and Ant Colony algorithm (ACA) [11] start by generating test cases from a pre-existing test set (i.e., the interaction elements, also known as the t-tuple table) and continue until the test suite is built.
AI-based techniques produce superior results by containing a few test cases [12]. On the other hand, pure computational-based strategies offer a comprehensive list of all conceivable combinations to be covered. Consequently, the test suite size results may not be optimal [8]. Yet, these methods are often relatively expeditious at producing test cases [13].
The number of parameters that interact with each other is called interaction strength. Two-way testing suggests an interaction between two parameters, and three-way testing means interaction between three parameters, etc. The previous studies have shown that most of the flaws in a standard software system may be identified by small interaction strengths (i.e., less than or equal to three) [10]. However, with the emergence of IoT technology, little-known work has concentrated on generating high order interaction strength (i.e., t > 6) due to resource constraints and combinatorial explosion problems. Additionally, further studies have indicated the need for higher strengths, particularly in the case of sophisticated software systems and IoT systems [12]. This is due to a massive increase in the size and configuration of the software systems, which gives rise to a more significant number of parameters with various interactions. Therefore, the following two criteria are regarded to assess the strategy: (1) the size of the test suite and (2) the support of higher interaction strength.
The significant contribution of this study is the introduction of three variants of the Whale Optimization Algorithm (WOA). The first variant is to modify the structure of WOA and the second one is to use the acceptance probability of the Exponential Monte-Carlo algorithm (EMC) [14] to accept the worst solutions. The third variant is the combination of the first and the second variant.
The remainder of the article has been organized as follows: Section 2 illustrates the background of t-way testing using an example. Section 3 reviews the previous related work. Section 4 discusses the origin of WOA and its advantages and disadvantages. Section 5 introduces the proposed method, which involves the three variants of WOA. Section 6 evaluates the three variants, while Section 7 evaluates and compares the best variant among the three with the existing state-of-the-art strategies. Threats to validity are discussed in Section 8. Finally, Section 9 presents the conclusion.
2 Combinatorial Testing Background
Often, the testers have to work within a strict schedule. Therefore, the testing techniques must be considerably effective to attain maximum test coverage and a high fault discovery rate. T-way testing, also known as combinatorial testing (CT), delivers the afore-stated features [3]. CT is a method for examining all the possible discrete combinations of the software system parameters [3]. T-way testing has adopted particular Design of Experiments (DoE) methods, including the Covering Array (CA).
To produce balanced t-tuples, CAs generalize orthogonal arrays (OAs) by requiring that the t-tuples be covered at least once instead of a specified number of times [15]. Mathematically, a tuple is a limited and arranged list of items (i.e., the values of the parameter interactions). T-tuples are a collection of t elements (or arranged lists). CA (N; t, vp) is a combinatorial object with p as the parameters (i.e., system configurations, input data, or both), N as the number of test cases generated, v as the parameter values, and t as the interaction strength.
Test suite minimization is the main objective of t-way testing. A test suite is a collection of test cases meant to examine a software system to demonstrate that the system has a particular set of behaviors. T-way testing is performed by choosing a system configuration combination, which becomes a test case. Subsequently, a test suite is created by collecting test cases for the software system.
Consider the example of the washing machine control panel application as shown in Fig. 1. The washing machine control panel application has four primary configurations/parameters, i.e., cycle function, temperature, soil, and spin. Let’s say that all the parameters take four values (i.e., Cycle Function = {heavy duty, normal, fast wash, delicates}, Temperature = {hot, warm, cold, tap cold}, Soil = {heavy, normal, light, extra light}, Spin = {high, medium, low, no spin}).
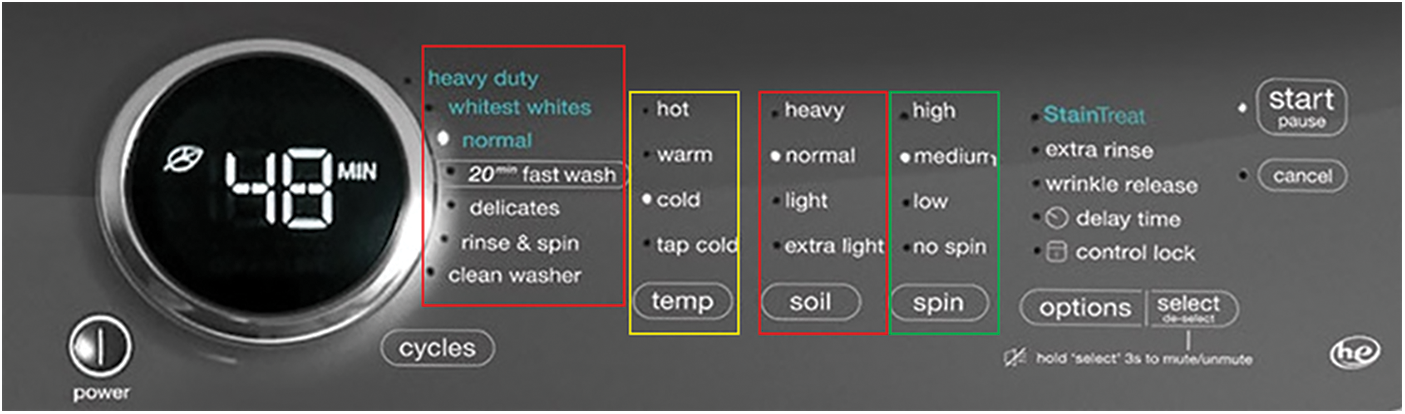
Figure 1: Washing machine control panel application
The covering array for the washing machine example shown in Fig. 1 above can be represented as CA (N; 2, 44), assuming the interaction strength is t = 2. The exhaustive test for the washing machine example required 4 × 4 × 4 × 4 = 256 test cases to cover the configurations. Meanwhile, when a meta-heuristic approach (e.g., TSWOA) was applied in 2-way testing, just 12 test cases were generated to cover all of the configurations in the washing machine example.
T-way testing is classified as a discrete optimization problem because selecting the values in any particular test case is absolute. Stardom was the first to develop an AI-based strategy [9]. Stardom used tournament selection to implement GA, which started with a random generation of test cases that were partitioned and mated. The offspring were then created using the crossover procedure [9].
Shiba et al. built on Stardom’s work to produce GA support 3-way testing and used the Ant Colony Algorithm (ACA) to construct CA with an interaction strength t = 3 [11]. Genetic Strategy (GS) is a version of GA that modifies the crossover and mutation operators to provide uniform and variable CAs and higher interaction strengths of up to twenty (i.e., t = 20) [13]. Furthermore, GS parameters, including population size, crossover, and mutation rates, were fine-tuned to enhance efficiency and performance [13].
PSTG [16] was the first AI-based technique to offer interaction strength i of up to six. Discrete Particle Swarm Optimization (DPSO) [17] is a PSO version with a schema based on divided search space and uses a separated particle swarm as its foundation. PSO performs better now that two additional procedures have been added: (1) particles are reinitialized, and (2) gbest (the best test case found) is also examined. DPSO additionally includes parameter adjustment instructions. Compared to traditional PSO and other known evolutionary algorithms, DPSO has produced better outcomes [17].
Harmony Search Strategy (HSS) is an AI-based strategy implemented to generate a test suite. HSS added a new test case to the CA (test suite) at each iteration until all t-interactions were covered and the CA was complete. HSS could support higher interaction strengths of up to fifteen [12]. Another AI-based technique used to generate CA with a six-interaction strength is Cuckoo Search (CS) [18]. The objective of introducing CS to t-way testing was to reduce the time spent searching for test cases. PSTG and CS produce similar results, with the latter being fast. Gravitational Search Test Generator (GSTG) was proposed to support higher interaction strength of up to ten [19]. GSTG is based on GSA, a population-based metaheuristic algorithm with stochastic search behavior [19].
Adaptive particle swarm optimization (APSO) is a hybridization of the Mamdani-type fuzzy inference system (FIS) and particle swarm optimization [20]. FIS is used to optimize the parameters of PSO. For most cases, APSO outperforms DPSO and CS [20]. Zamli et al. proposed FPSO [21], the same hybridization but with a different technique and functionality. PSO’s global and local search processes were subjected to fuzzy adaptive selection as part of FPSO’s approach. Both hybridizations produced CAs with interaction strengths up to four (i.e., t ≤ 4), and FPSO outperformed DPSO in the average outcome in several situations. Another PSO hybridization is the hybrid artificial bee colony strategy (HABCSm), which uses PSO to enhance the standard ABC algorithm’s performance [22]. HABCSm is a t-way testing strategy that uses the Hybrid Artificial Bee Colony (HABC) algorithm as its primary application for producing a final test set and the Hamming distance as the last selection criterion to aid in discovering new solutions [22].
The Q-learning sine cosine algorithm (QLSCA) combines the sine-cosine algorithm (SCA) and the Q-learning algorithm [23]. The Q-learning technique replaces the SCA switching probability, which uses a penalty and reward mechanism to find the optimum procedure during runtime. In most cases, QLSCA beat many previous techniques by generating the best average performance [23]. The Graph-Based Greedy Algorithm (GBGA) is a competitive greedy algorithm that constructs CAs using a graph representation. It can support up to six (i.e., t = 6) interaction strengths [24]. The Artificial Bee Colony Strategy (ABCVS) is a two-way generation strategy based on the Artificial Bee Colony (ABC) algorithm for a uniform and variable strength test suite [25]. ABCVS can support higher interaction strengths up to six (i.e., t = 6) [25]. Several scholars have recommended hybridization to boost strategies by improving quality, diversifying solutions, and addressing the frequent metaheuristic (AI-based) limitations. The purpose of hybridization in t-way testing is to reduce the test suite.
Summing up, all the previous works on t-way testing have usefully contributed to improving the current state-of-the-art on interaction t-way test case generation and potentially broadening its applications in line with the emergence of the IR4.0 agenda. Nonetheless, The No Free Lunch Theorem [26] states that no single metaheuristic can outperform others in the context of AI-based approaches to meta-heuristics, as some algorithms perform better than others on particular types of optimization problems. Our research examines how well WOA and its variants perform for general high strength interaction.
4 Whale Optimization Algorithm
The Whale Optimization Algorithm (WOA) is a contemporary metaheuristic algorithm inspired by nature [27]. WOA is a swarm-based method that mimics humpback whale hunting behavior. Humpback whales are intelligent creatures who have developed an advanced manner of cooperating with one another. They employ a unique tracking procedure known as bubble-net feeding, as shown in Fig. 2. This procedure creates peculiar bubbles along a circle or ‘9’-shaped path. The whales hunt near the surface and catch the victim in a net of bubbles.
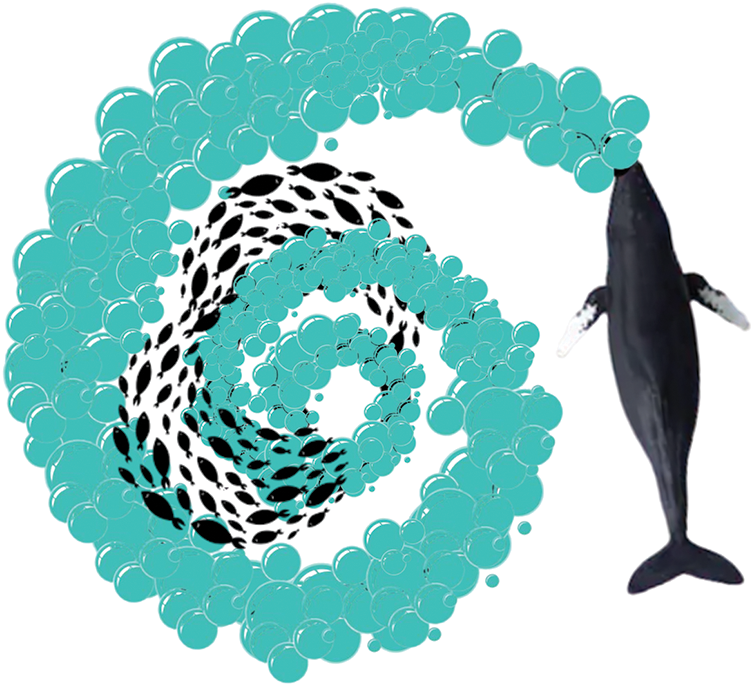
Figure 2: Bubble-net hunting behavior of humpback whales. Source [28]
The exploitation phase and the exploration phase are the two phases of WOA. The exploitation phase uses the encircling-a-prey approach and the spiral bubble-net attacking method, while the exploration phase entails randomly seeking a victim. WOA’s mathematical model can be summarized as follows:
The first approach is encircling-a-prey, in which humpback whales identify the victim’s location and then encircle it. The target victim is assumed to be the current best candidate solution in WOA. After that, the best search agent is found, and the remaining search agents try to relocate their locations in its direction. In other words, it updates the whale’s movement (location) around the victim, which can be described in a mathematical form as follows:
where t denotes the current iteration, X* is the best solution found thus far, and X denotes the current solution. The coefficients A and C are calculated as follows:
where a is linearly decreased from 2 to 0 along the iterations trajectory as displayed in Eq. 5, and r is a random number between 0 and 1.
The second method is the Bubble-net attacking method, which comprises the shrinking encircling mechanism and the spiral updating position mechanism. The shrinking encircling mechanism is carried out by lowering a value in Eq. (3). Thus, the new position of a search agent is between the agent’s actual position and the position of the existing best agent. The spiral updating position mechanism involves calculating the distance between the current solution (whale) and the best solution (victim) by applying the spiral Equation as follows:
where D′ is the distance between the whale and the victim, b is a constant for defining the shape of the logarithmic spiral, and l is a random value between −1 and 1.
Humpback whales practice both techniques (encircling-a-prey and spiral-shaped) simultaneously. A 50% probability is introduced to model this behavior to select one of the techniques to update the whales’ location during the search. The mathematical model is outlined as follows:
where p is a random number in [0,1].
WOA considers a global search. The whales search at random based on their proximity to one another. As a result, rather than relying on the best search agent found thus far, the position of a search agent is adjusted at random. When A’s random values are higher than one, this strategy drives the search agent to move away from a reference whale (best solution). As seen in Algorithm 1, this approach stresses global search and allows the WOA algorithm to explore. The mathematical model for the exploration phase is as follows:

The WOA algorithm and its variations have been extensively utilized to address various problems in various disciplines. WOA has been improved or modified in some domains to enhance solution quality and performance and address flaws such as premature convergence [29] and getting stuck in local optima [28,30].
Therefore, in this study, the following three variants of WOA for t-way test suite generation were proposed:
5.1 Structurally Modified Whale Optimization Algorithm (SWOA)
As stated earlier and illustrated in Fig. 3, WOA has two phases, exploration and exploitation, controlled by the controlling parameter A. The exploration phase is the random generation to enforce the global search. In contrast, the exploitation phase is represented by the shrinking and spiral-shaped path mechanisms. The randomization is used only in the shrinking mechanism, as visible in Fig. 3. This implies that WOA encourages greater exploitation, which leads to rapid convergence to a potentially non-optimal solution (i.e., premature convergence). Hence, SWOA was introduced to overcome the premature convergence issue by restructuring the WOA so that the decision of exploration and exploitation is undertaken first and controlled by A. Then, a probability of 50% chance is used to select one of the mechanisms, as illustrated in Fig. 4 and Algorithm 2.
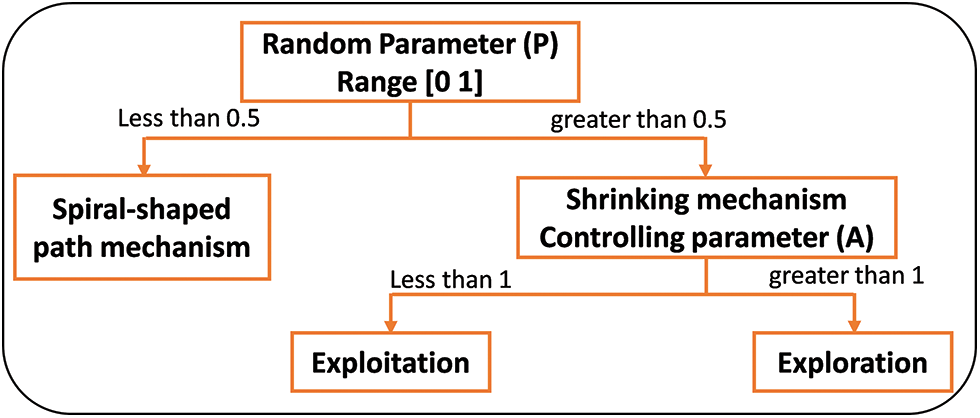
Figure 3: The layout structure of WOA
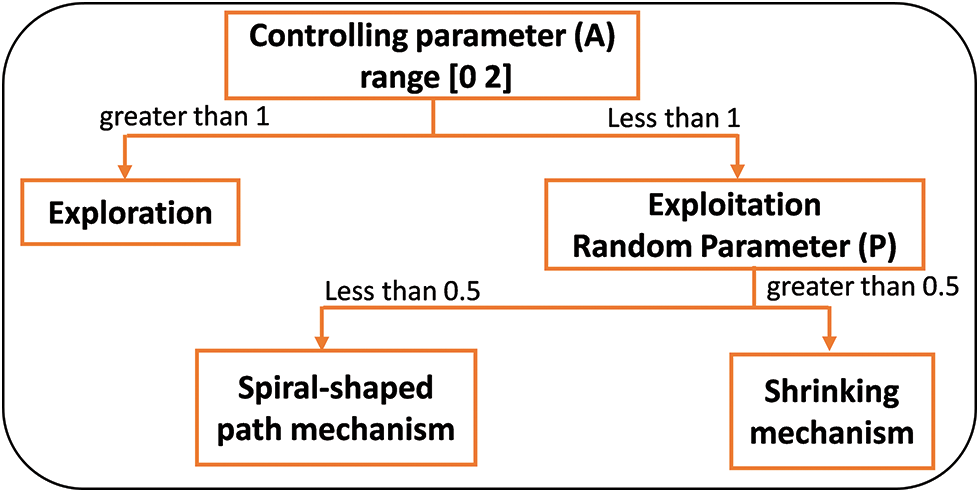
Figure 4: The layout structure of SWOA

5.2 Tolerance Whale Optimization Algorithm (TWOA)
It may be observed from Algorithm 1 that WOA always accepts the better solution [27]. As a consequence, WOA may get trapped in local optima. The second variant TWOA was used to resolve this issue, employing acceptance probability to avoid local optima. This acceptance probability was exercised in an Exponential Monte-Carlo algorithm (EMC-FC) [31], which allowed the worst solution to be accepted at a certain degree. The acceptance probability is calculated as follows:
where θ = δ * t, δ is the difference between the current and the best solution, t is the iteration counter (i.e., the current iteration) and λ is a successive non-improvement counter.
One may note that, as the number of iterations t increments, the probability of choosing a worse solution reduces. But, if for specific successive iterations, no improvement occurs, the likelihood of tolerating a worse solution would increment depending on the objective function of the current solution and the number of iterations. In other words, if δ is small or λ is high, the selection of a worse solution seems probable. Algorithm 3 demonstrates the pseudo-code of TWOA and illustrates how the acceptance probability is employed.
5.3 The Combination of SWOA and TWOA (TSWOA)
The last variant is the combination of the SWOA and TWOA, as Algorithm 4 shows.
This section reports the assessment of the efficiency of the WOA variants and the selection of the best one among the three, which would subsequently be benchmarked with the existing strategies (the comparison process described in the next section). The efficiency was measured in terms of the size of the CA (i.e., test suite size). Another measurement has been provided, which is the convergence behavior of the proposed WOA variants.
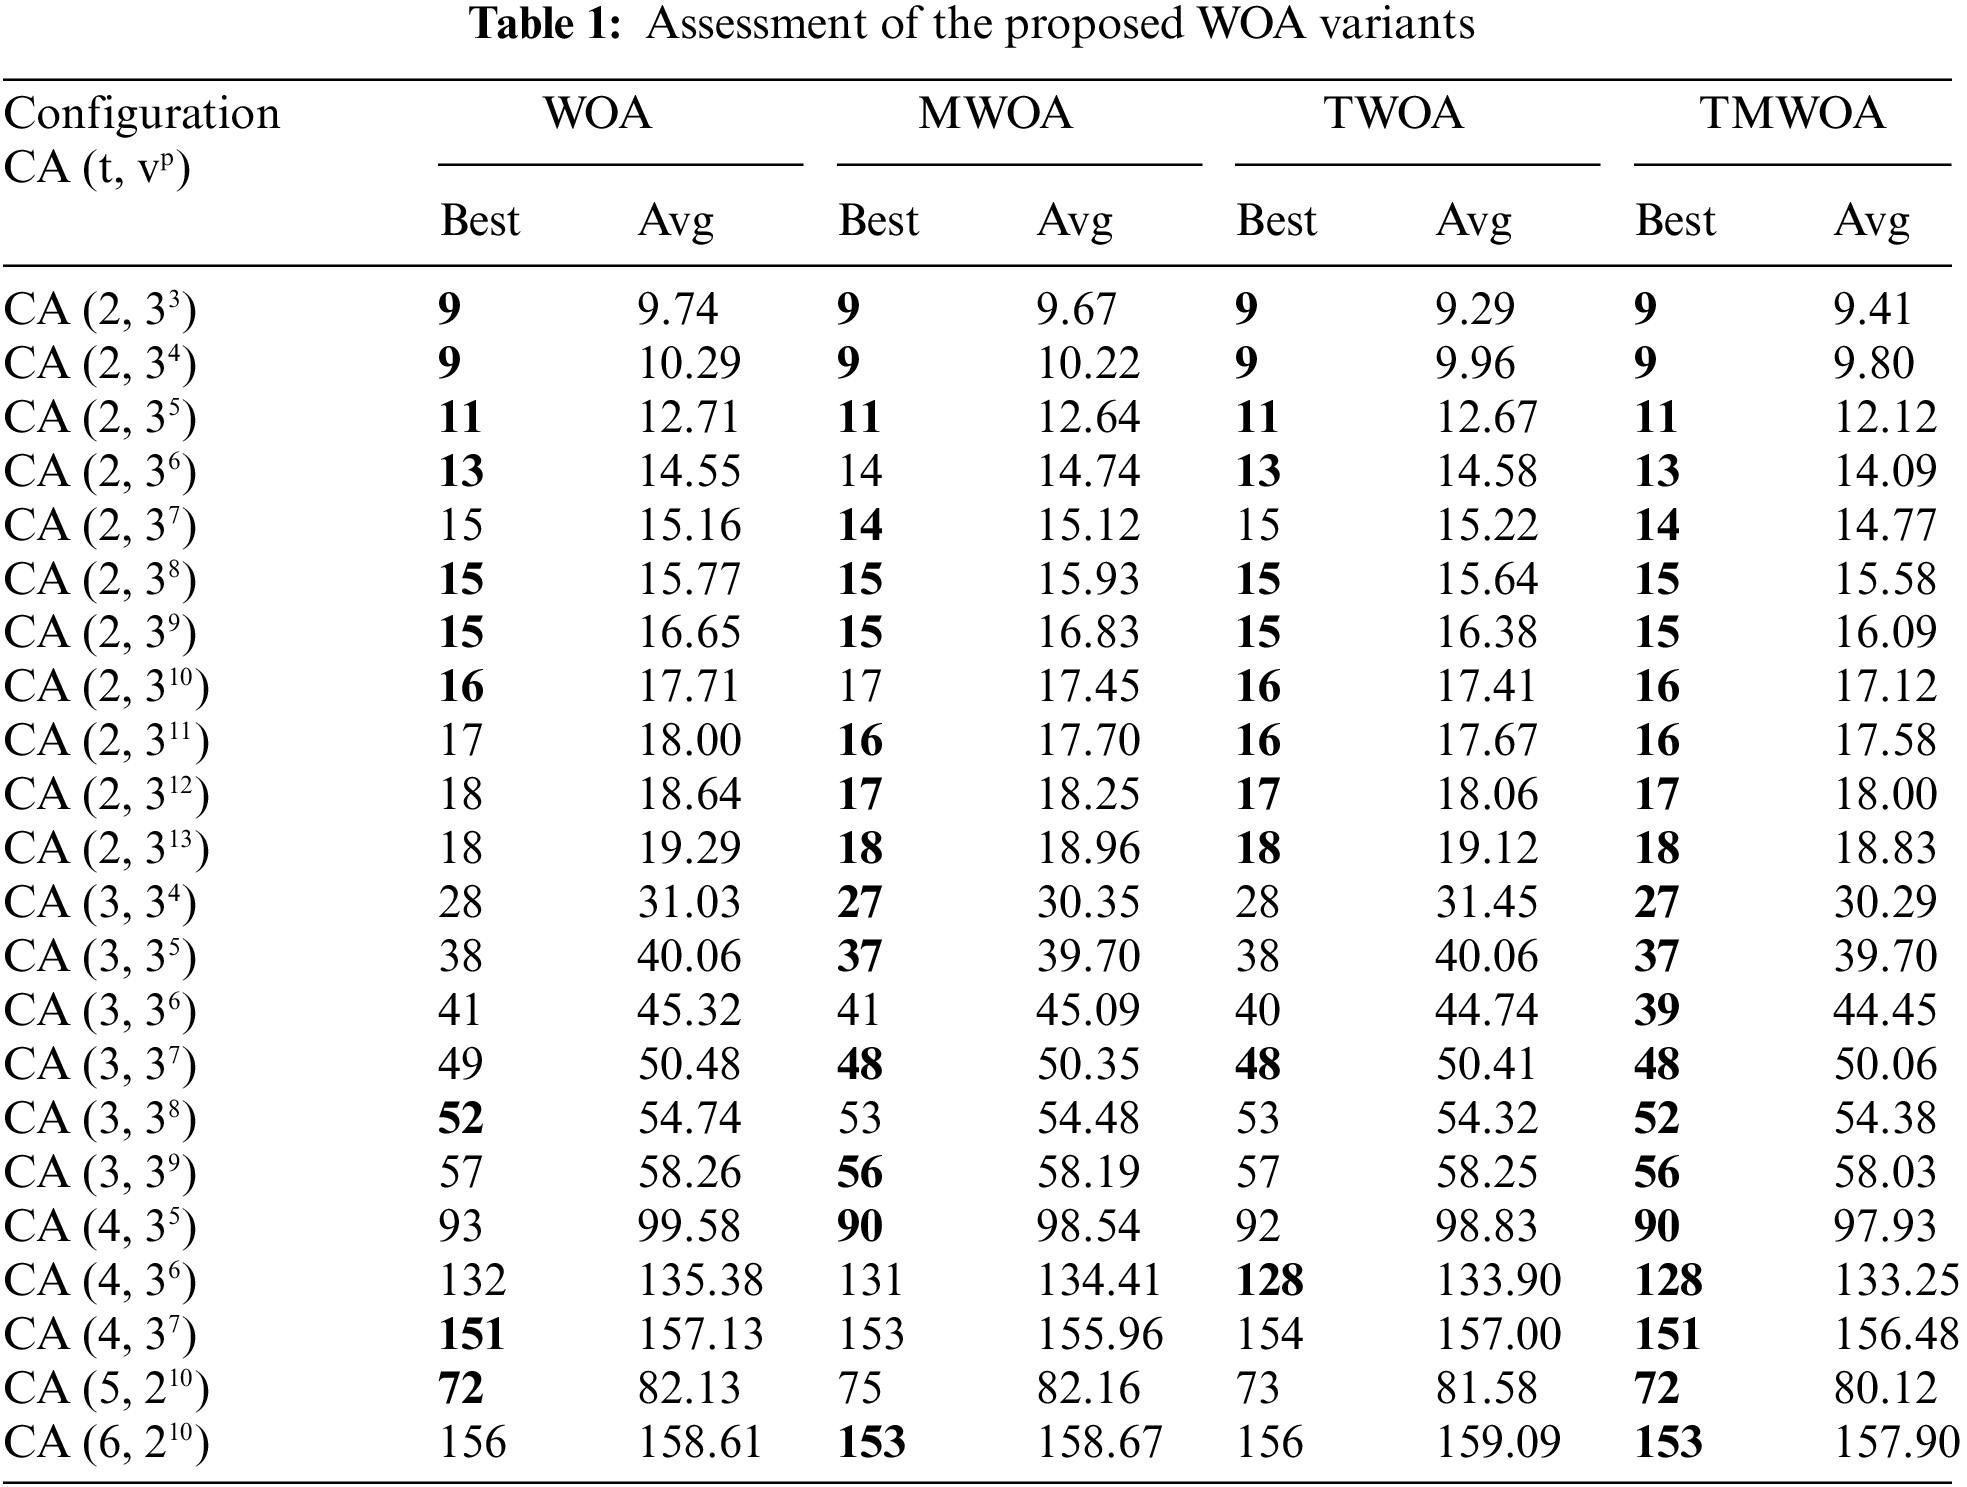
This experiment conducted a preliminary test on the algorithm's parameters sensitivity to determine the population size and the maximum iteration number. The covering array CA (N; 2, 57) was chosen as a case study to tune the parameters. The justification for embracing this covering array is that many AI-based approaches are tuned using the same covering array [12]. The best result was obtained for a population size of 50, while the maximum number of iterations was 100. In this context, each variant of WOA was subjected to renowned CA configurations, as depicted in Tab. 1.
The CA configurations in Tab. 1 can be divided into four groups: the first one was CA(2, 33-13) where t = 2 and v = 3 while p varies from 3 to 13; the second one was CA(3, 34-9) where t = 3 and v = 3 while p varies from 4 to 9; the third one was CA(4, 35-7) where t = 4 and v = 3 while p ranges from 5 to 7; and the last one was CA(5-6, 210) where v = 2 and p = 10 while t varies from 5 to 6.
The proposed methods were run 31 times, and the best and average results were considered. The results presented in Tab. 1 revealed that the enhanced variants of WOA outperformed the original one in most cases. In addition, the results indicated that TSWOA generated better output compared to the other variants. Both SWOA and TWOA produced better results in terms of best and average results than the original one. In comparison, the performance of SWOA was close to that of TWOA. SWOA performed slightly better than TWOA in certain cases.


Next, the convergence behavior of the proposed WOA variants was analyzed. Two CAs were selected for the analysis: CA (N; 2, 313) and CA (N; 4, 35). Figs. 5 and 6 depict the convergence behavior of the WOA variants. It may be noticed that TSWOA managed to converge faster than the other variants. Moreover, the enhanced variants SWOA and TWOA converge faster than the original WOA. Furthermore, Figs. 5 and 6 and the results in Tab. 1 indicated that TSWOA could escape the local optima effectively.
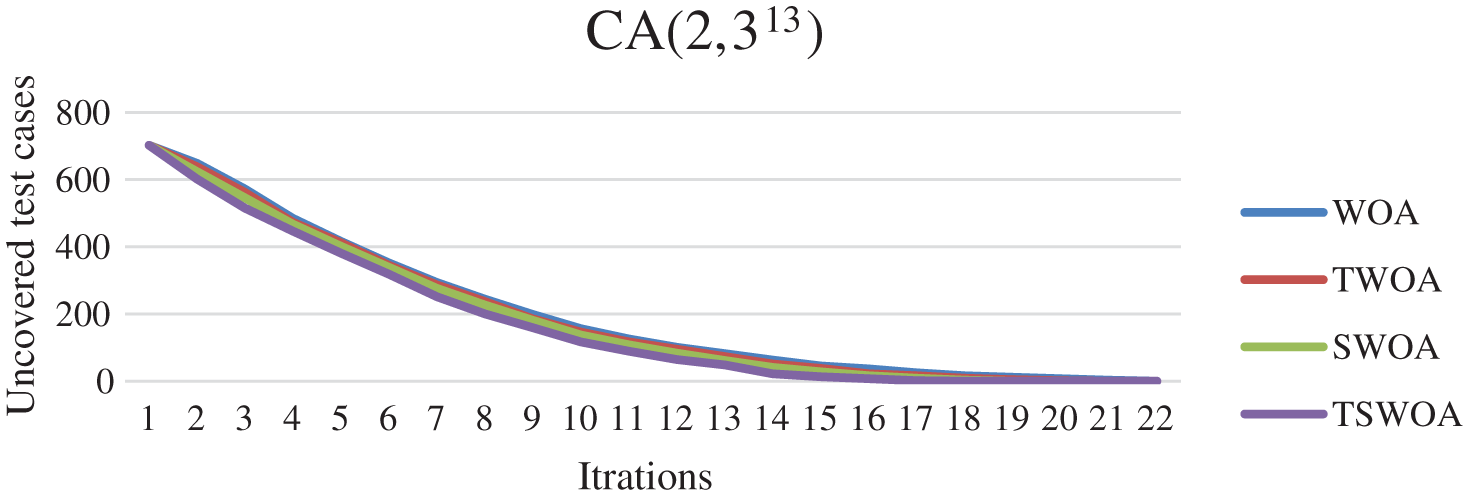
Figure 5: The convergence behavior of WOA variants for CA (N; 2; 313)
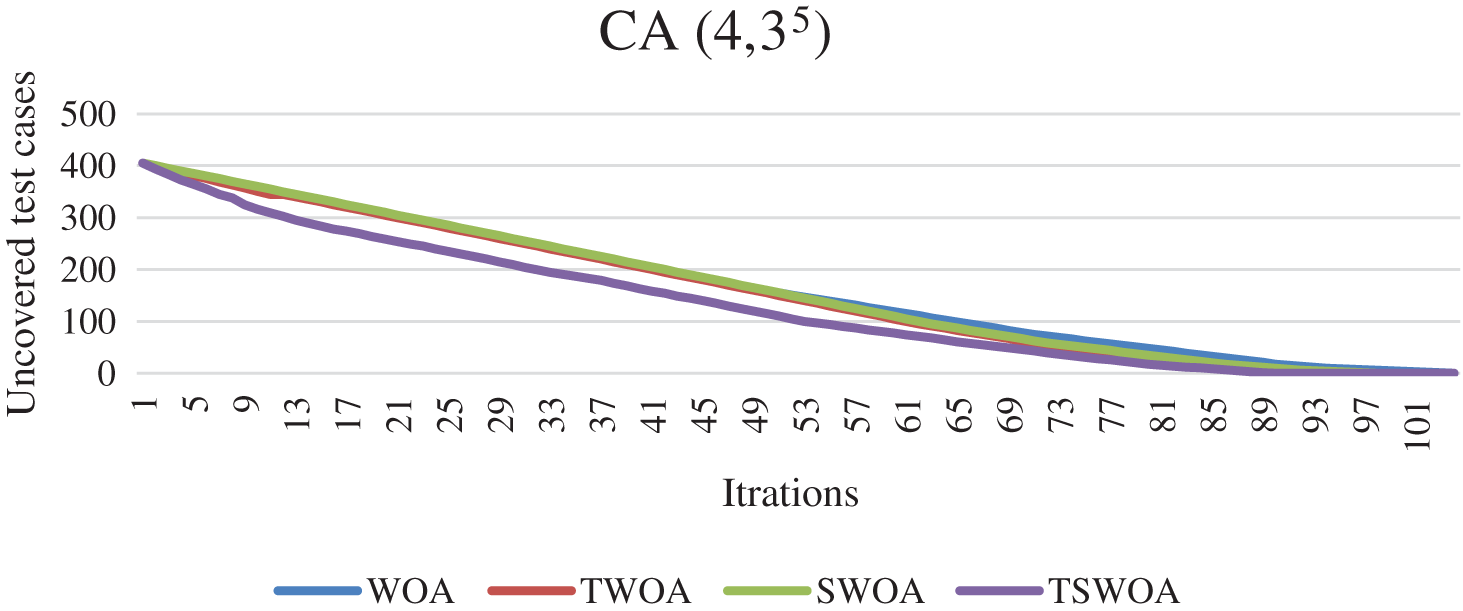
Figure 6: The convergence behavior of WOA variants for CA (N; 2; 35)
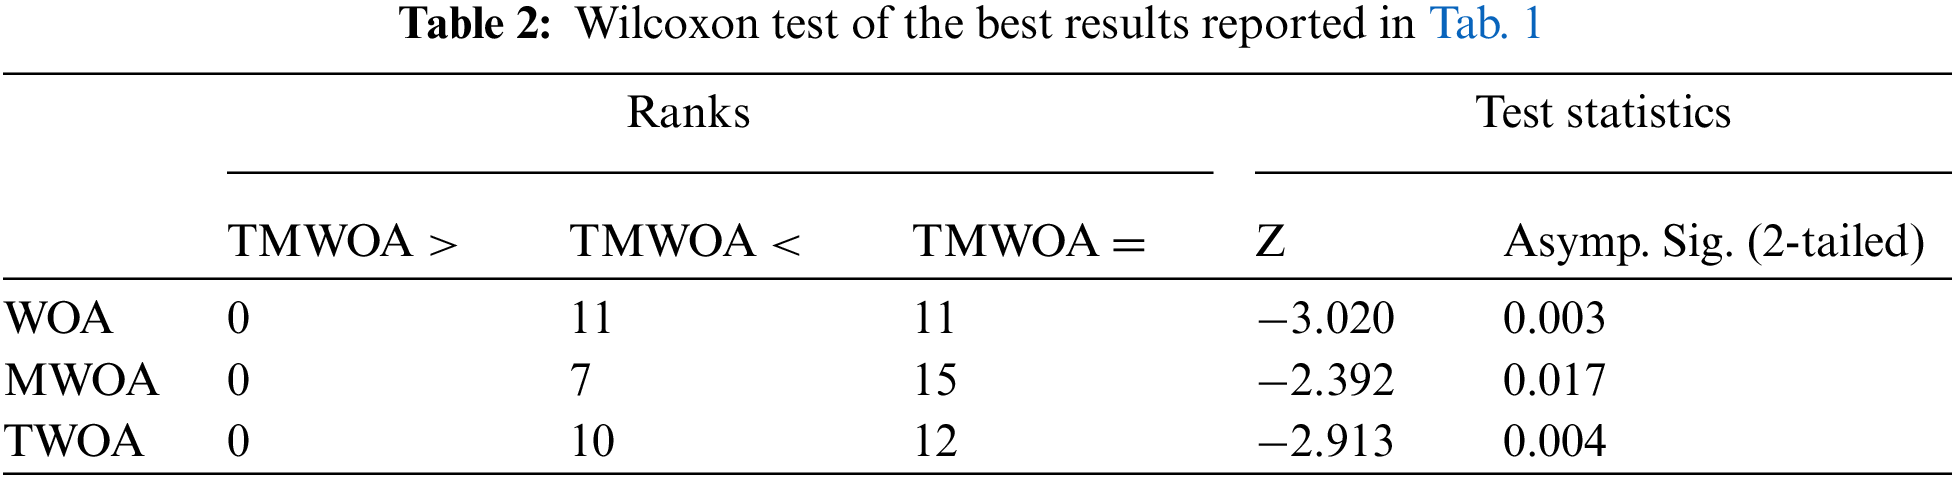
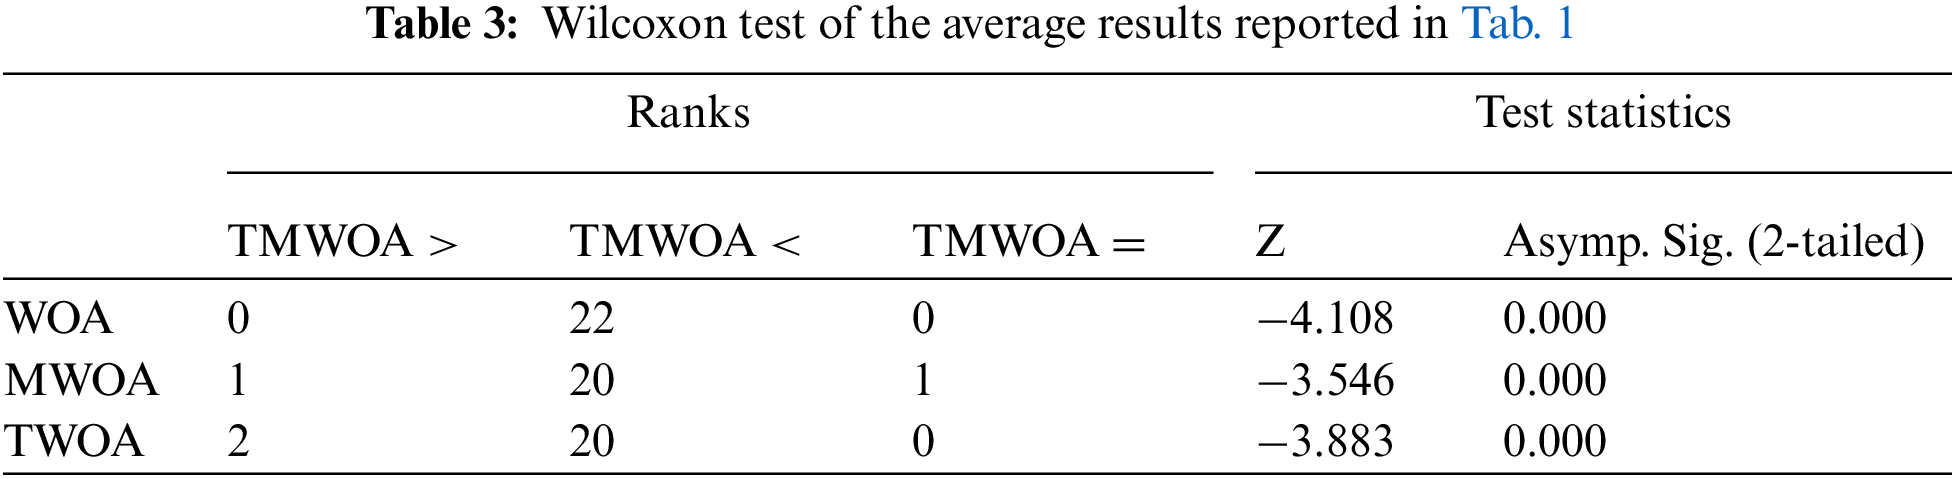
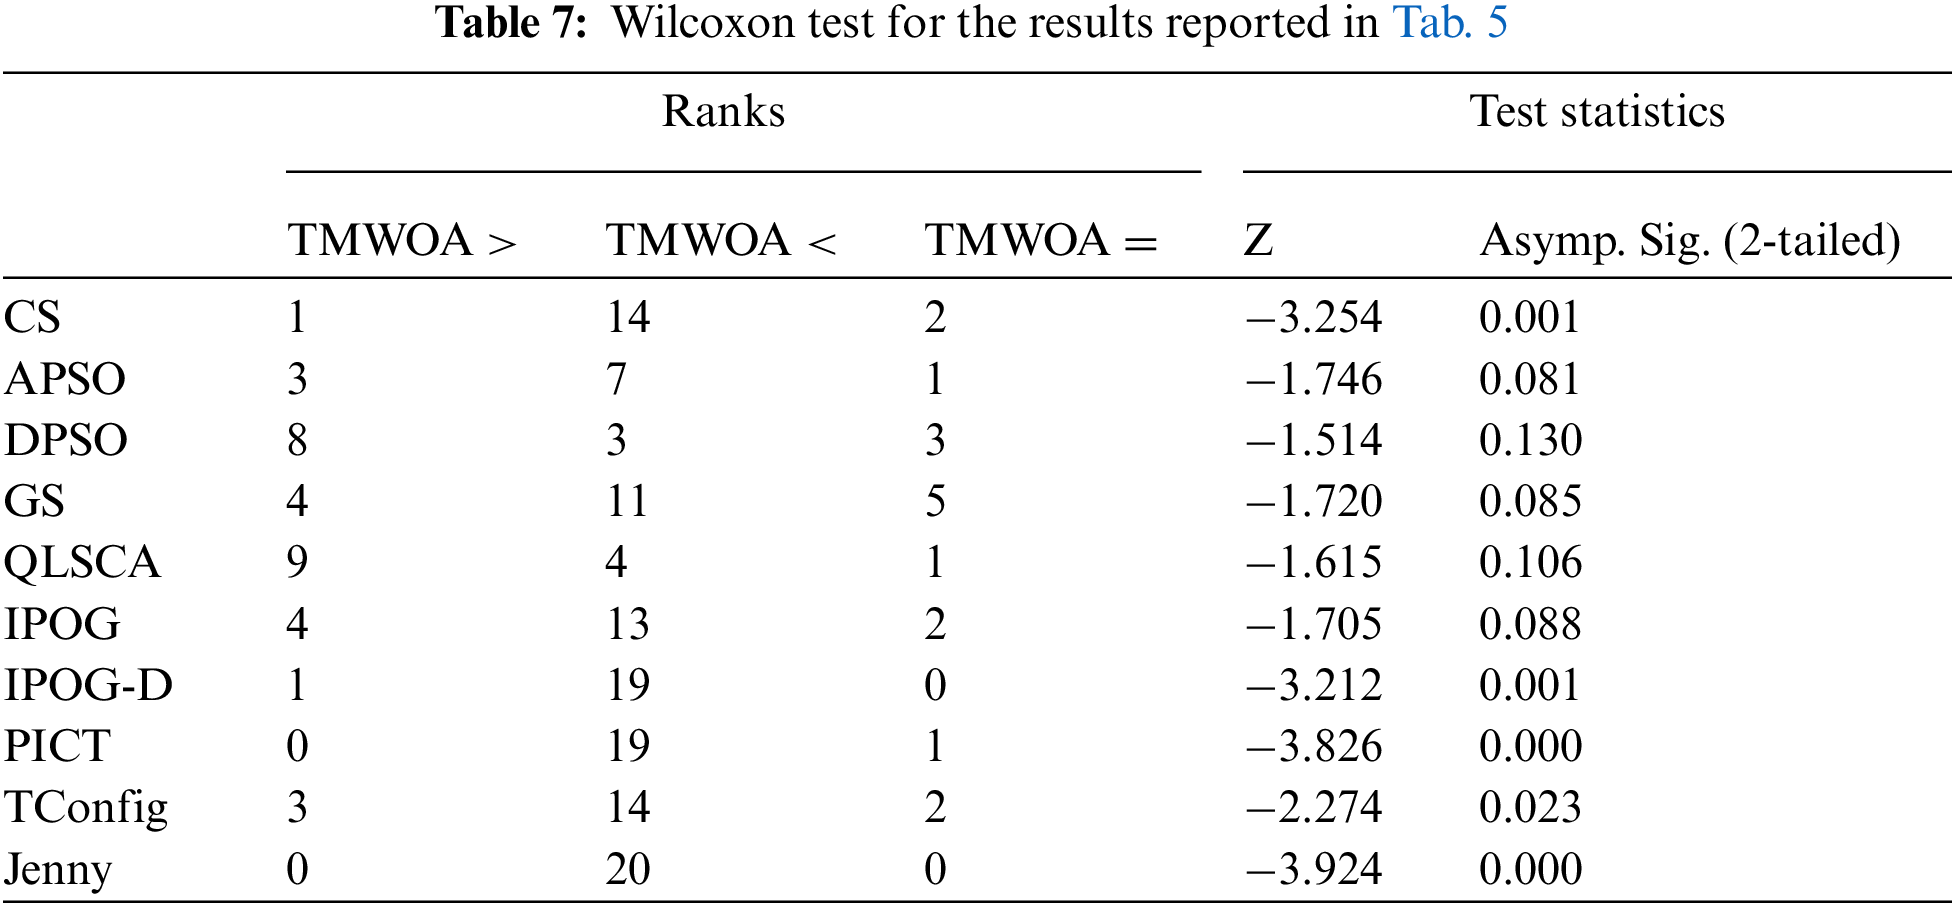
Statistical analysis was performed to ensure that TSWOA was superior to the other WOA variations, namely the Wilcoxon signed-rank test, a non-parametric test for matched or coupled data concentrated at differential ratings. However, it also considers the extent of the observed differences in response to evaluating the signs of the differences. The reason for utilizing the Wilcoxon signed-rank test is that it can inform if there is a significant difference between the two results.
Wilcoxon’s signed-rank test produced two factors. The first one is Asymp. Sig. (2-tailed) and Z, which are statistical tests that indicate the difference between two groups. If the value of Asymp. Sig. (2-tailed) was smaller than 0.05, it implied a significant difference between the two groups. Although the value of Z is not relevant to this study, the value has nonetheless been provided in the report. The second factor is the ranking, which ranks which values are more significant than, equal to, or less than comparable values.
In all tables presenting the statistical results, in the part of the rank, “TSWOA <” indicates the number of cases TSWOA generated with a smaller size of CA compared to the other variants (i.e., WOA, SWOA, and TWOA). In other words, the number of times TSWOA generated better results. Similarly, “TSWOA =” indicated the number of times the results were the same, while “TSWOA >” represented the number of times TSWOA produced the worst results.
Tabs. 2 and 3 present the consequence of the Wilcoxon test on the results reported in Tab. 1. Tabs. 2 and 3 revealed that TSWOA generated significantly different outcomes than the other WOA variants, which confirms the superiority of TSWOA over the other WOA variants.
7 Benchmarking with Existing Strategies
In order to evaluate TSWOA’s performance, it was compared to other existing techniques in terms of CA size. The experiments were divided into two parts. The first one has been divided again into the following two well-known datasets:
1. Comparing TSWOA with the currently available strategies using CA (t, v7), the number of parameters remained constant, and their values varied. In addition, the interaction strength t ranged from 2 to 6.
2. Comparing TSWOA with the existing strategies using CA (t, 3P), the number of parameters was varied, and their values remained constant. In addition, the interaction strength t varied from 2 to 6.
The second part of the experiments was conducted for higher interaction strength, and two datasets were subjected to experimentation. The first one was CA (t, 210), where the number of parameters and their values remained constant, and t varied from 2 to 10. The second one was the CAs reported in Tab. 9, where t ranged from 2 to 20. In addition, the Wilcoxon signed-rank test was performed on all the reported results.
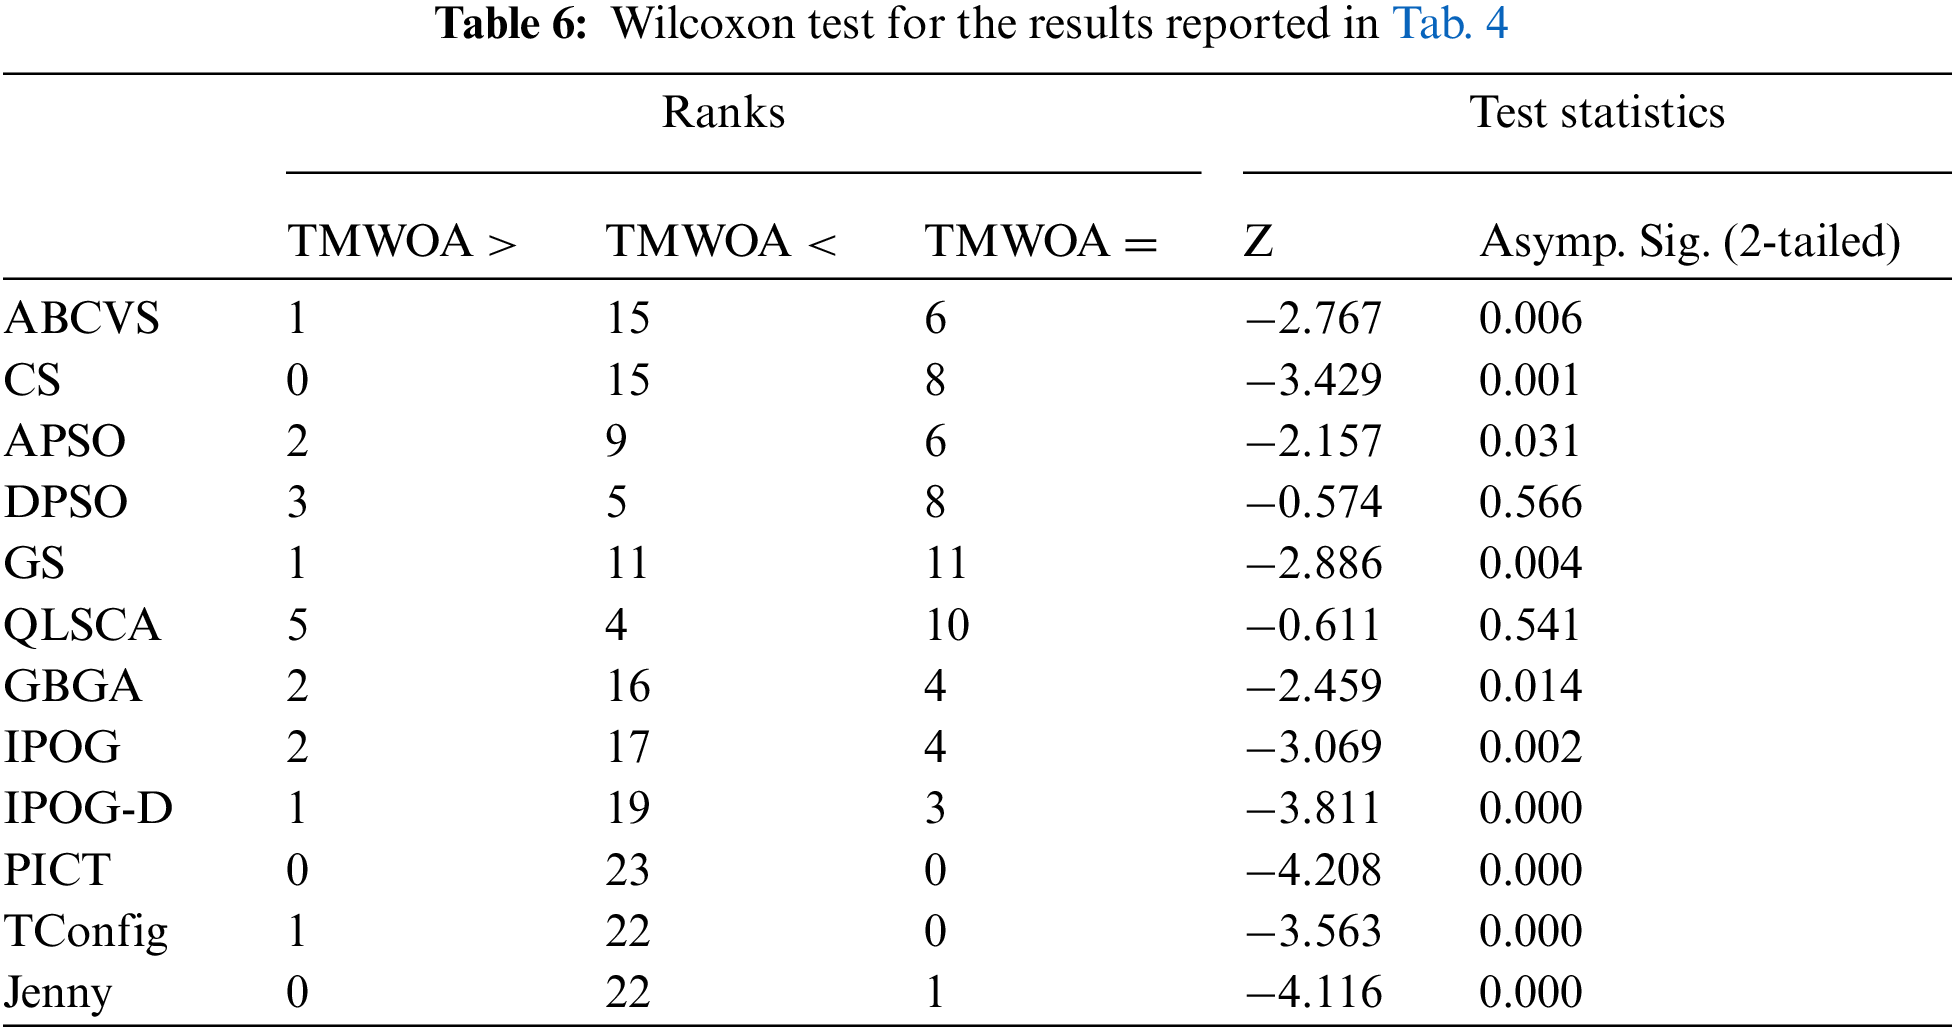
In Tab. 4, the configurations of CA (t, 3P) were adopted, where t varied as 2 ≤ t ≤ 6, p varied as 3 ≤ p ≤ 12, and v remained constant at v = 3; the results were reported in terms of the best and average among the 31 runs. The results revealed that TSWOA outperformed all the pure computational strategies and most AI-based strategies, including GBGA, GS, APSO, CS, and ABSVS. Moreover, TSWOA produced competitive results compared to QLSCA and DPSO strategies.
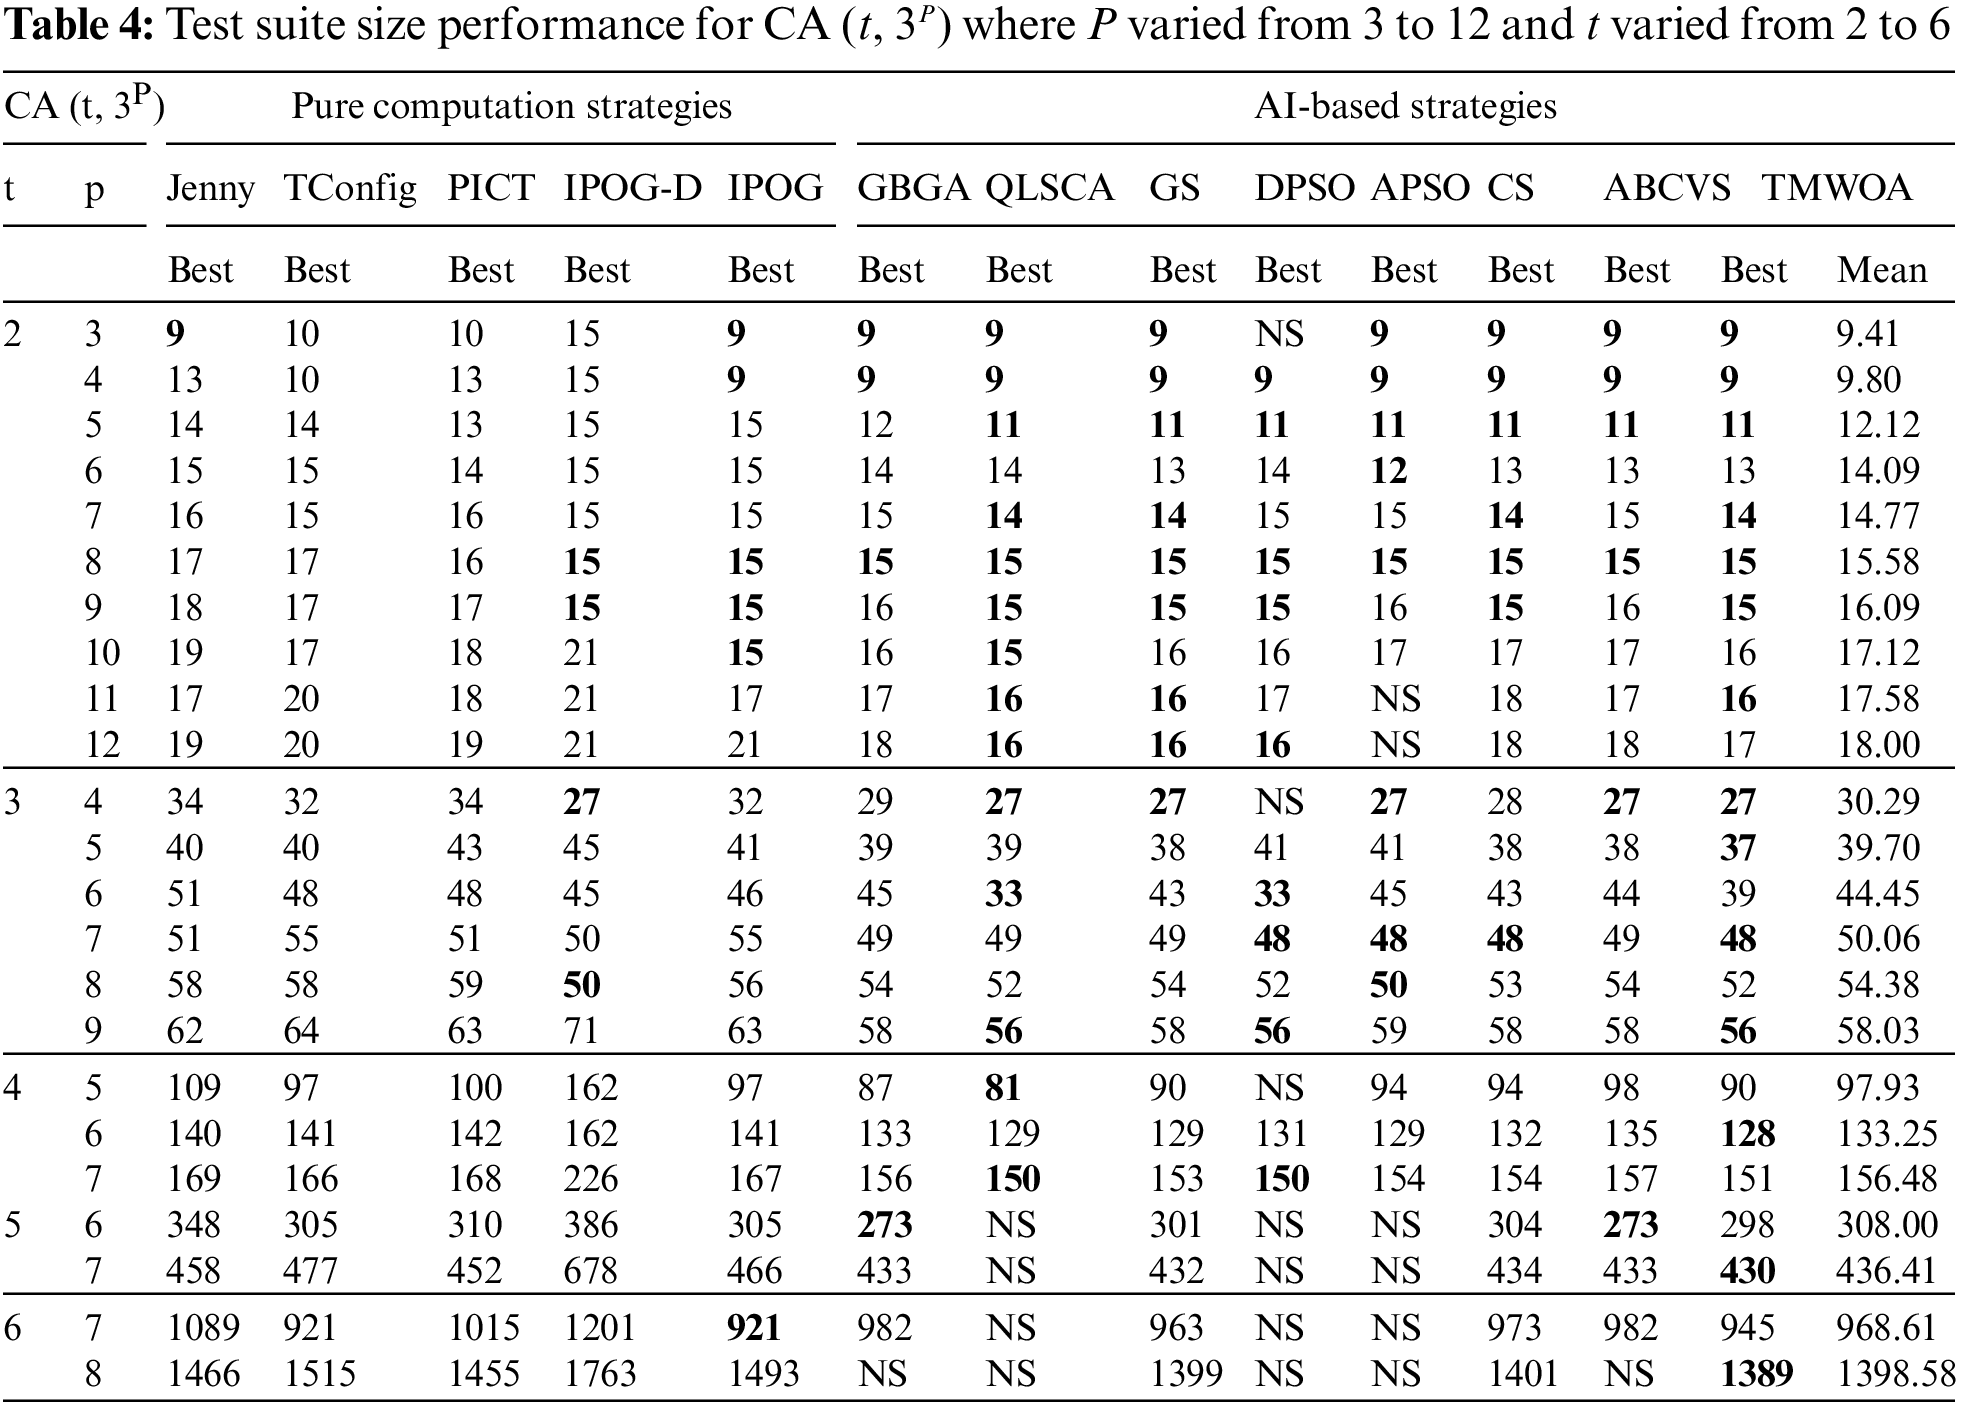
Statistically, the Wilcoxon signed-rank test was also applied to the results reported in Tab. 4. Tab. 6 presents the outcomes of the Wilcoxon signed-rank test. It was confirmed that TSWOA produced significantly different results from the GBGA, GS, APSO, CS, and ABCVS strategies, except the QLSCA and DPSO strategies. However, one may argue that there were insufficient output samples for the QLSCA and DPSO strategies to provide a comprehensive picture. Both strategies’ interaction strength was up to four (i.e., t ≤ 4).
Tab. 5, which was for CA (t, v7) configurations where t varied as 2 ≤ t ≤ 6, v varied as 2 ≤ v ≤ 7, and p remained constant at p = 7. The results showed that TSWOA outperformed the pure computational and AI-based strategies. Additionally, the Wilcoxon test was implemented on the results reported in Tab. 5, and the outcomes of the Wilcoxon test are illustrated in Tab. 7.
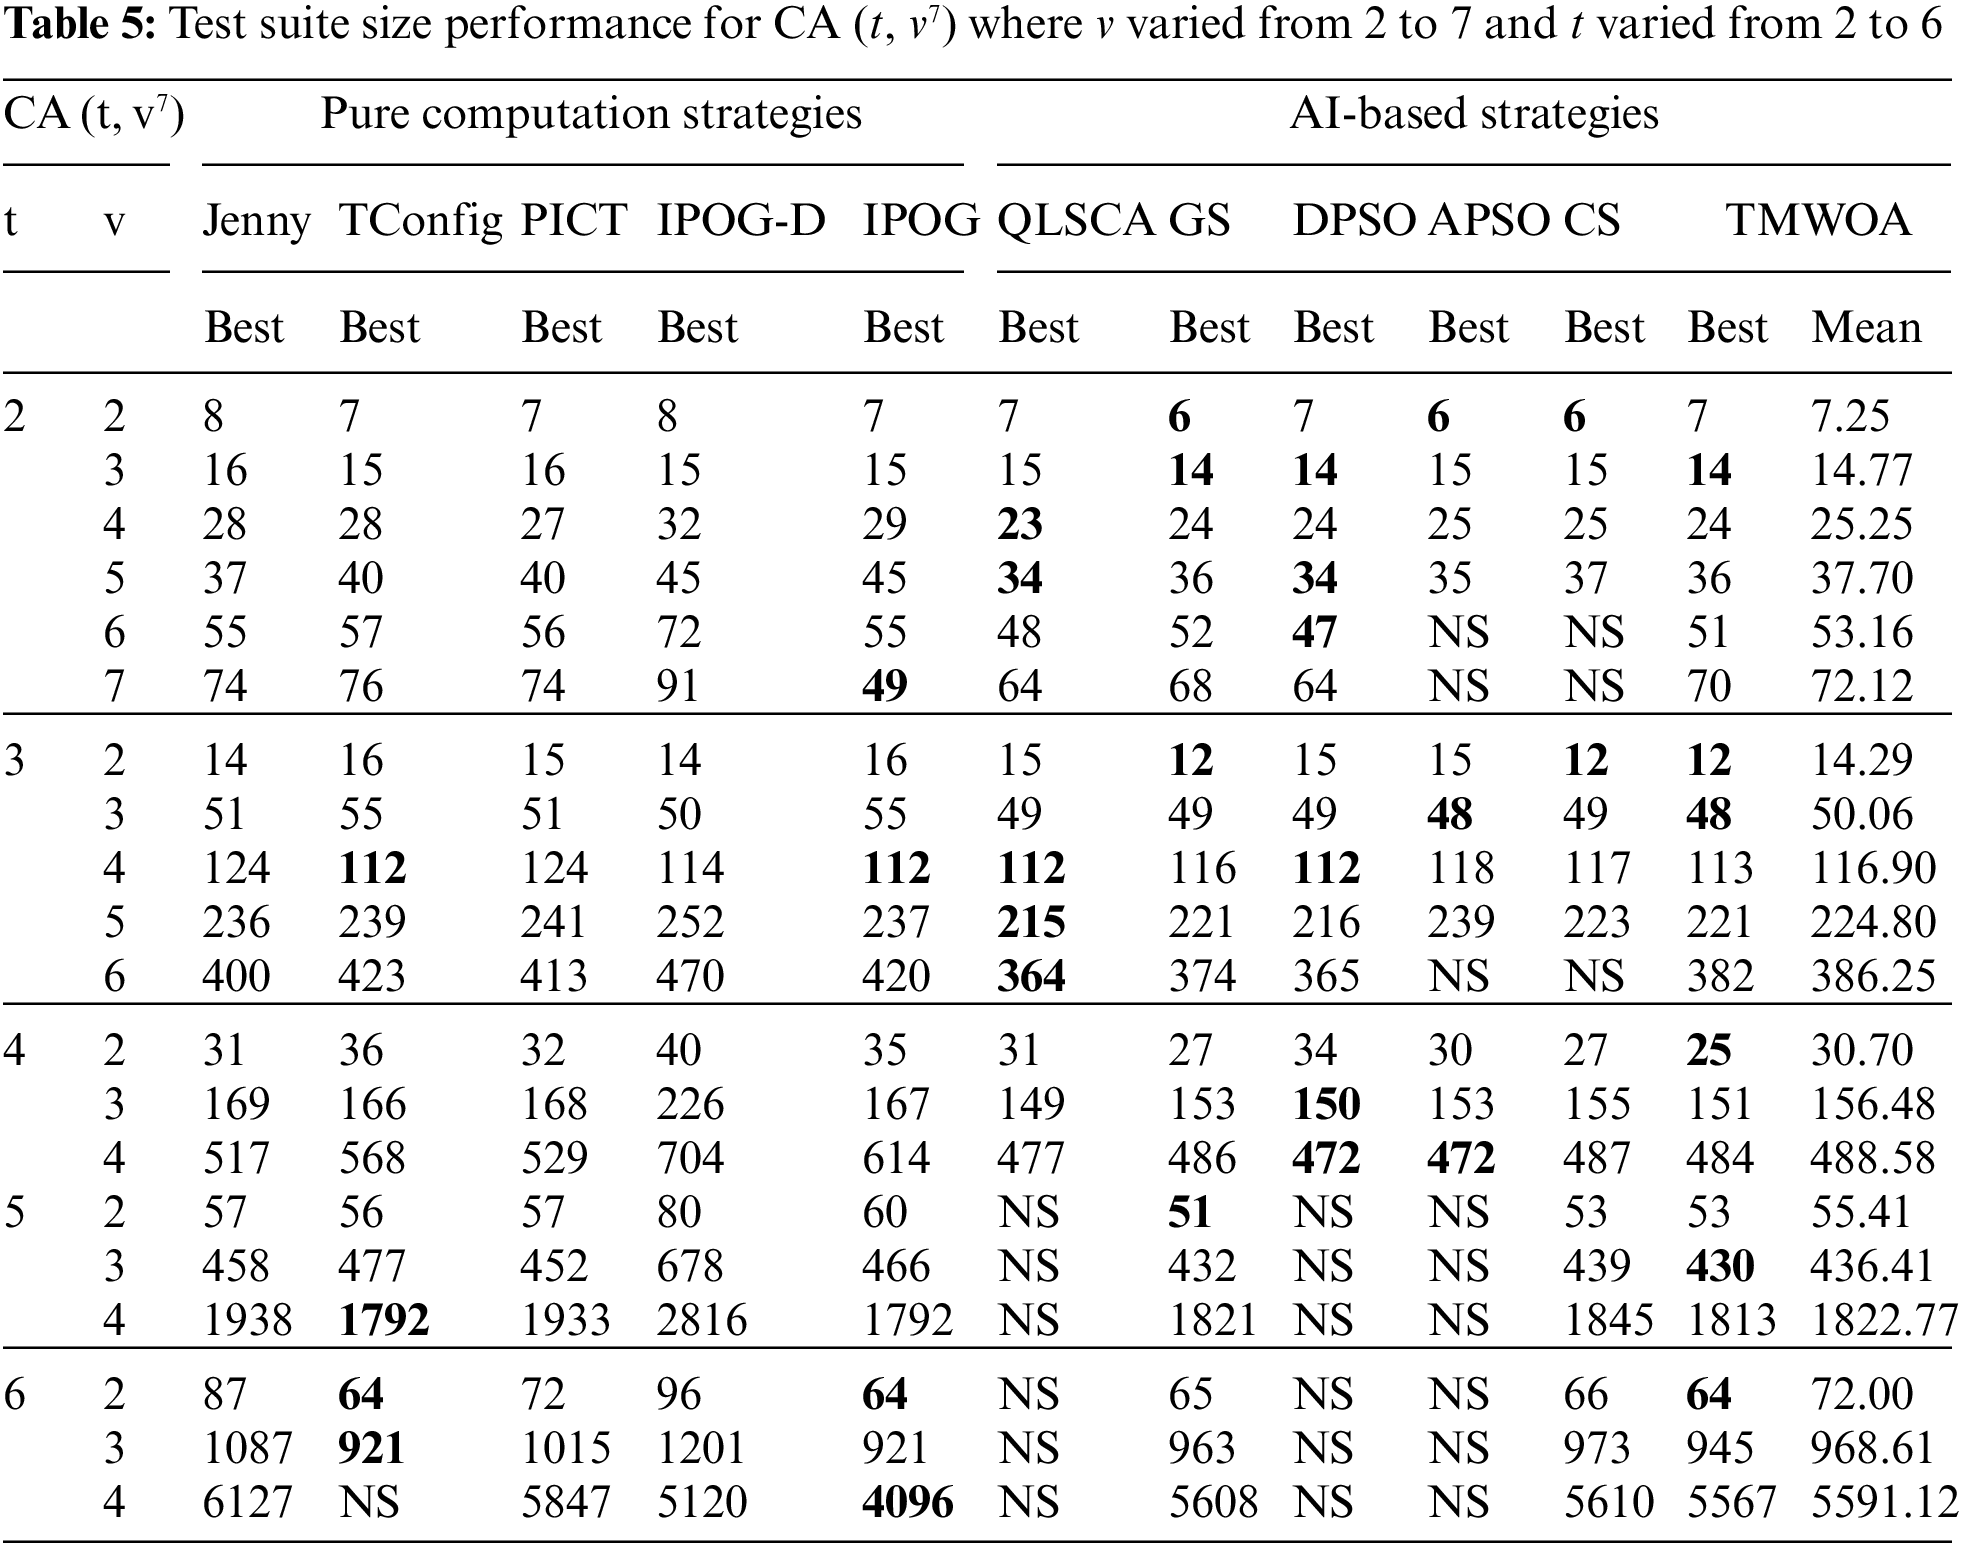
Furthermore, the results of the Wilcoxon test presented in Tabs. 6 and 7 revealed that the results of TSWOA were not significantly different from those of QLSCA and DSPO. This occurred because there were not sufficient samples to compare and test as the interaction strength of both these strategies was only up to four (i.e., t ≤ 4). Moreover, it has been demonstrated previously that the higher the interaction strength, the higher is the efficiency of the strategy (algorithm) in detecting faults [31]. Therefore, TSWOA will produce a test suite with an interaction strength of up to 20.
Based on previously reviewed metaheuristic strategies, it was noticed that most of these strategies did not support higher interaction strength. Fig. 7 depicts the maximum support of the recently developed metaheuristic strategies for interaction strength.
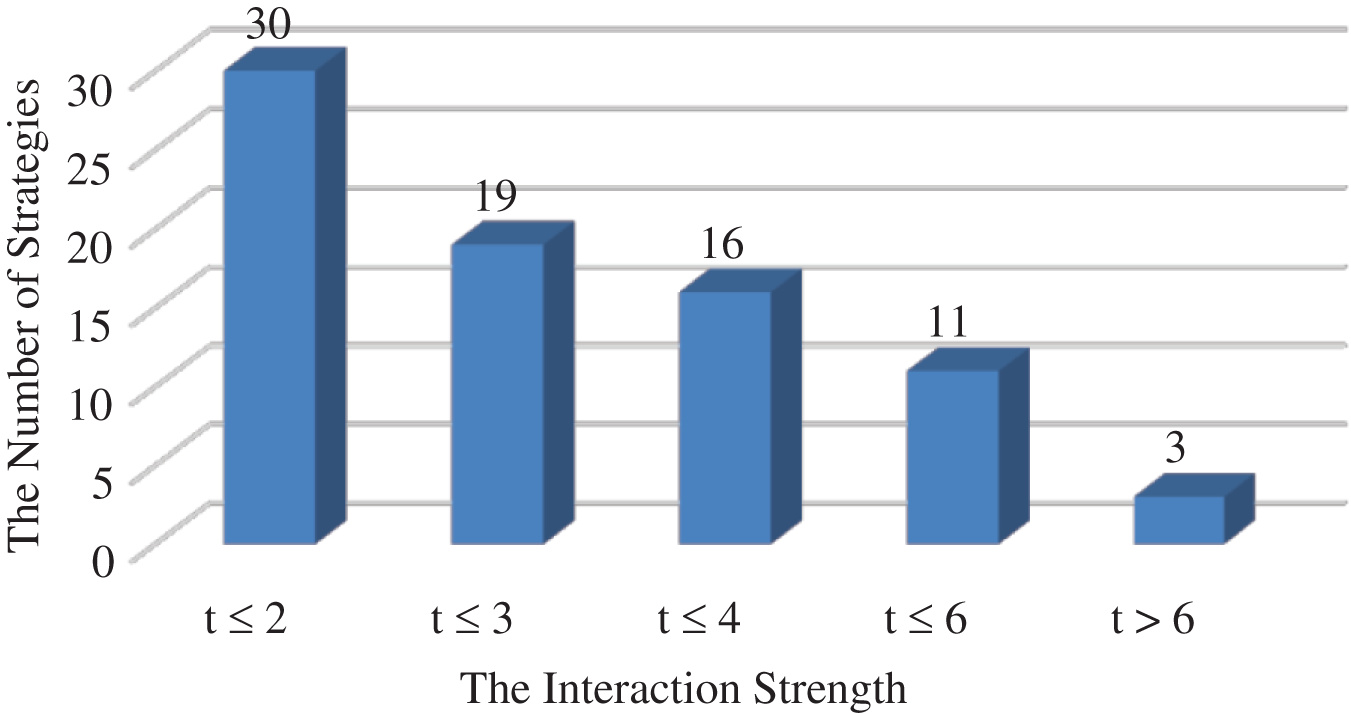
Figure 7: The Maximum support for interaction strength
Fig. 7 illustrates that most AI-based strategies produced a pairwise (i.e., t ≤ 2) test suite. Moreover, 30% of the strategies supported interaction strength of up to six. Only a few strategies went beyond that, such as the HSS [12], which supported up to 15, the GS [13], which supported up to 20, and the GSTG [19], which supported up to 10. As observed, and unlike most strategies, TSWOA supported high interaction strength.
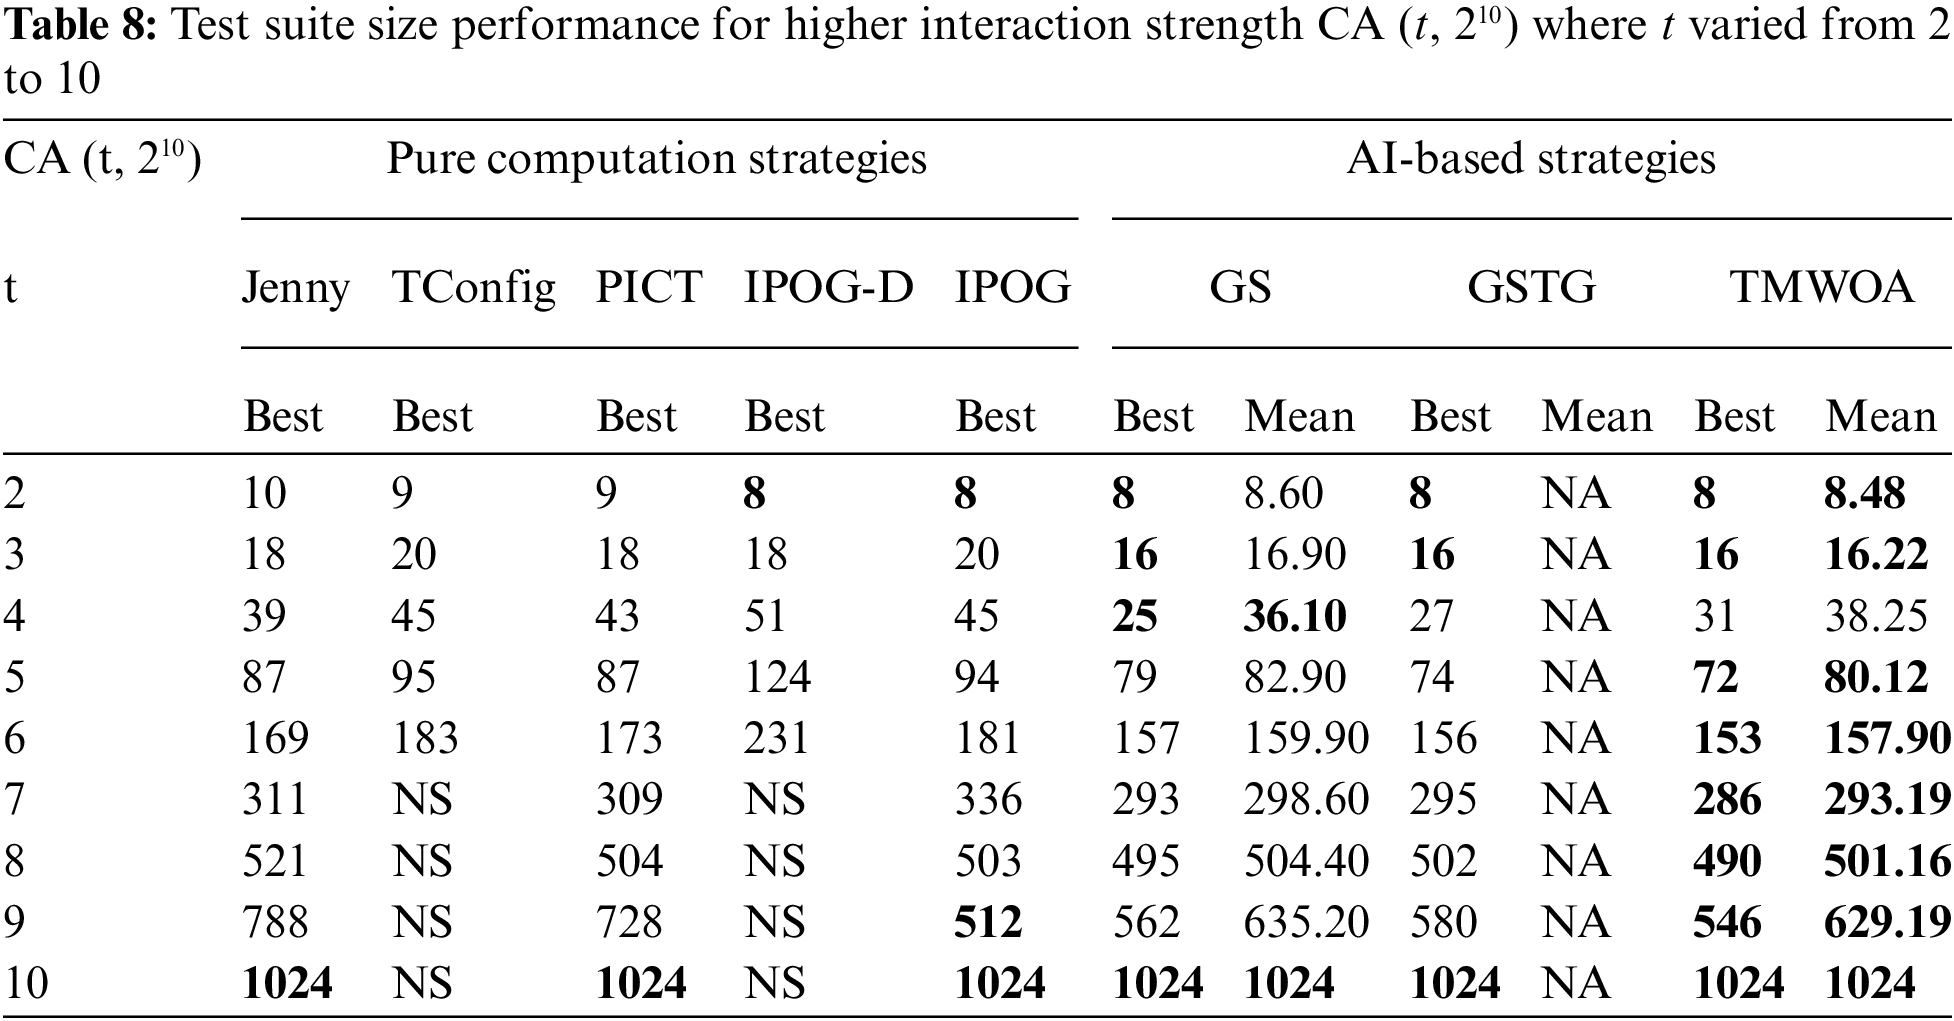
Tabs. 8 and 9 display the ability of TSWOA to process higher interaction strength of up to 10 and 20, respectively. Tab. 8 presents the results for the configuration of CA (t, 210), where t varied from 2 to 10. When t = 2, two pure computational strategies IPOG and IPOG-D, along with GS, GSTG, and TSWOA, produced the best results. While, when t = 3, GS, GSTG, and TSWOA were observed to generate the best test suite size. When t = 4, only GS produced the best results. However, for the rest of the interaction strengths up to 10, TSWOA outperformed the other strategies and had better results. This implied that the proposed variant TSWOA generated better results when the search space was larger because the larger the interaction strength, the larger the search space.
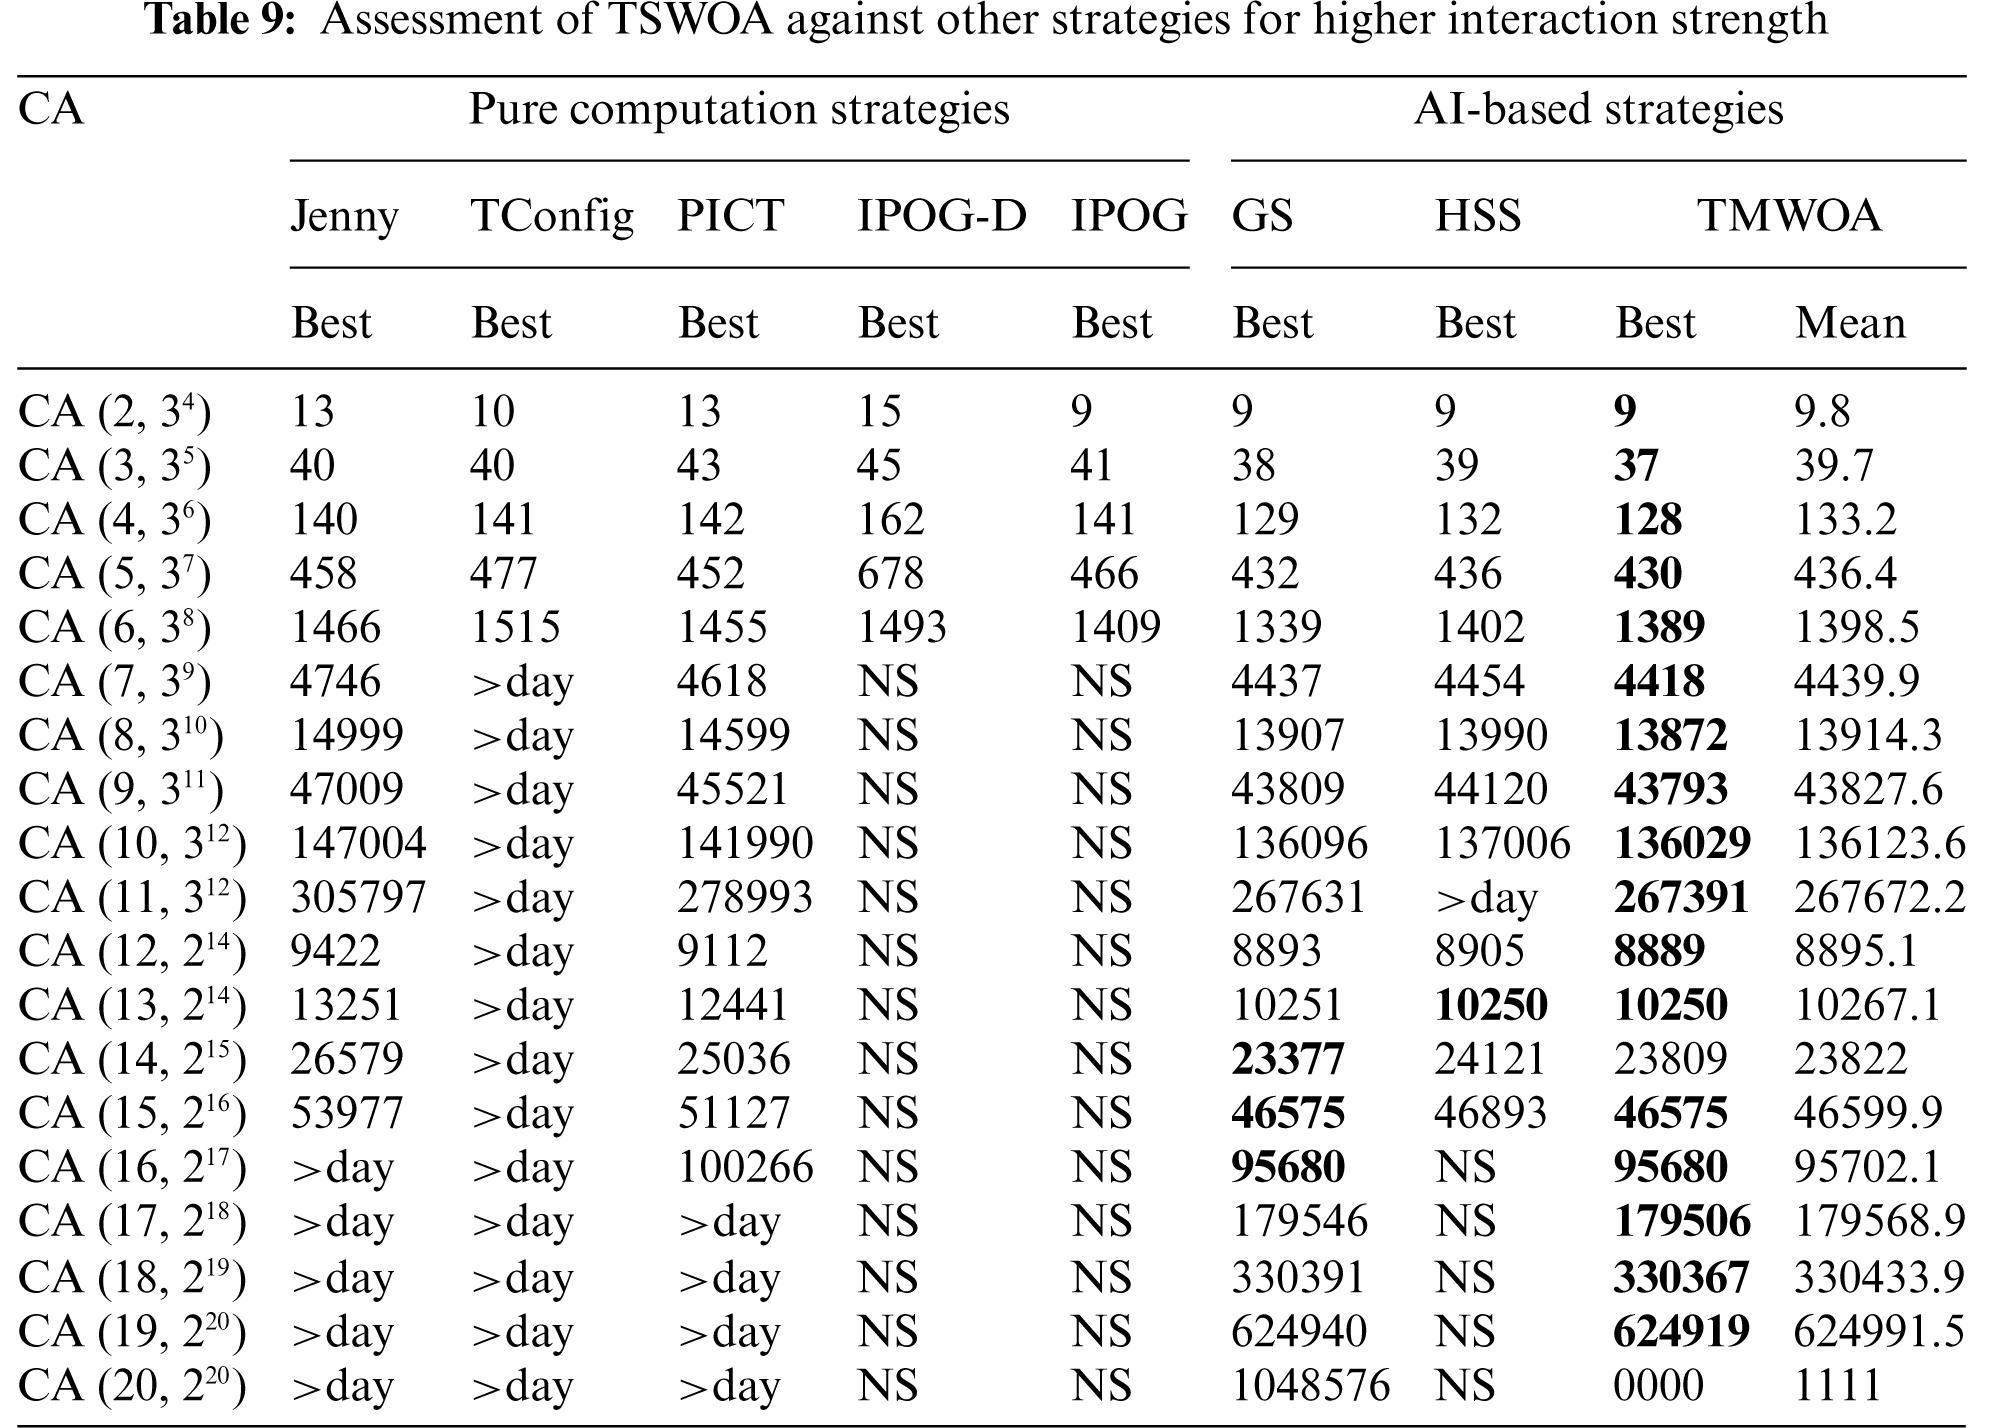
Tab. 9 presents the results for various configurations of CAs with interaction strength of up to 20. The results presented in Tab. 9 were obtained from a previously published report [13]. IPOG and IPOG-D supported interaction strength of up to 6 and did not produce better results. While PICT generated a test suite with a higher interaction strength up to 16, it took more than a day to produce the test suite for the interaction strengths greater than that. Similar observations were noted for TConfig and Jenny, where TConfig generated a test suite with interaction strengths of 6 and Jenny generated up to 16. GS and HSS developed test suites with interaction strengths up to 20 and 15, respectively. TSWOA outperformed both pure computational and AI-based strategies and generated a smaller test suite size with an interaction strength of up to 20.
It is worth mentioning that we faced threats to the validity and attempted to minimize them. During our research, we encountered a couple of threats. The first threat is that the impartiality of benchmark experiments based on meta-heuristics may be a concern. Many comparisons with similar work rely solely on published results due to a lack of source codes. The second threat is the statistical analysis focused on the best-reported values rather than the mean or average values. The main issue is that some of the best results may be obtained by chance, affecting the conclusion.
This study proposed three variants of WOA, which supported a higher interaction strength of up to 20 (i.e., 2 ≤ t ≤ 20), unlike most AI-based strategies. The proposed variants of WOA were developed through structure modification (SWOA), incorporation of the acceptance probability of the EMC-FC algorithm (TWOA), and a combination of both SWOA and TWOA (TSWOA). The results of the experiments indicated that the proposed variants of WOA effectively managed to overcome the issue of premature convergence and escaped the local optima. Moreover, TSWOA performed better than the other variants by statistically generating smaller test suite sizes. Furthermore, the TSWOA variant performed better than the pure computational-based strategies by statistically generating smaller test suite sizes. Further, it outperformed most of the existing AI-based strategies by conducting various experiments on different configurations. Additionally, the experimental results illustrated that TSWOA could support higher interaction strengths up to 20 while competing against other state-of-the-art strategies in terms of efficiency and performance. The higher the interaction strength, the more time it takes to produce test suites. Higher interaction strength would exponentially increase the search space (i.e., the t-tuple table). Within the context of the future work to be conducted by our research group, this report extends the possibility of TSWOA to support variable strength t-way testing with constraints.
Acknowledgement: The authors are grateful to the Ministry of Education, Malaysia, and the Universiti Kebangsaan Malaysia for their support. Ali Abdullah Hassan would like to express his gratitude to Hadhramout Foundation in Yemen for their tuition fee support.
Funding Statement: This work was supported by the Ministry of Education, Malaysia (FRGS /1/2019/ICT02/UKM/01/1) and the Universiti Kebangsaan Malaysia (DIP-2016-024).
Conflicts of Interest: The authors declare that they have no known competing financial interests or personal relationships that could have influenced the work reported in this paper.
1. P. M. Pontes, B. Lima and J. P. Faria, “Izinto: A pattern-based IoT testing framework,” in Companion Proc. ISSTA/ECOOP, 2018 Workshops, Amsterdam, Netherlands, pp. 125–131, 2018. [Google Scholar]
2. A. H. Ronneseth and C. J. Colbourn, “Merging covering arrays and compressing multiple sequence alignments,” Discrete Applied Mathematics, vol. 157, no. 9, pp. 2177–2190, 2009. [Google Scholar]
3. D. R. Kuhn, D. R. Wallace and A. M. Gallo, “Software fault interactions and implications for software testing,” IEEE Transactions on Software Engineering, vol. 30, no. 6, pp. 418–421, 2004. [Google Scholar]
4. B. Jenkins, “Jenny test tool,” Online Tool, 2016. [Google Scholar]
5. A. W. Williams, Determination of test configurations for pair-wise interaction coverage. In: Testing of Communicating Systems. Vol. 48. Boston, MA: Springer, pp. 57–59, 2000. [Google Scholar]
6. J. Czerwonka, “Pairwise testing in real-world: Practical extensions to test case generators,” in Proc. of the 24th Pacific Northwest Software Quality Conf., Portland, Oregon, USA, vol. 45, pp. 419–430, 2006. [Google Scholar]
7. Y. Lei, R. Kacker, D. R. Kuhn, V. Okun and J. Lawrence, “A general strategy for t-way software testing,” in 14th Annual IEEE Int. Conf. and Workshops on the Engineering of Computer-Based Systems (ECBS’07), Tucson, AZ, USA, pp. 549–556, 2007. [Google Scholar]
8. Y. Lei, R. Kacker, D. R. Kuhn, V. Okun and J. Lawrence, “Efficient test generation for multi-way combinatorial testing,” Software Testing, Verification and Reliability, vol. 18, no. 3, pp. 125–148, 2008. [Google Scholar]
9. J. Stardom, “Metaheuristics and the search for covering and packing arrays [microform],” Ph.D. dissertation, Simon Fraser University, British Columbia, Canada, 2001. [Google Scholar]
10. B. S. Ahmed, K. Z. Zamli and C. P. Lim, “Application of particle swarm optimization to uniform and variable strength covering array construction,” Applied Soft Computing, vol. 12, no. 4, pp. 1330–1347, 2012. [Google Scholar]
11. T. Shiba, T. Tsuchiya and T. Kikuno, “Using artificial life techniques to generate test cases for combinatorial testing,” in Proc. of the 28th Annual Int. Computer Software and Applications Conf., COMPSAC, Hong Kong, China, pp. 72–77, 2004. [Google Scholar]
12. A. R. A. Alsewari and K. Z. Zamli, “Design and implementation of a harmony-search-based variable-strength t-way testing strategy with constraints support,” Information and Software Technology, vol. 54, no. 6, pp. 553–568, 2012. [Google Scholar]
13. S. Esfandyari and V. Rafe, “A tuned version of genetic algorithm for efficient test suite generation in interactive t-way testing strategy,” Information and Software Technology, vol. 94, pp. 165–185, 2018. [Google Scholar]
14. M. Ayob and G. Kendall, “A monte carlo hyper-heuristic to optimise component placement sequencing for multi head placement machine,” in Proc. of the Int. Conf. on Intelligent Technologies, InTech, Chiang Mai, Thailand, vol. 3, pp. 132–141, 2003. [Google Scholar]
15. C. J. Colbourn, “Combinatorial aspects of covering arrays,” Le Matematiche, vol. 59, no. 1, 2, pp. 125–172, 2004. [Google Scholar]
16. B. S. Ahmed and K. Z. Zamli, “PSTG: a t-way strategy adopting particle swarm optimization,” in Fourth Asia Int. Conf. on Mathematical/Analytical Modelling and Computer Simulation, Kota Kinabalu, Malaysia, pp. 1–5, 2010. [Google Scholar]
17. H. Wu, C. Nie, F. C. Kuo, H. Leung and C. J. Colbourn, “A discrete particle swarm optimization for covering array generation,” IEEE Transactions on Evolutionary Computation, vol. 19, no. 4, pp. 575–591, 2014. [Google Scholar]
18. B. S. Ahmed, T. S. Abdulsamad and M. Y. Potrus, “Achievement of minimized combinatorial test suite for configuration-aware software functional testing using the cuckoo search algorithm,” Information and Software Technology, vol. 66, pp. 13–29, 2015. [Google Scholar]
19. K. M. Htay, R. R. Othman, A. Amir and J. M. H. Alkanaani, “Gravitational search algorithm based strategy for combinatorial t-way test suite generation,” Journal of King Saud University-Computer and Information Sciences, In Press, 2021. [Google Scholar]
20. T. Mahmoud and B. S. Ahmed, “An efficient strategy for covering array construction with fuzzy logic-based adaptive swarm optimization for software testing use,” Expert Systems with Applications, vol. 42, no. 22, pp. 8753–8765, 2015. [Google Scholar]
21. K. Z. Zamli, B. S. Ahmed, T. Mahmoud and W. Afzal, “Fuzzy adaptive tuning of a particle swarm optimization algorithm for variable-strength combinatorial test suite generation,” 2018. [Online]. Available: https://arxiv.org/abs/1810.05824. [Google Scholar]
22. A. K. Alazzawi, H. M. Rais, S. Basri, Y. A. Alsariera, L. F. Capretz et al., “HABCSm: A hamming based t-way strategy based on hybrid artificial bee colony for variable strength test sets generation,” 2021. [Online]. Available: https://arxiv.org/abs/2110.03728. [Google Scholar]
23. K. Z. Zamli, F. Din, B. S. Ahmed and M. Bures, “A hybrid Q-learning sine-cosine-based strategy for addressing the combinatorial test suite minimization problem,” PLOS ONE, vol. 13, no. 5, pp. e0195675, 2018. [Google Scholar]
24. J. Torres-Jimenez and J. C. Perez-Torres, “A greedy algorithm to construct covering arrays using a graph representation,” Information Sciences, vol. 477, no. 2, pp. 234–245, 2019. [Google Scholar]
25. A. K. Alazzawi, H. M. Rais and S. Basri, “ABCVS: An artificial bee colony for generating variable T-Way test sets,” International Journal of Advanced Computer Science and Applications, vol. 10, no. 4, pp. 259–274, 2019. [Google Scholar]
26. D. H. Wolpert and W. G. Macready, “No free lunch theorems for optimization,” IEEE Transactions on Evolutionary Computation, vol. 1, no. 1, pp. 67–82, 1997. [Google Scholar]
27. S. Mirjalili and A. Lewis, “The whale optimization algorithm,” Advances in Engineering Software, vol. 95, no. 12, pp. 51–67, 2016. [Google Scholar]
28. A. A. Hassan, S. Abdullah, K. Z. Zamli and R. Razali, “Combinatorial test suites generation strategy utilizing the whale optimization algorithm,” IEEE Access, vol. 8, pp. 192288–192303, 2020. [Google Scholar]
29. G. Kaur and S. Arora, “Chaotic whale optimization algorithm,” Journal of Computational Design and Engineering, vol. 5, no. 3, pp. 275–284, 2018. [Google Scholar]
30. M. Abdel-Basset, G. Manogaran, D. El-Shahat and S. Mirjalili, “A hybrid whale optimization algorithm based on local search strategy for the permutation flow shop scheduling problem,” Future Generation Computer Systems, vol. 85, no. 1, pp. 129–145, 2018. [Google Scholar]
31. S. Abdullah, N. R. Sabar, M. Z. A. Nazri and M. Ayob, “An exponential monte-carlo algorithm for feature selection problems,” Computers & Industrial Engineering, vol. 67, no. 10, pp. 160–167, 2014. [Google Scholar]
 | This work is licensed under a Creative Commons Attribution 4.0 International License, which permits unrestricted use, distribution, and reproduction in any medium, provided the original work is properly cited. |