DOI:10.32604/cmc.2022.026729
| Computers, Materials & Continua DOI:10.32604/cmc.2022.026729 | |
| Article |
Evolutionary Intelligence and Deep Learning Enabled Diabetic Retinopathy Classification Model
1MIS Department, College of Business Administration, University of Business and Technology, Jeddah, 21448, Saudi Arabia
2Department of Computer Science, Faculty of Information Technology, Al-Hussein Bin Talal University, Ma’an, 71111, Jordan
3School of Engineering, Princess Sumaya University for Technology, Amman, 11941, Jordan.
*Corresponding Author: Bassam A. Y. Alqaralleh. Email: b.alqaralleh@ubt.edu.sa
Received: 03 January 2022; Accepted: 18 March 2022
Abstract: Diabetic Retinopathy (DR) has become a widespread illness among diabetics across the globe. Retinal fundus images are generally used by physicians to detect and classify the stages of DR. Since manual examination of DR images is a time-consuming process with the risks of biased results, automated tools using Artificial Intelligence (AI) to diagnose the disease have become essential. In this view, the current study develops an Optimal Deep Learning-enabled Fusion-based Diabetic Retinopathy Detection and Classification (ODL-FDRDC) technique. The intention of the proposed ODL-FDRDC technique is to identify DR and categorize its different grades using retinal fundus images. In addition, ODL-FDRDC technique involves region growing segmentation technique to determine the infected regions. Moreover, the fusion of two DL models namely, CapsNet and MobileNet is used for feature extraction. Further, the hyperparameter tuning of these models is also performed via Coyote Optimization Algorithm (COA). Gated Recurrent Unit (GRU) is also utilized to identify DR. The experimental results of the analysis, accomplished by ODL-FDRDC technique against benchmark DR dataset, established the supremacy of the technique over existing methodologies under different measures.
Keywords: Optimization algorithms; medical images; diabetic retinopathy; deep learning; fusion model
Diabetes Mellitus is a life-threatening disease that has affected 463 million people across the globe and its prevalence is expected to increase up to 700 million by 2045 [1]. Also, one third of diabetics suffer from Diabetic Retinopathy (DR), an eye disease that is interrelated to diabetes and is increasingly more popular. DR is characterized by advanced vascular disruption in the retina that results in chronic hyperglycemia and it progresses in the diabetics, nevertheless of its seriousness. Globally, it is the major cause of blindness amongst working age adults and is diagnosed among 93 million people [2]. Further, DR is predicted to increase even more, owing to high prevalence rate of diabetes in developing Asian countries like China and India [3].
DR is highly asymptomatic in early stages during when neural retinal damages and medically-invisible microvascular changes occur. Therefore, diabetic patients must undergo periodic eye screening followed by appropriate diagnoses and succeeding management of the condition to save themselves from vision loss [4]. With only protective measures in hand, such as the control of hypertension, hyperglycemia, and hyperlipidemia, early diagnosis of DR is inevitable. Furthermore, with respect to its treatment methods, the intervention methods that are currently available include laser photocoagulation which considerably reduces the possibility of blindness in diabetic maculopathy and proliferative retinopathy up to 98%. This high rate of revival is possible, only when the disease is diagnosed at early stages and cured immediately [5]. Appropriate treatment and early diagnosis are the only preventive measures that can be taken proactively to prevent or delay blindness from DR.
Regular screening of DR patients and their exploding growth rate in India advocate the requirement for an automated screening method for early diagnosis of DR [6]. Timely treatment, earlier detection, and frequent screening are the essential components to be followed in addition to automated diagnosis for preventing blindness. In this background, it is challenging to diagnose the retinal pathologies as it is not readily apparent from retinal images, particularly during early stages. Nonetheless, the present Computer-aided image processing methods have proved their capacity in accurately detecting the abnormal patterns connected to the disease [7]. Blood vessel segmentation is generally regarded as an early stage in building CAD tools. So, several methodologies have been introduced in the last few decades to remove blood vessels from retinographic images through classical image processing and automated learning models [8]. The current Deep Learning (DL) method, including Convolutional Neural Network (CNN), seems to be an optimum choice for automated diagnosis of ailments in digital healthcare images [9,10]. The implementation of CNN has increased in the recent years, with the emergence of supportive tools including activation functions namely, Batch Normalization (BN), Rectified Linear Unit (RLU), Dropout regularization, and so on.
The current study develops an Optimal Deep Learning enabled Fusion based Diabetic Retinopathy Detection and Classification (ODL-FDRDC) technique. Besides, the proposed ODL-FDRDC technique involves region growing segmentation to determine the infected regions. In addition, two DL models namely, CapsNet and MobileNet are fused together for feature extraction process. The hyperparameter tuning of these models is performed via Coyote Optimization Algorithm (COA). Finally, Gated Recurrent Unit (GRU) is utilized in the identification of DR. The experimental analysis results accomplished by ODL-FDRDC technique against benchmark DR dataset established the model’s superiority under distinct aspects.
Rest of the paper is arranged as follows. Section 2 offers information about related works, Section 3 discusses about the proposed model, Section 4 details the experimental results, and Section 5 concludes the study.
Qummar et al. [11] made use of a widely-accessible Kaggle data set that contains retinal images to train an ensemble of five DCNN systems (Dense169, Resnet50, Inceptionv3, Xception and Dense121) in encrypting the rich features. The study was aimed at enhancing the classification accuracy during different phases of DR. The simulation results show that the presented method identified each stage of DR in a different manner compared to existing methodologies and achieved great success than the advanced techniques on similar Kaggle datasets. Beede et al. [12] defined the application of human-centric research about DL method in healthcare centers for the diagnosis of DR disease. Based on the observations and interviews conducted across 11 healthcare centers in Thailand, the study covered information on present eye-screening systems, user expectations for AI-enabled screening process, and post-deployment experience. The results showed that many socio-environment factors affect patient experience, nursing workflows, and the performance of the method.
In literature [13], the researchers used a dataset as DR data set which was gathered from UCI-ML repository. During inception, the new data set was normalized by Standard scalar method following which PCA system was utilized in the extraction of essential attributes. Furthermore, firefly algorithm was executed to reduce the number of dimensions. This reduced dataset was then fed into DNN system for classification. Li et al. [14] validated and presented a deep ensemble model for diagnosing Diabetic Macular Oedema (DMO) and DR using retina fundus images. The researcher collected 8,739 retina fundus images from a retrospective cohort of 3285 persons. In order to detect DMO and DR, several enhanced Inception-v4 ensembling models were proposed. The study evaluated the efficacy of the algorithm and compared it against human expertise on initial dataset. Further, its generalization was measured on the widely accessible Messidor-2 data set as well. Murcia et al. [15] introduced CAD tools that leverage the efficiency rendered by DL architecture in image analysis process. The presented model depends on a deep residual CNN to extract discriminative features without any previous complex image transformation. This is done so to highlight specific structures or enhance the quality of the image. Additionally, the study also employed transfer learning method to reuse the layers from DNN. This was trained earlier using ImageNet data set, under the hypothesis that the initial layer captures abstract features that could be reutilized for diverse challenges.
In current study, a novel ODL-FDRDC technique has been developed to identify and categorize different grades of DR using retinal fundus images. The proposed ODL-FDRDC technique encompasses preprocessing, region-growing segmentation, fusion-based feature extraction, COA-based hyperparameter optimization, and GRU-based classification processes. The hyperparameter tuning of the fusion models is performed via COA. Fig. 1 depicts the overall working process of the proposed ODL-FDRDC technique.
3.1 Region Growing Segmentation
In the initial stage of DR grading process, the purpose is to find out the affected regions in fundus images by following region growing segmentation approach. Region growing is a pixel-based segmentation method in which the similarity constraints including texture, intensity, etc. are considered to group the pixels into regions. Firstly, a group of pixels is combined by iteration method. Then, the seed pixels are selected along the region and the group is nurtured by grouping with adjacent pixels that are equivalent and where the region size increases. The growth of the region is terminated if the adjacent pixel does not fulfill the homogeneity conditions and the other seed pixels are selected. This procedure is repeated until each pixel in the image belongs to some region. In the presented method, both threshold and seed point selection take a decision about homogeneity constraint since it plays a significant role in improving the accuracy of segmentation. As mammograms suffer from severe intensity variations, a constant threshold selection alone does not warrant precise segmentation. Therefore, the study focuses on improving the automated DA method so as to generate an optimum threshold and seed point. The step-by-step process for region growing method is given herewith.
i) Input the abnormal images
ii) Here, t represents the enhanced thresholds created by DA
iii) Place t as seed point for region growing method
iv) Add four neighboring pixels
v) Evaluate the distance (d) between the mean of region intensity and neighboring pixels.
vi) Implement region growing when d ≤ t on four neighboring pixels and include all when they are not involved earlier in the region as well as store the coordinate of the novel pixels.
vii) Store the mean of novel region and proceed to step 2 as well as implement the region growing process till all the pixels are grouped.
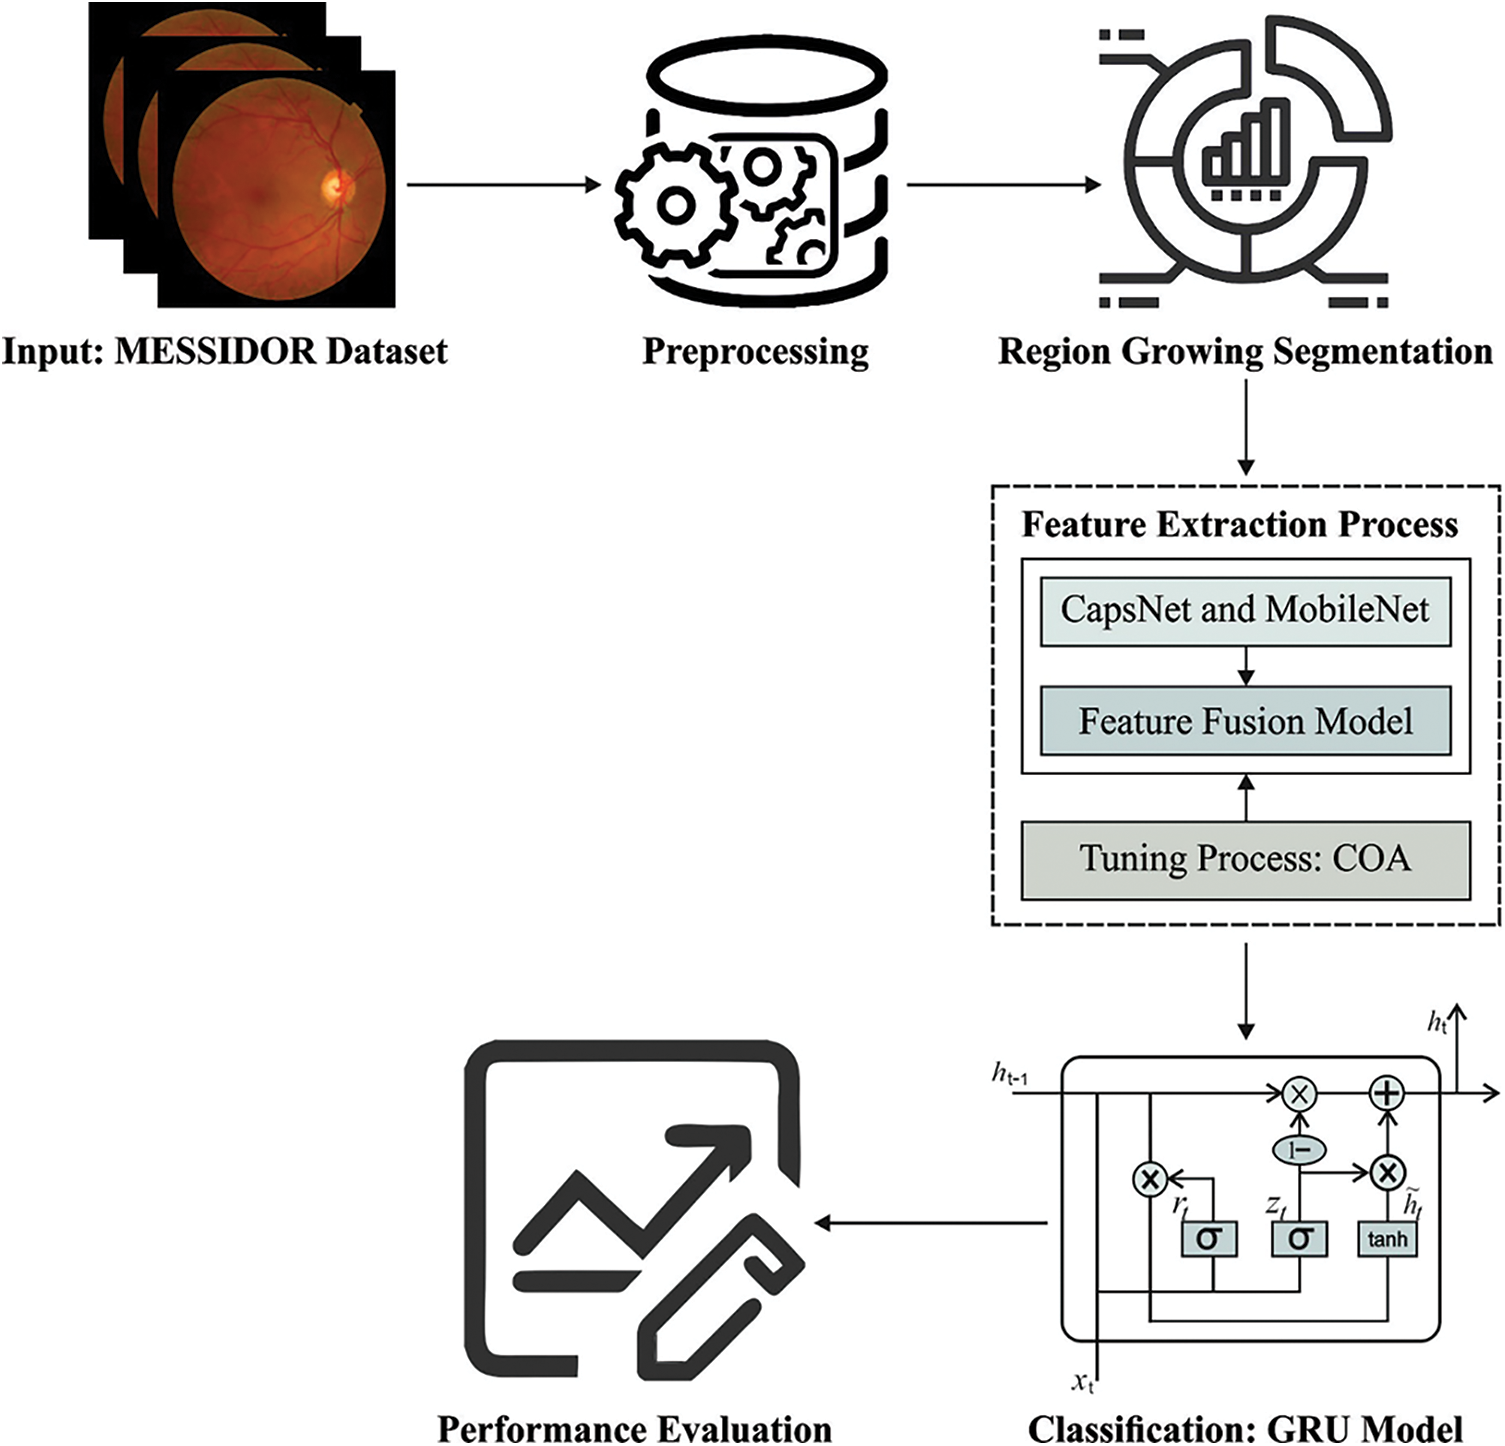
Figure 1: Working process of ODL-FDRDC technique
3.2 Fusion Based Feature Extraction
In this stage, the segmented images are fed into DL models to derive the feature vectors. Feature fusion process is performed by integrating dual feature vectors from MobileNet and CapsNet models using entropy. It is defined as follows.
Then, they are fused into a single vector which is represented herewith.
whereas
where
DL is a form of CNN which is commonly utilized in various image-processing related disease diagnosis models. It comprises of numerous connected layers with distinct weight values and activation functions. The fundamental DL model includes convolution layer, pooling layer, and connected layer. These distinct activation functions are utilized for weight adjustment. In order to overcome the limitations of the CNN, CapsNet model is presented. Being a deeper network, this model mainly comprises of capsules [16] and a collection of neurons. The activation neuron defines the features of every component in the object. Every individual capsule plays an important part in the determination of individual elements in the object and every capsule iteratively computes the total structure of objects. It saves both object element and spatial data. In comparison with CNNs, CapsNet model involves multiple layers and performs effective feature extraction process.
Here, MobileNetv2 is utilized to detect and classify DR. It includes a small structure with low computational complexity and high precision. In line with depth-wise separable convolution, MobileNet utilizes a pair of hyperparameters to maintain a tradeoff between performance and effectiveness [17]. The basic concept of MobileNet model is decomposition of convolutional kernel. With this concept, the decomposition of a typical convolution kernel takes place in two ways namely depthwise and pointwise convolutions. The former filter carries out the convolution process in all channels and is applied to integrate the outcome of depthwise convolutional layer. Therefore, N typical convolutional kernel gets substituted with M depth wise 1 × 1 convolution kernel and N pointwise convolutional kernel. MobileNet-v2 offers an extract component with inverted residual structures.
3.3 COA Based Hyperparameter Optimization Process
In order to optimally tune the hyperparameters involved in fusion models, COA is utilized [18]. COA is a novel group optimization technique presented in 2018 by Pierezan et al., and is simulated based on the performance of coyotes in North America. This technique inspires the present coyote population and its evolution that contains heuristic arbitrary coyote population combination, development, birth, and death, original-group driving-away, and new-group acceptance performance. In COA, decision variable is demonstrated by coyote social-state factor from all the dimensions of a solution vector. All the coyotes signify the solution of the candidate to a problem. The COA group contains the initial coyote population based on the rule of arbitrary equivalent distribution. Therefore, after setting the amount of coyotes from group
where
The development of coyotes from the group is nothing but the outcome of cultural interaction. It can be influenced by the alpha wolf while the cultural trends
Alpha wolf has a coyote with optimum environmental adaptation from the group. If the minimum issue is resolved, it can be determined as follows.
The cultural trend offers a situation to coyote from the group in terms of sharing data and collecting the median values of the social states of every coyote from the group. It can be identified as the act of algorithmic SI. The particular computation equation is given herewith.
where
So, the social condition of coyote after development is represented in Eq. (12):
where
Based on the laws of nature, the group coyotes give birth to cubs. Once the offspring develops, it also face death threats. The particular birth technique of these cubs is as follows.
where
The whole population becomes unstable in that individual coyote and is driven by groups followed by its acceptance as a novel group. Rest of the coyotes experience an impact in the group whereas the superior probability
With a difference in allocating cultural data to the groups, this process promotes the global cultural interchange of coyote population. In order to ensure that A is present amongst zero and one, the amount of coyotes from all groups is needed up to 14.
In this final stage, GRU model receives the feature vectors and performs classification. GRU is a different form of LSTM network which can provide the benefits of RNN method. It acquires the features automatically and successfully streamlines the long-term dependent data. It is executed to achieve short-term traffic estimate effectively [19]. In GRU networks, the cell infrastructure has hidden state which can be further related to LSTM. Intuitively, input and forget gates from LSTM are combined as a reset gate from GRU. This reset gate defines the combination of a novel input data in prior time. Another gate in GRU is named as upgrade gate which defines several data in the preceding time which are stored in present time. So, GRU is 1 gate lesser than LSTM. Besides, both cell and hidden states from LSTM are combined together as 1 hidden state in GRU. It can be altered so that the GRU networks can generate few parameters, get trained quickly and need lesser information to generalize the model efficiently. Fig. 2 illustrates the framework of GRU. The computation equation of GRU is as follows.
Eqs. (4) and (5) demonstrate that updating gate
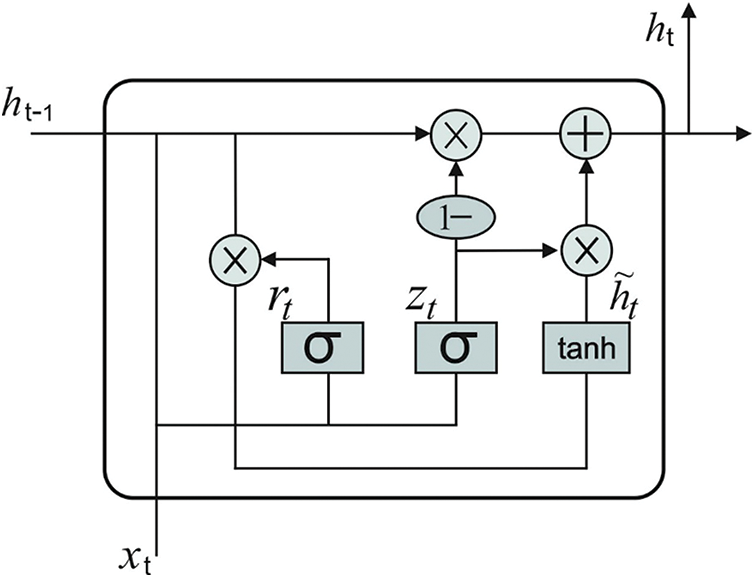
Figure 2: GRU structure
The proposed ODL-FDRDC technique was experimentally validated using MESSIDOR dataset which has a total of 1200 retinal fundus images captured in three ophthalmologic departments. The results of the proposed ODL-FDRDC technique were inspected under distinct Hidden Layers (HL). A few sample images is shown in Fig. 3.
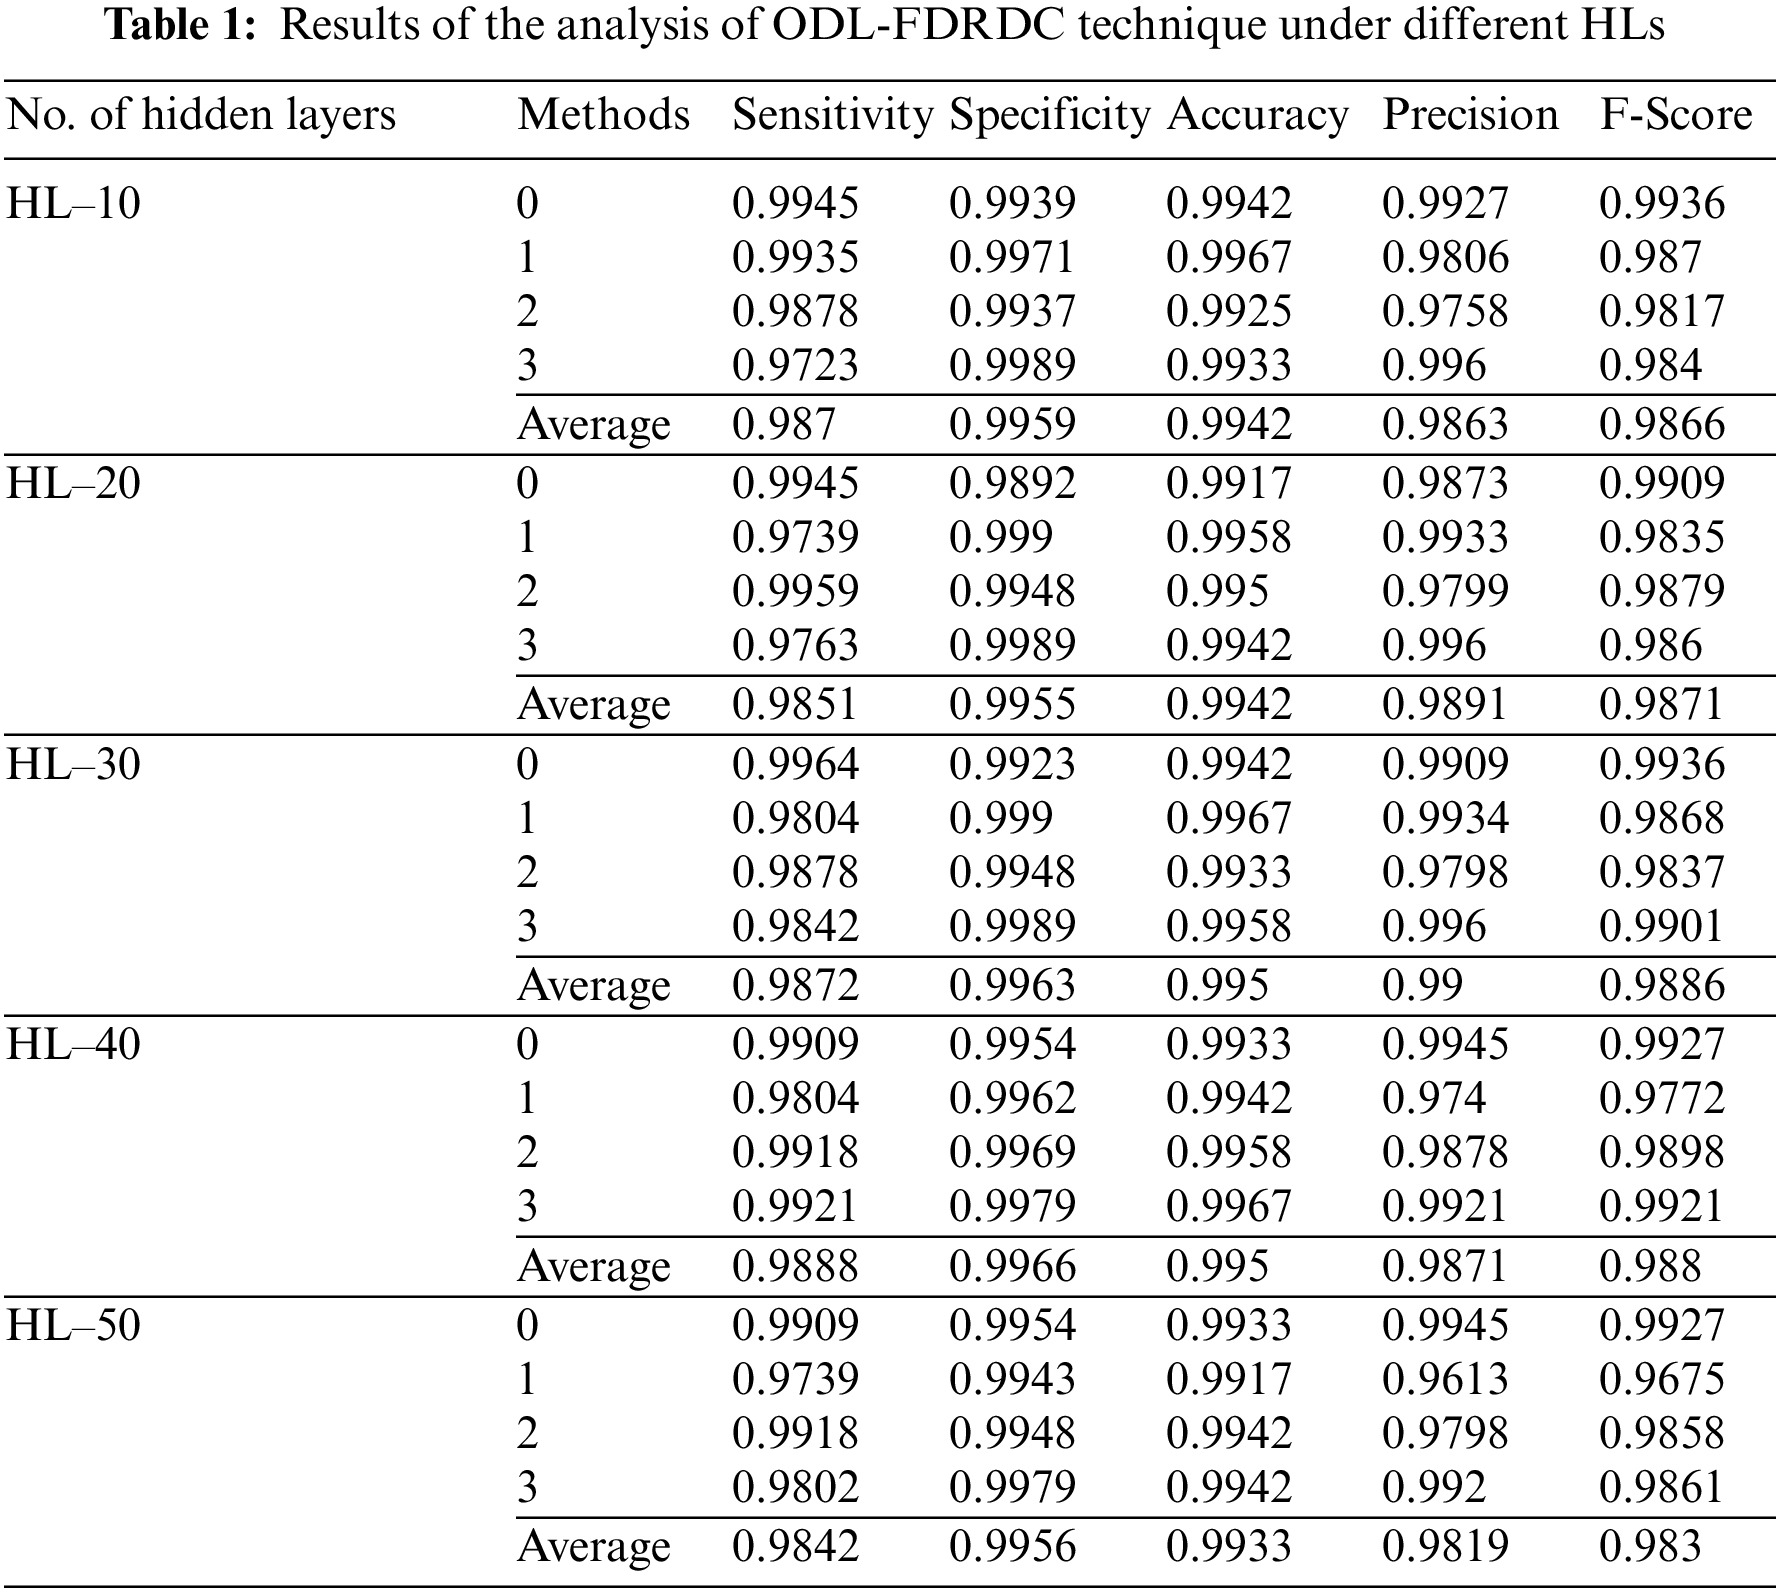
Tab. 1 provides the results for overall DR classification analysis, accomplished by ODL-FDRDC technique under distinct HLs. With an HL of 10, the proposed ODL-FDRDC technique classified the class 0 with a sensitivity (
Fig. 4 depicts the results of average DR detection analysis, accomplished by ODL-FDRDC technique. The results showcase the effective outcomes of the proposed method under distinct HLs. For instance, with 10 HLs, ODL-FDRDC technique obtained an average
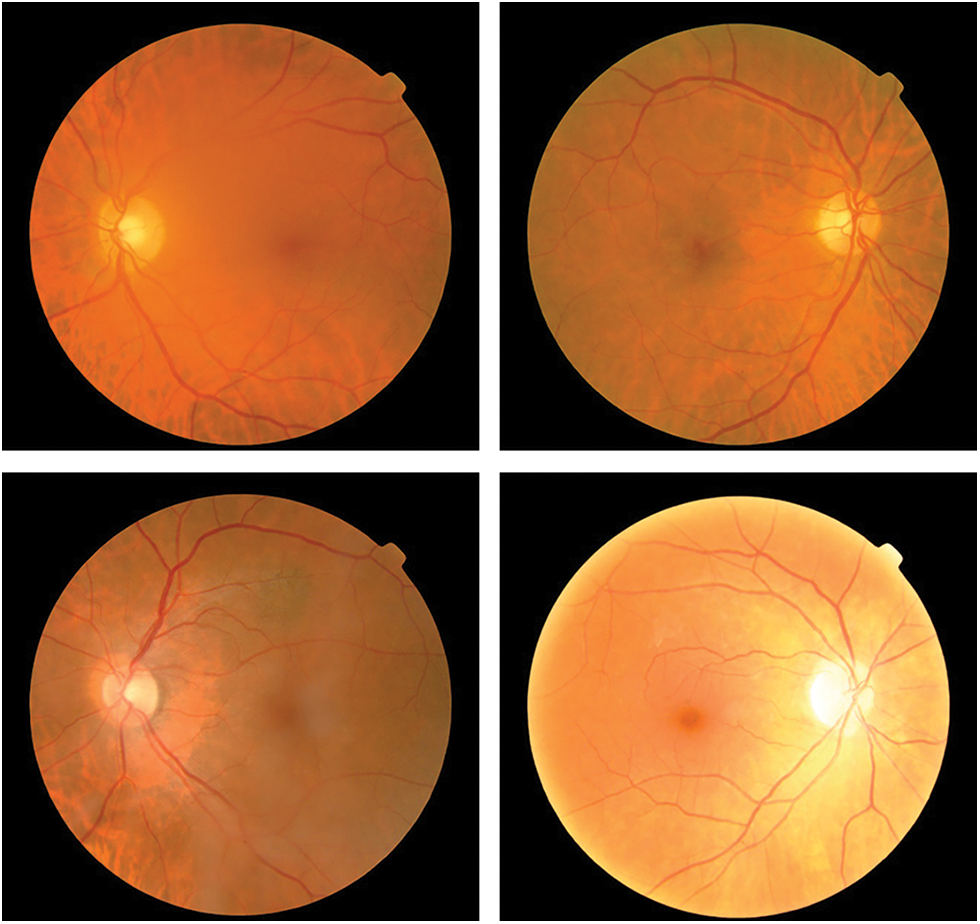
Figure 3: Sample images
ROC analysis was conducted for ODL-FDRDC technique on test DR dataset and the results are shown in Fig. 5. The results infer the enhanced classification efficiency of the proposed ODL-FDRDC technique with an increased ROC value of 99.9164%.
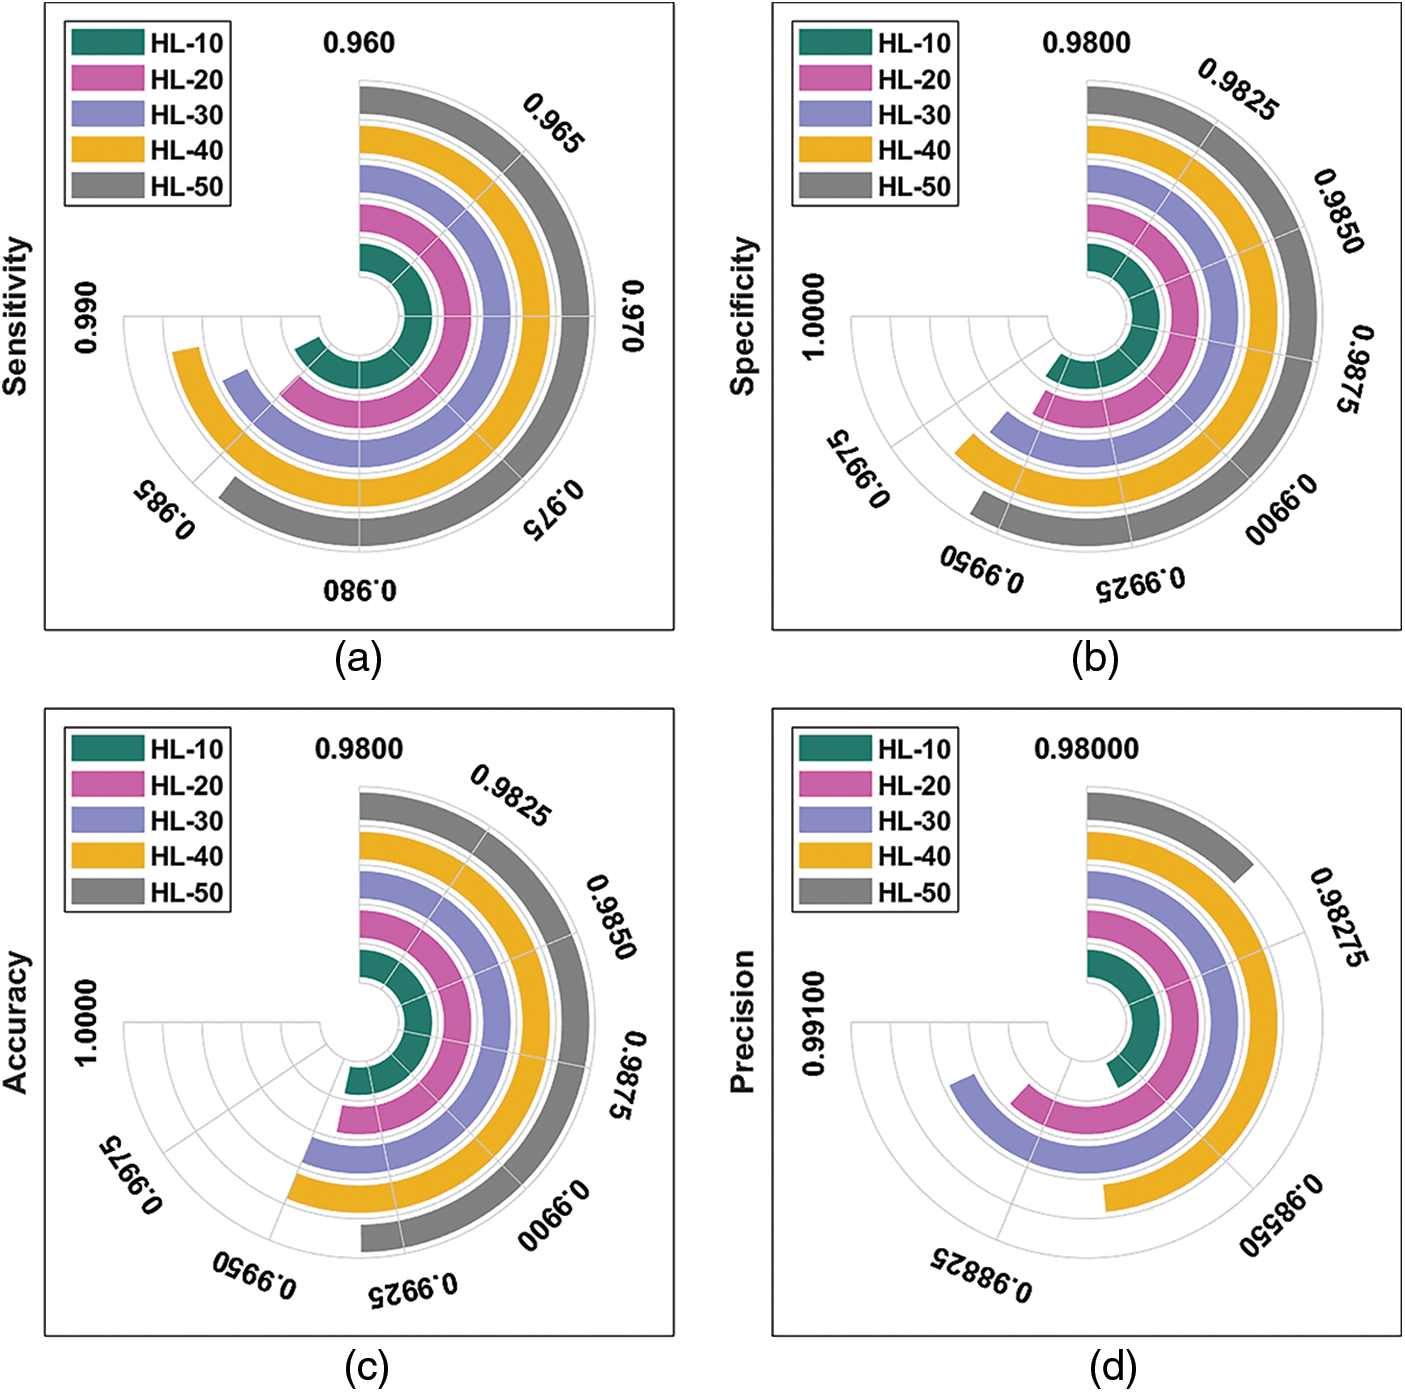
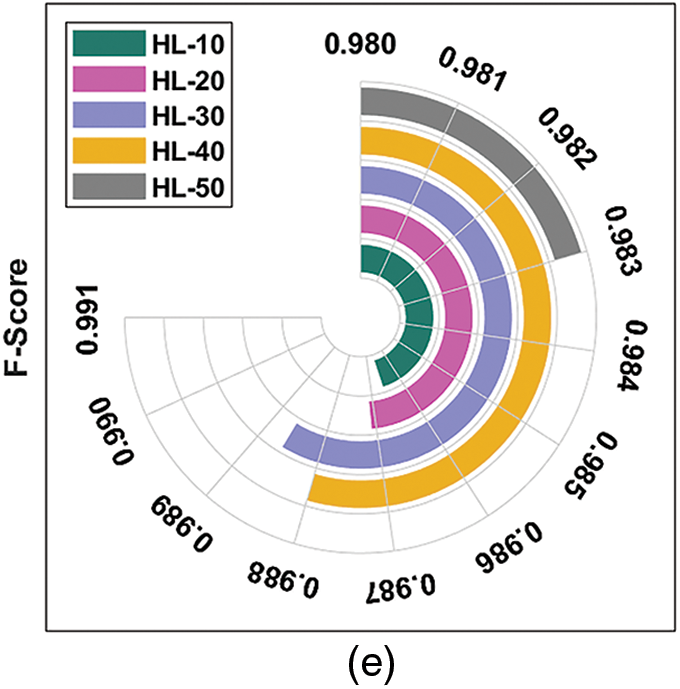
Figure 4: Average analysis results of ODL-FDRDC technique under different measures

Figure 5: ROC analysis results of ODL-FDRDC technique
Tab. 2 illustrates the results of comparative analysis, accomplished by ODL-FDRDC technique against existing methods under various measures. Fig. 6 demonstrates the
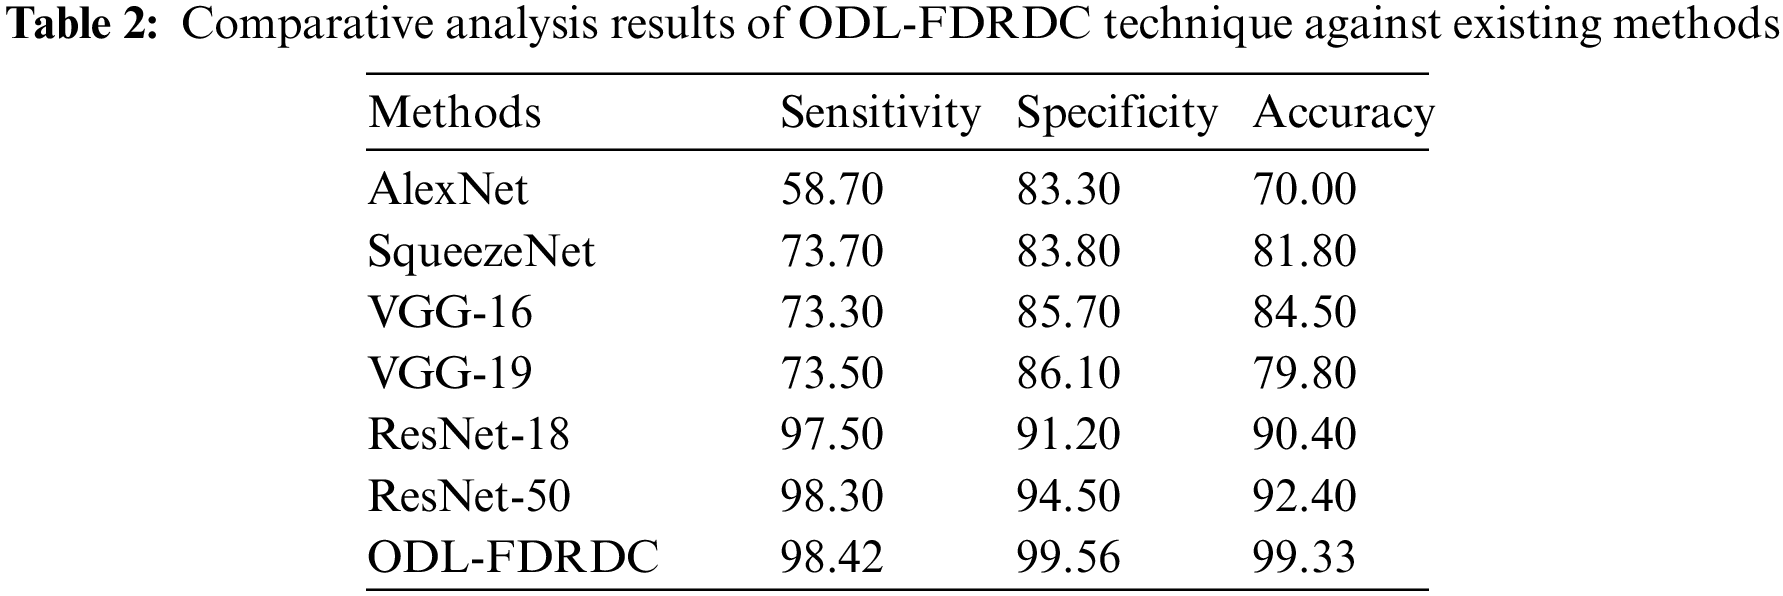

Figure 6:
Fig. 7 illustrates the
Fig. 8 depicts the

Figure 7:

Figure 8:
Based on the results and discussion made above, it is evident that the proposed ODL-FDRDC technique is a superior performer as it produced the maximum DR performance over other techniques.
In this study, a novel ODL-FDRDC technique has been developed to identify and categorize different grades of DR using retinal fundus images. The proposed ODL-FDRDC technique encompasses preprocessing, region-growing segmentation, fusion-based feature extraction, COA-based hyperparameter optimization, and GRU-based classification. The hyperparameter tuning of the fusion models is performed via COA. The proposed ODL-FDRDC technique was experimentally validated against the benchmark DR dataset and the results were validated under different measures. The outcomes infer that the proposed ODL-FDRDC is a superior performer compared to existing methodologies. Therefore, ODL-FDRDC technique can be used as an effectual tool to perform diagnosis in real-time scenarios. In future, DL-based instance segmentation techniques can be designed to improve DR classification outcomes.
Funding Statement: This Research was funded by the Deanship of Scientific Research at University of Business and Technology, Saudi Arabia.
Conflicts of Interest: The authors declare that they have no conflicts of interest to report regarding the present study.
1. C. Sabanayagam, R. Banu, M. L. Chee, R. L. Chee, Y. X. Wang et al., “Incidence and progression of diabetic retinopathy: A systematic review,” The Lancet Diabetes & Endocrinology, vol. 7, no. 2, pp. 140–149, 2019. [Google Scholar]
2. L. P. Cunha, E. A. Figueiredo, H. P. Araújo, L. V. F. C. Cunha, C. F. Costa et al., “Non-mydriatic fundus retinography in screening for diabetic retinopathy: Agreement between family physicians, general ophthalmologists, and a retinal specialist,” Frontiers in Endocrinology, vol. 9, pp. 251, 2018. [Google Scholar]
3. N. Salamat, M. M. S. Missen and A. Rashid, “Diabetic retinopathy techniques in retinal images: A review,” Artificial Intelligence in Medicine, vol. 97, no. Supplement C, pp. 168–188, 2019. [Google Scholar]
4. D. S. W. Ting, G. C. M. Cheung and T. Y. Wong, “Diabetic retinopathy: Global prevalence, major risk factors, screening practices and public health challenges: A review: Global burden of diabetic eye diseases,” Clinical & Experimental Ophthalmology, vol. 44, no. 4, pp. 260–277, 2016. [Google Scholar]
5. M. Soares, C. Neves, I. P. Marques, I. Pires, C. Schwartz et al., “Comparison of diabetic retinopathy classification using fluorescein angiography and optical coherence tomography angiography,” British Journal of Ophthalmology, vol. 101, no. 1, pp. 62–68, 2017. [Google Scholar]
6. S. Wang, Y. Yin, G. Cao, B. Wei, Y. Zheng et al., “Hierarchical retinal blood vessel segmentation based on feature and ensemble learning,” Neurocomputing, vol. 149, pp. 708–717, 2015. [Google Scholar]
7. J. Sahlsten, J. Jaskari, J. Kivinen, L. Turunen, E. Jaanio et al., “Deep learning fundus image analysis for diabetic retinopathy and macular edema grading,” Scientific Reports, vol. 9, no. 1, pp. 10750, 2019. [Google Scholar]
8. S. Lahmiri and A. Shmuel, “Variational mode decomposition based approach for accurate classification of color fundus images with hemorrhages,” Optics & Laser Technology, vol. 96, pp. 243–248, 2017. [Google Scholar]
9. C. Lam, C. Yu, L. Huang and D. Rubin, “Retinal lesion detection with deep learning using image patches,” Investigative Ophthalmology & Visual Science, vol. 59, no. 1, pp. 590, 2018. [Google Scholar]
10. A. Ortiz, J. Munilla, J. M. Górriz and J. Ramírez, “Ensembles of deep learning architectures for the early diagnosis of the alzheimer’s disease,” International Journal of Neural Systems, vol. 26, no. 7, pp. 1650025, 2016. [Google Scholar]
11. S. Qummar, F. G. Khan, S. Shah, A. Khan, S. Shamshirband et al., “A deep learning ensemble approach for diabetic retinopathy detection,” IEEE Access, vol. 7, pp. 150530–150539, 2019. [Google Scholar]
12. E. Beede, E. Baylor, F. Hersch, A. Iurchenko, L. Wilcox et al., “A human-centered evaluation of a deep learning system deployed in clinics for the detection of diabetic retinopathy,” in Proc. of the 2020 CHI Conf. on Human Factors in Computing Systems, Honolulu, HI, USA, pp. 1–12, 2020. [Google Scholar]
13. T. R. Gadekallu, N. Khare, S. Bhattacharya, S. Singh, P. K. R. Maddikunta et al., “Early detection of diabetic retinopathy using pca-firefly based deep learning model,” Electronics, vol. 9, no. 2, pp. 274, 2020. [Google Scholar]
14. F. Li, Y. Wang, T. Xu, L. Dong, L. Yan et al., “Deep learning-based automated detection for diabetic retinopathy and diabetic macular oedema in retinal fundus photographs,” Eye, vol. 39, pp. 1483, 2021. [Google Scholar]
15. F. J. M. Murcia, A. Ortiz, J. Ramírez, J. M. Górriz and R. Cruz, “Deep residual transfer learning for automatic diagnosis and grading of diabetic retinopathy,” Neurocomputing, vol. 452, no. 2, pp. 424–434, 2021. [Google Scholar]
16. X. Jiang, Y. Wang, W. Liu, S. Li, J. Liu et al., “FCN: Comparative performance evaluation for image classification,” International Journal of Machine Learning and Computing, vol. 9, no. 6, pp. 840–848, 2019. [Google Scholar]
17. M. Sandler, A. Howard, M. Zhu, A. Zhmoginov and L. C. Chen, “MobileNetV2: Inverted residuals and linear bottlenecks,” in 2018 IEEE/CVF Conf. on Computer Vision and Pattern Recognition, Salt Lake City, UT, pp. 4510–4520, 2018. [Google Scholar]
18. J. Pierezan and L. Dos Santos Coelho, “Coyote optimization algorithm: A new metaheuristic for global optimization problems,” in 2018 IEEE Congress on Evolutionary Computation (CEC), Rio de Janeiro, Brazil, pp. 1–8, 2018. [Google Scholar]
19. R. Dey and F. M. Salem, “Gate-variants of Gated Recurrent Unit (GRU) neural networks,” in 2017 IEEE 60th Int. Midwest Symp. on Circuits and Systems (MWSCAS), Boston, MA, pp. 1597–1600, 2017. [Google Scholar]
 | This work is licensed under a Creative Commons Attribution 4.0 International License, which permits unrestricted use, distribution, and reproduction in any medium, provided the original work is properly cited. |