DOI:10.32604/cmc.2022.026777
| Computers, Materials & Continua DOI:10.32604/cmc.2022.026777 | |
| Article |
Impact of Accumulated Temperature on Wetland Vegetation Area in Poyang Lake
1School of Geographical Sciences, Nanjing University of Information Science & Technology, Nanjing, 210044, China
2Cold and Arid Regions Environmental and Engineering Research Institute, CAS, Lanzhou, 730000, China
3Faculty of Science, The University of Auckland, 1010, New Zealand
*Corresponding Author: Wenzheng Yu. Email: ywzheng519@126.com
Received: 04 January 2022; Accepted: 08 April 2022
Abstract: Accumulated temperature, which is now widely used in agronomy, is an important ecological factor to the growth of plants, but few relative studies have been found on the vegetation area of floodplain grasslands in Poyang Lake. This research used the classification and regression tree (CART) to classify normalized vegetation area index derived from MODIS LAI (Moderate Resolution Imaging Spectroradiometer Leaf Area Index) images from 2008 to 2014, according to different climate indexes, such as mean daily air temperature (n), accumulated temperature (jw), daily maximum temperature (g), daily minimum temperature (d), accumulative precipitation (j), water level (s) and average water level for 20 days preceding (a). The results showed that: (1) The accumulated temperature and the 20-day average WL (water level) were found to have the greatest impact on variation in wetland vegetation area, and they both dominated the classification process twice; (2) Two classification thresholds of accumulated temperature were 790°C and 1784°C, approximately corresponding to the beginning of April and mid-May; (3) 790°C could also be used as a threshold to select remote sensing images to analysis the annual variability of vegetation, i.e. while accumulated temperature is lower than 790°C, remote sensing images of similar accumulated temperature rather than similar date should be selected from different years for comparison. We also found that, effects of different hydrological factors on area of floodplain grasslands showed stage characteristics: (1) From January to March, water level changes slowly with less rainfall, as a result, the 20-day average WL which can interpret the hydrologic characteristics smoothly showed significant importance in this stage; (2) While entering April, intense rainfall make accumulative precipitation to be the dominating factor of classification; (3) From late April to mid-May, in condition of accumulative precipitation higher than 405 mm, daily water level is of most importance, because to the flood recession process as well as rapid water level fluctuations.
Keywords: Poyang Lake; wetlands; MODIS LAI; CART model; accumulated temperature; water level
Poyang Lake is one of the largest river-connected lakes located on the middle and lower reaches of the Yangtze River. Influenced by upstream flows from five rivers named Gan River, Xin River, Fu River, Rao River and Xiu River, and jacked by downstream flow from Yangtze River, Poyang Lake undergoes dramatic intra-annual fluctuations, of which the water level changes from 8 to 22 meters, creating and maintaining the floodplain grasslands (one kind of wetlands) on a large scale [1–4]. The grasslands mainly composed by dominant species, such as Carex cinerascens, Phalaris arundinacea, Phragmites australis, etc., are habitats and spawning grounds of macrobenthos, phytoplankton and fish during high water-level periods, and can provide hibernacle for migratory birds during low water-level periods. As a result, the ecological values of grasslands in Poyang Lake are very important and well recognized [5,6]. So far, studies relevant to Poyang Lake floodplain grasslands have mainly focused on the relationships between water regimes and wetland vegetation, and the results show that hydrologic factors associated to water-level fluctuations, such as daily water level, frequency, amplitude and lasting time of fluctuations are the main driving factors leading to the distribution of wetland plant communities [2,4,7–10]. This conclusion is highly consistent to the formation mechanisms of floodplain grasslands from both ecology and geography [11]. Meanwhile, other researchers have studied the impact of soli nutrients, seed bank, soil microorganism, etc., on wetland vegetation in order to disclose the importance of edaphic factors as complements to hydrologic factors [12–15].
Besides edaphic factors and hydrologic factors, climatic factors are supposed to play the same important role in plant grow processes. Accumulated temperature, which is now widely used in agronomy [16–21], is an important ecological factor to the growth of plants, especially in the germination process, but few studies on the relationship between accumulated temperature and the vegetation area of wetlands have been found in Poyang Lake. However, in past decades, researches on other wetlands have showed that temperature is the main driving factor during vegetation growth period in wetlands of northwestern China such as Zoigê [22], and have proved accumulated temperature to be of significant importance to normalized differential vegetation index of wetlands in sand soli areas of southern China [23,24]. The relationships between accumulated temperature and the aboveground biomass were also revealed in wetlands of Northern China [25]. Nevertheless, the applicability of these conclusions to Poyang Lake should be verified in further studies. Meanwhile, in recent years, MODIS images have become more and more important in vegetation distribution researches in Poyang Lake [6,7], and models such as power function model with enhanced vegetation index were developed to calculate vegetation biomass [3]. However, while analyzing the vegetation successions or fluctuations in long time series, scholars are inclined to select remote sensing images according to the principle of similar date from different years to compare the annual variability of vegetation [9,26]. This selecting principle is supposed to be inapplicable when there are significant gaps between accumulated temperatures from different years. This study used the classification and regression tree (CART) to classify normalized vegetation area index derived from MODIS LAI images from 2008 to 2014, according to different climate indexes and hydrologic indexes, in order to verify the important contribution of accumulated temperature to vegetation distribution area during vegetation growth period from spring to summer, and may assist in making decisions regarding wetland management, as well as providing a new principle to select remote sensing images for compare wetland vegetation area changes among different years.
The remainder of this paper is organized as follows. Section 2 describes the materials and methods. Next, Sections 3 and 4 demonstrate the research results and discussion in detail, respectively. Finally, Section 5 presents the conclusions.
Poyang Lake which is located on the south shore of Middle and Lower Yangtze River, is the largest freshwater lake as well as an important ecological function protected areas in China. The lake basin is lying between 28°22′ North latitude to 29°45′ North latitude, and between 115°47′ East longitude to 116°45′ East longitude. When flood season comes, inflowing water from Five Rivers (Gan River, Fu River, Xin River, Rao River and Xiu River) enhances the lake level so that all floodplain grasslands are submerged to form a vast lake; in water-recession seasons, lake level declines and lake water recedes into main channels to expose the marshlands, with the result that the lake surface shrinks almost to a meandering river [27]. The study area of this research work is Poyang Lake basin, which can be divided into two different parts: the shallow southern part with many affiliated small lakes to receive upstream water from Five Rivers, and the deep northern part mainly composed of the downstream main channel connected to Yangtze River. Because Poyang Lake is placed in the subtropical monsoon climate zone, the annual average temperature is about 17°C, and the annual average precipitation is about 1600 mm, of which approximate three quarters occur in period from April to September [3,26]. The study area is shown in Fig. 1:
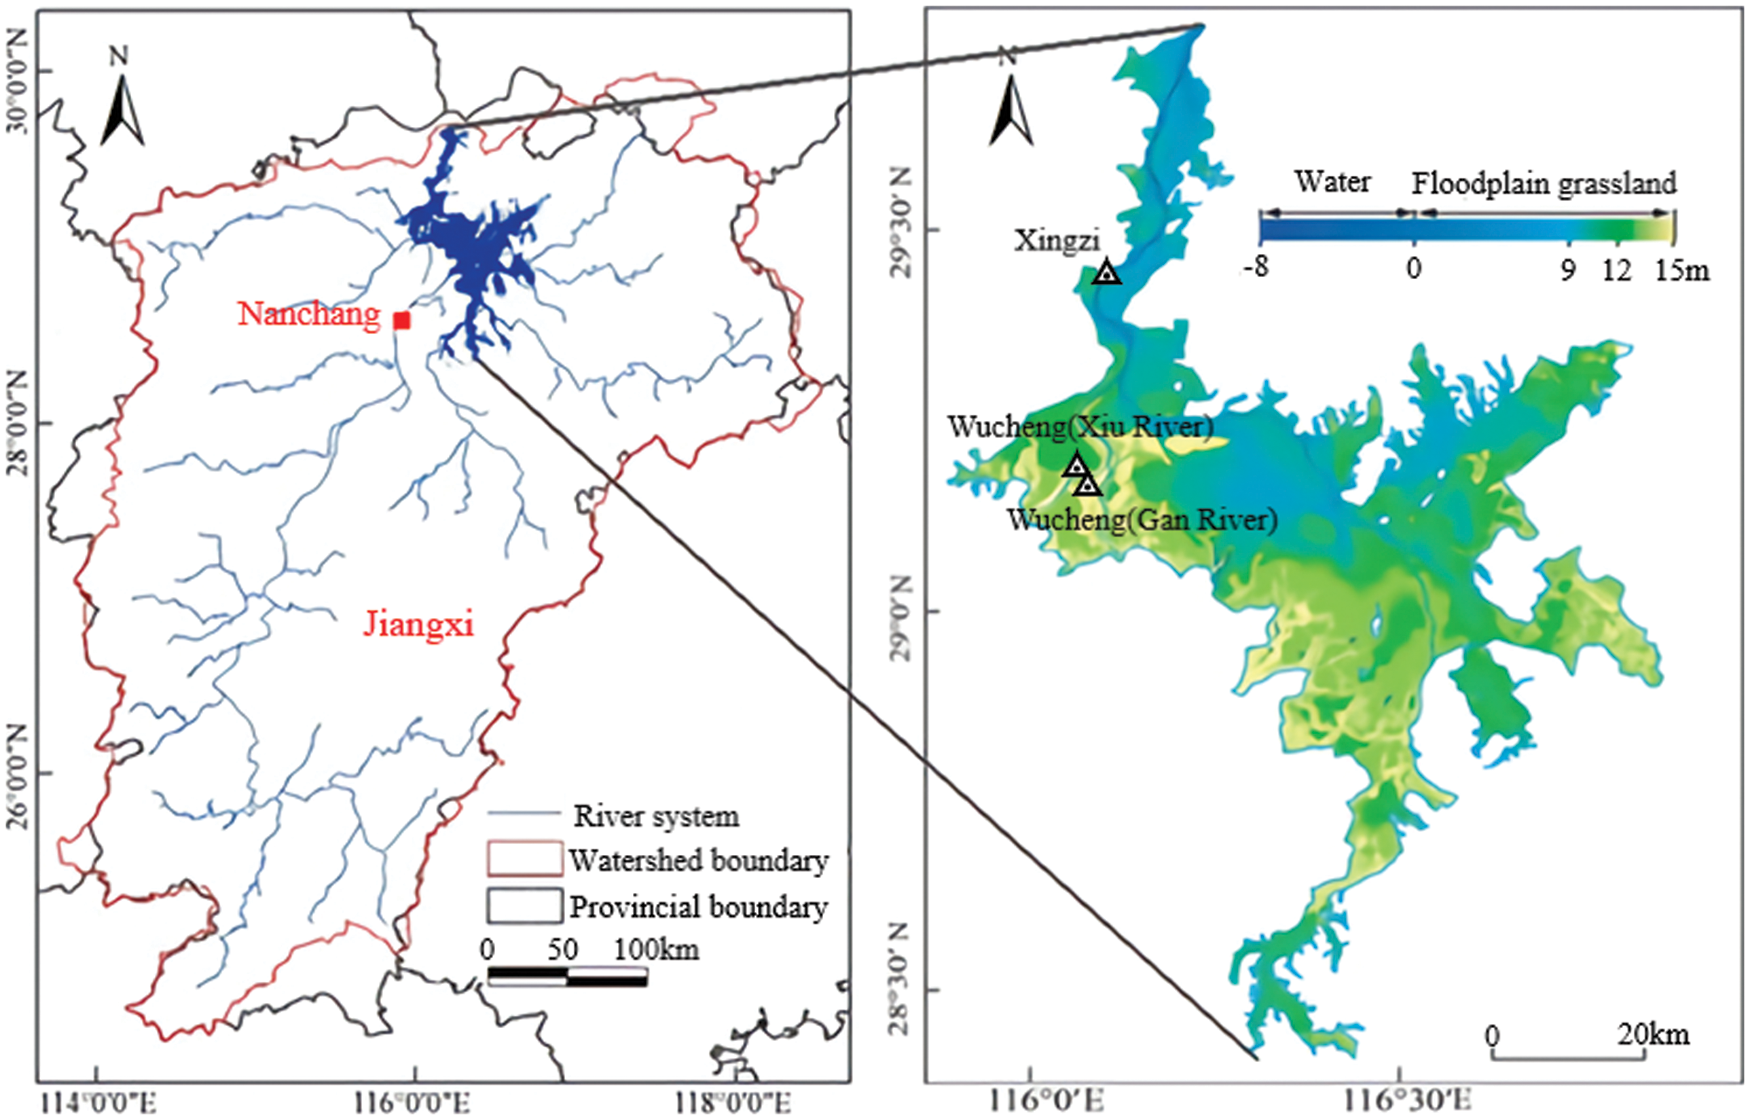
Figure 1: Map of study area
This study used MODIS LAI with a temporal resolution of 8 days and a spatial resolution of 500 meters. MODIS LAI time series data from 2008 to 2014 were selected, and for each year 24 scenes images were taken from January to June. As a result, a total number of 168 scenes images from seven years were processed in ARCGIS 10.2. All of remote sensing images used in the paper were then transformed to the same projected coordinate system (UTM_Zone_50N), and geographic coordinate system (GCS_WGS_84). The range of valid values of leaf area index were from 0 to 100, and the filling value was 255. Then, the method of extraction of raster data value was used to calculate the floodplain grasslands vegetation area.
2.2.2 Hydrologic and Climate Data
The hydrologic data from Xingzi station, Wucheng (Xiu River) station and Wucheng (Gan River) station were selected for calculating the mean daily water level as a representative of the water level of Poyang Lake. The climate data were taken from nearby Nanchang weather station, including mean daily air temperature, daily maximum temperature, daily minimum temperature and daily precipitation. Accumulated temperature and accumulative precipitation were calculated from the above-mentioned indexes.
Classification and regression tree (CART) is a powerful mathematical model for predicting susceptibility to harm, measuring marginality of the system, and guiding normative analysis of actions to enhance well-being through reduction of risk [28]. The mechanism of the CART model is to separate the data into two subsets so that the records in each subset are more homogeneous than that in the previous one. It is a recursive process—each of the two subsets is then split again, and the process will repeat until a homogeneity criterion is reached. The ten-fold cross validation method was used in following pruning process to get the value of the cost complexity (CP), which represents the complexity cost per terminal node for the tree. The fewer value of CP means the fewer number of terminal nodes [29–36]. In this study, we used the CART model to determine the strongest ecological factors that affects the vegetation areas of floodplain grasslands, and to find the critical threshold of the selected ecological factors. The dependent variable was normalized vegetation area index derived from MODIS LAI images and the independent variables were comprised of different climate indexes, such as mean daily air temperature (n), accumulated temperature (jw), daily maximum temperature (g), daily minimum temperature (d), accumulative precipitation (j), daily water level (s) and average water level for 20 days preceding (a). The classification and regression tree model were processed using R software.
The result of ten-fold cross validation is shown in Fig. 2.
The result of the ten-fold cross validation method shows that the cost complexity (CP) should be set at 0.0288, with the X-val equal to 0.8436. Finally, a CART model with the highest accuracy and low complexity (as low as possible) can be attained in the pruning process when CP equals to 0.0288. The final CART tree is shown in Fig. 3.
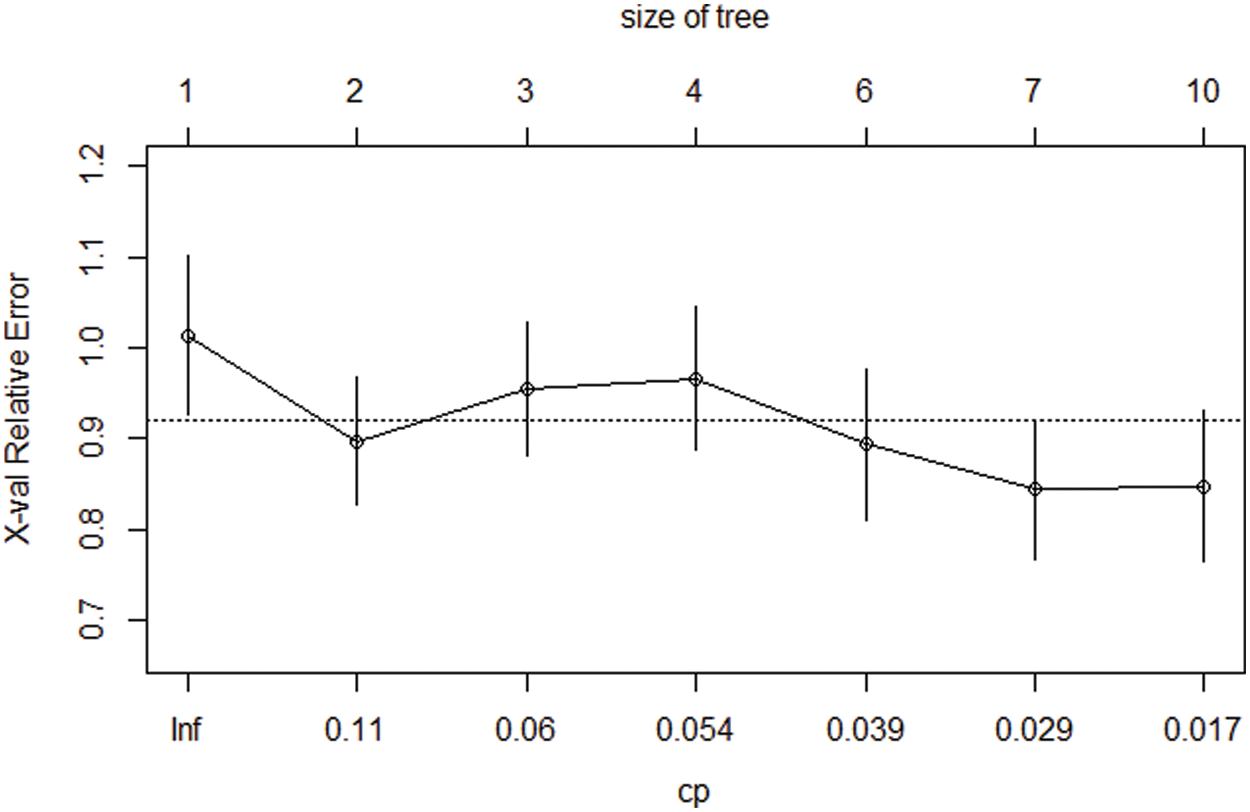
Figure 2: The cost complexity and X-val of the CART tree
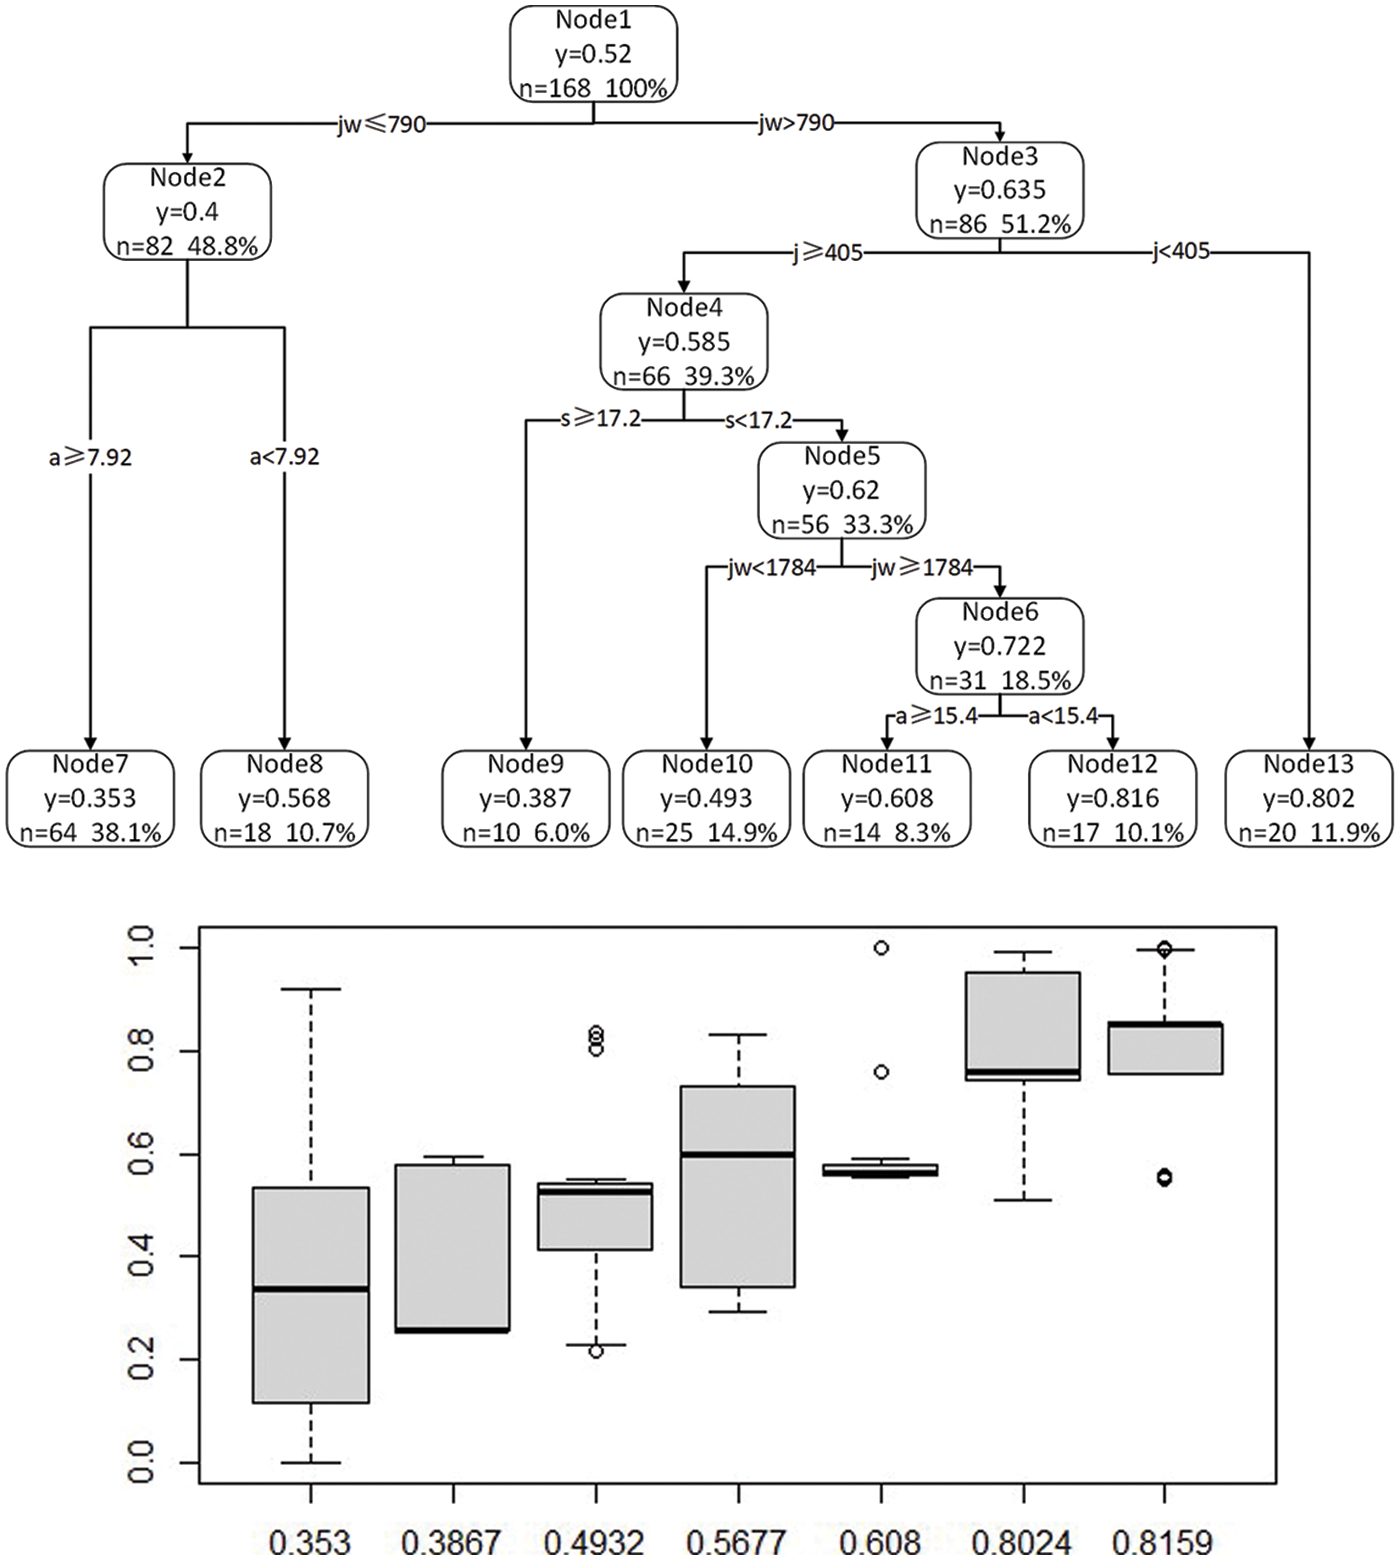
Figure 3: The final CART tree
The final CART tree has thirteen nodes, seven of which are terminal nodes, such as node 7, node 8, node 9, node 10, node 11, node 12 and node 13. The mean value of the dependent variable (y), the number of cases (the number of scenes images sorted in to this node) and the percentage of the number of cases are labeled on each node. The sorting parameters of non-terminal nodes and the threshold value, which are used as quantitative sorting criterions, are marked under them to display the following further classification processes. In general, the sorting parameter of root node (node 1) represents the strongest environmental factor that affects the vegetation area of floodplain grasslands.
In this study, the sorting parameter of node 1 is accumulated temperature, and the number of cases distributed to the two child nodes, which are named node 2 and node 3, are almost the same. The threshold of accumulated temperature is 790°C. When accumulated temperature is equal or lower than 790°C, the vegetation area is smaller with the average normalized vegetation area index (y) equal to 0.4, and when accumulated temperature is higher than 790°C, the vegetation area is larger with the average y equal to 0.635. In further classification, the average water level for 20 days preceding is proved to be the sorting parameter of node 2. The threshold is 7.92 m, while the lower average water level for 20 days preceding means the larger area of floodplain grasslands. In the classification of node 3, accumulative precipitation shows its dominant function, of which the threshold is 405 mm. When the accumulative precipitation is equal or heavier than 405 mm, the average y is 0.802, which is the secondary largest among all nodes; when the accumulative precipitation is lighter than 405 mm, the average y is 0.585. The sorting parameter of node 4 is daily water level, of which the mechanism is easy to understand: higher water level covers a broad area and many meadows are submerged.
Accumulated temperature and average water level for 20 days preceding are both revealed to be the sorting parameter once again in following classifications of node 5 and node 6. The threshold of accumulated temperature at node 5 is 1784°C, approximately corresponding to Mid-May, while the threshold of 790°C approximately corresponds to early April. Different time may induce different mechanism, which will be discussed in detail in next section. However, accumulated temperature and average water level for 20 days preceding are the strongest environmental factors that affect the vegetation area of floodplain grasslands, while the effects of accumulative precipitation and daily water level are of moderate importance. Other indexes, such as mean daily air temperature, daily maximum temperature and daily minimum temperature, are not involved in the CART tree, meaning that they have trivial effects on the classification of wetland area.
4.1 The Mechanism of Accumulated Temperature Thresholds in Water Level Rising Process
The threshold of accumulated temperature at root node is 790°C, approximately corresponding to early April, and the threshold of threshold of accumulated temperature is 1784°C, approximately corresponding to Mid-May. The lake level rising process is shown in Fig. 4. The annual water level rising process are comprised of three or more independent water level rising stages. The first rising stage often occurs in early March, corresponding to the ninth scene of MODIS images which are taken every eight days. In this stage, the lake level rises slowly, with the total increasing amplitude equal to 1–2 m. Then the water level keeps stable until early April, corresponding to the thirteenth scene of MODIS images. The second water rising stage, usually caused by the heavy rainfalls from upstream areas in the watershed during late spring and early summer, often occurs in Mid-April, resulting in rapid water level uplift. The following water level fluctuations are dependent on the persistent condition of upstream rainfalls. In some year with low accumulative precipitation, such as 2008, 2010, 2011, flood recession process occurs until Mid-May, corresponding to the eighteenth scene of MODIS images. In contrast, in some years with high accumulative precipitation, such as 2012–2014, the water level keeps rising in the whole second stage. The third rising stage often occurs in late May, corresponding to the nineteenth scene of MODIS images. In this stage, there is a rapid and significant promotion in water level, resulting in continuous uplift of lake surface.
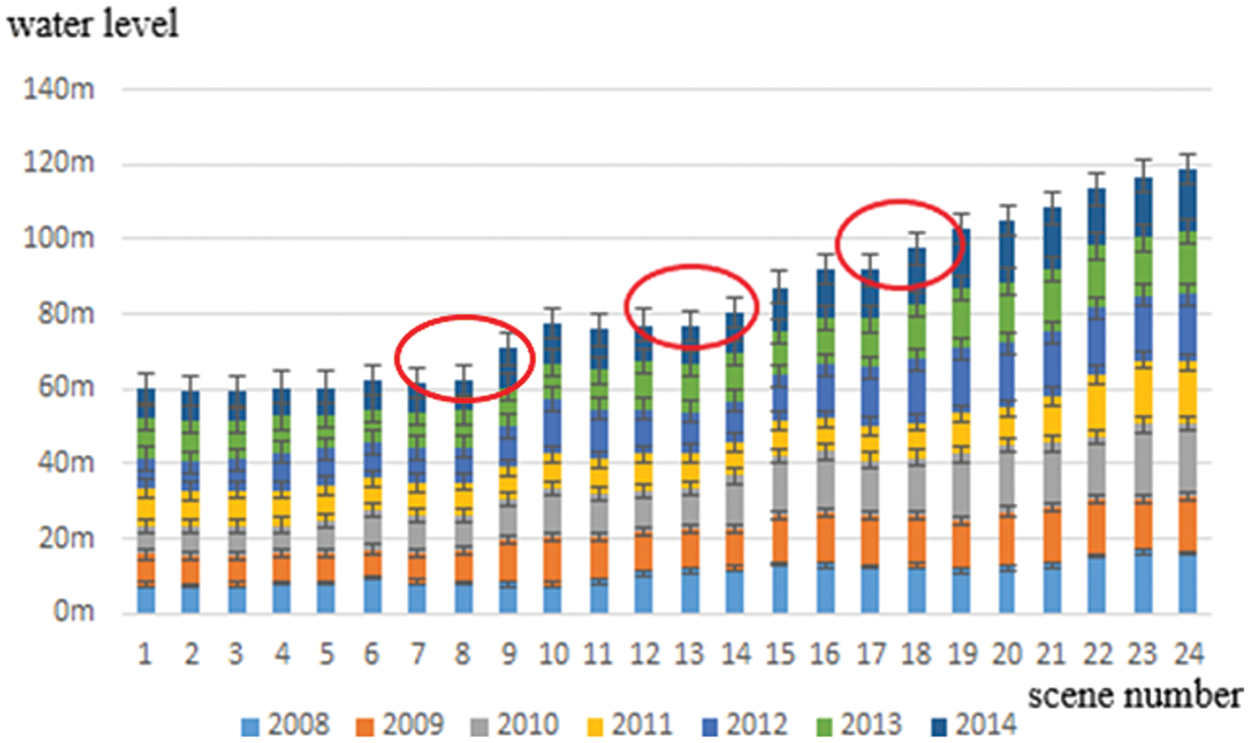
Figure 4: The water level rising process in Poyang Lake
As described above, the threshold of 790°C corresponds to the thirteenth scene of MODIS images, and the 1784°C corresponds to the eighteenth scene of MODIS images. They represent respectively the initiation of the second and the third water rising stages as shown in red circles in Fig. 4. As a result, the mechanism of accumulated temperature thresholds in water level rising process can be described as follows: (1) In January and February, the accumulated temperatures are too low to have significant ecological impacts on plant growth. That is to say, although the water level is suitable, the accumulated temperature cannot dominate the classification process according to theoretical principle of itself before the first water rising stage. Other researches in Zoigê wetlands [22] also found similar results, and there was low correlation between accumulated temperature and plant growth when accumulated temperature is very low. (2) The beginnings of the second and the third water rising stages are also the ends of the first and the second rising stages. In the first rising stage, the lake level rises slowly, and the total increasing amplitude is small (1–2 m). The water rising process has little effect on the vegetation area calculated from MODIS images. As a result, accumulated temperature becomes the dominant ecological factor in this period. In the second rising stage, although the total increasing amplitude is large, flood recession process usually occurs until Mid-May in some years, and the accumulated temperature is high enough to have normal functions. Consequently, the accumulated temperature turns to the sorting parameter in classifications of node 5. (3) After the end of May, the lake level increases continually with the coming of rainy season, and the importance of accumulated temperature declines. Finally, the hydrologic factors become dominant factors of classification.
4.2 A New Criterion to Select MODIS Images for Vegetation Area Comparison between Different Years
In order to verify the mechanism of accumulated temperature in water rising process discussed above, and to provide a new criterion to select MODIS images for vegetation area comparison between different years, a paired sample t-test should be carried out. 2008 was taken as datum year, and accumulated temperature gradients were set at 70°C, 250°C, 700°C, 1300°C and 1700°C (considering suitable intervals, two thresholds, and the availability of adjacent remote sensing images), corresponding to the second, eighth, twelfth, sixteenth and eighteenth scene of MODIS images respectively. MODIS images were then selected according to both similar date (scene number) and similar accumulated temperature from 2009–2014 to form ten different time series. The vegetation area of grasslands was calculated and normalized. The ten different time series were denoted as five T series (T2, T8, T12, T16, T18) and five JW series (JW70, JW250, JW700, JW1300, JW1700). The results of paired sample t-test were shown in Tab. 1.
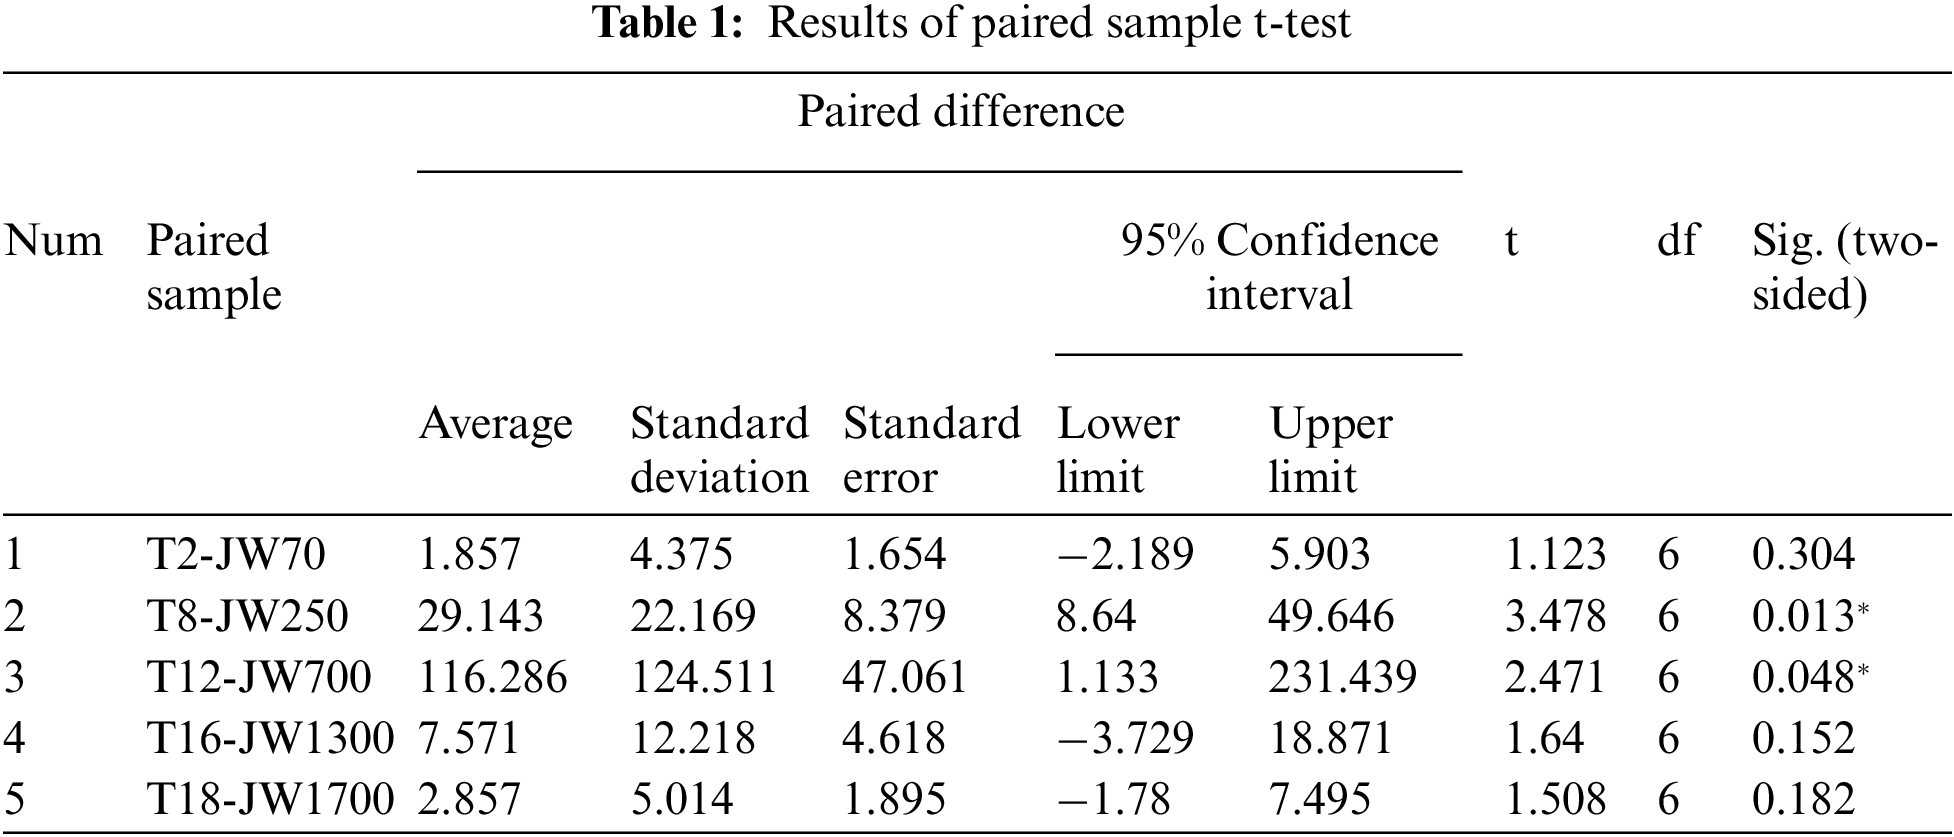
Significant differences were found in paired series of T8-JW250 (sig. = 0.013) and T12-JW700 (sig. = 0.048), meaning that the results of vegetation area comparison showed significant different in late February and late March, between traditional criterion of selecting remote sensing images according to similar date and new criterion of selecting remote sensing images according to similar accumulated temperature. In contrast, there is no significant differences in paired series of T2-JW70 (sig. = 0.304), T16-JW1300 (sig. = 0.152) and T18-JW1700 (sig. = 0.182), indicating that the effects of applying two different criterions were nearly the same in early January, the end of April and mid-May.
Based on above findings, we present a reasonable interpretation: In January, the average accumulated temperature keeps low and grows slowly until early February, and the increment is about 123°C in thirty days. In this situation, there is no significant difference between time series selected according to accumulated temperature and other time series selected according to date, because accumulated temperature is too low to affect vegetation ecologically. When accumulated temperature grows to 250°C, which is enough to have normal ecological functions, significant differences can be found between time series selected according to different criterions. This situation lasts until late March, when the accumulated temperature grows to 700°C. 700°C is set according to threshold of 790°C, because there is no suitable scene of MODIS images around 800°C. Besides, the sig. grows from 0.013 in February to 0.048 in late March, indicating that the gaps between paired series selected according to different criterions are narrowed and the importance of accumulated temperature decreases with the water level rising process. As a result, we draw a reasonable conclusion that 790°C could also be used as a threshold to select remote sensing images to analysis the annual variability of vegetation, i.e. while accumulated temperature is lower than 790°C, remote sensing images of similar accumulated temperature rather than similar date should be selected from different years for vegetation area comparison. Although there is no significant difference between time series selected according to accumulated temperature and series selected according to date in T2-JW70 period, we strongly recommend that the criterion of accumulated temperature should be applied because it is more efficient, and there is no need for changes until April.
However, when the accumulated temperature grows to 1700°C, there is no significant difference between time series selected by different criterions. In contrast, we have found the dominant function of accumulated temperature in classification at node 5, with accumulated temperature threshold equal to 1784°C. The rational explanation is as follows: Prerequisites of node 5 are accumulative precipitation ≥ 405 mm and daily water level < 17.2 m. Accumulative precipitation more than 405 mm usually occurs after late April, and daily water level lower than 17.2 m means the possible flood recession processes. To sum up, the threshold of 1784°C only have dominant function in classification under certain hydrologic conditions (possible flood recession processes from late April to mid-May), rather than under universal conditions, and cannot be used as a generally applicable threshold of selecting MOIDS images.
4.3 The Effects of Hydrologic Factors
Previous researches have revealed the impact of hydrological factors, such as daily water level, average water level for 20 days preceding, accumulative precipitation and so on, but there are few studies focusing on the different action mechanisms of those hydrological factors. The CART used in our research have revealed the small differences between the influences of hydrological factors. When the accumulated temperature is less than 790°C, corresponding to periods before April, the dominant sorting parameter is the 20-day average WL. This is consistent with results of Dai and other researchers, and close to reality in spring [2,5,11,28]. The reason may be related to the time span of hydrological indexes. From January to March, water level changes slowly with low rainfall, and hydrological indexes with longer time span (the 20-day average WL) could give a better description of the integral characteristics of this period. When the accumulated temperature is more than 790°C, corresponding to periods after April, the heavy rainfalls from upstream areas in the watershed during late spring and early summer caused a quick uplift of lake level. In this period, it is also reasonable that the accumulative precipitation becomes the sorting parameter of classification because the less rainfall means the greater area of emerged marshlands after April. In situations when accumulative precipitation is adequate (more than 405 mm), the daily water becomes the dominant factor of classification, because the time span of daily water is short, and suitable to describe the rapid water level fluctuations caused by the possible flood receding processes as well as the occasional and non-continuous rainfalls before entering the rainy season.
This research used the classification and regression tree (CART) to classify normalized vegetation area index derived from MODIS LAI images from 2008 to 2014, according to different climate factors, such as mean daily air temperature (n), accumulated temperature (jw), daily maximum temperature (g), daily minimum temperature (d), accumulative precipitation (j), water level (s) and average water level for 20 days preceding (a). According to the results of CART, we found that: (1) The accumulated temperature and the 20-day average WL were most important on variation in wetland vegetation area, and they both dominated the classification process twice; (2) Classification thresholds of accumulated temperature were 790°C and 1784°C separately, approximately corresponding to the beginning of April and mid-May; (3) 790°C could also be used as a threshold to select remote sensing images to compare vegetation area among different years, i.e. while accumulated temperature is lower than 790°C, remote sensing images of similar accumulated temperature rather than similar date should be selected from different years for comparison. We also found that, the effects of several hydrological factors mentioned in previous researches on area of floodplain grasslands showed stage characteristics: (1) Before April, water level changes slowly with less rainfall, as a result, the 20-day average water level which can interpret the integral hydrologic characteristics showed significant importance in this period; (2) When entering April, heavy rainfall make accumulative precipitation to be the dominating factor of classification; (3) From late April to mid-May, in condition of accumulative precipitation higher than 405 mm, daily water level is of most importance, because of the rapid water level fluctuations due to the possible flood receding process as well as the occasional and non-continuous rainfalls before entering the rainy season.
Acknowledgement: We gratefully acknowledge the valuable corporation of Pro. Rongrong Wan and Dr. Xue Dai (Chinese Academy of Sciences, Nanjing Institute of Geography and Limnology) for the guidance in R language programs.
Funding Statement: This work was supported by the National Natural Science Foundation of China “Study on the dynamic mechanism of grassland ecosystem response to climate change in Qinghai Plateau” under grant number U20A2098, and the Second Tibet Plateau Scientific Expedition and Research Program (STEP) under grant number 2019QZKK0804.
Conflicts of Interest: The authors declare that they have no conflicts of interest to report regarding the present study.
1. L. L. Shi, Y. F. Jia, A. J. Zuo, T. H. Ma, J. L. Lei et al., “Dynamic change of vegetation cover and productivity of Poyang Lake wetland based on MODIS EVI time series,” Biodiversity Science, vol. 28, no. 8, pp. 828–837, 2018. [Google Scholar]
2. W. Q. Yu, X. Dai, Y. Yang, R. R. Wan, Y. Pu et al., “The relationship between water-level fluctuation factors and the distribution of Carex in floodplain grassland around Poyang Lake,” Journal of Lake Science, vol. 30, no. 6, pp. 1672–1680, 2018. [Google Scholar]
3. G. P. Wu, C. Ye and Y. B. Liu, “Spatial distribution of wetland vegetation biomass in the Poyang Lake National Nature Reserve,” China Acta Ecologica Sinica, vol. 35, no. 2, pp. 361–369, 2015. [Google Scholar]
4. Y. Y. Song, Q. Zhang, S. Y. Jiang and Y. Y. Guo, “Groundwater depth and its relation with typical vegetation distribution in the Poyang Lake wetland,” China Chinese Journal of Applied Ecology, vol. 32, no. 1, pp. 123–133, 2021. [Google Scholar]
5. Y. R. Lin and Z. P. Hu, “Analysis of evolution process and driving factors for aquatic vegetations of Poyang Lake in 30 years,” Resources and Environment in the Yangtze Basin, vol. 28, no. 8, pp. 1947–1955, 2019. [Google Scholar]
6. L. L. Shi, “The influence of hydrological connectivity on dynamic changes of wetland vegetation in Poyang Lake based on long time series RS data,” Ph.D. dissertation, Beijing Forestry University, China, 2018. [Google Scholar]
7. X. Y. Liu, Y. N. Guan, S. Guo, C. Y. Zhang and L. Wang, “Response on wetland vegetation distribution to hydrology regularity based on harmonic-time series analysis,” Journal of Lake Science, vol. 28, no. 1, pp. 195–206, 2016. [Google Scholar]
8. X. L. Xu, Y. L. Li, Z. Q. Tan and Q. Zhang, “Water fluxes in the groundwater-soil-plant-atmosphere continuum and water sources of typical wetland vegetation communities in Poyang Lake,” Journal of Lake Science, vol. 30, no. 5, pp. 1351–1367, 2018. [Google Scholar]
9. R. N. Wang, W. Q. Peng, X. B. Liu, W. Q. Wu, Z. Han et al., “Analysis of responses of typical vegetation in Nanji Wetland National Nature Reserve of Poyang Lake to water depth and submergence frequency,” Journal of China Institute of Water Resources and Hydropower Research, vol. 16, no. 6, pp. 528–535, 2018. [Google Scholar]
10. W. J. Feng, L. G. Xu, X. L. Wang, H. Y. Li and J. H. Jiang, “Response of Carex cinerascens populations to groundwater level gradients in the Poyang Lake wetland,” Acta Ecologica Sinica, vol. 36, no. 16, pp. 5109–5115, 2016. [Google Scholar]
11. X. Yao, G. S. Yang, R. R. Wan and X. L. Wang, “Impact of water level change on wetland vegetation of rivers and lakes,” Journal of Lake Science, vol. 26, no. 6, pp. 813–821, 2014. [Google Scholar]
12. X. Chen, “Study on the influence of water level change on seed bank and aboveground vegetation of three sub-lakes in Poyang Lake,” M.S. dissertation, Yangtze University, China, 2019. [Google Scholar]
13. C. Zhang, “Researches on the mid-infrared spectrogram of organic matters and spatial-temporal distribution of soil carbon and nitrogen in community succession under different water levels of Poyang Lake,” M.S. dissertation, Jiangxi Normal University, China, 2017. [Google Scholar]
14. L. Yu, L. H. He, Q. Zhang, Y. W. Chen and X. L. Wang, “Effects of the three gorges project on the typical wetland vegetations of Poyang Lake,” Geographical Research, vol. 30, no. 1, pp. 134–144, 2011. [Google Scholar]
15. L. L. Han, “Spatial distribution and driving factors of soil bacterial and ammoxidation in a typical islet wetland of Poyang Lake,” M.S. dissertation, Nanchang University, China, 2018. [Google Scholar]
16. Y. L. Song, Y. X. Zhao and C. Y. Wang, “Changes of accumulated temperature, growing season and precipitation in the North China plain from 1961 to 2009,” Acta Meteorologica Sinica, vol. 25, no. 4, pp. 534–542, 2011. [Google Scholar]
17. C. X. Chen, Z. Q. Dong, J. Gao, T. J. Xu, L. Jiao et al., “Effects of different accumulated temperature on photosynthetic performances of spring maize varieties during grain-filling period,” Chinese Journal of Applied Ecology, vol. 24, no. 6, pp. 1593–1600, 2013. [Google Scholar]
18. Y. J. Wu, C. H. Ye, H. F. Jiang, M. L. Yan and Z. X. Ni, “Comparison of the simulation effect of different growing degrees days calculating methods on crop development process,” Journal of China Agricultural University, vol. 21, no. 10, pp. 117–126, 2016. [Google Scholar]
19. J. X. Huang, W. H. Liu, H. Y. Ma, W. Su and D. H. Zhu, “Predicting maturity period for winter wheat using remote sensing and effective accumulated temperature-solar radiation model,” Transections of the China Society of Agriculture Engineering, vol. 32, no. 7, pp. 152–157, 2016. [Google Scholar]
20. W. J. Hu and L. M. Ye, “Spatial modeling of the length of growing season of rice based on remote sensing and ground observation,” China Journal of Agriculture Resources and Regional Planning, vol. 37, no. 8, pp. 12–20, 2016. [Google Scholar]
21. W. Liu, K. Liu, C. H. Zhang and G. Z. Du, “Effect of accumulated temperature on seed germination-a case study of 12 Compositae species on the eastern Qinghai-Tibet Plateau of China,” Chinese Journal of Plant Ecology, vol. 35, no. 7, pp. 751–758, 2011. [Google Scholar]
22. D. L. Li, L. G. Li, Y. X. He, S. Gou and N. N. Zhao, “Characteristics of vegetation growth period and its response to climate change in Zoigê area from 2001 to 2015 based on remote sensing data,” Advanced Engineering Sciences, vol. 51, no. 1, pp. 165–172, 2019. [Google Scholar]
23. X. K. Xu, C. H. Lin, F. Xue and Q. C. Zeng, “Correlation analysis between meteorological factors and the ratio of vegetation cover,” Acta Ecologica Sinica, vol. 23, no. 2, pp. 221–230, 2003. [Google Scholar]
24. S. H. Liu, D. H. Yan, X. L. Shi and Z. Yuan, “Inter-annual variability of vegetation NDVI, accumulated temperature and precipitation and their correlations in China,” Arid Land Geography, vol. 37, no. 3, pp. 480–489, 2014. [Google Scholar]
25. M. W. Zhao, T. X. Yue, X. F. Sun and N. Zhao, “High accuracy simulation of aboveground biomass in Northern China based on IOCSG,” Acta Ecologica Sinica, vol. 34, no. 17, pp. 4891–4899, 2014. [Google Scholar]
26. Y. C. Wang, P. Hou, H. W. Wan, J. Zhai, M. Yang et al., “Remote sensing monitoring and analysis of ecological changes in Poyang Lake wetland,” Environmental Ecology, vol. 1, no. 1, pp. 68–73, 2019. [Google Scholar]
27. S. Lei, X. P. Zhang, R. F. Li, X. H. Xu and Q. Fu, “Analysis the changes of annual for Poyang Lake wetland vegetation based on MODIS monitoring,” Procedia Environmental Sciences, vol. 10, no. 2001, pp. 1841–1846, 2001. [Google Scholar]
28. X. Dai, R. R. Wan, G. S. Yang, X. L. Wang and L. G. Xu, “Responses of wetland vegetation in Poyang Lake, China to water-level fluctuations,” Hydrobiology, vol. 773, no. 1, pp. 35–47, 2016. [Google Scholar]
29. F. C. Xue, “Hierarchical geographically weighted regression model,” Journal of Quantum Computing, vol. 1, no. 1, pp. 9–20, 2019. [Google Scholar]
30. Q. Liu, Z. Yang, X. Liu and S. Mbonihankuye, “Analysis of the efficiency-energy with regression and classification in household using k-nn,” Journal of New Media, vol. 1, no. 2, pp. 101–113, 2019. [Google Scholar]
31. W. M. Shen, W. J. Wang, H. J. Luo, F. Zhang and X. M. Liu, “Classification methods of remote sensing image based on decision tree technologies,” Remote Sensing Technology and Application, vol. 22, no. 3, pp. 333–338, 2007. [Google Scholar]
32. Z. Wang, Y. Zhao, H. Dong, Y. Xu and Y. Lv, “Improved algorithm based on decision tree for semantic information retrieval,” Intelligent Automation & Soft Computing, vol. 30, no. 2, pp. 419–429, 2021. [Google Scholar]
33. Z. Jia, Q. Han, Y. Li, Y. Yang and X. Xing, “Prediction of web services reliability based on decision tree classification method,” Computers Materials & Continua, vol. 63, no. 3, pp. 1221–1235, 2020. [Google Scholar]
34. J. Yu, Z. Qiao, W. Tang, D. Wang and X. Cao, “Blockchain-based decision tree classification in distributed networks,” Intelligent Automation & Soft Computing, vol. 29, no. 3, pp. 713–728, 2021. [Google Scholar]
35. X. Liu, J. Yu, W. Song, X. Zhao, L. Zhao et al., “Remote sensing image classification algorithm based on texture feature and extreme learning machine,” Computers Materials & Continua, vol. 65, no. 2, pp. 1385–1395, 2020. [Google Scholar]
36. S. U. Islam, S. Jan, A. Waheed, G. Mehmood, M. Zareei et al., “Land-cover classification and its impact on peshawar’s land surface temperature using remote sensing,” Computers Materials & Continua, vol. 70, no. 2, pp. 4123–4145, 2022. [Google Scholar]
 | This work is licensed under a Creative Commons Attribution 4.0 International License, which permits unrestricted use, distribution, and reproduction in any medium, provided the original work is properly cited. |