DOI:10.32604/cmc.2022.027008
| Computers, Materials & Continua DOI:10.32604/cmc.2022.027008 | |
| Article |
Poisson-Gumbel Model for Wind Speed Threshold Estimation of Maximum Wind Speed
1School of Geographical Sciences, Nanjing University of Information Science & Technology, Nanjing, 210044, China
2Faculty of Science, The University of Auckland, 1010, New Zealand
*Corresponding Author: Xin Yao. Email: yaoxin@nuist.edu.cn
Received: 08 January 2022; Accepted: 22 March 2022
Abstract: Poisson-Gumbel joint distribution model uses maximum wind speed corresponding to multiple typhoons to construct sample sequence. Thresholds are usually used to filter sample sequences to make them more consistent with Poisson distribution. However, few studies have discussed the threshold setting and its impact on Poisson-Gumbel joint distribution model. In this study, a sample sequence based on the data of Qinzhou meteorological station from 2005 to 2018 were constructed. We set 0%, 5%, 10%, 20% and 30% gradient thresholds. Then, we analyzed the influence of threshold change on the calculation results of maximum wind speed in different return periods. The results showed that: (1) When the threshold increases, the maximum wind speed of each return period will decrease gradually. This indicates that the length of the sample series may have a positive effect on the return period wind speed calculation in Gumbel and Poisson-Gumbel methods. Although the augment of the threshold increases the average value of the maximum wind speed of the sample sequence, it shortens the length of the sample sequence, resulting in a lower calculated value of the maximum wind speed. However, this deviation is not large. Taking the common 10% threshold as an example, the maximum wind speed calculation deviation in the 50 a return period is about 1.9%; (2) Theoretically, the threshold is set to make the sample sequence more consistent with Poisson distribution, but this example showed that the effect is worth further discussion. Although the overall trend showed that the increase of the threshold can make χ2 decrease, the correlation coefficient of linear fitting was only 0.182. Taking Qinzhou meteorological station data as an example, the χ2 of 20% threshold was as high as 6.35, meaning that the selected sample sequence was not ideal.
Keywords: Poisson-Gumbel; threshold; maximum wind speed; probability distribution; return period
There are many models for calculating the maximum wind speed in the return period, including Weibull distribution [1–4], Gumbel distribution [5–8], Pearson type III distribution [9–11], Poisson-Gumbel joint distribution, and binomial-logarithmic normal distribution [12–17]. They have different applicable conditions. At present, most countries use the Gumbel method of extreme value type I distribution to calculate the annual maximum wind speed. The Gumbel method counts one maximum wind speed every year, and it is impossible to count all the wind speeds affected by typhoons [18]. For specific meteorological stations, some years may be affected by multiple typhoons, and some years may not. The sample sequence cannot reflect the real typhoon situation. Meantime, some meteorological stations were built late, and the time scale of data recording was not enough, resulting in short sample sequence. The result of calculating the maximum wind speed in return period by Gumbel method with extreme value I-type distribution is not ideal. Poisson-Gumbel joint distribution model, using maximum wind speed corresponding to multiple typhoons to construct sample sequence. The threshold is set to filter the sample sequence to make it more consistent with Poisson distribution. It can effectively compensate for the shortcomings of short time series, and the simulation effect of medium time series for 15–20 years is the best [19,20].
Nevertheless, there is no fixed standard for setting the wind speed threshold at present [17]. Originally, the Gumbel model was modeled by using samples from different years. But it doesn’t work well when the year sequence is not long enough. So the year sequence can be replaced by the storm sequence. How to choose the extreme wind speed has requirements, the threshold is the standard. The normal setting method is to set a number so that there are no-storms in some years (larger than the threshold as the inclusion criteria), and the number of years no-storm does not exceed 1/10 of the total number of years [18]. The storm sequence selected in this way is relatively easy to conform to the Poisson distribution, and can ensure that the vast majority of storms are selected. The Poisson-Gumbel joint model is formed. In this study we analyzed the influence of threshold change on the calculation results of maximum wind speed in different return periods. We discussed whether it can improve the degree that the sample sequence conforms to Poisson distribution. In order to provide reference for the optimal use of Poisson-Gumbel model.
The remainder of this paper is organized as follows. Section 2 describes the data sources and research methods. Section 3 demonstrates the research results in detail. Next, Section 4 discusses the results of the study. Finally, Section 5 presents the conclusions.
2 Data Sources and Research Methods
2.1.1 Overview of the Study Area
Qinzhou City is situated in the southern coast of Guangxi, the northern coast of the Beibu Gulf, located at 107°27′−109°56′E, 21°35′−22°41′N. It is connected with Beihai and Yulin in the east, Qinzhou Bay in the south, Fangchenggang in the west and Nanning in the north. It is the sea-land transportation hub of Guangxi Beibu Gulf Economic Zone, a convenient access to the sea in southwest China, and a frontier city in China-ASEAN Free Trade Area. The total land area of the city is10897 km2, and the mainland coastline is 562.64 km. As shown in Fig. 1.
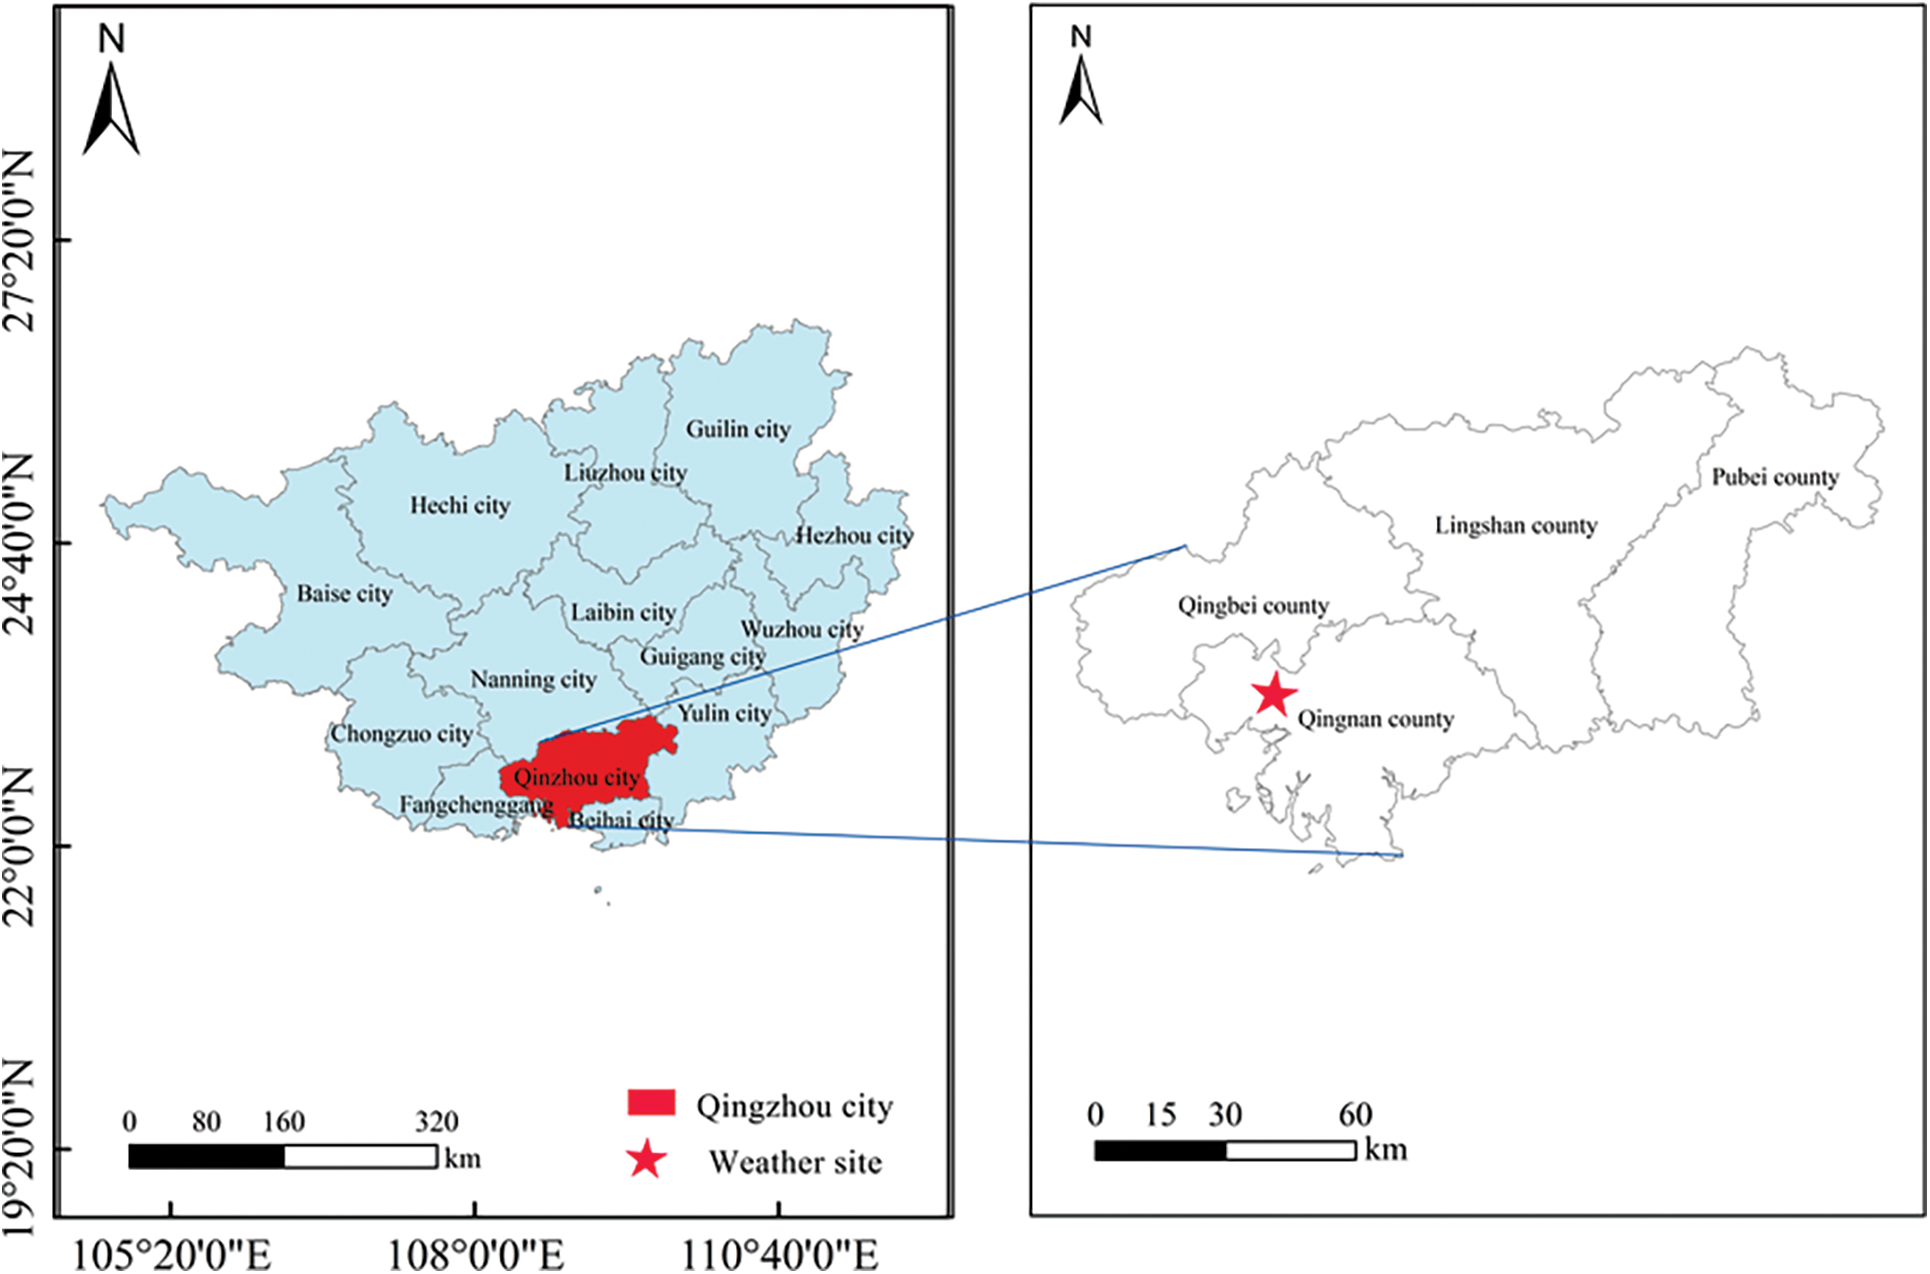
Figure 1: Map of Qinzhou City
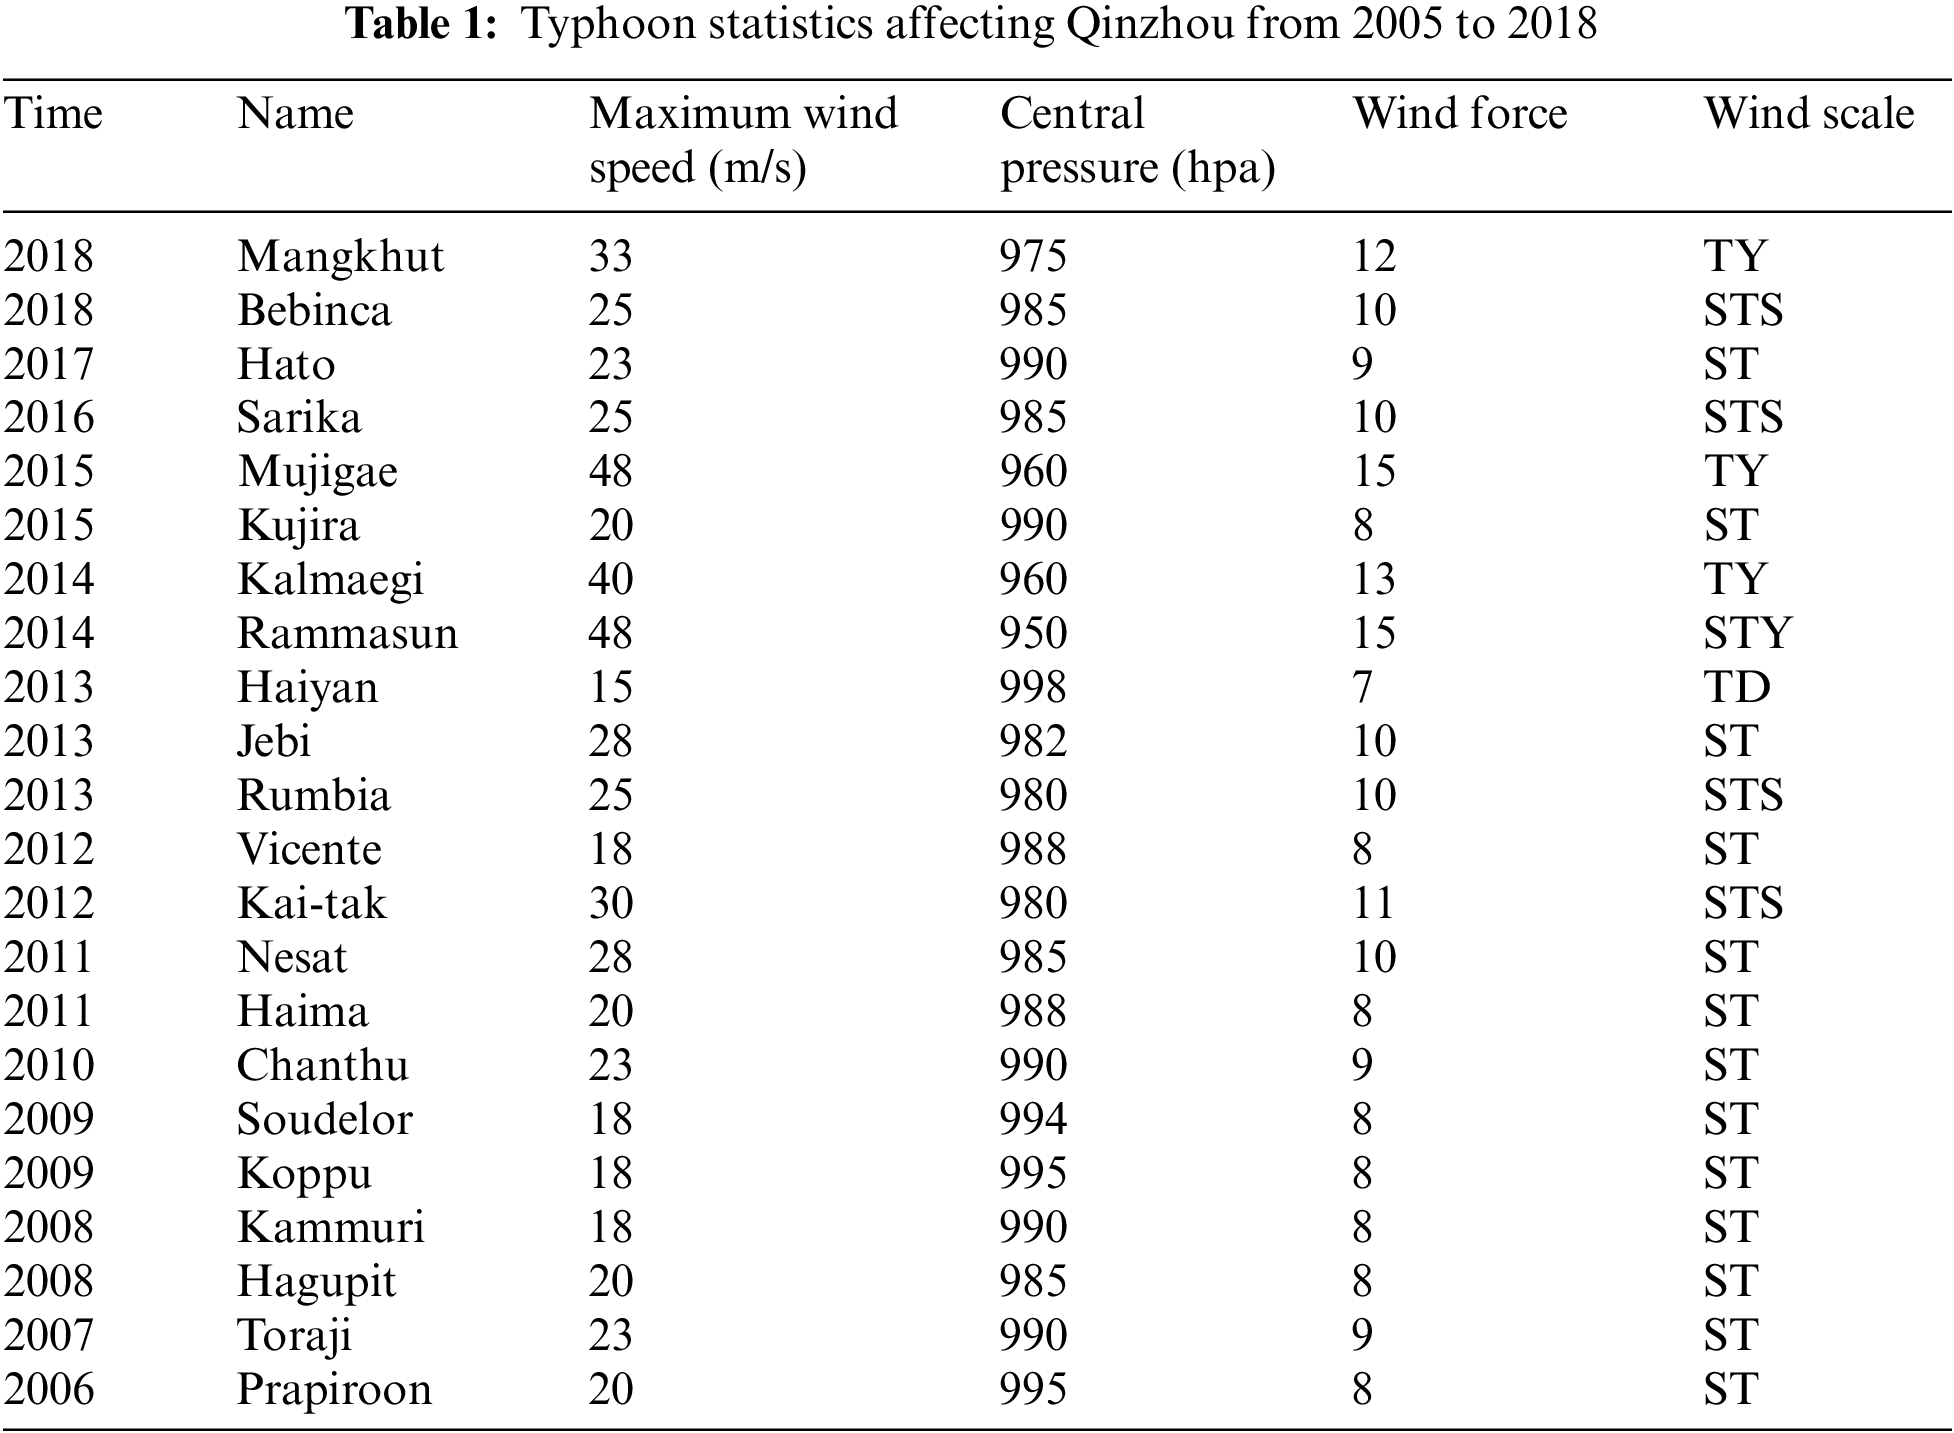
From 2005 to 2018, about 22 typhoons entered the affected area of Qinzhou wind farm, with an average of 1.69 per year, mostly concentrated in July to September. When entering the affected area, the intensity of tropical cyclones is the largest in the number of tropical storms, followed by strong tropical storms and typhoons, of which the benefit type accounts for 55%, the defensive type accounts for 27% and the destructive type accounts for 18%. The most influential typhoon is the super typhoon “Rammasun” in 2014. The maximum central wind speed is 48 m/s and the central pressure is 950 hPa when landing. As shown in Tab. 1:
2.1.2 Meteorological Data and Typhoon Data
The meteorological data are from Qinzhou Meteorological Station (108.6E, 21.9833N), including the daily maximum wind speed from 2005 to 2018. The typhoon data comes from the typhoon network of the Central Meteorological Station, which are selected to mainly record the time period when it passes through Qinzhou.
The steps of calculating the maximum wind speed by Poisson-Gumbul joint extreme wind speed calculation method are as follows:
Firstly, it is assumed that the frequency k affected by typhoon conforms to Poisson distribution. That is, there is a probability of k occurrences:
In the formula, λ =
Using Poisson-Gumbel joint extreme value distribution function expression:
Take two logarithms to obtain:
Substitute into Gumbel function:
The equation is as follows:
Take two logarithms to obtain:
The probability P is related to the return period R:
The maximum wind speed is:
Among them, δ is the position parameter, and α is the scale parameter. The calculation formula is as follows:
In order to make the sample sequence conform to Poisson distribution, it is usual to determine a wind speed threshold, which is greater than the threshold and selected into the maximum wind speed sequence. In previous studies, this threshold should be such that no storms occur in individual years and not exceed 1/10 of the total number of years [21–26]. This study sets gradient threshold for comparison. First, we found the time period of typhoon in Qinzhou, and then selected the maximum wind speed data of Qinzhou meteorological station in the same period to construct the sample sequence. The threshold was set so that there is no storm in individual years in the data age and cannot exceed 0%, 5%, 10%, 20% and 30% of the total years (The following abbreviations are threshold 0%, threshold 5%, threshold 10%, threshold 20%, threshold 30%). A new sample sequence was formed after the above screening. By comparing the results of different sample sequences, the influence of threshold value on the maximum wind speed calculation results of Poisson-Gumbel model was analyzed.
The corresponding threshold of 0% wind speed is 4.4 m/s, the existing data is 22 times, M is the total number of years, 2005-2018 a total of 14 years data. λ = 1.57.
Test Poisson distribution are as follows in Tab. 2:
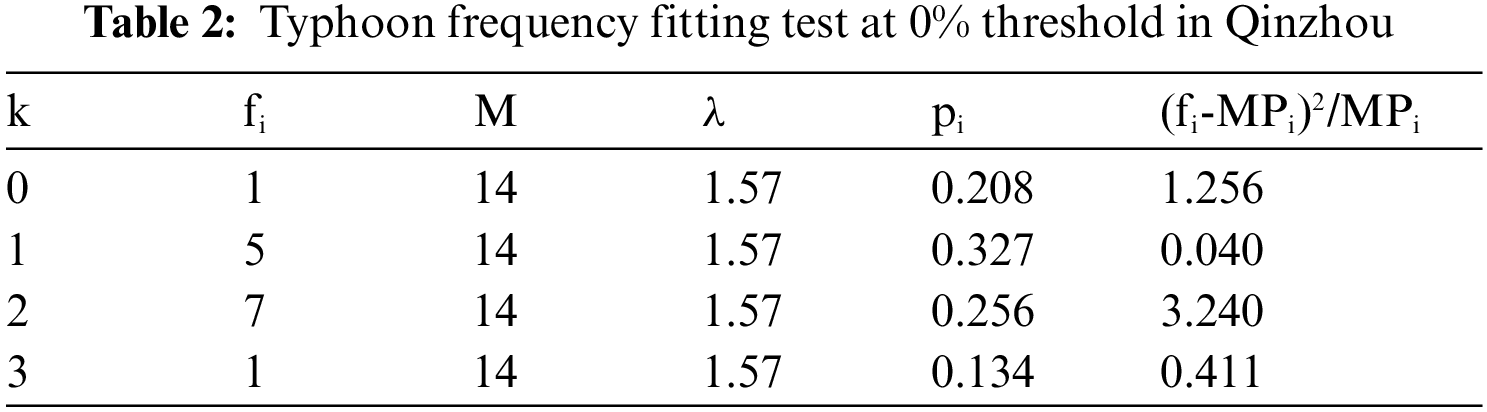
χ2 = 4.947 < α0.052
Note: fi is the number of years in which the number of typhoons is i in a year; pi is calculated by formula 7, which is the probability of i typhoon occurring in one year. The degree of freedom is the degree of freedom of chi square test. In this paper, the degree of freedom selects three variables: N, M and K.
The results showed that the typhoon data in Qinzhou conforms to Poisson distribution.
In this study, the time series of 22 typhoon samples constructed by 14-year data correspond to:
After processing based on SPSS,
The maximum wind speed in 50 years at Qinzhou station was calculated as X50 = 16.61 m/s.
The maximum wind speed of other different years is shown in Fig. 2:
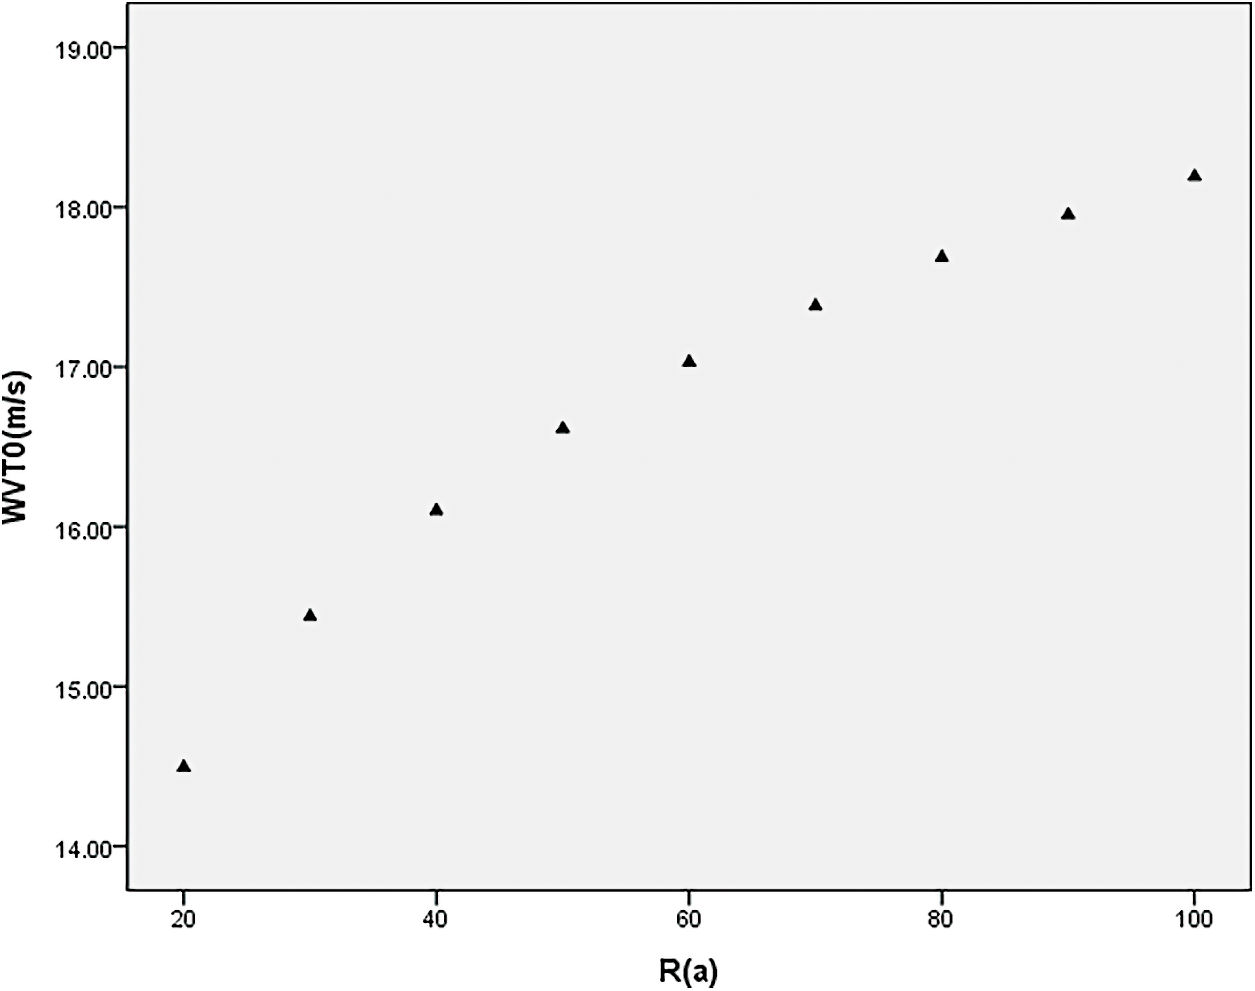
Figure 2: Maximum wind speed at Qinzhou station with different return periods at 0% threshold
The corresponding threshold of 5% wind speed is 4.8 m/s, the existing data is 21 times, M is the total number of years, 2005–2018 a total of 14 years data. λ = 1.5.
Test Poisson distribution are as follows in Tab. 3:
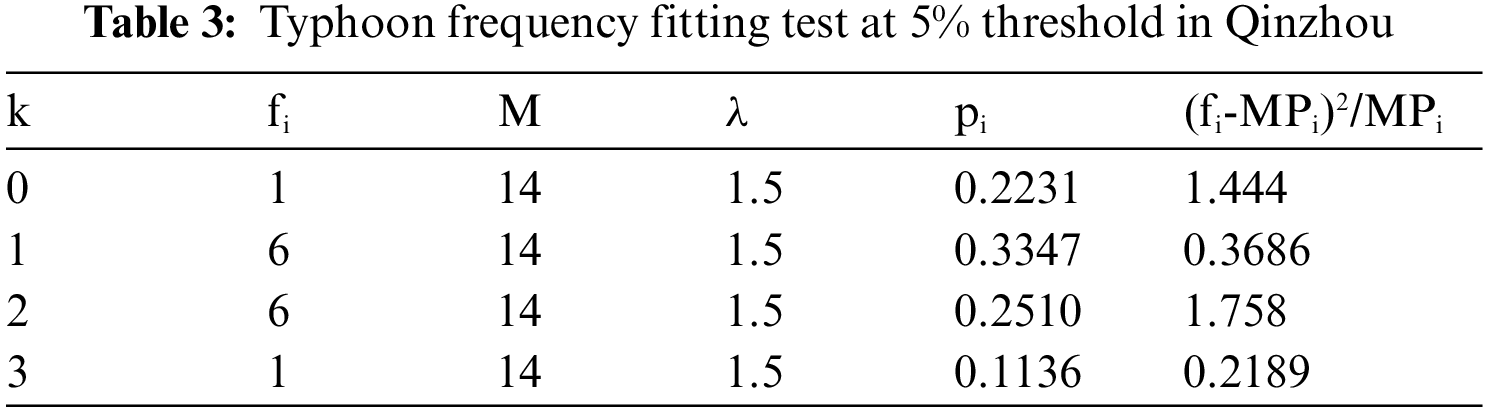
χ2 = 3.790 < α0.052
The results showed that the typhoon data in Qinzhou conforms to Poisson distribution.
In this study, the time series of 22 typhoon samples constructed by 14-year data correspond to:
After processing based on SPSS,
The maximum wind speed in 50 years at Qinzhou station was calculated as X50 = 16.43 m/s.
The maximum wind speed of other different years is shown in Fig. 3:
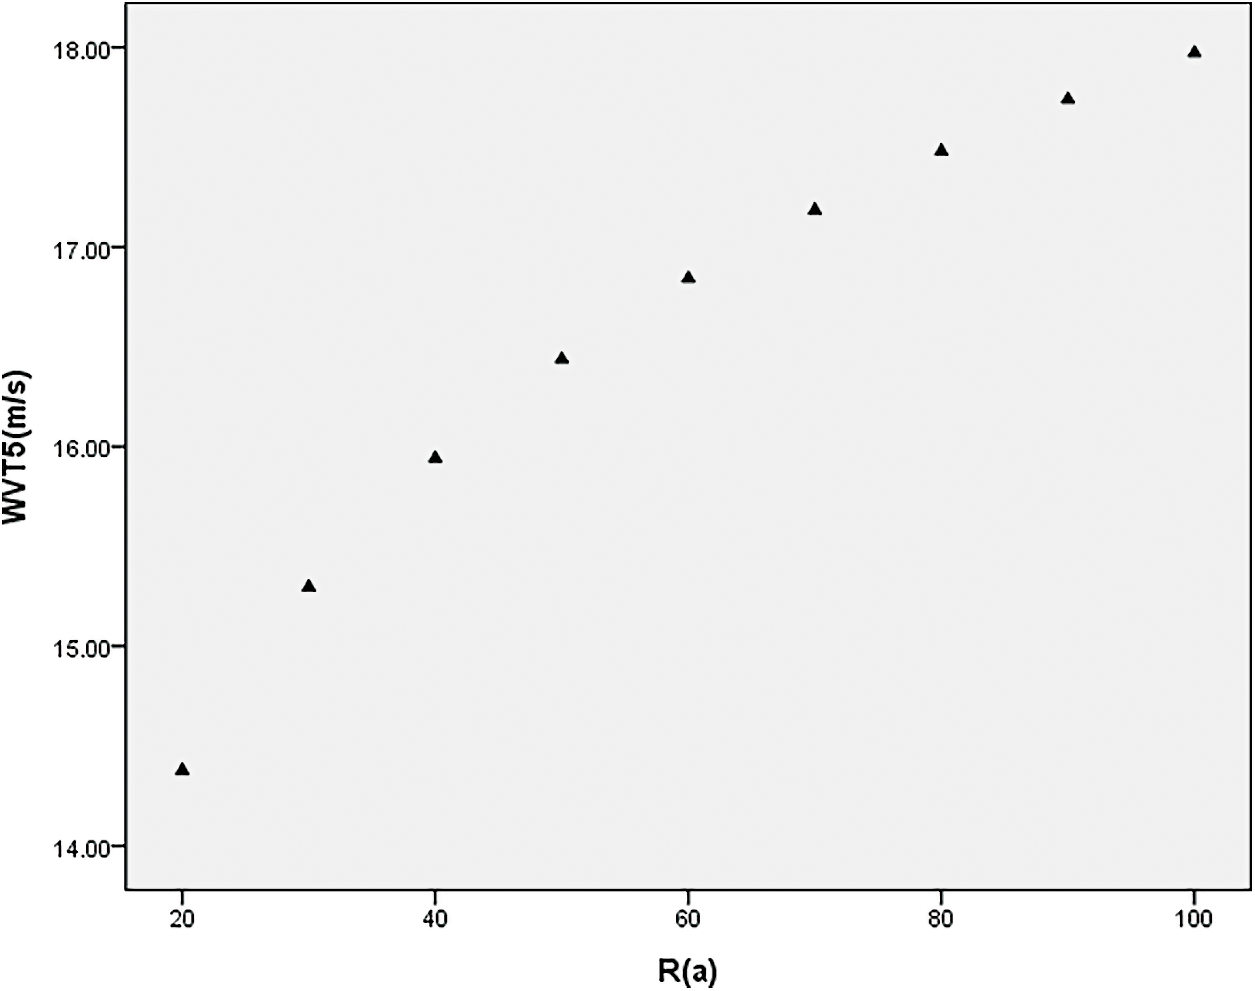
Figure 3: Maximum wind speed at Qinzhou station with different return periods at 5% threshold
The corresponding threshold of 10% wind speed is 5.2 m/s, the existing data is 20 times, M is the total number of years, 2005–2018 a total of 14 years data. λ = 1.429.
Test Poisson distribution are as follows in Tab. 4:
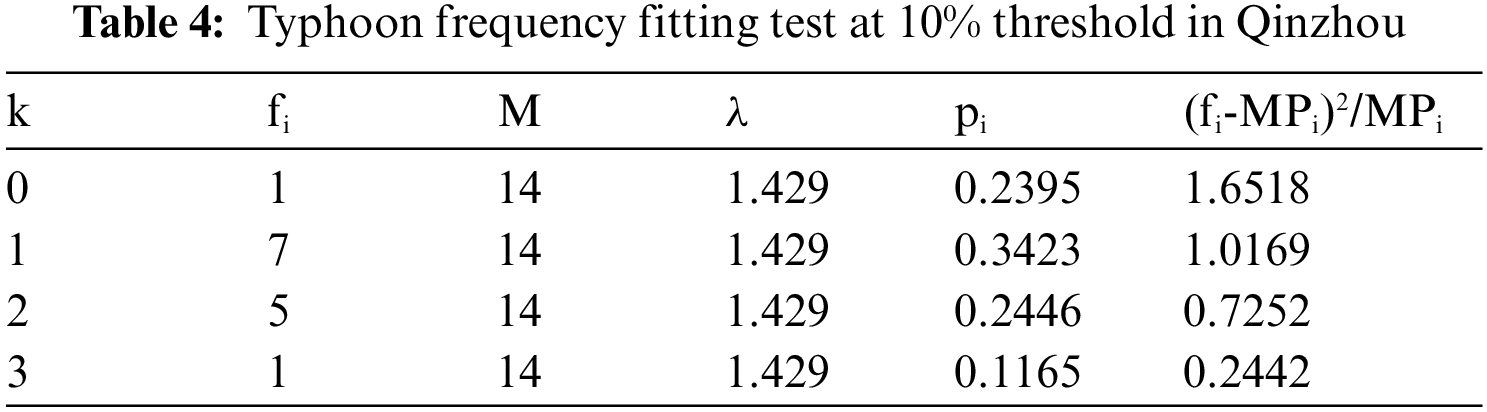
χ2 = 3.638 < α0.052
The results showed that the typhoon data in Qinzhou conforms to Poisson distribution.
In this study, the time series of 20 typhoon samples constructed by 14-year data correspond to:
After processing based on SPSS,
The maximum wind speed in 50 years at Qinzhou station was calculated as X50 = 16.29 m/s.
The maximum wind speed of other different years is shown in Fig. 4:
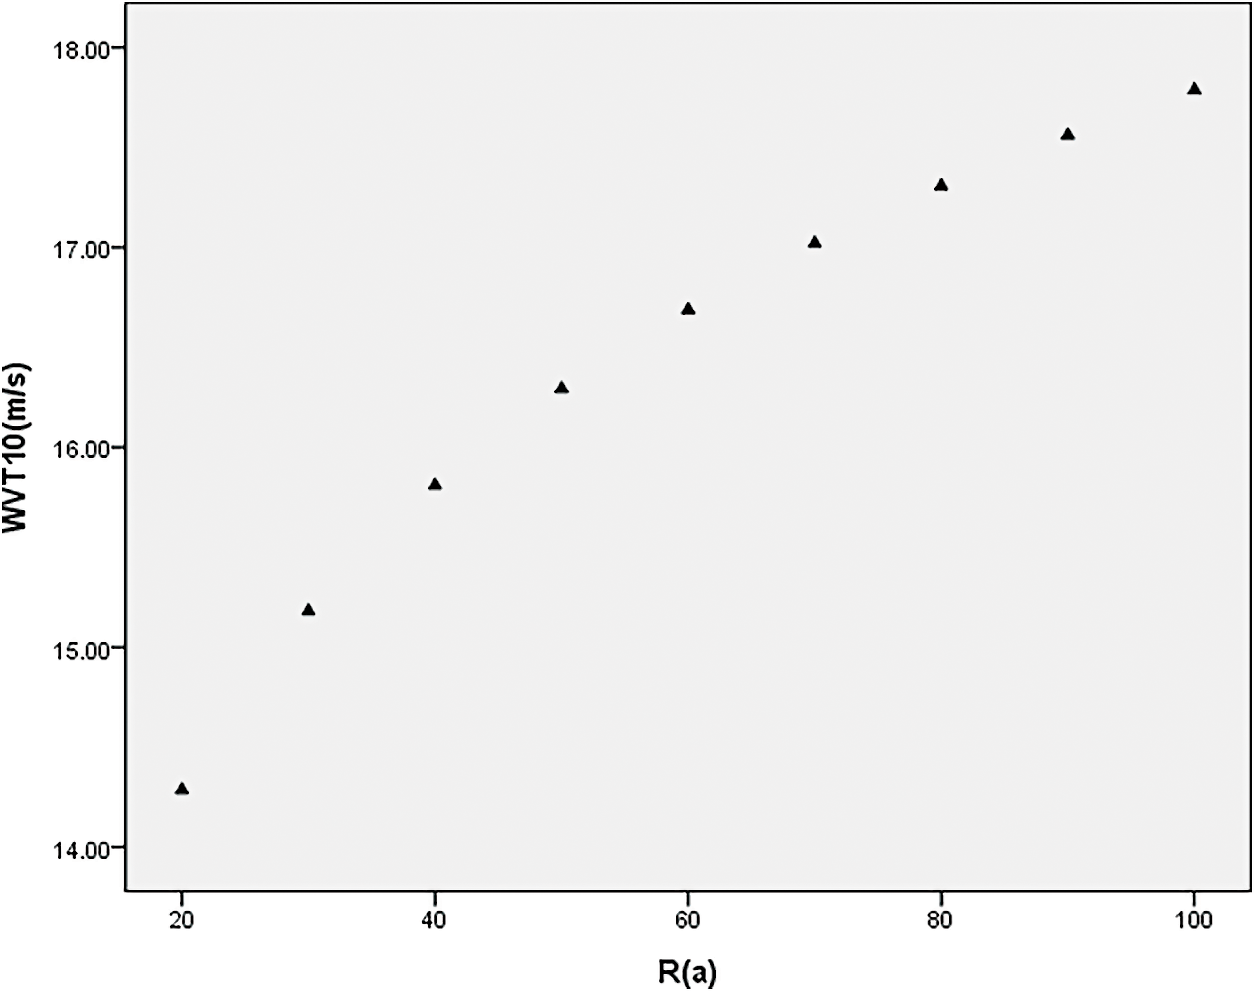
Figure 4: Maximum wind speed at Qinzhou station with different return periods at 10% threshold
The corresponding threshold of 20% wind speed is 5.8 m/s, the existing data is 18 times, M is the total number of years, 2005–2018 a total of 14 years data. λ = 1.286.
Test Poisson distribution are as follows in Tab. 5:
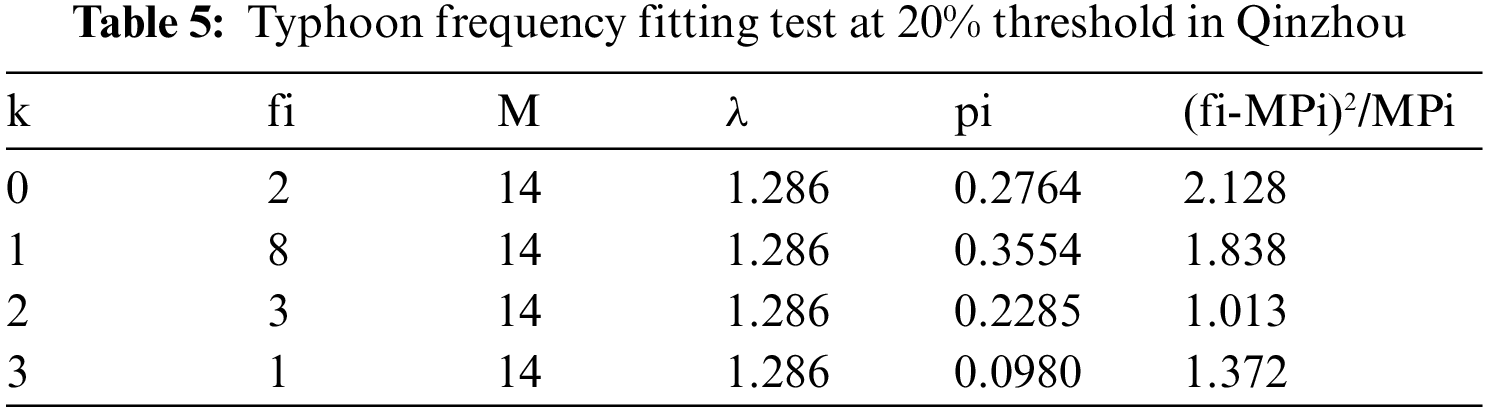
χ2 = 6.350 < α0.052
The results showed that the typhoon data in Qinzhou conforms to Poisson distribution.
In this study, the time series of 18 typhoon samples constructed by 14-year data correspond to:
After processing based on SPSS,
The maximum wind speed in 50 years at Qinzhou station was calculated as X50 = 15.85 m/s.
The maximum wind speed of other different years is shown in Fig. 5:
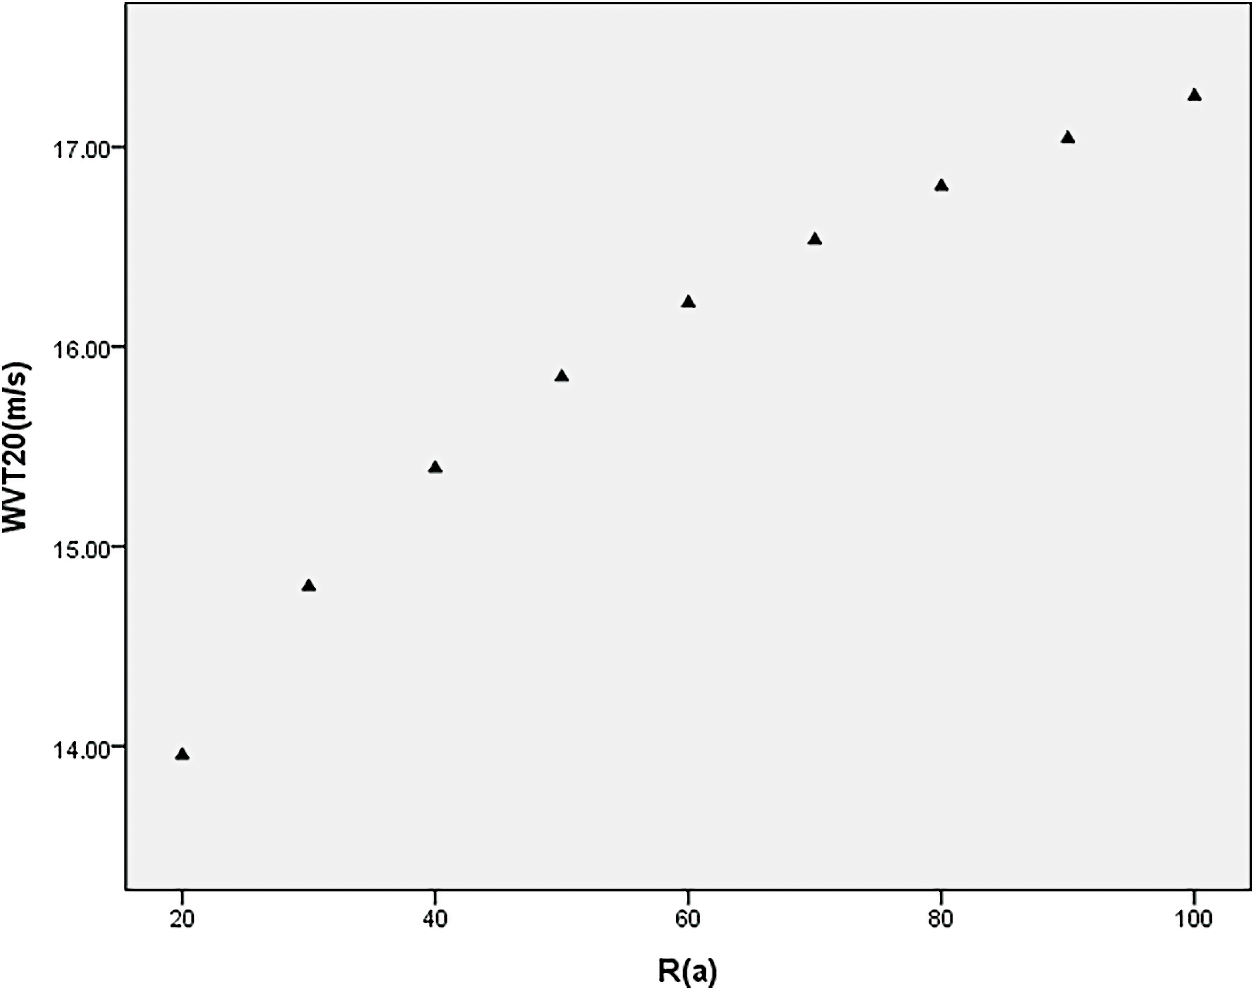
Figure 5: Maximum wind speed at Qinzhou station with different return periods at 20% threshold
The corresponding threshold of 30% wind speed is 7.3 m/s, the existing data is 14 times, M is the total number of years, 2005–2018 a total of 14 years data. λ = 1.071.
Test Poisson distribution are as follows in Tab. 6:
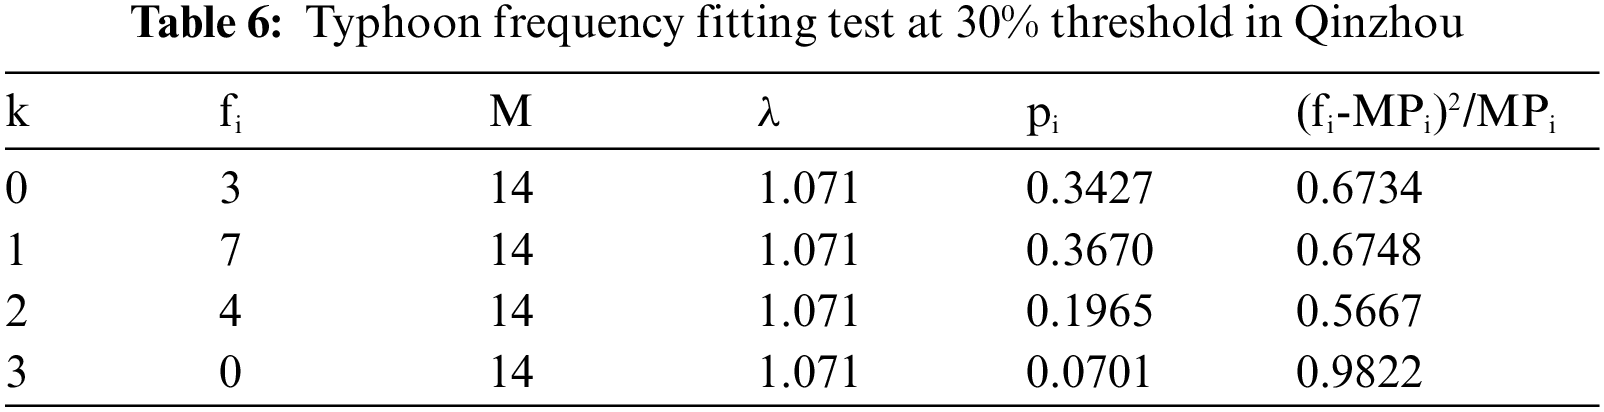
χ2 = 2.897 < α0.052
The results showed that the typhoon data in Qinzhou conforms to Poisson distribution.
In this study, the time series of 15 typhoon samples constructed by 14-year data correspond to:
After processing based on SPSS,
The maximum wind speed in 50 years at Qinzhou station was calculated as X50 = 15.55 m/s.
The maximum wind speed of other different years is shown in Fig. 6:
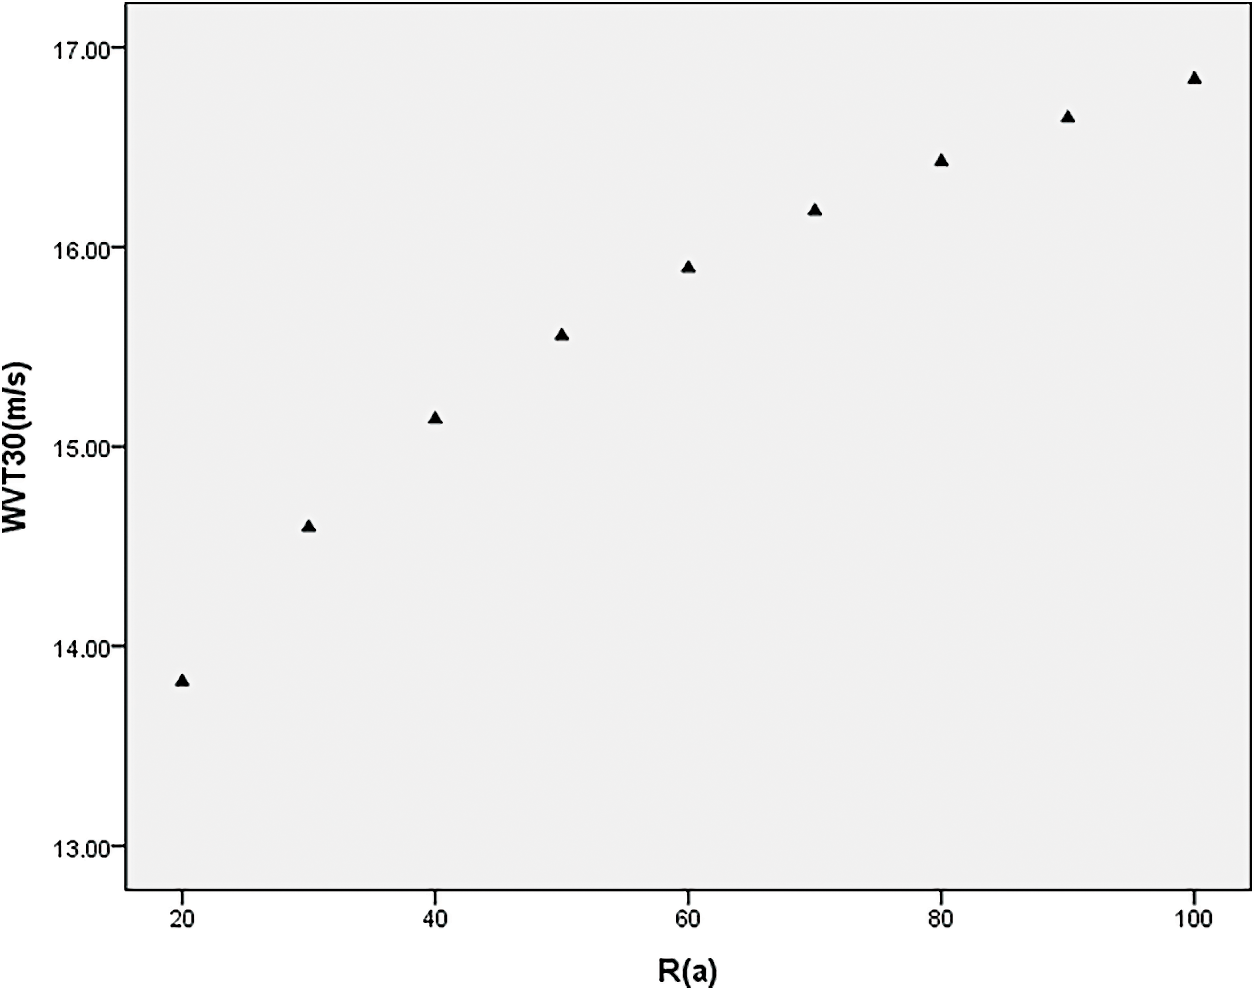
Figure 6: Maximum wind speed at Qinzhou station with different return periods at 30% threshold
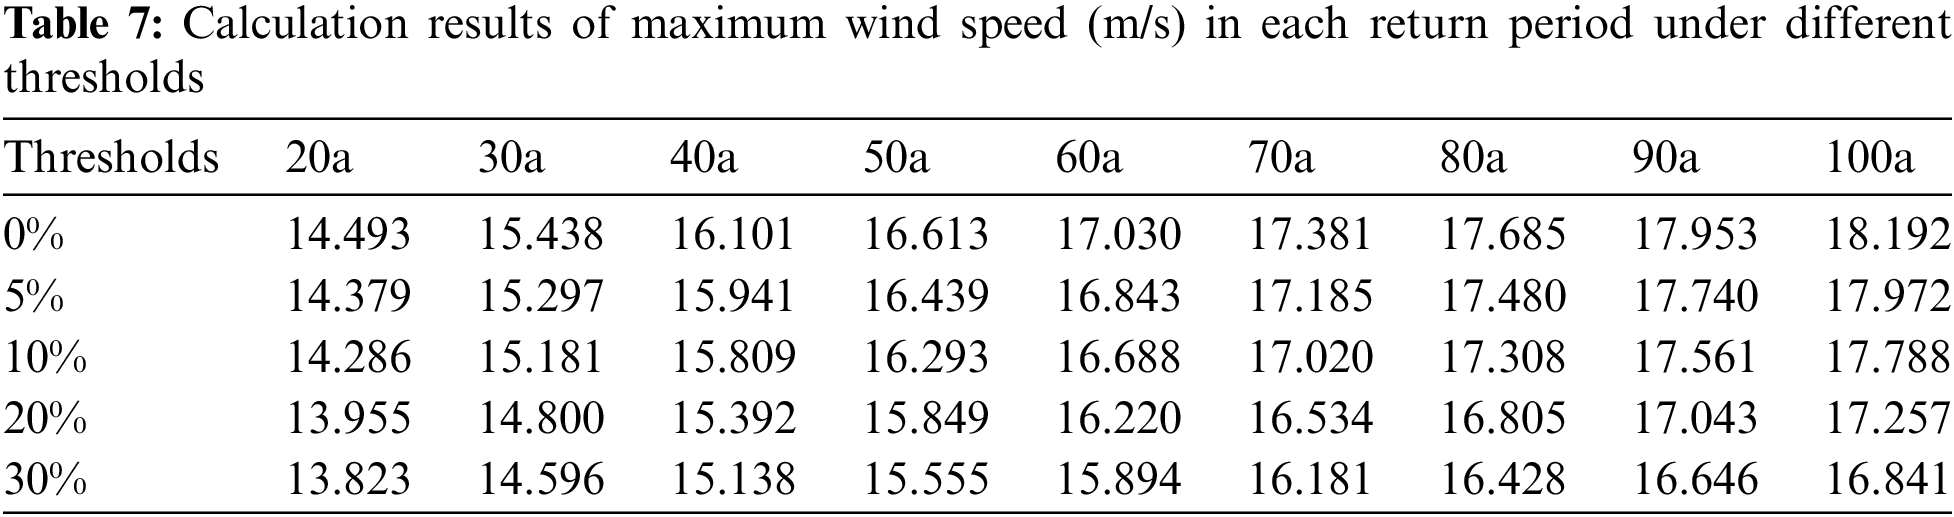
4.1 Comparison of Calculation Results of Maximum Wind Speed under Different Thresholds
It can be seen from Tab. 7 that when the threshold increases, the maximum wind speed calculation results of each return period will gradually decrease. This result is contrary to the conclusion of other scholars. In previous studies, it is often believed that when the threshold is low, the sample sequence is large, but the average wind speed is low, which will lead to the low calculation results of the maximum wind speed in the return period [18]. Therefore, the method of increasing the threshold is often used to prevent the low calculation results of return period wind speed. However, this study found that although the increase of the threshold will increase the average wind speed, the calculation results of the return period wind speed will also decrease with the decrease of the sample sequence. It showed that the length of sample sequence may have a positive effect on the wind speed calculation of return period in Gumbel method. This result is exactly consistent with the conclusion of the comparative study between the two models (Poisson-Gumbel joint distribution model and Gumbel model) [19]. In other words, the maximum wind speed calculation results of Gumbel model are often larger than those of Poisson-Gumbel model, which may be because it often has a longer sample sequence.
Nevertheless, the overall deviation of the maximum wind speed calculation is not large. From threshold 0 to threshold 30%, the maximum wind speed change of 100 a is reduced by 7.4%. From threshold 0 to threshold 10%, the maximum wind speed change of 100 a return period is reduced by 2.2%. When the return period is shorter, such as 20a, 30a and so on, the gap is smaller. In other words, usually using a 10% threshold to screen the sample sequence does not have much effect on the calculation of the maximum wind speed. Taking the 50 a return period as an example, this deviation is only 1.9%.
It is generally believed that the purpose of threshold setting is to make the sample sequence more consistent with Poisson distribution [20], but from the analysis of this example, the effect is not always so. The variation of χ2 with the threshold is shown in Fig. 7. Obviously, the overall trend is that χ2 decreases with the increase of threshold. The fitting equation is y = −0.0204 * x + 4.5899. Correlation coefficient R = 0.182, so linear trend is not obvious. When the threshold was 20%, χ2 = 6.350, which was the maximum of all tests. That is, when the threshold is 20%, the filtered sample sequence is not closer to the Poisson distribution than other sample sequences, even the low threshold sample sequence. However, when the threshold was raised from 20% to 30%, the sample sequence was much shorter and χ2 was significantly improved to 2.897. In summary, although the overall trend showed that the increase of threshold can indeed make χ2 decrease, the randomness of χ2 change was large when the specific threshold was selected. In terms of Qinzhou, the effect of the 20% threshold was not ideal.
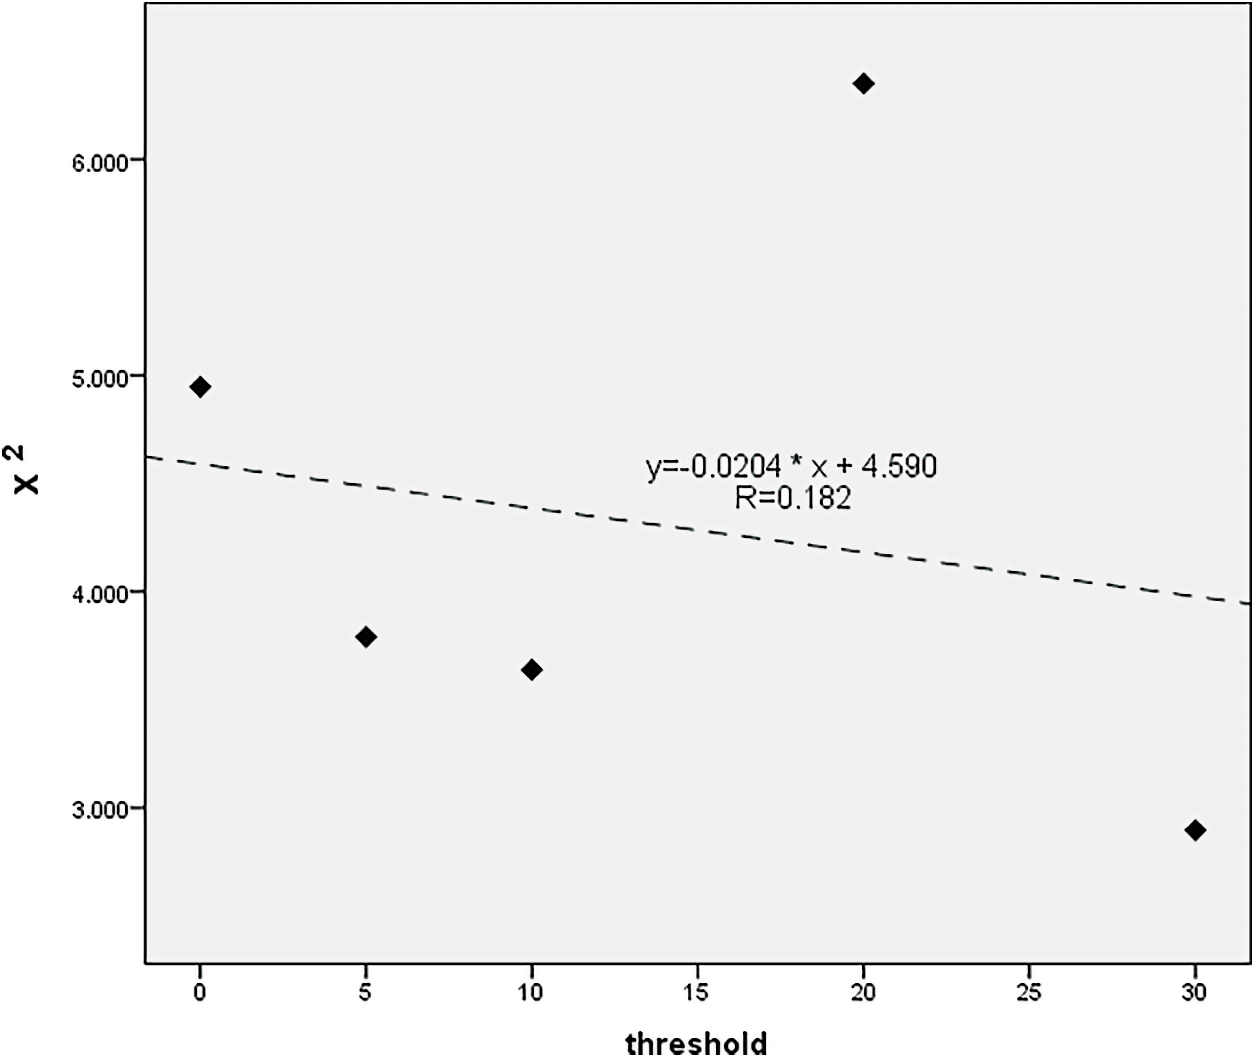
Figure 7: χ2 changes with threshold
In this study, the sample sequence was constructed based on the data of Qinzhou meteorological station from 2005 to 2018. The influence of threshold value on the estimation of maximum wind speed based on Poisson-Gumbel model was compared by setting gradient threshold. The main conclusions are as follows:
1. When the threshold increases, the maximum wind speed calculation results of each return period will gradually decrease. It indicated that the length of sample sequence may have a positive effect on the calculation of wind speed in the return period in the Gumbel method and Poisson-Gumbel method. Although the increase of the threshold increases the average value of the maximum wind speed of the sample sequence, it shortens the length of the sample sequence, resulting in a lower calculated value of the maximum wind speed. Although this deviation is not large. Taking the common 10% threshold setting as an example, the maximum wind speed calculation deviation of 50 a return period was about 1.9%.
2. The threshold is set to make the sample sequence more in line with the Poisson distribution, but this case study shows that its effect is needed further exploration. Although from the overall trend, the increase of the threshold made χ2 decrease, the correlation coefficient of linear fitting was only 0.182. In the specific threshold selection, the randomness of χ2 change is large. Taking Qinzhou meteorological station data as an example, the χ2 set at 20% threshold was as high as 6.35, and the selected sample sequence was not ideal.
The above research results show that this 1/10 setting method is not universal. If you want to achieve a better threshold setting effect, it is best to set the threshold by gradient and compare it.
Funding Statement: This work was supported by the Second Tibet Plateau Scientific Expedition and Research Program (STEP) under grant number 2019QZKK0804, and the National Natural Science Foundation of China “Study on the dynamic mechanism of grassland ecosystem response to climate change in Qinghai Plateau” under grant number U20A2098.
Conflicts of Interest: The authors declare that they have no conflicts of interest to report regarding the present study.
1. Z. D. Duan, J. P. Ou and D. C. Zhou, “The optimal probabilistic distribution for extreme wind speed,” China Civil Engineering Journal, vol. 35, no. 5, pp. 11–16, 2002. [Google Scholar]
2. W. J. Gong, W. X. Li and G. M. Zhang, “The estimation algorithm on the probabilistic distribution parameters of wind speed based on Weibull distribution,” Renewable Energy Resources, vol. 29, no. 6, pp. 20–23, 2011. [Google Scholar]
3. J. Y. Yan and A. F. Huang, “A study of calculation methods for extreme wind speed over the China Sea,” Acta Meteorologica Sinica, vol. 54, no. 2, pp. 233–239, 1996. [Google Scholar]
4. Q. Z. Meng, Z. W. Wang, X. Feng and Q. F. Liang, “Asymptotic distributions of yearly maximum surface temperature and wind in Chongqing district,” Journal of Chengdu University of Information Technology, vol. 19, no. 3, pp. 436–441, 2004. [Google Scholar]
5. H. H. Huang, L. L. Song, S. Q. Zhi and A. J. Liu, “Comparison of estimation of wind speed extreme—I distribution parametersin guangdong province,” Meteorological Monthly, vol. 33, no. 3, pp. 101–106, 2007. [Google Scholar]
6. Y. N. Zhang, Y. Q. Wang, Y. Zhang, Y. J. Shi and N. Li, “Calculation and analysis of basic wind pressure value based on Gumbel distribution,” Journal of Civil, Architectural & Environmental Engineering, vol. 34, no. 2, pp. 27–31, 2012. [Google Scholar]
7. R. K. Hou, “Calculation of annual maximum water level using Gumbel distribution,” Marine Science Bulletin, vol. 12, no. 3, pp. 126–129, 1993. [Google Scholar]
8. Y. L. Qu, S. Y. Yan and C. D. Zhang, “On asymptotic distributions for extremes of surface temperature and surface wind over china,” Acta Meteorologica Sinica, vol. 46, no. 2, pp. 187–193, 1988. [Google Scholar]
9. G. Q. Qiao, X. Feng, W. B. Feng, Y. C. Lu and X. E. Li, “Statistical analysis of the spatial and temporal distribution and intensity characteristics of Tropical Cyclones in the South China Sea,” Marine Forecasts, vol. 36, no. 6, pp. 53–61, 2019. [Google Scholar]
10. D. Li and D. M. Wei, “Investigation of selection methods for extreme wind speed in the engineering structure design,” Journal of North University of China (Natural Science Edition), vol. 31, no. 4, pp. 377–382, 2010. [Google Scholar]
11. M. D. Zalina, M. N. M. Desa, V. T. V. Nguyen and A. H. M. Kassim, “Selecting a probability distribution for extreme rainfall series in Malaysia,” Water Science and Technology: A Journal of the International Association on Water Pollution Research, vol. 45, no. 2, pp. 63–68, 2002. [Google Scholar]
12. S. X. Cao and Z. S. Chen, “Probability distributions of extreme wind speeds in the coast of Guangdong,” Marine Science Bulletin, vol. 32, no. 1, pp. 12–18, 2013. [Google Scholar]
13. G. L. Gan, X. R. Tian, D. L. Zhang, Y. Xiang and Y. Luo, “The intensity analysis and extreme value inference of tornadoes,” Scientia Meteorologica Sinica, vol. 19, no. 1, pp. 99–103, 1999. [Google Scholar]
14. X. Q. Guo, W. Q. Guo, L. Qian and T. Zeng, “Climate characteristics of the maximum wind speedin northeastern margin of Qilian Mountain,” Arid Land Geography, vol. 38, no. 3, pp. 446–453, 2015. [Google Scholar]
15. C. H. Lu, “Characteristics of maximum wind velocity and estimation of extreme maximum velocity in return period,” Meteorological Science and Technology, vol. 38, no. 3, pp. 399–402, 2010. [Google Scholar]
16. I. S. Kocher, “An experimental simulation of addressing auto-configuration issues for wireless sensor networks,” Computers, Materials & Continua, vol. 71, no. 2, pp. 3821–3838, 2022. [Google Scholar]
17. Y. Luo, L. S. Zhu and J. P. Hu, “A new method for determining threshold in using PGCEVD to calculate return values of typhoon wave height,” China Ocean Engineering, vol. 26, no. 2, pp. 251–260, 2012. [Google Scholar]
18. R. Y. Zhang, X. Z. Zhang and L. W. Cai, “Application of Poisson-Gumbel distribution to wind speed calculation for the southeast coastland of China,” Journal of Applied Meteorological Science, vol. 21, no. 2, pp. 237–242, 2010. [Google Scholar]
19. B. Wang, W. C. Liu and L. X. Dong, “The extreme wind speed estimation based on the Possion-Gumbel method,” Low Temperature Architecture Technology, vol. 43, no. 271, pp. 27–30, 2021. [Google Scholar]
20. Z. Q. Gao, X. Z. Zhang and J. L. Sun, “Comparison of the methods of maximum wind speed calculation in fifty years,” Wind Energy, vol. 5, no. 4, pp. 70–75, 2014. [Google Scholar]
21. M. T. Mahmood, “Defocus blur segmentation using genetic programming and adaptive threshold,” Computers, Materials & Continua, vol. 70, no. 3, pp. 4867–4882, 2022. [Google Scholar]
22. Y. A. V. Krishna and A. A. Leema, “Etm-iot: Energy-aware threshold model for heterogeneous communication in the internet of things,” Computers Materials & Continua, vol. 70, no. 1, pp. 1815–1827, 2022. [Google Scholar]
23. S. Albahli and G. Nabi, “Defect prediction using akaike and bayesian information criterion,” Computer Systems Science and Engineering, vol. 41, no. 3, pp. 1117–1127, 2022. [Google Scholar]
24. L. Shen, Y. Tian, L. Zhang, G. Yin, T. Shuai et al., “Threshold filtering semi-supervised learning method under the condition of out-of-class samples for sar target recognition,” in The 8th Int. Conf. on Artificial Intelligence and Security, Qinghai, China, 2022. [Google Scholar]
25. D. Liu, S. Q. Wen and L. P. Wang, “Poisson-mixed Gumbel composite extreme value distribution and application,” Science Bulletin, vol. 47, no. 17, pp. 1356–1360, 2002. [Google Scholar]
26. M. M. Qi, C. Zhou, J. L. Zhang and F. T. Hu, “Taiwan hualien harbor designed wind velocity estimating using poisson P-III distribution,” Bulletin of Science and Technology, vol. 31, no. 11, pp. 18–21, 2015. [Google Scholar]
 | This work is licensed under a Creative Commons Attribution 4.0 International License, which permits unrestricted use, distribution, and reproduction in any medium, provided the original work is properly cited. |