DOI:10.32604/cmc.2022.027327
| Computers, Materials & Continua DOI:10.32604/cmc.2022.027327 | |
| Article |
Arithmetic Optimization with Deep Learning Enabled Anomaly Detection in Smart City
1Information Technology Department, Faculty of Computing and Information Technology, King Abdulaziz University, Jeddah, 21589, Saudi Arabia
2Centre of Artificial Intelligence for Precision Medicines, King Abdulaziz University, Jeddah, 21589, Saudi Arabia
3Mathematics Department, Faculty of Science, Al-Azhar University, Naser City, 11884, Cairo, Egypt
4Information Systems Department, Faculty of Computing and Information Technology King Abdulaziz University, Jeddah, 21589, Saudi Arabia
*Corresponding Author: Mahmoud Ragab. Email: mragab@kau.edu.sa
Received: 14 January 2022; Accepted: 30 March 2022
Abstract: In recent years, Smart City Infrastructures (SCI) have become familiar whereas intelligent models have been designed to improve the quality of living in smart cities. Simultaneously, anomaly detection in SCI has become a hot research topic and is widely explored to enhance the safety of pedestrians. The increasing popularity of video surveillance system and drastic increase in the amount of collected videos make the conventional physical investigation method to identify abnormal actions, a laborious process. In this background, Deep Learning (DL) models can be used in the detection of anomalies found through video surveillance systems. The current research paper develops an Internet of Things Assisted Deep Learning Enabled Anomaly Detection Technique for Smart City Infrastructures, named (IoTAD-SCI) technique. The aim of the proposed IoTAD-SCI technique is to mainly identify the existence of anomalies in smart city environment. Besides, IoTAD-SCI technique involves Deep Consensus Network (DCN) model design to detect the anomalies in input video frames. In addition, Arithmetic Optimization Algorithm (AOA) is executed to tune the hyperparameters of the DCN model. Moreover, ID3 classifier is also utilized to classify the identified objects in different classes. The experimental analysis was conducted for the proposed IoTAD-SCI technique upon benchmark UCSD anomaly detection dataset and the results were inspected under different measures. The simulation results infer the superiority of the proposed IoTAD-SCI technique under different metrics.
Keywords: Object detection; anomaly detection; smart city infrastructure; deep learning; parameter tuning
Video surveillance systems have been widely installed in the recent years for monitoring the crowd at public places. The video information generated by such systems is complex, huge and in different formats while Traditional manual analysis to label abnormal events in such data is challenging and time-consuming in nature. Thus, a smart surveillance scheme and a hotspot of Computer Vision (CV) applications and researches are immediately required to detect and recognize anomalies [1]. But localization and anomaly detection remain a challenge in smart video surveillance. However, considerable development has occurred in the recent years in terms of behavior modeling, anomaly measuring, and feature extraction. One of the primary challenges in anomaly detection is that the description of the anomaly is indeterminate in almost all real-time surveillance videos. Generally, an event that is considerably distinct from general event is classified as anomaly. In other terms, anomalies are determined as common events rather than details of themselves or classifications [2]. An event which is anomalous in one scene (people running) may not be necessarily anomalous in another scene. This is because the common event in another scene might include the person running, while the initial scene does not. Thus, anomaly is composed of inadequate similarities and sizes to be efficiently modelled. Essentially, anomaly detection for crowd scenes has an innovation detection that is called a one-class, semi-supervised learning problem [3]. This is because the training data of the current dataset comprises of common events, where the information to be confirmed has abnormal as well as normal events. Fig. 1 illustrates the structure of smart city.

Figure 1: Smart city infrastructure
Several CV methods that depends upon work, have been presented earlier. These methods focus on the operation including scene learning, data acquisition, behavioural learning, feature extraction, activity learning, etc [4]. The main objective is to calculate the operation that includes video processing model, anomaly predictive approach, scene detection, human behavior learning, vehicle prediction, multiple camera-based challenges and schemes, vehicle observation, traffic observation, activity examination, etc. Now, anomalous prediction is considered as a sub-region of behavioral learning in the captured visual scene [5]. The availability of video captured in public places has led to anomalous prediction and the simulation of video analysis. Furthermore, anomaly prediction methods understand to differentiate the normal behavior through training. Any important changes that deviate from common behavior are considered as anomalous. Sudden dispersion of people from a crowd, presence of vehicles on pathways, jaywalking, person fainting when walking, U-turn of vehicles at red signals and signal bypasses at a traffic junction are some of the instances of anomalies [6]. Recently, Deep Learning (DL) method has attained an outstanding achievement in a number of CV methods that include object detection and classification since the application depends upon supervised learning.
The current research work develops an Internet of Things Assisted Deep Learning Enabled Anomaly Detection Technique for Smart City Infrastructures, abbreviated as (IoTAD-SCI) technique. The proposed IoTAD-SCI technique involves the design of Deep Consensus Network (DCN) model to detect the anomalies in input video frames. In addition, Arithmetic Optimization Algorithm (AOA) is implemented to fine tune the hyperparameters of DCN technique. Moreover, ID3 classifier is also utilized to classify the identified objects under different classes. The experimental analysis was conducted for IoTAD-SCI technique upon benchmark UCSD anomaly detection dataset and the results were inspected under different measures.
Li et al. [7] proposed an anomaly detection model and video anomaly event feature. At first, dense optical flow of video was attained and the data of optical flow was converted into histogram features of the optical flow. Next, the space-time cube of video was created using space-time relation of the video. At last, sparse depiction technique was utilized to model the entire procedure. Font et al. [8] used real-time information from smart cities of Barcelona to identify typical attacks and simulate WSN as and when required. Next, the researchers compared the commonly-utilized anomaly detection methods that disclose such attacks. The algorithm was evaluated under distinct necessities on access network data.
Alrashdi et al. [9] presented an Anomalous Detection-IoT (AD-IoT) method i.e., a smart anomalous detection-based RF-ML method. The presented method was able to identify the compromised IoT devices in distribution fog nodes efficiently. To estimate the presented method, the study employed current datasets to demonstrate the accuracy of the algorithm. Chackravarthy et al. [10] introduced a NN approach as well as a Hybrid Deep Learning method to analyze the video stream data. The presented method was capable of identifying and assessing the criminal activities quickly. This sequentially reduced the manual workload on supervisors. While the method was executed through smart city framework, it also allowed one to an adaptable and efficient crime detection method.
Kang et al. [11] introduced an NN-based model which integrates the idea of AUC using Multi-Instance Learning (MIL) model. The authors created MI-AUC method which forecasts high anomaly scores for anomalous segments. Moreover, sparsity and temporal smoothness limitations were also employed in this study from loss function for effective anomalous detection. Chen et al. [12] designed an architecture-based bi-directional prediction that forecasts a similar target frame by both forward and backward predictive subsystems, correspondingly. Next, the loss function is formulated on the basis of bi-directional predictive frame and real-time target frame. Additionally, an anomaly score assessment model-based sliding window system was presented in this study that focuses on the foreground of predictive error map.
Ullah et al. [13] developed an effective deep feature-based intelligent anomaly detection method. In the presented method, the spatiotemporal features were initially extracted from a sequence of frames by passing everyone to a pre-trained CNN method. The feature extracted from the series of frames is beneficial in terms of capturing anomalous actions. Next, the extracted deep feature is passed onto multilayer Bi-LSTM method that could precisely categorize the ongoing normal or anomalous events in complicated surveillance scenes.
In current study, an effective IoTAD-SCI technique is developed to identify the presence of anomalies in smart city environment. The proposed IoTAD-SCI technique involves the design of DCN technique to detect anomalies in input video frames. Followed by, AOA is applied to fine tune the hyperparameters of DCN technique whereas ID3 classifier is utilized to classify the identified objects under different classes.
3.1 Object Detection Using DCN Model
In initial stage, DCN model is applied for the identification of objects that exist in input video frame. DCN has an analogous structure alike RetinaNet [14]. It makes use of Feature Pyramid Network (FPN) for feature extraction at different scales from ResNet-50 mainstream by following squeeze-and-excite method for the residual. In order to detect smaller objects, higher-resolution variants of FPN is employed in this study. It is utilized for Leaky ReLU activation function and group normalization. The feature extraction maps, at all the scales, are transmitted to Centroid Proposal Network (CPN). In comparison with Region Proposal Network (RPN) that predicts the bounding boxes, CPN forecasts a subset of centroids
For every spatial location in a
Whereas
For mathematical reason, CPN predicts the logit (logarithm of odds)
3.2 Hyperparameter Tuning Using AOA
In order to proficiently adjust the hyperparameters of DCN model, AOA is utilized. AOA is stimulated on the basis of basic arithmetic operators used in mathematics. In line with other optimization algorithms, AOA mainly operates on two searching processes namely, exploration and exploration [16], depending upon the arithmetic operators like
Then, the fitness values of all the solutions are determined to identify the optimal solution,
where
where
where

3.3 ID3 Based Classification Model
Once the objects are detected in input frame, ID3 classifier is applied to classify the objects as either anomalies or non-anomalies. Id3 method selects the testing features by comparing and calculating their data gains. Here,
Here,
Consider
The less data amount needed; the more purity of sub-data set is.
While
viz., the number of new data needed minus the number of original data needed. Choose the attributes with maximal
4 Experimental Results and Discussion
The experimental analysis was conducted upon the proposed IoTAD-SCI technique using UCSD dataset [19]. In this study, two testbeds namely, Test007 and Test005 were used for simulation and these datasets comprise a total of 360 frames with 12 s duration. Fig. 2 demonstrates the sample test images with ground truth of the anomalies that exist in the image.
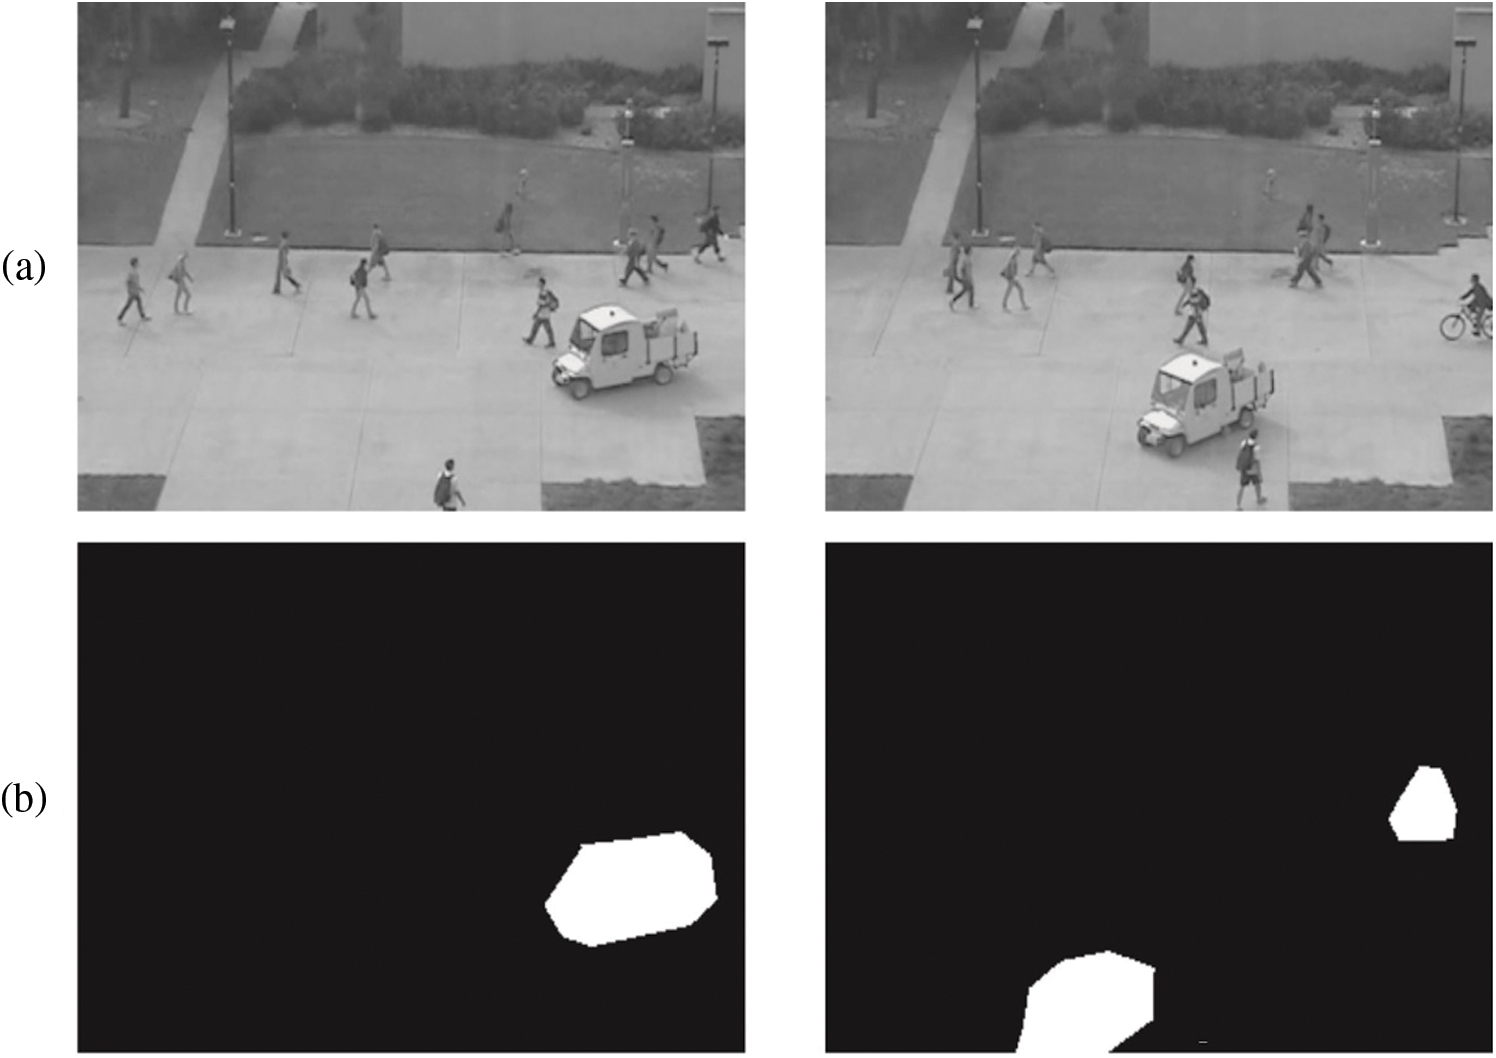

Figure 2: Sample images (a and c) ground truth (b and d)
Fig. 3 visualizes the outcome of the proposed IoTAD-SCI technique on test image. From the figure, it can be understood that the presented IoTAD-SCI technique identified the presence of two anomalies namely ‘bicycle and truck’ in an efficient manner.

Figure 3: Anomaly detected image
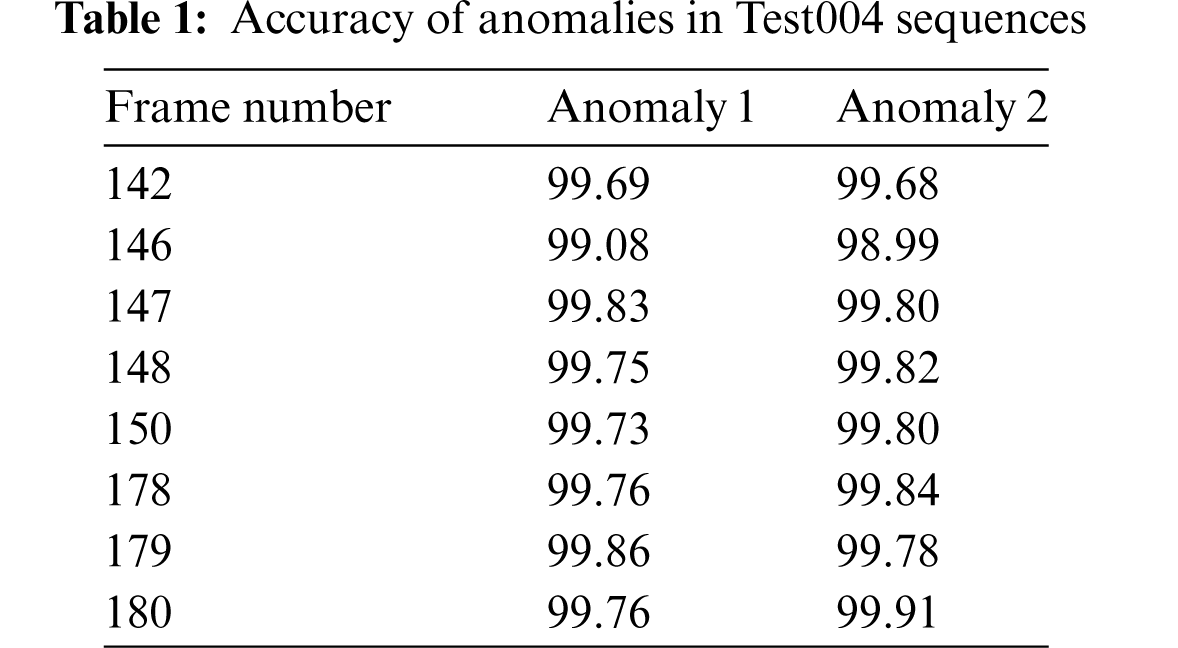
Tab. 1 provides the results of detection analysis accomplished by IoTAD-SCI technique on Test004 testbed. The results indicate that the presented IoTAD-SCI technique effectually identified all the anomalies with maximum accuracy. For instance, on 142 frames, IoTAD-SCI technique identified anomalies [1,2] with
A brief comparative anomaly detection analysis was conducted between the proposed IoTAD-SCI technique and other methods and the results are shown in Fig. 4. The outcomes report that the proposed IoTAD-SCI approach achieved effectual outcomes under all the frames. For instance, with 142 frames, IoTAD-SCI technique offered a high accuracy of 99.69% whereas DLAD, RSCNN, FRCNN, and MDT techniques obtained the least accuracy values namely, 99.37%, 98.49%, 93.21%, and 81.39%. Concurrently, with 180 frames, the proposed IoTAD-SCI technique achieved an increased accuracy of 99.84%, whereas DLAD, RSCNN, FRCNN, and MDT techniques reached low accuracy values such as 99.19%, 99.14%, 86.08%, and 85.84% respectively.

Figure 4: Accuracy analysis of IoTAD-SCI technique under test004 testbed
Fig. 5 highlights the ROC analysis results achieved by IoTAD-SCI technique on test004 testbed. The figure reports the enhanced anomaly detection outcomes of IoTAD-SCI technique with an increased ROC value of 99.9452.

Figure 5: ROC analysis of IoTAD-SCI technique under test004 testbed
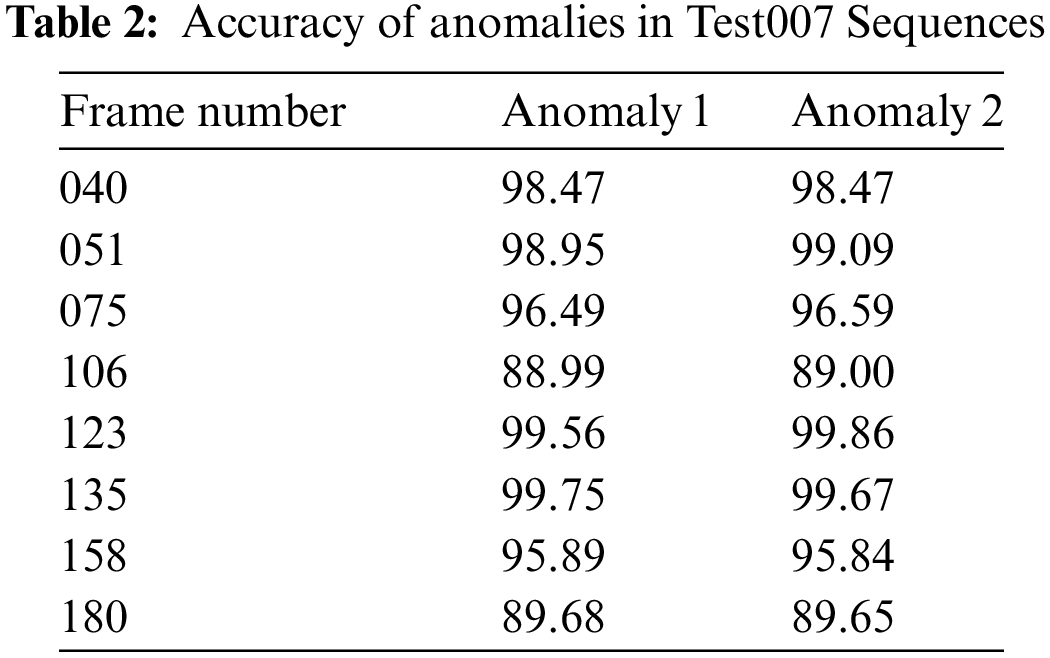
Tab. 2 offers the results of detection analysis accomplished by IoTAD-SCI approach on Test007 testbed. The results indicate that the proposed IoTAD-SCI technique effectually identified all the anomalies with maximum accuracy. For instance, on 040 frames, IoTAD-SCI methodology identified the anomalies [1,2] with
A detailed comparative anomaly detection analysis was conducted upon IoTAD-SCI approach against other techniques and the results are shown in Fig. 6. The outcomes demonstrate that the proposed IoTAD-SCI system produced effective outcomes under all the frames. For sample, with 042 frames, the presented IoTAD-SCI technique offered a high accuracy of 98.47%, whereas DLAD, RSCNN, FRCNN, and MDT techniques attained the minimal accuracy values namely, 97.52%, 94.62%, 89.98%, and 85.17% respectively. In addition, with 180 frames, IoTAD-SCI approach offered a maximum accuracy of 89.67%, whereas DLAD, RSCNN, FRCNN, and MDT methodologies reached low accuracy values such as 88.58%, 83.65%, 81.65%, and 80.88% correspondingly.

Figure 6: Accuracy analysis of IoTAD-SCI technique under test007 testbed
Fig. 7 demonstrates the ROC analysis graph generated by IoTAD-SCI approach upon test007 testbed. The figure reveals the improved anomaly detection outcomes of IoTAD-SCI approach with a maximum ROC of 99.9452.

Figure 7: ROC analysis of IoTAD-SCI technique under test007 testbed
Figs. 8 and 9 show the average anomaly detection outcomes of the presented IoTAD-SCI technique against recent methods on two testbeds. The figure reports that the proposed IoTAD-SCI technique has the ability to effectively identify the anomalies on both testbeds. For instance, with Test004 testbed, IoTAD-SCI technique reached a high average accuracy value i.e., 99.70% whereas DLAD, RSCNN, FRCNN, and MDT techniques obtained low average accuracy values such as 99.22%, 98.84%, 86.60%, and 81.27% respectively. Similarly, with Test007 testbed, the proposed IoTAD-SCI technique reached an increased average accuracy of 96%, whereas DLAD, RSCNN, FRCNN, and MDT techniques achieved low average accuracy values namely, 95.01%, 91.84%, 88.34%, and 84.03%.

Figure 8: Average accuracy analysis results of IoTAD-SCI technique under test004 testbed

Figure 9: Average accuracy analysis results of IoTAD-SCI technique under test007 testbed
Finally, running time analysis was conducted between the proposed IoTAD-SCI system and the existing models and the results are shown in Tab. 3 and Fig. 10 [20–22]. The results demonstrate that the presented IoTAD-SCI technique required minimal running time compared to other techniques. For instance, with Test004 testbed, the IoTAD-SCI technique offered a minimum running time of 10.159 s, whereas DLAD, RSCNN, FRCNN, and MDT techniques demanded the maximum running times such as 10.825, 12.355, 12.403 and 12.463 s respectively. At the same time, with Test007 testbed, the proposed IoTAD-SCI technique produced a low running time of 10.504s, whereas DLAD, RSCNN, FRCNN, and MDT techniques attained a maximum running time of 11.043, 11.480, 11.876 and 12.000 s respectively. Based on the results and discussion made above, it can be understood that the proposed IoTAD-SCI technique is superior compared to existing techniques.
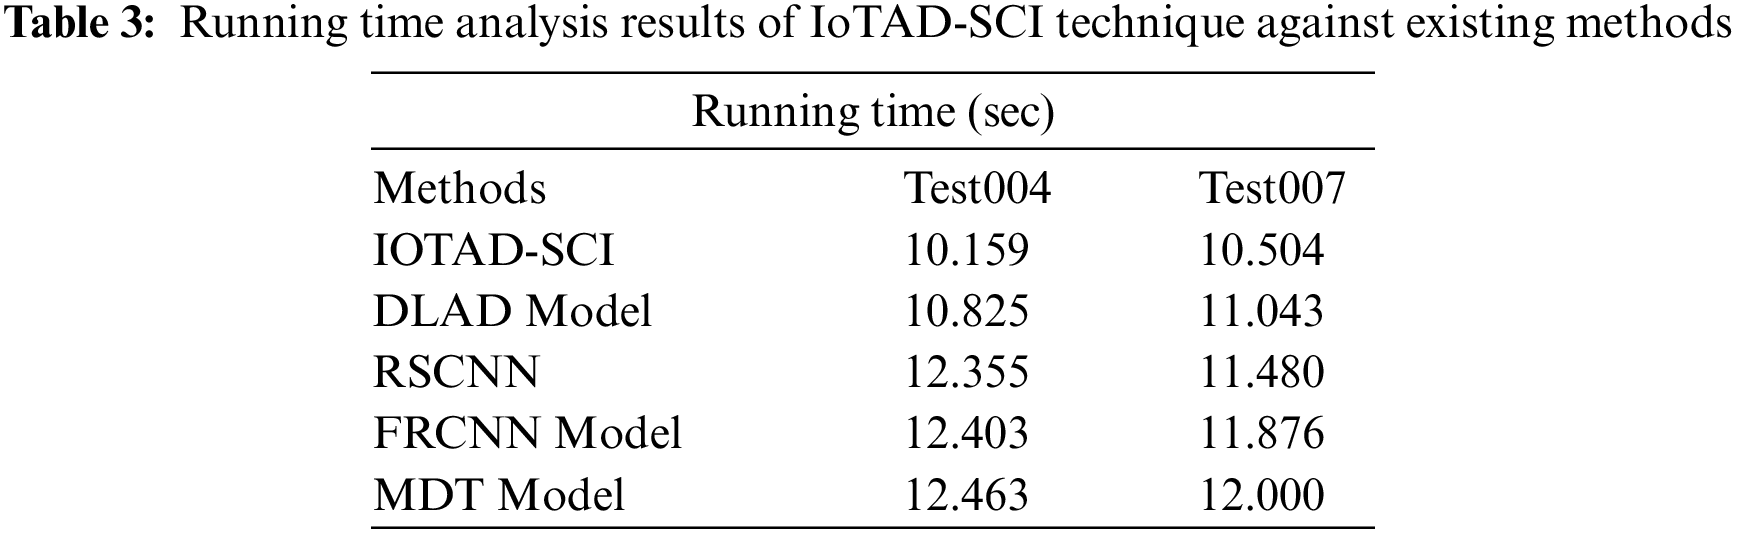

Figure 10: Running time analysis of IoTAD-SCI technique with recent algorithms
In current study, an effective IoTAD-SCI technique has been developed to identify the presence of anomalies in smart city environment. The proposed IoTAD-SCI technique involves the design of DCN technique to detect the anomalies from input video frames. Followed by, AOA is applied to fine tune the hyperparameters of DCN technique whereas ID3 classifier is utilized to classify the identified objects under different classes. The experimental analysis results of IoTAD-SCI technique against the benchmark UCSD anomaly detection dataset were inspected under different measures. The simulation outcomes infer the superiority of the proposed IoTAD-SCI technique under different metrics compared to other recent approaches. As a part of future work, IoTAD-SCI technique can be realized in real time environment.
Acknowledgement: The authors extend their appreciation to the Deputyship for Research & Innovation, Ministry of Education in Saudi Arabia for funding this research work through the project number (IFPIP-1308-612-1442) and King Abdulaziz University, DSR, Jeddah, Saudi Arabia.
Funding Statement: This project was supported financially by Institution Fund projects under grant no. (IFPIP-1308-612-1442).
Conflicts of Interest: The authors declare that they have no conflicts of interest to report regarding the present study.
1. Q. Sun, H. Liu and T. Harada, “Online growing neural gas for anomaly detection in changing surveillance scenes,” Pattern Recognition, vol. 64, no. 3, pp. 187–201, 2017. [Google Scholar]
2. X. R. Zhang, X. Sun, X. M. Sun, W. Sun and S. K. Jha, “Robust reversible audio watermarking scheme for telemedicine and privacy protection,” Computers Materials & Continua, vol. 71, no. 2, pp. 3035–3050, 2022. [Google Scholar]
3. T. Xiao, C. Zhang and H. Zha, “Learning to detect anomalies in surveillance video,” IEEE Signal Processing Letters, vol. 22, no. 9, pp. 1477–1481, 2015. [Google Scholar]
4. X. R. Zhang, W. F. Zhang, W. Sun, X. M. Sun and S. K. Jha, “A robust 3-D medical watermarking based on wavelet transform for data protection,” Computer Systems Science & Engineering, vol. 41, no. 3, pp. 1043–1056, 2022. [Google Scholar]
5. S. Biswas and V. Gupta, “Abnormality detection in crowd videos by tracking sparse components,” Machine Vision and Applications, vol. 28, no. 1–2, pp. 35–48, 2017. [Google Scholar]
6. I. R. de Almeida, V. J. Cassol, N. I. Badler, S. R. Musse and C. R. Jung, “Detection of global and local motion changes in human crowds,” IEEE Transactions on Circuits and Systems for Video Technology, vol. 27, no. 3, pp. 603–612, 2017. [Google Scholar]
7. A. Li, Z. Miao, Y. Cen and Q. Liang, “Abnormal event detection based on sparse reconstruction in crowded scenes,” in 2016 IEEE Int. Conf. on Acoustics, Speech and Signal Processing (ICASSP), Shanghai, China, pp. 1786–1790, 2016. [Google Scholar]
8. V. G. Font, C. Garrigues and H. Rifà-Pous, “A comparative study of anomaly detection techniques for smart city wireless sensor networks,” Sensors, vol. 16, no. 6, pp. 868, 2016. [Google Scholar]
9. I. Alrashdi, A. Alqazzaz, E. Aloufi, R. Alharthi, M. Zohdy et al., “sAD-IoT: Anomaly detection of IoT cyberattacks in smart city using machine learning,” in 2019 IEEE 9th Annual Computing and Communication Workshop and Conf. (CCWC), Las Vegas, NV, USA, pp. 305–310, 2019. [Google Scholar]
10. S. Chackravarthy, S. Schmitt and L. Yang, “Intelligent crime anomaly detection in smart cities using deep learning,” in 2018 IEEE 4th Int. Conf. on Collaboration and Internet Computing (CIC), Philadelphia, PA, pp. 399–404, 2018. [Google Scholar]
11. L. Kang, S. Liu, H. Zhang and D. Gong, “Person anomaly detection-based videos surveillance system in urban integrated pipe gallery,” Building Research & Information, vol. 49, no. 1, pp. 55–68, 2021. [Google Scholar]
12. D. Chen, P. Wang, L. Yue, Y. Zhang and T. Jia, “Anomaly detection in surveillance video based on bidirectional prediction,” Image and Vision Computing, vol. 98, pp. 103915, 2020. [Google Scholar]
13. W. Ullah, A. Ullah, I. U. Haq, K. Muhammad, M. Sajjad et al., “CNN features with bi-directional LSTM for real-time anomaly detection in surveillance networks,” Multimedia Tools and Applications, vol. 80, no. 11, pp. 16979–16995, 2021. [Google Scholar]
14. T. Y. Lin, P. Dollar, R. Girshick, K. He, B. Hariharan et al., “Feature pyramid networks for object detection,” in 2017 IEEE Conf. on Computer Vision and Pattern Recognition (CVPR), Honolulu, HI, pp. 936–944, 2017. [Google Scholar]
15. T. Wollmann and K. Rohr, “Deep consensus network: Aggregating predictions to improve object detection in microscopy images,” Medical Image Analysis, vol. 70, no. 4, pp. 102019, 2021. [Google Scholar]
16. L. Abualigah, A. Diabat, S. Mirjalili, M. A. Elaziz and A. H. Gandomi, “The arithmetic optimization algorithm,” Computer Methods in Applied Mechanics and Engineering, vol. 376, no. 2, pp. 113609, 2021. [Google Scholar]
17. A. Ewees, M. A. A. Al-qaness, L. Abualigah, D. Oliva, Z. Y. Algamal et al., “Boosting arithmetic optimization algorithm with genetic algorithm operators for feature selection: Case study on cox proportional hazards model,” Mathematics, vol. 9, no. 18, pp. 2321, 2021. [Google Scholar]
18. S. Yang, J. Z. Guo and J. W. Jin, “An improved Id3 algorithm for medical data classification,” Computers & Electrical Engineering, vol. 65, no. 4, pp. 474–487, 2018. [Google Scholar]
19. http://www.svcl.ucsd.edu/projects/anomaly/dataset.htm. [Google Scholar]
20. I. V. Pustokhina, D. A. Pustokhin, T. Vaiyapuri, D. Gupta, S. Kumar et al., “An automated deep learning based anomaly detection in pedestrian walkways for vulnerable road users safety,” Safety Science, vol. 142, no. 11, pp. 105356, 2021. [Google Scholar]
21. M. Xu, X. Yu, D. Chen, C. Wu and Y. Jiang, “An efficient anomaly detection system for crowded scenes using variational autoencoders,” Applied Sciences, vol. 9, no. 16, pp. 3337, 2019. [Google Scholar]
22. B. S. Murugan, M. Elhoseny, K. Shankar and J. Uthayakumar, “Region-based scalable smart system for anomaly detection in pedestrian walkways,” Computers & Electrical Engineering, vol. 75, no. 3, pp. 146–160, 2019. [Google Scholar]
 | This work is licensed under a Creative Commons Attribution 4.0 International License, which permits unrestricted use, distribution, and reproduction in any medium, provided the original work is properly cited. |