DOI:10.32604/cmc.2022.027474
| Computers, Materials & Continua DOI:10.32604/cmc.2022.027474 | |
| Article |
Lower-Limb Motion-Based Ankle-Foot Movement Classification Using 2D-CNN
1School of Telecommunication Engineering, Institute of Engineering, Suranaree University of Technology, Nakhon Ratchasima, 30000, Thailand
2Department of Telecommunications Engineering, Faculty of Engineering and Technology, Rajamangala University of Technology Isan (RMUTI), Nakhon Ratchasima, 30000, Thailand
3Orthopedic Department School of Medicine, Suranaree University of Technology, Nakhon Ratchasima, 30000, Thailand
4School of Mechanical Engineering, Institute of Engineering, Suranaree University of Technology, Nakhon Ratchasima, 30000, Thailand
*Corresponding Author: Peerapong Uthansakul. Email: uthansakul@sut.ac.th
Received: 18 January 2022; Accepted: 11 April 2022
Abstract: Recently, the Muscle-Computer Interface (MCI) has been extensively popular for employing Electromyography (EMG) signals to help the development of various assistive devices. However, few studies have focused on ankle foot movement classification considering EMG signals at limb position. This work proposes a new framework considering two EMG signals at a lower-limb position to classify the ankle movement characteristics based on normal walking cycles. For this purpose, we introduce a human ankle-foot movement classification method using a two-dimensional-convolutional neural network (2D-CNN) with low-cost EMG sensors based on lower-limb motion. The time-domain signals of EMG obtained from two sensors belonging to Dorsiflexion, Neutral-position, and Plantarflexion are firstly converted into time-frequency spectrograms by short-time Fourier transform. Afterward, the spectrograms of the three ankle-foot movement types are used as input to the 2D-CNN such that the EMG foot movement types are finally classified. For the evaluation phase, the proposed method is investigated using the healthy volunteer for 5-fold cross-validation, and the accuracy is used as a standard evaluation. The results demonstrate that our approach provides an average accuracy of 99.34%. This exhibits the usefulness of 2D-CNN with low-cost EMG sensors in terms of ankle-foot movement classification at limb position, which offers feasibility for walking. However, the obtained EMG signal is not directly considered at the ankle position.
Keywords: Electromyography; neural network; tibialis anterior muscle; gastrocnemius muscle; convolution neural network; spectrogram; lower limb
The electrical activity performs the electromyography (EMG) signals recorded from the skin surface during muscle contraction. [1,2] These signals are exploited to classify the movement intentions of a subject because the precise activity of muscles is related to the EMG signals. The EMG signal reflects the subject’s conscious movement and is frequently used as an input of the control/classification systems. In this paper, we focus on human ankle-foot movement classification, which is a task that considers EMG signals recorded by lower-limb position to classify the ankle movement characteristics. According to our knowledge, this is the first work on exploiting two EMG signals based on lower-limb motion to predict the ankle movement classes.
Normally, the pattern recognition and prediction of EMG signals usually needs to be divided of two processes, i.e., feature extraction and model classification. For the feature extraction, there are many studies proposed for hand movement recognition including statistical features [3], Wavelet Transform (WT) [4,5] and Tunable Q-factor Wavelet Transform (TQWT). As presented in [6], fifteen statistical features from time domain and frequency domain including Integrated EMG (iEMG), Mean Absolute Value (MAV), Modified Mean Absolute Value 1, Modified Mean Absolute Value 2, Mean Absolute Value Slope (MAVS), Variance (VAR), Root Mean Square (RMS), Zero crossing (ZC), Slope Sign Change (SSC), Willison amplitude (WAMP), Auto-regressive (AR) coefficients, Median Frequency (MDF), Mean Frequency (MNF) were investigated for hand movement recognition. The experimental results showed that RMS, iEMG, MAVS, and WAMP augmentation are powerful for hand movement recognition. In the ternary pattern and discrete wavelet-based iterative feature extraction method were proposed and indicated that WT-based feature could provide promising results for hand movement recognition. The authors of [7] proposed the TQWT feature for the classification of the six targeted hand movements and summarized the TQWT features based on the EMG signals that are intelligently used by the shallow classifiers. Next, after finally calculating feature extraction of Electrocardiogram (ECG) signals, classification is proceeded to capture the feature extraction. Several methods have been proposed for the classification of EMG signals. Support vector machine (SVM) was proposed to learn fifteen statistical features. The results showed that SVM was better than multilayer perceptron neural network and linear discriminant analysis because it is effective in high-dimensional spaces. The authors introduced SVM to learn TQWT features for hand movement recognition. The experimental results showed that the SVM was the best classification compared with other methods such as K-Nearest Neighbors (K-NN), Naive Bayes (NB), Random Forest, Rotation Forest and Random because they could efficiently capture the information extracted by EMG signals. From the mentioned-above literature, we found that the classification performance depends on the design of handcrafted feature extraction, which strongly requires special signal processing knowledge to obtain high classification performance rate.
In recent years, a Convolutional Neural Network (CNN) has been extensively used for automated feature extraction from EMG signals with promising classification rate [8–10]. It was presented that the CNN, which has feature learning ability and can extract the information that handcrafted feature extraction cannot do, is robust to noise. In addition, recent studies have shown that the strong learning capability of CNN is very powerful for various EMG signal-based classification applications. For example, the authors of [11] proposed two-dimensional-Convolutional Neural Network (2D-CNN) based classification for hand movement recognition using many different EMG signals. The experimental results showed that the CNN could capture patterns in multichannel inputs belonging to different sensors and provide the test accuracy of 99%. Moreover, the CNN gives the possibility of being implemented in an application in real-time. Similarly, CNN-based classification based on spectrogram images of the segmented EMG signals using Short-Time Fourier transform (STFT) was proposed for hand gesture recognition. The result presented that the 2D-CNN could provide the test accuracy of 99.59% for seven different hand gesture classifications because it extracts the correlation of spatially adjacent pixels by applying a nonlinear filter and multiple filters. It can extract various local features of the image. From the studies mentioned above, it is naturally believed that the 2D-CNN-based classification might provide promising performance for other EMG signal-based classifications.
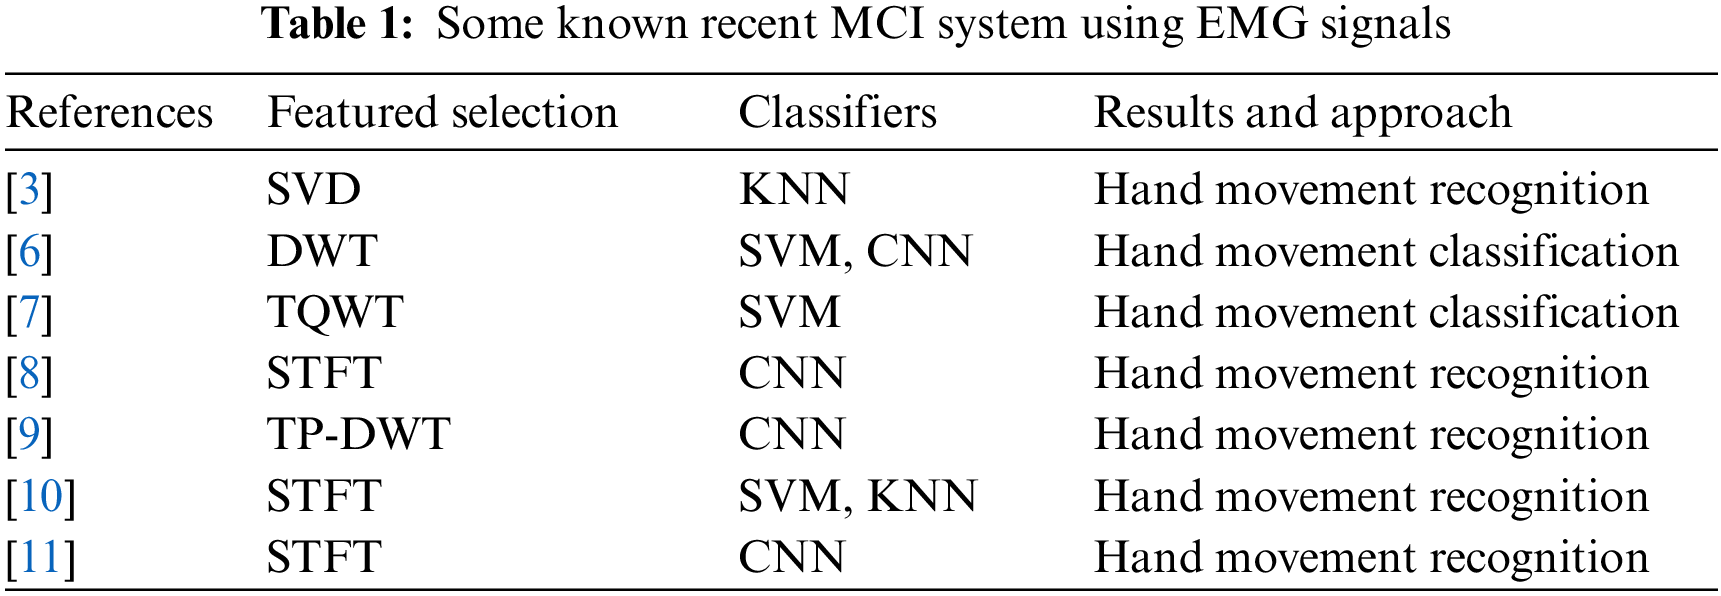
Although the Muscle-Computer Interface has been extensively popular for employing EMG signals to help the development of various classification tasks as summarized in Tab. 1, few studies have focused on ankle foot movement classification considering EMG signals at limb position, which offers feasibility for walking. This paper introduces a human ankle-foot movement classification method using low-cost EMG sensors to use a 2D-CNN. The proposed system is a MCI technology [12,13] that uses EMG signals at a lower-limb position to predict the ankle-foot movement including Dorsiflexion, Neutral-position, and Plantarflexion in the gait cycle. The time-domain signals of EMG are obtained by two sensors promising performance for other EMG signal-based classification, belonging to Dorsiflexion, Neutral-position, and Plantarflexion. They are first converted into time-frequency spectrograms by short-time Fourier transform. Subsequently, to intelligently take advantage of the convolutional and pooling layer for suppressing the noises and extracting mutual feature maps, the spectrograms of the three ankle-foot movement types are used as input to the 2D-CNN such that the EMG foot movement types are finally classified. The contribution and novelty are summarized as follows: (1) low-cost wearable EMG sensors based on OY-motion muscle sensors are first applied and investigated to detect human ankle movement. This device shows that the obtained signals provide efficient input for human ankle-foot movement classification. (2) we propose a new human ankle-foot movement classification considering EMG signals at the lower-limb position. It can be observed that using EMG signals at the lower-limb position can provide promising human ankle-foot movement classification. (3) 2D-CNN is employed as efficient classification tool although the recorded signal is based on OY-motion muscle sensors which is a low-cost wearable EMG sensor. The results show that 2D-CNN with one fully connected layer provides the average accuracy of 99.34%.
The composition of this article is divided as follows. Section 2 introduces the proposed methodology including data collection, data preprocessing, 2D-CNN-based classifier, and the evaluation rule for experiments. The performances of lower-limb motion-based human ankle-foot movement classifications are investigated and discussed followed by the final summary in Section 4.
This section provides an overview of proposed method including data collection, data preprocessing, feature extraction, 2D-CNN based classifier, and evaluation metric for experiments.
To produce the data collection, the OY-motion muscle sensor [14] with the Arduino’s analog input scale (10-bits ADC, 0-1023) illustrated in Fig. 1 is employed to record the activity signals of ankle-foot movement. Based on the convenience for walking and running [15], the raw EMG signals were recorded from two positions at lower-limb [16], consisting of the tibialis anterior muscle (TA) and gastrocnemius muscle (GAS) as shown in Fig. 2. Two signals were sent through Bluetooth technology and are sampled with a 1,000 Hz sampling rate.
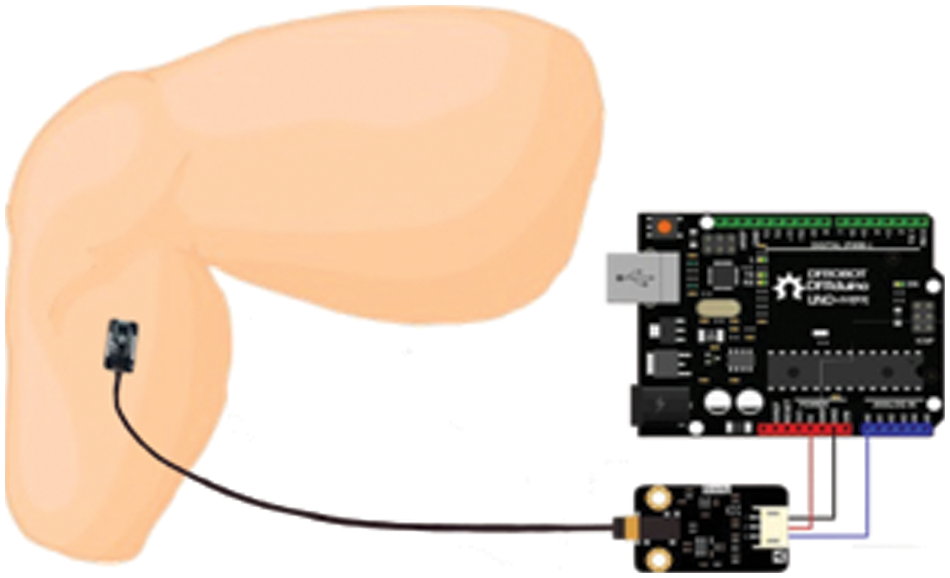
Figure 1: OY- motion muscle sensor
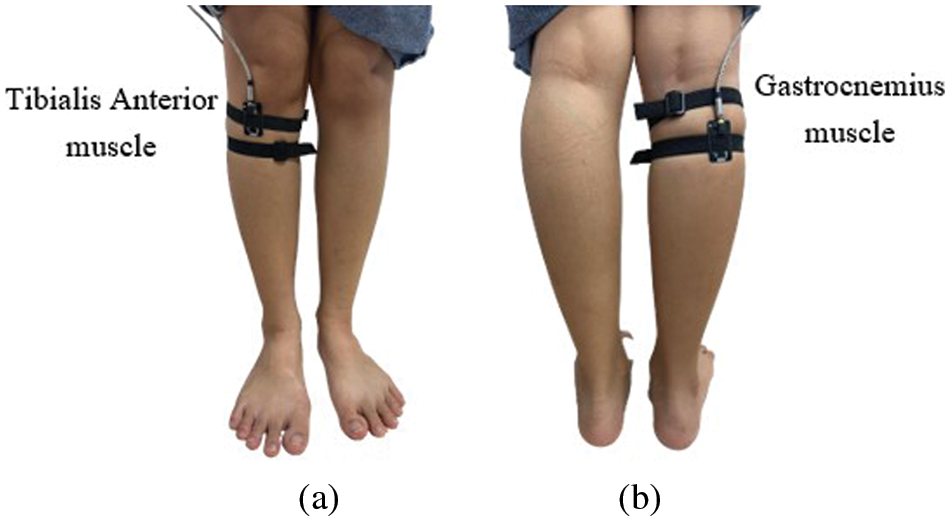
Figure 2: Location of lower-limb motion-muscle sensors where. (a) is the position at front and front right leg and, (b) is the position at back front right leg
In terms of the recording data, five healthy volunteers, age 21 ± 2 years participated in the study. Three ankle-foot activities including dorsi flexion, neutral-position, and plantar flexion are used for the experiments, as seen in Fig. 3. Here, as shown in Fig. 4, are the setup of recording data which is detailed as follows. (a) the volunteer wears two OY-motion muscle sensors to collect EMG signal from the TA and GAS. [17,18]. (b) the volunteer performs three types of ankle-foot movements: dorsiflexion, neutral-position, and plantarflexion with walking forward. (c) When the volunteer completes a gait cycle, let the volunteer stop in a resting position and repeat that for 300 time/volunteer.

Figure 3: Ankle foot activities in gait cycle
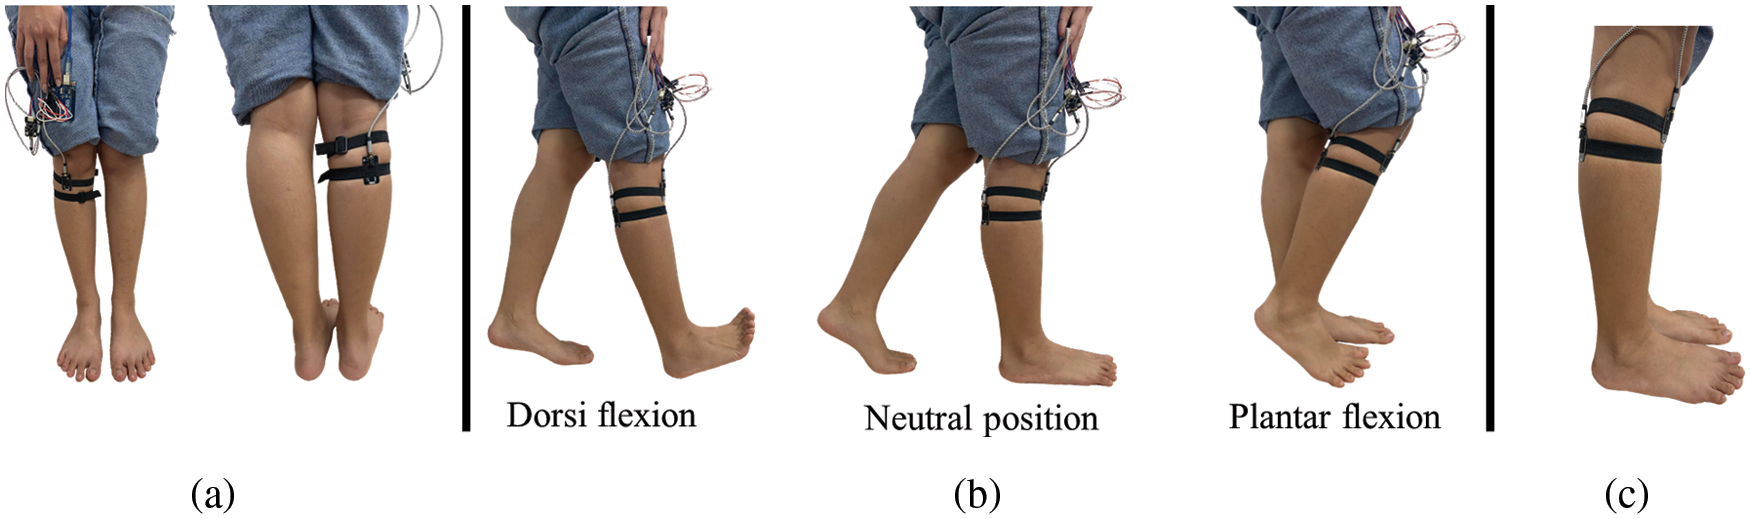
Figure 4: The process of recording data where. (a) the volunteer wears two OY-motion muscle sensors to collect a data, (b) the volunteer performs 3 types of ankle movements, (c) the volunteer stays in resting position
For the recorded data, the EMG signals based on the TA and GAS are simultaneously activated in opposite states. In the ankle movements of dorsiflexion, the TA muscle signal has a greater amplitude than the GAS. In neutral position movement, TA and GAS have a similar amplitude. Finally, in the plantarflexion movement, the GAS signal has a higher amplitude than the TA. Based on the ankle foot activities in gait cycle, the difference of TA and GAS signals is shown in Fig. 5.
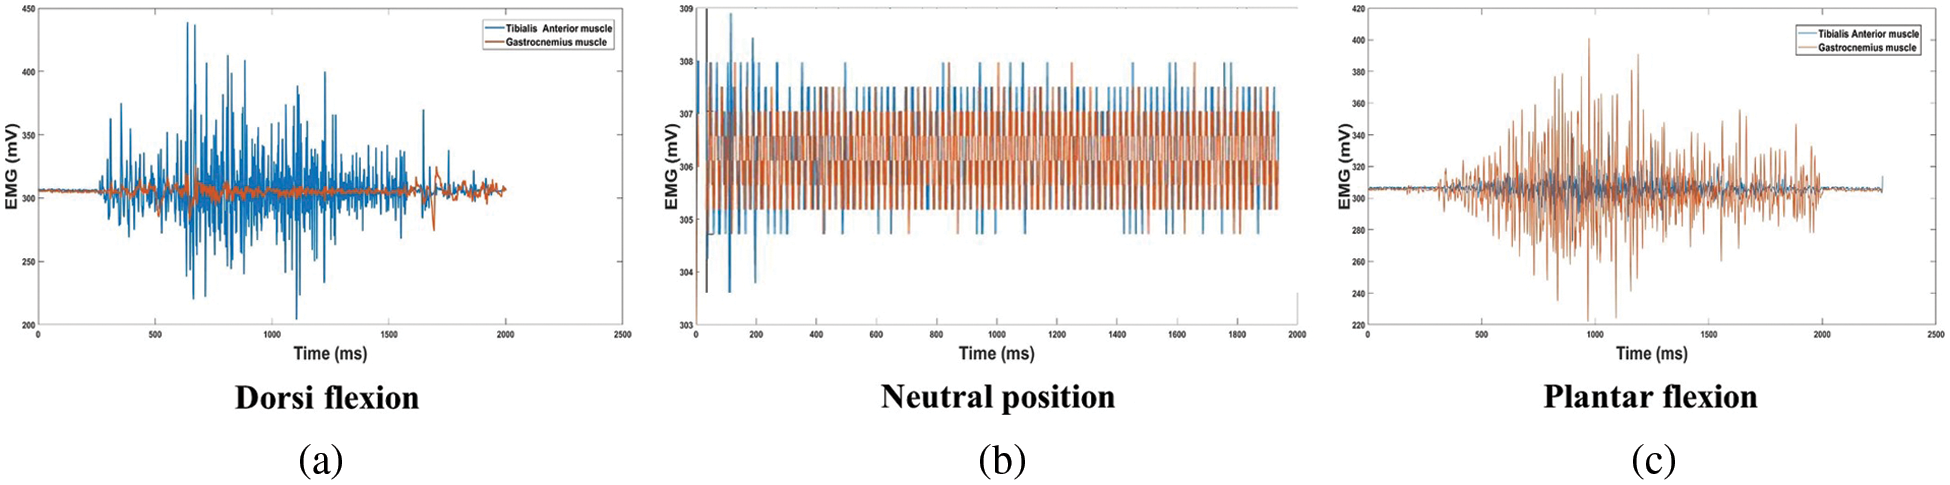
Figure 5: Raw EMG signal of. (a) dorsi flexion, (b) neutral-position and, (c) plantar flexion
The obtained EMG signal from OY motion muscle sensor is passed to Arduino Uno via jumper. which needs DC 3.3 V supply from sensor and receives EMG signal as shown in Fig. 1. The received EMG signal is possibly valued between 0–675 which needs the (1) to transform itself to be readable amplitude as follows.
After the transformed amplitude is obtained, differential operator is applied to filter the noise signal using differential operator. By assuming that
where
The two sensors work together to extract characteristics from the raw data to reduce the depth of data, but the learning features are applied for the architecture of convolutional neural network. In time domain, the EMG signals are transformed into two-dimensional time-frequency spectrograms using STFT. As within the applied 2D-CNN, the input data is an image with a specific type. The EMG signal are nonstationary in which the information in the frequency domain varies according to time [19]. STFT is a transformation that is related to the Fourier Transform. For Discrete Fourier transform, the function to be converted by the window function is given as:
where x[n] represents the EMG signal and w[n] is the window function in which the sampling rate is 1,000 Hz. In this proposed method, EMG signal is captured at the sampling rate of 1,000 Hz since a lower sampling might not give you much valuable information. The number of samples is 2 s
Therefore, we transform EMG time-domain signals into EMG spectrums images by plotting each EMG data recording of two channel of sensors. The sample of each movement spectrogram is shown in Fig. 6.
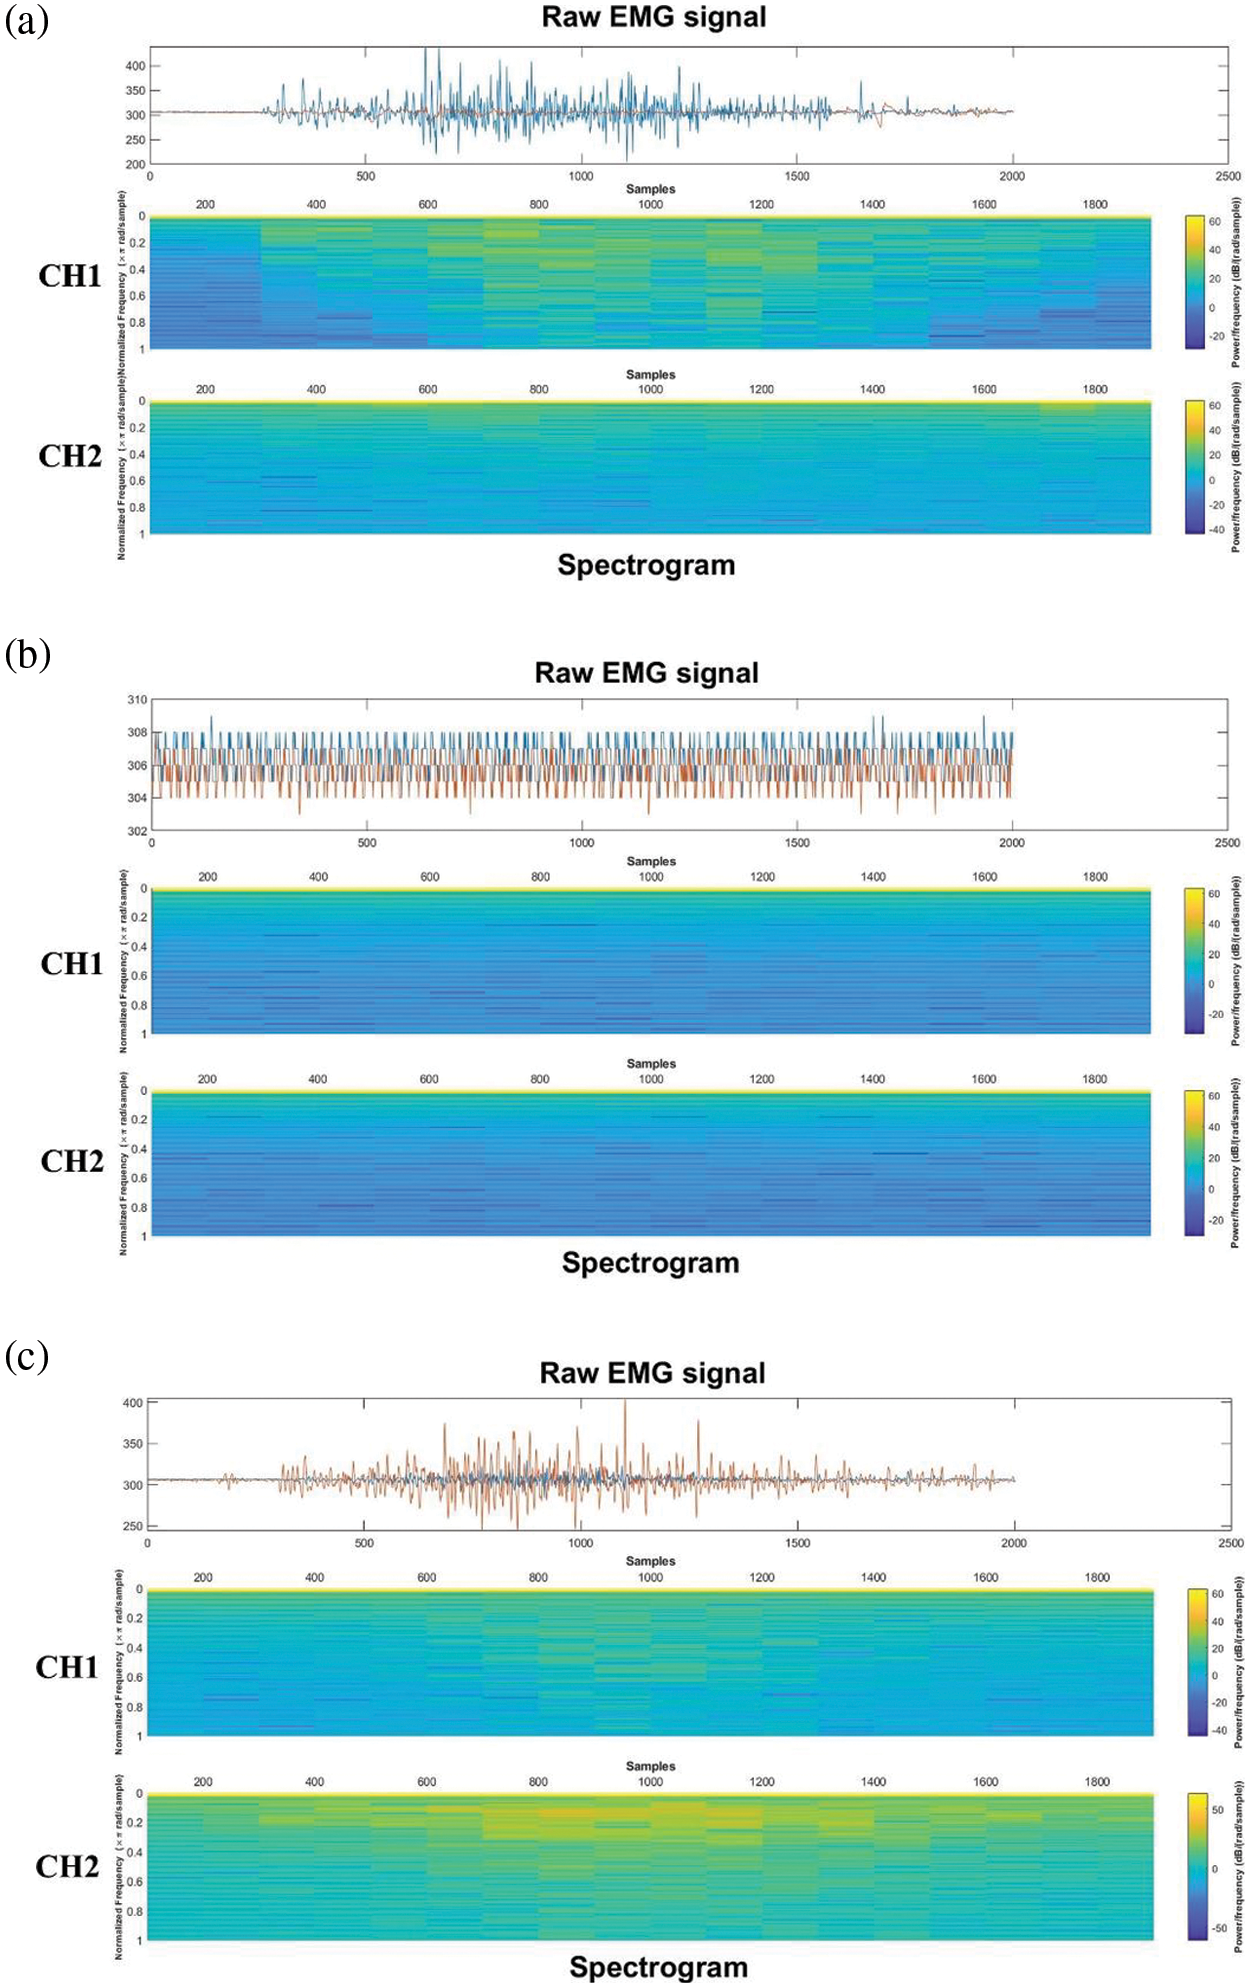
Figure 6: Raw EMG signal to spectrograms using STFT, CH1 is TA muscle and CH2 is GAS muscle in each movement. (a) dorsiflexion, (b) neutral-position and, (c) plantarflexion
For a deep learning model, datasets are very important [20]. The number and distribution of a dataset and the difference in each category affect the model's performance. This work presented the numbers of three datasets which are very small, but each image has a characteristic image in which we can decrease the time of training process by resizing the image. Therefore, we further process these three datasets. We know that the pixel values for each image in the dataset are black, white, and dark gray scaled from the same color scale of 0–255 but some pixel scaling is required. Grayscale is the result of converting an RGB color image to grayscale using a mathematical formula: Gray = (0.299) R + (0.587) G + (0.114) B. And we set up input image size of 28
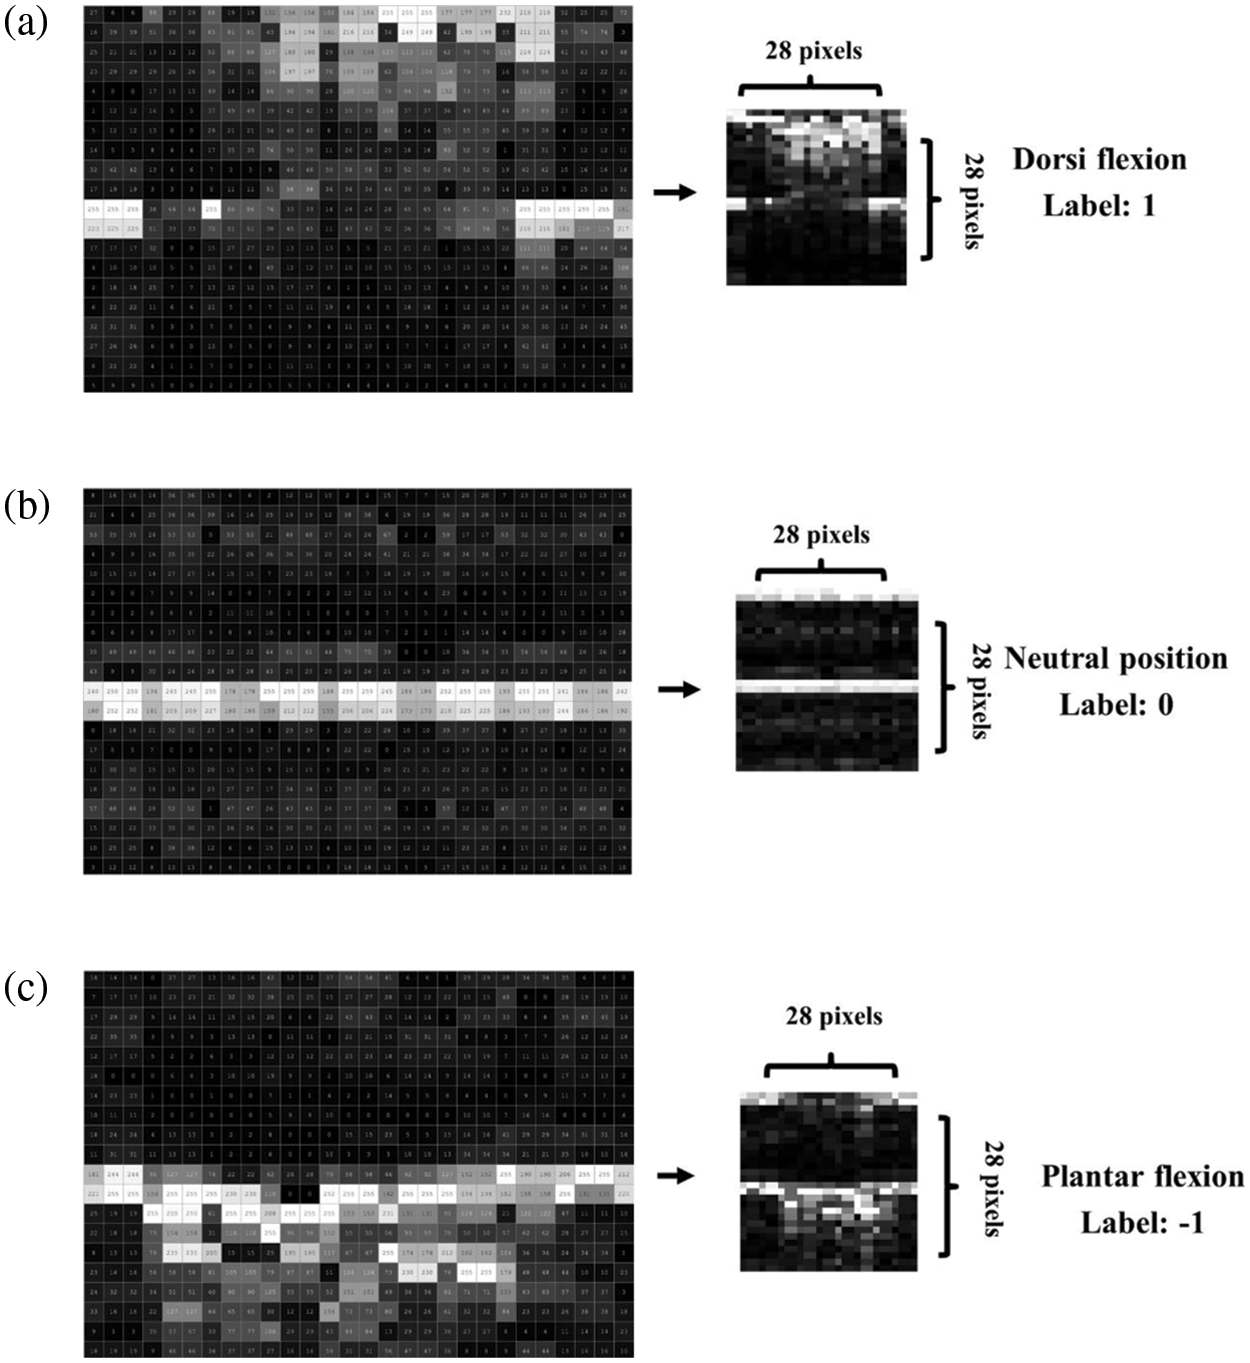
Figure 7: Normalized and resized pixel values to 28
Next, the vectors,
where i is the order of the dataset,
2.4 2D-CNN as Human Ankle Foot Movement Classifier.
In this paper, we adopt 2D-CNN as EMG human ankle-foot movement classifier using lower limb signals. The CNN was first proposed by [22] and was developed for handwritten recognition [23,24]. Based on the advantage of the CNN model, we separate the relationship of an image from spatially adjacent image pixels, use a non-linear filter and multiple filters which can extract image properties [25].
In convolution layer, convolution is performed to obtain the position and the strength of input image properties. From the equation, n is the size of input image, p is the padding of a filter, f is the size of a filter and s is the number of slots to be shifted in each convolution process, which is computed as:
Maximum pooling layer is a pooling operation that calculates the maximum value from the part of image covered by filter in each patch of each feature map. the feature map is denoted as:
where M is the number of units in the feature maps and H equals to the number of maps in the previous layer. The units in a max-pooling layer are computed as:
where q is the pooling size and r is the number of moving rows, if q is larger than r.
According to the equation, M is the number of features, K is the number of features in the previous layer map, q is the pooling size and r is the number of moving rows, which can be computed as:
Fully Connected layer combines all features (local information) learned by the output of previous layers and flatten to a single vector. The last fully connected layer combines the features to classify the images.
In SoftMax layer for classification problems, the network structure doesn't have any useful weights inside, but the SoftMax is an activation function converting a weight into values between 0 and 1, so that they can be interpreted as probabilities. The SoftMax function can be considered as the multi-class generalization of logistic sigmoid function [26].
In [27] proposed the two-dimensional convolution and pooling layers are suitable for filtering the intime-frequency of EMG images. The structure of the 2D-CNN is shown in Fig. 8.
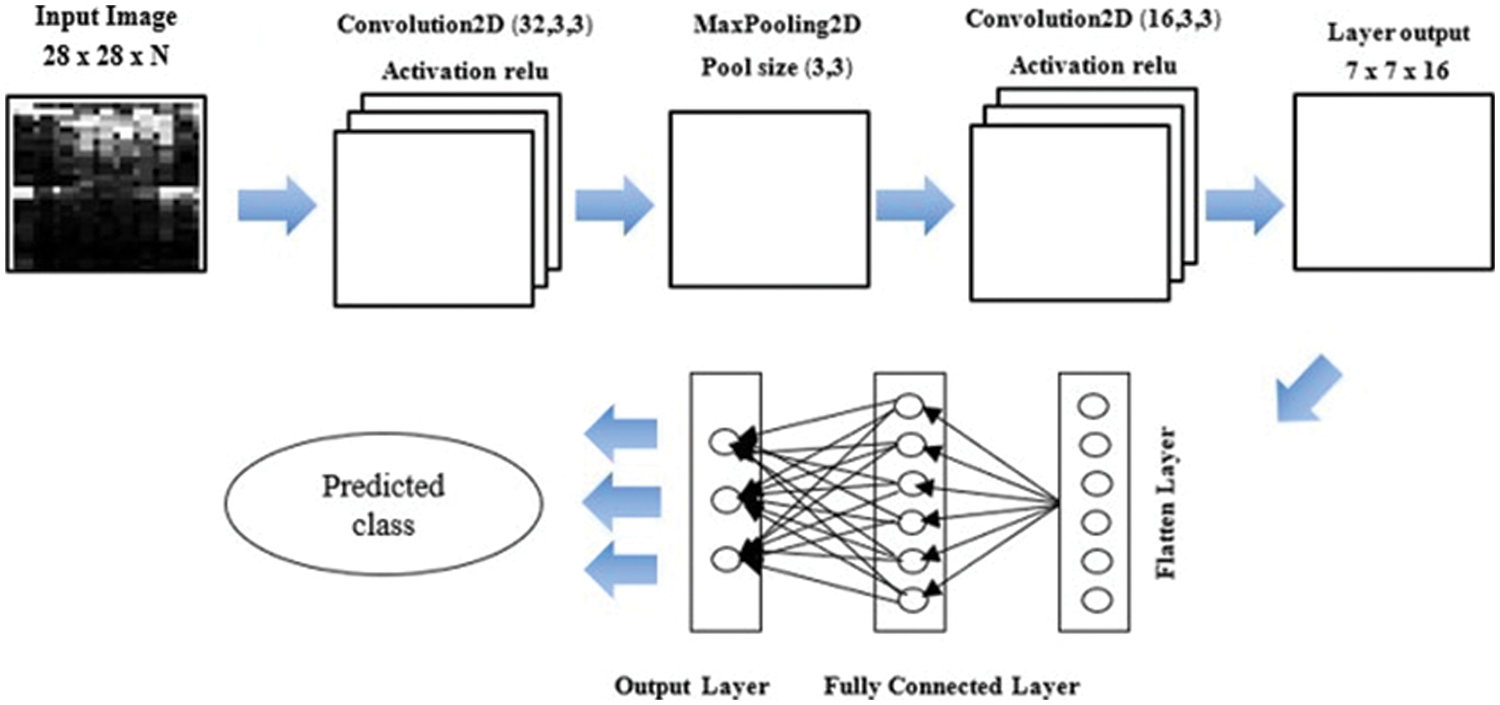
Figure 8: The architecture of the proposed 2D-CNN model
The architecture of the network includes 15 layers. The network has an input layer, and the size has dimensions of 28 × 28 × 1 (width, height, depth respectively) and two convolution layers with 16, 32 (3 × 3) filters, respectively. The network has two normalized layers and one pooling layers of 3 × 3 regions with a stride of 1, respectively. The network also has 3 Rectified Linear Unit (ReLU) layers, a fully connected layer, a SoftMax classification layer and an output layer (7 × 7 × 16) [28]. Finally for the testing, we convert the images to grayscale from the volunteer, which is prepared to a matrix and added to a CSV file for testing.
To investigate the performance of proposed method, the 5-fold cross-validation is used. In each fold, we choose the data sets from four different volunteers to train the CNN model and then use the data sets from the remaining volunteers to test the trained classifier performance. Based on the 5-fold cross-validation, 1500 signals (including 500 Dorsiflexion signals, 500 Neutral-position signals and 500 Plantarflexion signals) are employed as training data, and 300 signals (including 100 Dorsiflexion signals, 100 Neutral-position signals and 100 Plantarflexion signals) are used as testing data to consider the trained model performance. Here, the accuracy performance is implemented as a standard measurement. The accuracy index is defined as:
where TP stands for true positive, meaning the predicted data matches the actual data as ankle movements; TN stands for true negative, meaning correct prediction as normal; FP stands for false positive, meaning the predicted data do not match the actual data as ankle movements; FN represents false negative, meaning incorrect prediction as normal [29].
This section reports the performance of human ankle-foot movement classification using 2D-CNN based on two low-cost wearable EMG sensors. Firstly, the 2D-CNN with two fully connected layers was first investigated to report the classification performance. The accuracy results of training and testing data are shown in Fig. 9.
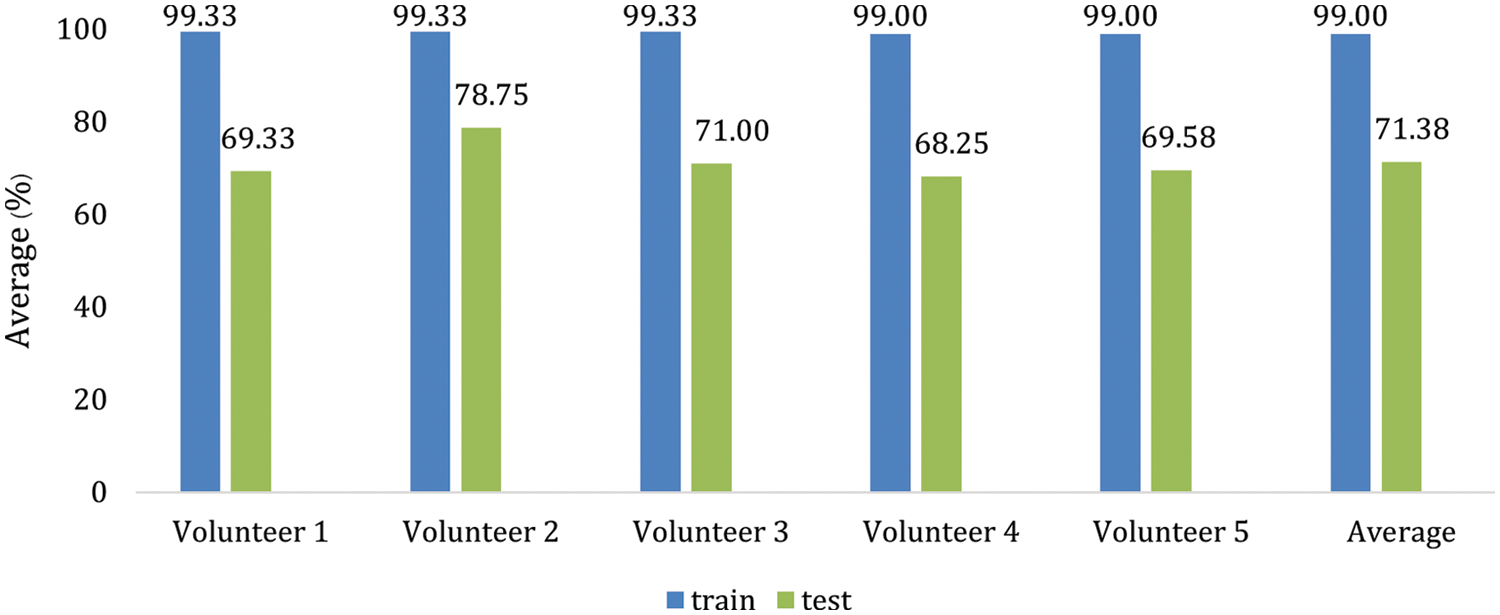
Figure 9: Performance of train and test set in terms of accuracy (%)
As seen in Fig. 9, we can observe that the CNN-based classification using two analog OY-Motion EMG Sensors, an available wearable device in the market, provides the averaged accuracy of 99.00% for training data and 71.38% for testing data. This indicates that EMG signals based on a noninvasive and convenient sensor for the muscle-computer interface can provide useful quality signals giving a promising result. Moreover, the image size at (28 × 28) pixels with grayscale can efficiently be the input 2D-CNN data, although it is relatively small. Therefore, it can be summarized that the resized image of the original spectrogram is still helpful for detecting ankle-foot movement.
As observed by [30,31], if the classification model was trained using the limited training data, the experimental result showed that the number of learning hidden layers affects the accuracy performance of a neural network. The results showed using one hidden layer can provide higher classification rate than multi-hidden layers for testing data. Therefore, it is important to find out the optimal number of fully connected layers to receive the best result. In this paper, the number of fully connected layers varies from 1 to 3. The accuracy performances based on different layers are shown in Fig. 10.
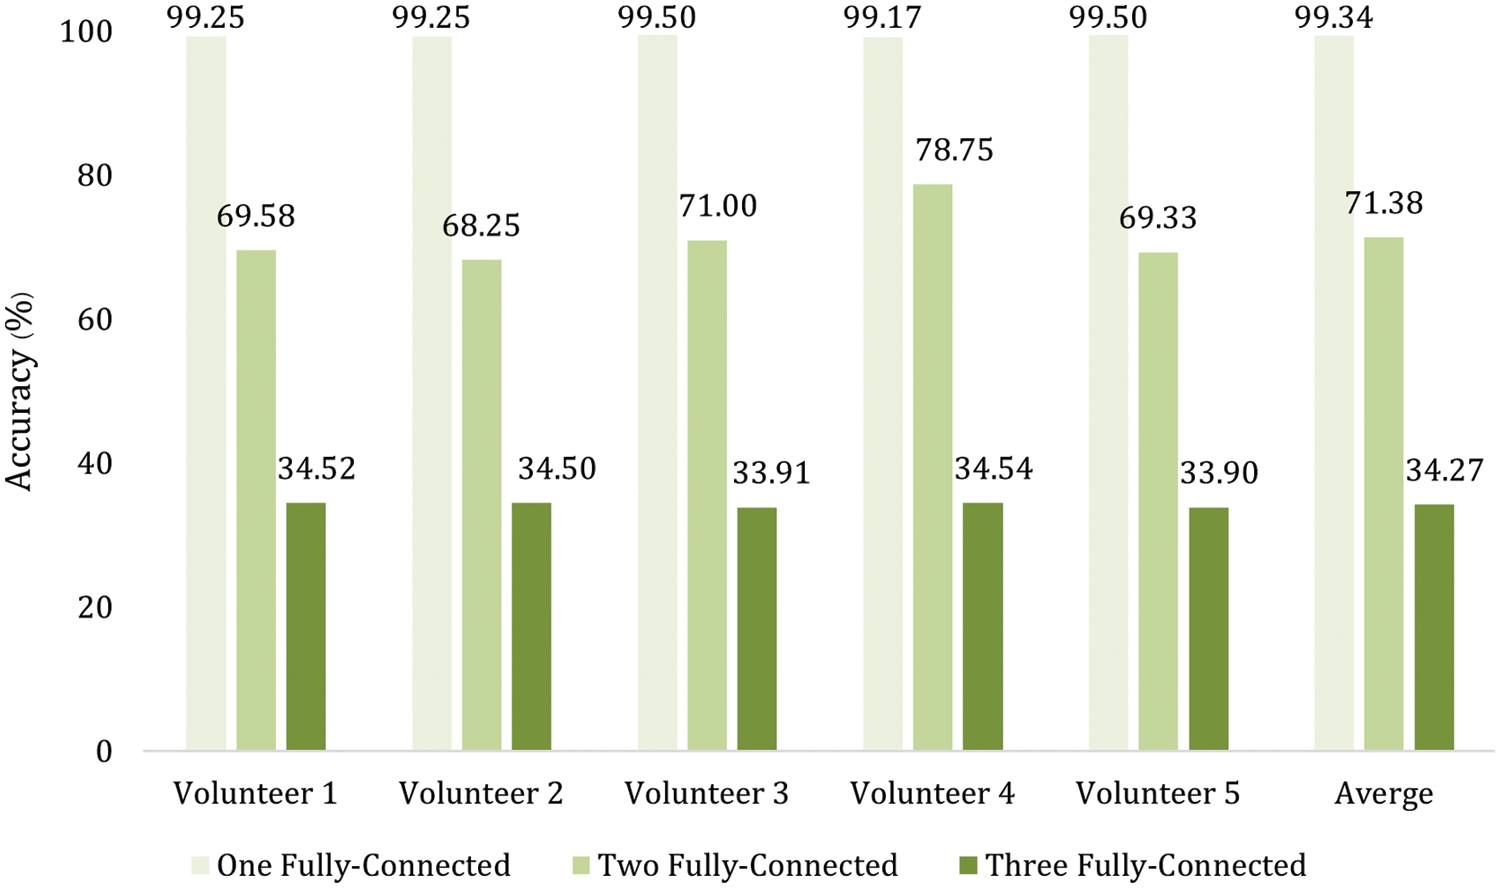
Figure 10: Performance of CNN with three different fully connected layers in terms of accuracy (%)
From Fig. 10, it is found that the detection performance is decreased using more than two layers. The average accuracy results are reduced from 71.38% to 34.27%. On the other hand, the average accuracy result is improved from 71.38% to 99.34%. The reason is that small classes and training data are used for the experiments.
Fig. 11 shows the confusion matrices of 2D-CNN-based method for human ankle-foot movement classification based on lower-limb motion using single fully connected layers. We can see that the slight confusion among Dorsiflexion, Neutral-position, and Plantarflexion is obtained as seen in Fig. 11, which is less than approximately 1.70%. These outcomes exhibit the usefulness of 2D-CNN with low-cost EMG sensors in terms of ankle-foot movement classification at limb position, which provides feasibility for walking.
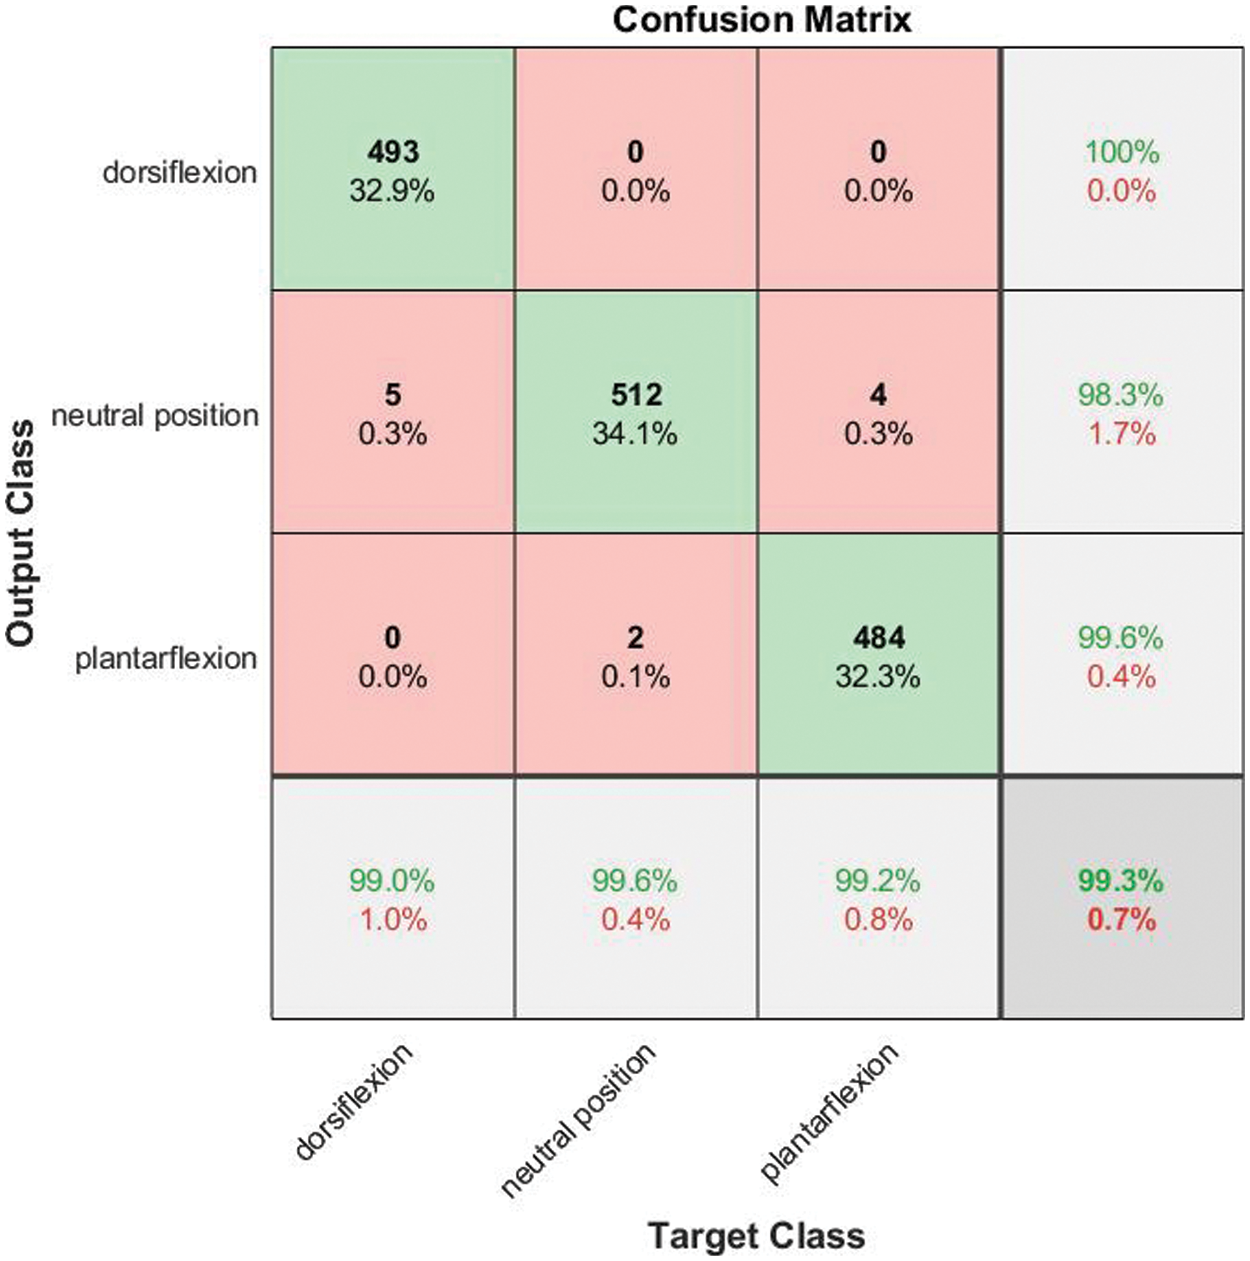
Figure 11: Confusion matrix
In this paper, we have proposed the human ankle-foot movement classification using 2D-CNN with low-cost EMG sensors. For this purpose, we have introduced a human ankle-foot movement classification method using a 2D-CNN with low-cost EMG sensors. The time-domain signals of EMG obtained by two sensors belonging to Dorsiflexion, Neutral-position, and Plantarflexion were first converted into time-frequency spectrograms by short-time Fourier transform. Subsequently, the spectrograms of the three ankle-foot movement types were used as input to the 2D-CNN such that the EMG foot movement types were finally classified. The experimental results have shown that the spectrograms based on two sensors are powerful as input of 2D-CNN for representing the difference of ankle-foot movement. However, the obtained EMG signal is not directly considered at ankle position and resized at (28
Although the proposed system can provide encouraging performance for human ankle-foot movement classification, only healthy volunteers participated in the study. In future work, we will attempt to investigate the effectiveness of the proposed system among individuals with lower limb prosthesis.
Acknowledgement: All subjects gave their informed consent for inclusion before they participated in the study. This work obtained the ethics committee approval of human research from Suranaree University of Technology (License EC –64–30 COA No. 67/2564).
Funding Statement: This work was supported by Suranaree University of Technology (SUT), Thailand Science Research and Innovation (TSRI), and National Science Research and Innovation Fund (NSRF) (NRIIS no.42852).
Conflicts of Interest: The authors declare that they have no conflicts of interest to report regarding the present study.
1. W. Geng, Y. Du, W. Jin, W. Wei, Y. Hu et al., “Gesture recognition by instantaneous surface EMG images,” Scientific reports, vol. 6, no. 1, pp. 1–8, 2016. [Google Scholar]
2. A. Waris and E. N. Kamavuako, “Effect of threshold values on the combination of EMG time domain features: Surface versus intramuscular EMG,” Biomedical Signal Processing and Control, vol. 45, no. 6, pp. 267–273, 2018. [Google Scholar]
3. O. Iqbal, S. A. Fattah and S. Zahin, “Hand movement recognition based on singular value decomposition of surface EMG signal,” in IEEE Region 10 Humanitarian Technology Conf. (R10-HTC), Dhaka, Bangladesh, pp. 837–842, 2017. [Google Scholar]
4. M. R. Canal, “Comparison of wavelet and short time fourier transform methods in the analysis of EMG signals,” Journal of Medical Systems, vol. 34, no. 1, pp. 91–94, 2010. [Google Scholar]
5. T. Baba, “Time-frequency spectrograms using short-time fourier transform (STFT),” The Open Acoustics Journal, vol. 5, no. 1, pp. 32–38, 2012. [Google Scholar]
6. J. M. Fajardo, O. Gomez and F. Prieto, “EMG hand gesture classification using handcrafted and deep features,” Biomedical Signal Processing and Control, vol. 63, no. 6, pp. 102210, 2021. [Google Scholar]
7. A. Subasi and S. M. Qaisar, “Surface EMG signal classification using TQWT, bagging and boosting for hand movement recognition,” Journal of Ambient Intelligence and Humanized Computing, vol. 24, no. 6, pp. 1–16, 2020. [Google Scholar]
8. J. Too, A. R. Abdullah, N. M. Saad, N. M. Ali and T. T. Zawawi, “Featureless EMG pattern recognition based on convolutional neural network,” Indonesian Journal of Electrical Engineering and Computer Science, vol. 14, no. 3, pp. 1291–1297, 2019. [Google Scholar]
9. L. Chen, J. Fu, Y. Wu, H. Li and B. Zheng, “Hand gesture recognition using compact CNN via surface electromyography signals,” Sensors, vol. 20, no. 3, pp. 672, 2020. [Google Scholar]
10. T. Tuncer, S. Dogan and A. Subasi, “Surface EMG signal classification using ternary pattern and discrete wavelet transform based feature extraction for hand movement recognition,” Biomedical Signal Processing and Control, vol. 58, no. 1, pp. A190–A203, 2020. [Google Scholar]
11. M. A. Ozdemir, D. H. Kisa, O. Guren, A. Onan and A. Akan, “EMG based hand gesture recognition using deep learning,” in 2020 Medical Technologies Congress (TIPTEKNO), Antalya, Turkey, pp. 1–4, 2020. [Google Scholar]
12. A. Chowdhury, R. Ramadas and S. Karmakar, “Muscle computer interface: A review,” in ICoRD’13, Springer, India, pp. 411–421, 2013. [Google Scholar]
13. S. S. Joshi, A. S. Wexler, C. Perez-Maldonado and S. Vernon, “Brain-muscle-computer interface using a single surface electromyographic signal: Initial results,” in 2011 5th Int. IEEE/EMBS Conf. on Neural Engineering, Cancun, Mexico, pp. 342–347, 2011. [Google Scholar]
14. H. Wu, M. Dyson and K. Nazarpour, “Arduino-based myoelectric control: Towards longitudinal study of prosthesis use,” Sensors, vol. 21, no. 3, pp. 763, 2021. [Google Scholar]
15. T. J. Roberts and A. M. Gabaldon, “Interpreting muscle function from EMG: Lessons learned from direct measurements of muscle force,” Integrative and Comparative Biology, vol. 48, no. 2, pp. 312–320, 2008. [Google Scholar]
16. S. K. Au, P. Bonato and H. Herr, “An EMG-position controlled system for an active ankle-foot prosthesis: An initial experimental study,” in 9th Int. Conf. on Rehabilitation Robotics 2005. ICORR 2005, Chicago, IL, USA, pp. 375–379, 2005. [Google Scholar]
17. I. D. Giulio, C. N. Maganaris, V. Baltzopoulos and I. D. Loram, “The proprioceptive and agonist roles of gastrocnemius, soleus and tibialis anterior muscles in maintaining human upright posture,” The Journal of Physiology, vol. 587, no. 10, pp. 2399–2416, 2009. [Google Scholar]
18. M. Santello and M. J. N. Mcdonagh, “The control of timing and amplitude of EMG activity in landing movements in humans,” Experimental Physiology, vol. 83, no. 6, pp. 857–874, 1998. [Google Scholar]
19. N. Burhan, M. Kasno and R. Ghazali, “Feature extraction of surface electromyography (sEMG) and signal processing technique in wavelet transform: A review,” in 2016 IEEE Int. Conf. on Automatic Control and Intelligent Systems (I2CACIS), Selangor, Malaysia, pp. 141–146, 2016. [Google Scholar]
20. H. Yao, X. Zhang, X. Zhou and S. Liu, “Parallel structure deep neural network using CNN and RNN with an attention mechanism for breast cancer histology image classification,” Cancers, vol. 11, no. 12, pp. 1901, 2019. [Google Scholar]
21. T. Jumphoo, M. Uthansakul and P. Uthansakul, “Brainwave classification without the help of limb movement and any stimulus for character-writing application,” Cognitive Systems Research, vol. 58, no. 1, pp. 375–386, 2019. [Google Scholar]
22. B. Y. Su, J. Wang, S. Q. Liu, M. Sheng, J. Jiang et al., “A CNN-based method for intent recognition using inertial measurement units and intelligent lower limb prosthesis,” IEEE Transactions on Neural Systems and Rehabilitation Engineering, vol. 27, no. 5, pp. 1032–1042, 2019. [Google Scholar]
23. K. Phapatanaburi, K. Kokkhunthod, L. Wang, T. Jumphoo and M. Uthansakul, “Brainwave classification for character-writing application using emd-based gmm and kelm approaches,” Computers, Materials & Continua, vol. 66, no. 3, pp. 3029–3044, 2021. [Google Scholar]
24. K. Kokkhunthod, T. Jumphoo and P. Uthansakul, “Improving brainwave classification for character-writing application using single effective EEG channel,” in SUT in Int. Virtual Conf. on Science and Technology, Nakhon Ratchasima, Thailand, pp. 142–148, 2020. [Google Scholar]
25. P. Xia, J. Hu and Y. Peng, “EMG-based estimation of limb movement using deep learning with recurrent convolutional neural networks,” Artificial organs, vol. 42, no. 5, pp. E67–E77, 2018. [Google Scholar]
26. C. M. Bishop and M. N. Nasser, Pattern recognition and Machine Learning, vol. 4. New York: Springer, pp. 738, 2006. [Google Scholar]
27. A. R. Asif, A. Waris, S. O. Gilani, M. Jamil, H. Ashraf et al., “Performance evaluation of convolutional neural network for hand gesture recognition using EMG,” Sensors, vol. 20, no. 6, pp. 1642, 2020. [Google Scholar]
28. A. Papandreou-Suppappola, “Time–frequency processing: Tutorial on principles and practice,” in Applications in Time-Frequency Signal Processing. CRC Press, pp. 1–84, 2002. [Google Scholar]
29. T. Jumphoo, M. Uthansakul, P. Duangmanee, N. Khan and P. Uthansakul, “Soft robotic glove controlling using brainwave detection for continuous rehabilitation at home,” Computers, Materials & Continua, vol. 66, no. 1, pp. 961–976, 2021. [Google Scholar]
30. K. Phapatanaburi, L. Wang, Z. Oo, W. Li, S. Nakagawa et al., “Noise robust voice activity detection using joint phase and magnitude-based feature enhancement,” Journal of Ambient Intelligence And Humanized Computing, vol. 8, no. 6, pp. 845–859, 2017. [Google Scholar]
31. L. Wang, K. Phapatanaburi, Z. Go, S. Nakagawa, M. Iwahashi et al., “Phase aware deep neural network for noise robust voice activity detection,” in IEEE Int. Conf. on Multimedia and Expo (ICME), Hong Kong, China, pp. 1087–1092, 2017. [Google Scholar]
 | This work is licensed under a Creative Commons Attribution 4.0 International License, which permits unrestricted use, distribution, and reproduction in any medium, provided the original work is properly cited. |