DOI:10.32604/cmc.2022.027487
| Computers, Materials & Continua DOI:10.32604/cmc.2022.027487 | |
| Article |
Secure Dengue Epidemic Prediction System: Healthcare Perspective
College of Computer Engineering and Science, Prince Sattam bin Abdulaziz University Al-Kharj, 11942, Saudi Arabia
*Corresponding Author: Abdulaziz Aldaej. Email: a.aldaej@psau.edu.sa
Received: 19 January 2022; Accepted: 10 April 2022
Abstract: Viral diseases transmitted by mosquitoes are emerging public health problems across the globe. Dengue is considered to be the most significant mosquito-oriented disease. Conspicuously, the present study provides an effective architecture for Dengue Virus Infection surveillance. The proposed system involves a 4-level architecture for the prediction and prevention of dengue infection outspread. The architectural levels including Dengue Information Acquisition level, Dengue Information Classification level, Dengue-Mining and Extraction level, and Dengue-Prediction and Decision Modeling level enable an individual to periodically monitor his/her probabilistic dengue fever measure. The prediction process is carried out so that proactive measures are taken beforehand. For predictive purposes, probabilistic analysis in terms of Level of Dengue Fever (LoDF) was carried out using the Adaptive Neuro-Fuzzy Inference System. Based on the Self-Organized Mapping procedure, the presence of LoDF is visualized. Several simulations on datasets of 16 individuals cumulating to 32,255 instances were conducted to test the effectiveness of the presented model. In comparison to other decision-modeling methods, significantly improved results in form of classification efficacy, a temporal delay, prediction effectiveness, reliability, and stability were reported for the presented model.
Keywords: Internet of things; smart air; real-time healthcare; adaptive neuro-fuzzy inference system
The growing potential of the Internet of Things (IoT) paradigm has dramatically revolutionized health sector [1,2]. Through modern technology, doctors can access detailed medical data from a distance and provide the required treatment in case of emergency health scenarios [3–5]. With ever-increasing health risks and the prevalence of life-threatening diseases leading to significant health loss, it has become important to broaden the scope of healthcare delivery [6]. An effective direction is to expand hospital-centric support to home-based healthcare delivery [7]. With the incorporation of fog and cloud systems, the analysis of medical data offered time-sensitive enhanced service [8,9]. Also, with innovations in Computer and Deep Learning (DML) approaches, namely the Long Short Term Memory (LSTM), and Recurrent Neural Network (RNN), automated healthcare networks were implemented to provide medical recommendations. The current study focuses primarily on the use of IoT technologies to determine the Dengue Virus Infection (DVI) prediction. Additionally, the results are visualized by the Self-Organized Mapping (SOM) method for effective decision-making services.
Research Domain
Dengue Fever (DF) is one of the significant causes of disease in tropical and subtropical regions of the world [10]. A virus that has at least four major serotypes so that preceding one serotype infection does not protect the user from infection with all the other three causes this disease. If the same user becomes re-infected with a different serotype, they are more likely to experience more severe symptoms like dengue hemorrhagic fever and dengue shock syndrome [11–13]. As indicated by the World Health Organization (WHO) report in 2020, about half of the total population is in danger of Dengue fever, and 390 million individuals are impacted with dengue every year, of which around 96 million have clinical manifestations1. In the last 50 years, the frequency of DF has risen and has resulted in health concern [14–16]. Tab. 1 provides a comprehensive overview of DVI-related symptoms. In Tab. 1 (+++) signifies the main symptoms of DVI, (++) reflects the symptoms that are not so major but are also important markers of this disease, (+) describes symptoms that are far less common and can or can not occur in an individual suffering from DF and (¬) shows the signs absent in an individual with a related disorder. There is currently no effective cure for DF. Moreover, common dengue vaccines have not produced adequate results [17–19]. The development of a reliable and early forecasting system is therefore an essential means of ensuring sufficient preparedness and response to the outbreak of DF [20]. The analysis of the disease from a remote location using IoT-fog-cloud paradigms offered innovations to monitor DVI parameters. In addition, the collaboration of IoT-fog-cloud and machine/deep learning techniques has become driving factors for carrying out the proposed research. Increasing human-life vulnerability due to DVI underlines the invaluable need for early diagnosis and examination by remote monitoring. The novel aspect of the presented framework is the real-time modeling and analysis of the various DVI parameters in a secure environment. Specifically,
1. It presents a secure IoT-inspired dengue prediction system for healthcare service delivery.
2. It classifies DVI parameters in 2 classes, namely Dengue Infectious Class and Non-Dengue Infectious Class by employing the Bayesian Network Model (BNM) based on a probabilistic attribute known as Level of Dengue Fever (LoDF).
3. It proposes a Temporal Granularity Method (TGM) for data retrieval and processing to perform real-time data extraction, which is further quantified in terms of Dengue Infection Measure (DIM) for the prediction of DF over the fog computing network.
4. It predicts the DVI probability centered on the LoDF value and its associated temporal dimensions incorporating the Adaptive Neuro-Fuzzy Inference Method.
5. It visualizes the predictive results of DVI utilizing the Self-Organized Mapping (SOM) approach.
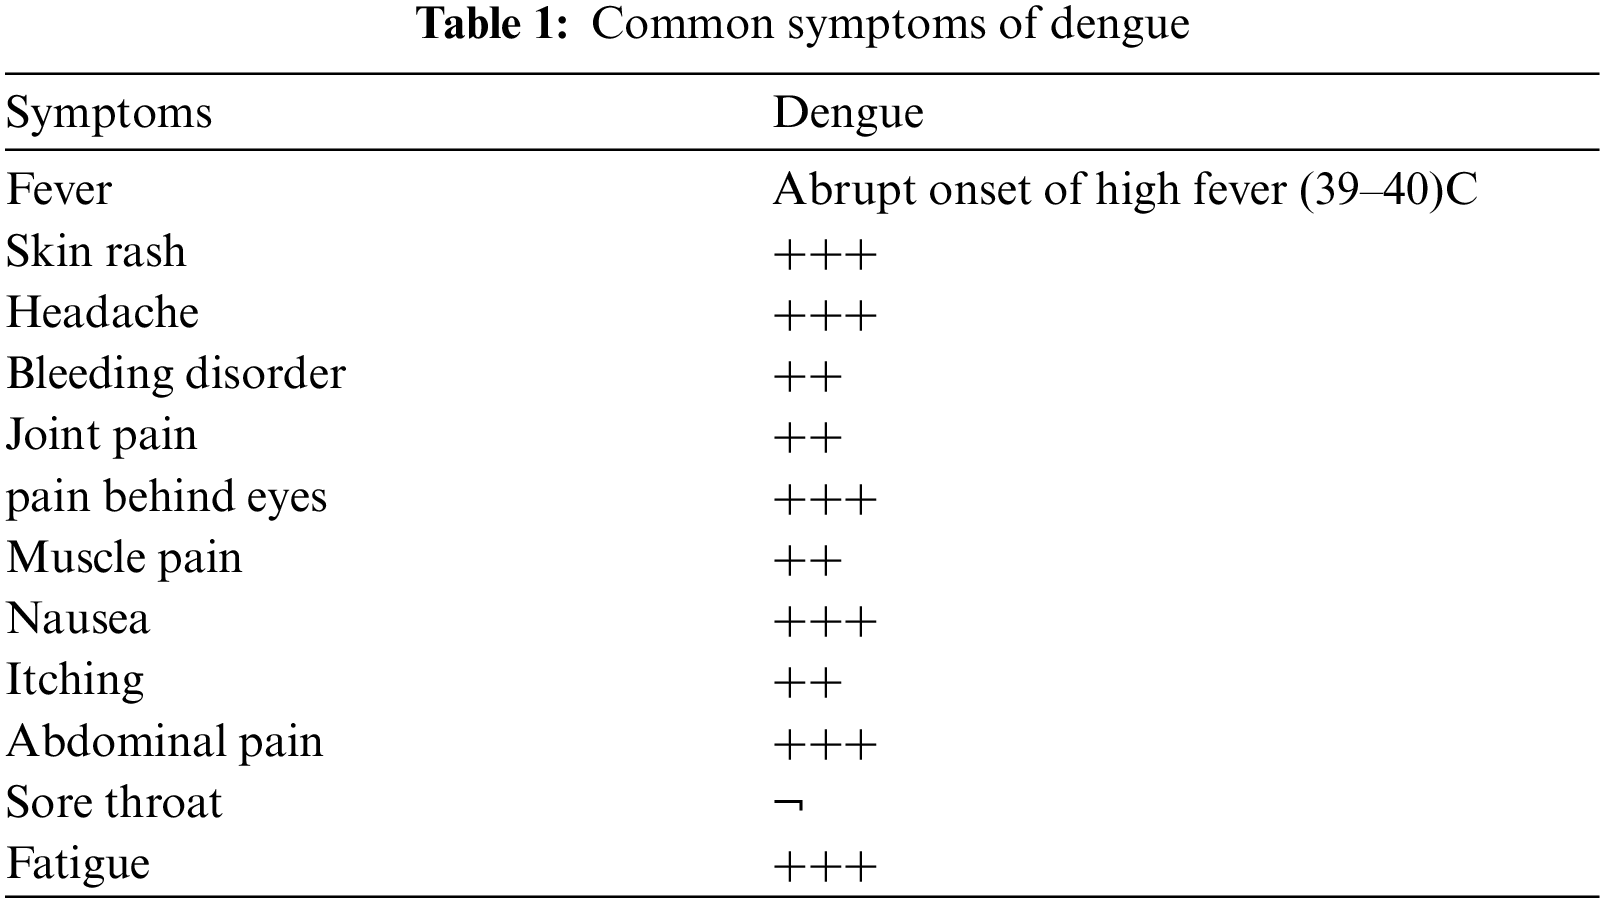
Fig. 1 shows the conceptual diagram of the presented approach.
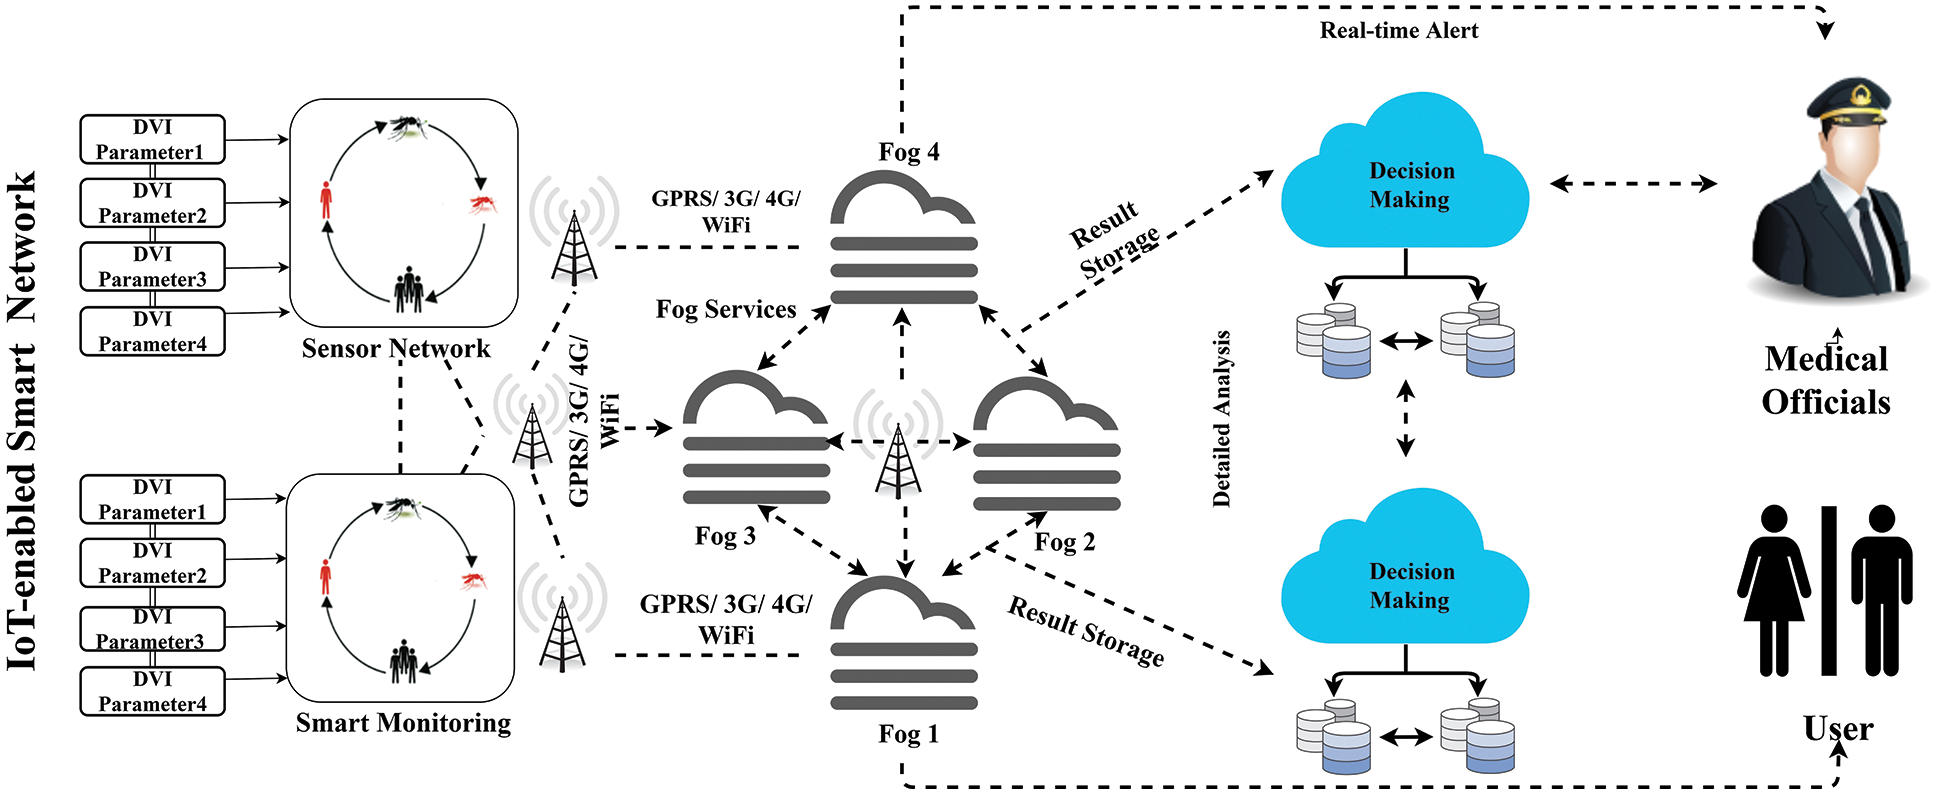
Figure 1: Framework of dengue virus infection prediction system
Paper Organization:
The article is organized into several sections. Important works in the field of disease analysis frameworks are presented in Section 2. The proposed DVI observing and determining framework is given in Section 3. The execution of the presented model is discussed in Section 4. Finally, Section 5 concludes the paper with future research directions.
Paper Organization:
The article is organized into several sections. Important writing in the field of locally established dengue disease checking frameworks is tended to in Section 2. The proposed DVI observing and determining framework is given in Section 3. The execution of the presented model is definite in Section 4. At last, different related exploration directions wrap up the article in Section 5.
This segment presents a brief review of significant contributions to IoT-based health monitoring systems. In addition, a subsection is made for the inclusion of similar works in the area of predictive decision-making.
2.1 IoT-based Secure Surveillance Framework
IoT technology has been used for time-sensitive data gathering in the smart health industry. In addition, researchers have extensively analyzed data across fog cloud systems to build smart frameworks. In 2017, Sareen et al. [21] proposed a cloud-based framework to screen the spread of the Zika infection by consolidating the PDA and a sensor hub that can quantify the number of mosquitoes in a geographic area. The Naive Bayesian Network (NBN) was utilized to analyze contaminated users over threat regions by utilizing Google Maps. In 2017, Sood et al. [22] developed an IoT-fog assisted secure cloud-based healthcare framework using wearable sensor technology, decision tree, and Temporal Network Analysis (TNA) to forecast and prevent Chikungunya virus. In 2018, Sood et al. [23] proposed a fog-based secure framework for the recognition, detection, and prevention of Mosquito-Borne Diseases (MBD). The key contribution of the paper is the early-stage management of the spread of MBD. The data is obtained from IoT sensor systems and cell phone applications. In 2019, Pravin et al. [24] presented an IoT-inspired efficient framework for identifying patients infected by dengue fever at an earlier level, which could allow the medical staff to provide treatment. Moreover, the proposed model was capable to provide secure and confidential sharing of health data of patients among doctors, healthcare agencies, and other authorized users.
2.2 Healthcare Frameworks Based on Fog-Cloud Paradigms
In 2018, Azimi et al. [25] proposed a dynamic computing architecture that would integrate edge and cloud services into intelligent medical applications. The authors inferred that the suggested system with nominal delay was able to yield improved results. The classification model focused on the Convolution Neural Network (CNN) was used to analyze the well-being data of the patients. The proposed model simulation was carried out for tracking the functionality of the ElectroCardioGram (ECG). However, no focus was put on the criteria of health such as heart rate, respiration rate, and body temperature. Authors have shown that, in addition to the cloud network, the use of fog computing has provided time performance on a wide scale. The authors offered a description of the e-Health interface to demonstrate the feasibility of the suggested system, based on fog computing. However, the proposed methodology was confined only to health data. In 2018, Rahmani et al. [26] proposed a healthcare system concentrating on fog computing to improve performance, reliability, and scalability compared to traditional medical systems. A fog-cloud approach at sensor level has been used by authors to provide early warning to the patients in their families. In a clinical setting, the method proposed is deployed and the authors have obtained successful outcomes. Manocha et al. [27] implemented a new approach assisted by edge analytics in 2019 to evaluate motor movements (MM) performed by patients. The restricting elements brought up in the examination incorporate the nonappearance of planning at the fog cloud level and excess information expulsion. The study introduced by Nayyar et al. [28] in 2019 addressed an IoT-based Health Monitoring system for the real-time analysis of the patient’s oxygen intake, heart rate, and temperature. Contradictory, simulation, and statistical decision making were excluded from the methodology. In 2020, Tuli et al. [29] proposed a novel Heath Fog architecture by incorporating deep learning approaches for automated heart disease detection in fog computing environments. Negash et al. [30] presented a case of integrating fog computing in IoT for healthercare.The presented model was able to accumulate real-time data for estimation and interpretation of the treatment of heart patients. The proposed framework was tested for output estimates in terms of network latency, energy consumption, and precision in real-time. However, the study was limited to forecasting heart attack in real-time and lacked the visualization assistance. The overall comparative analysis with the designed model is illustrated in Tab. 2 to indicate the difference with other related methods.
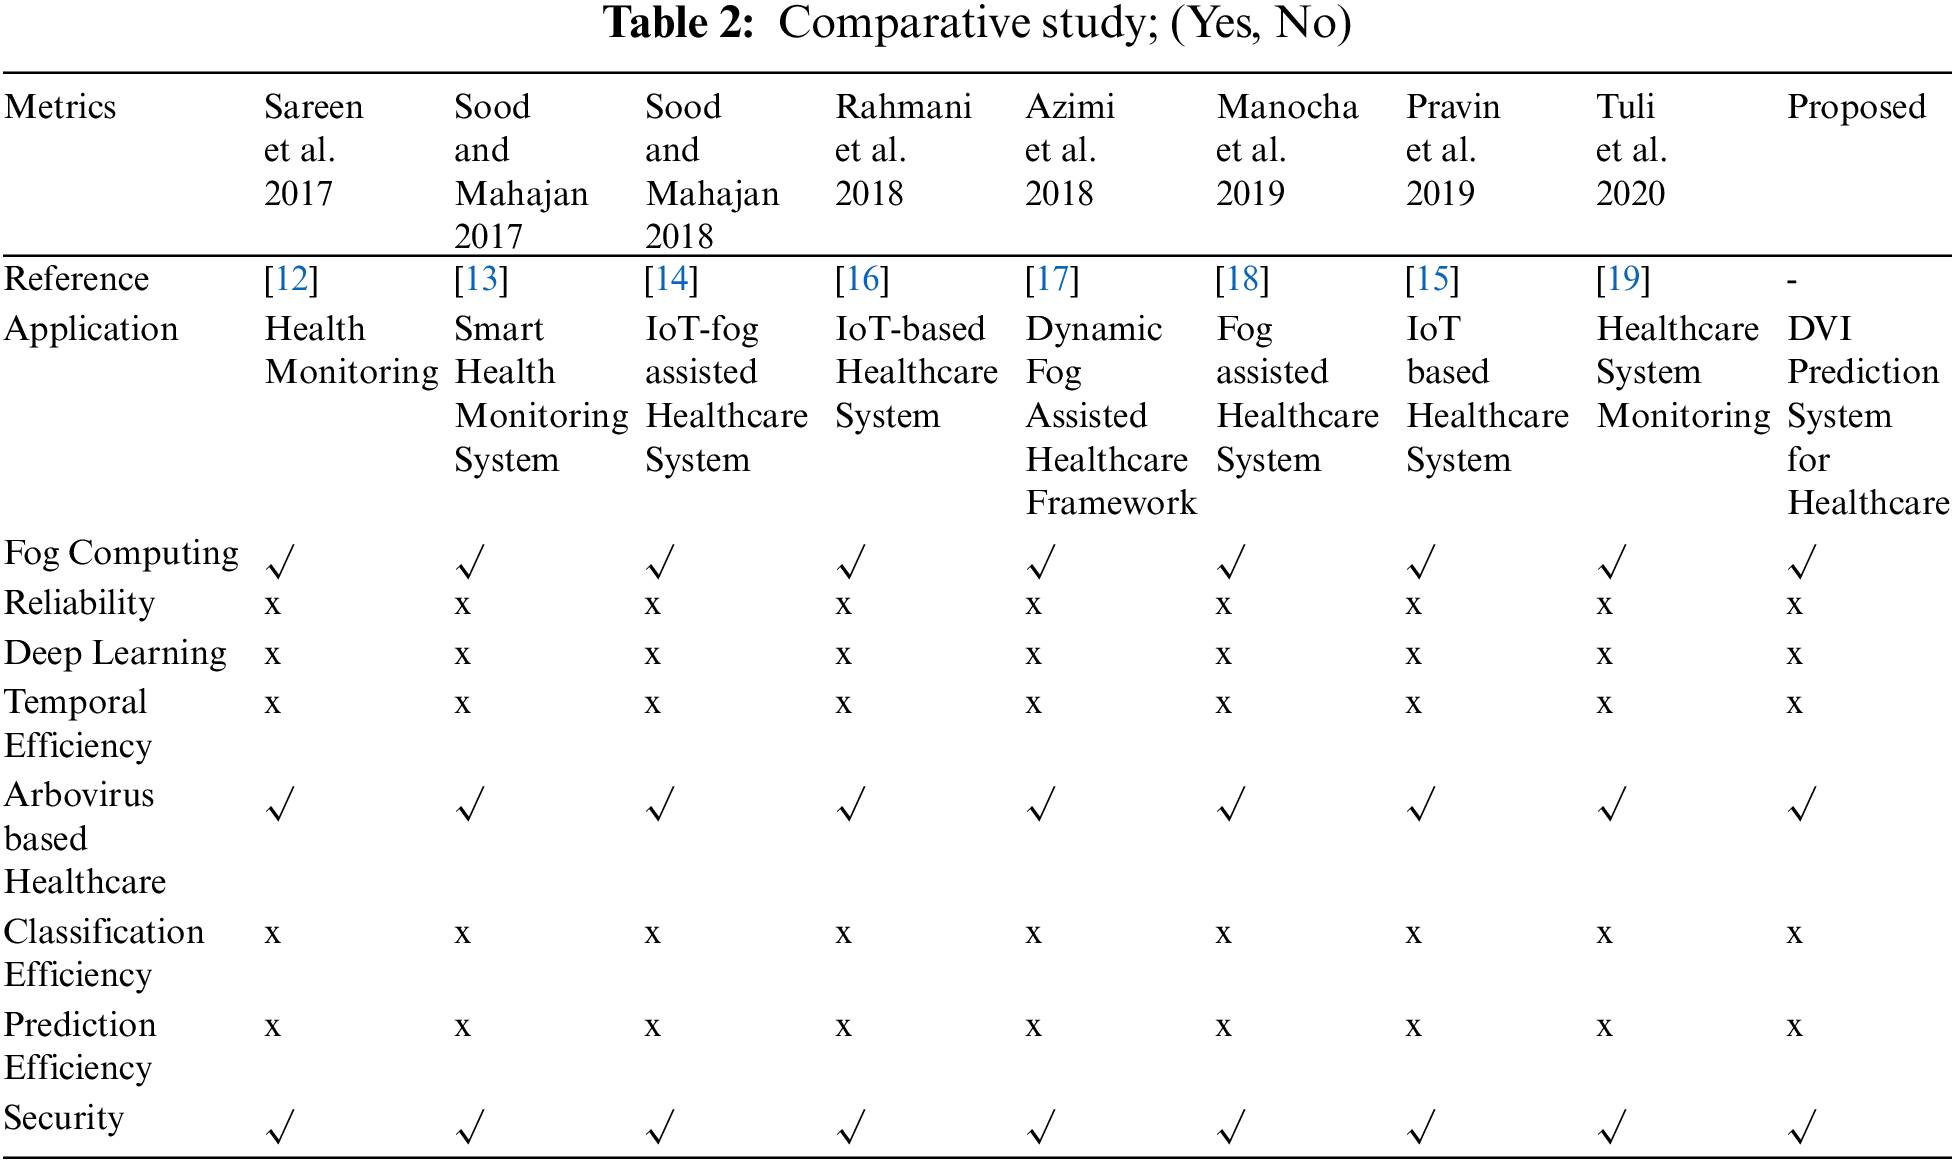
Fig. 2 shows an outline of the DVI surveillance system’s proposed architecture. The system proposed consists of four significant levels, namely the level of Dengue Information Collection (DIC), the level of Dengue Information Classification (DIC), the level of Dengue Mining, and Extraction (DME), and the level of Dengue Prediction Decision Modeling (DPDM). Each level is designed to accomplish particular responsibilities to achieve the ultimate objective of DVI determination.
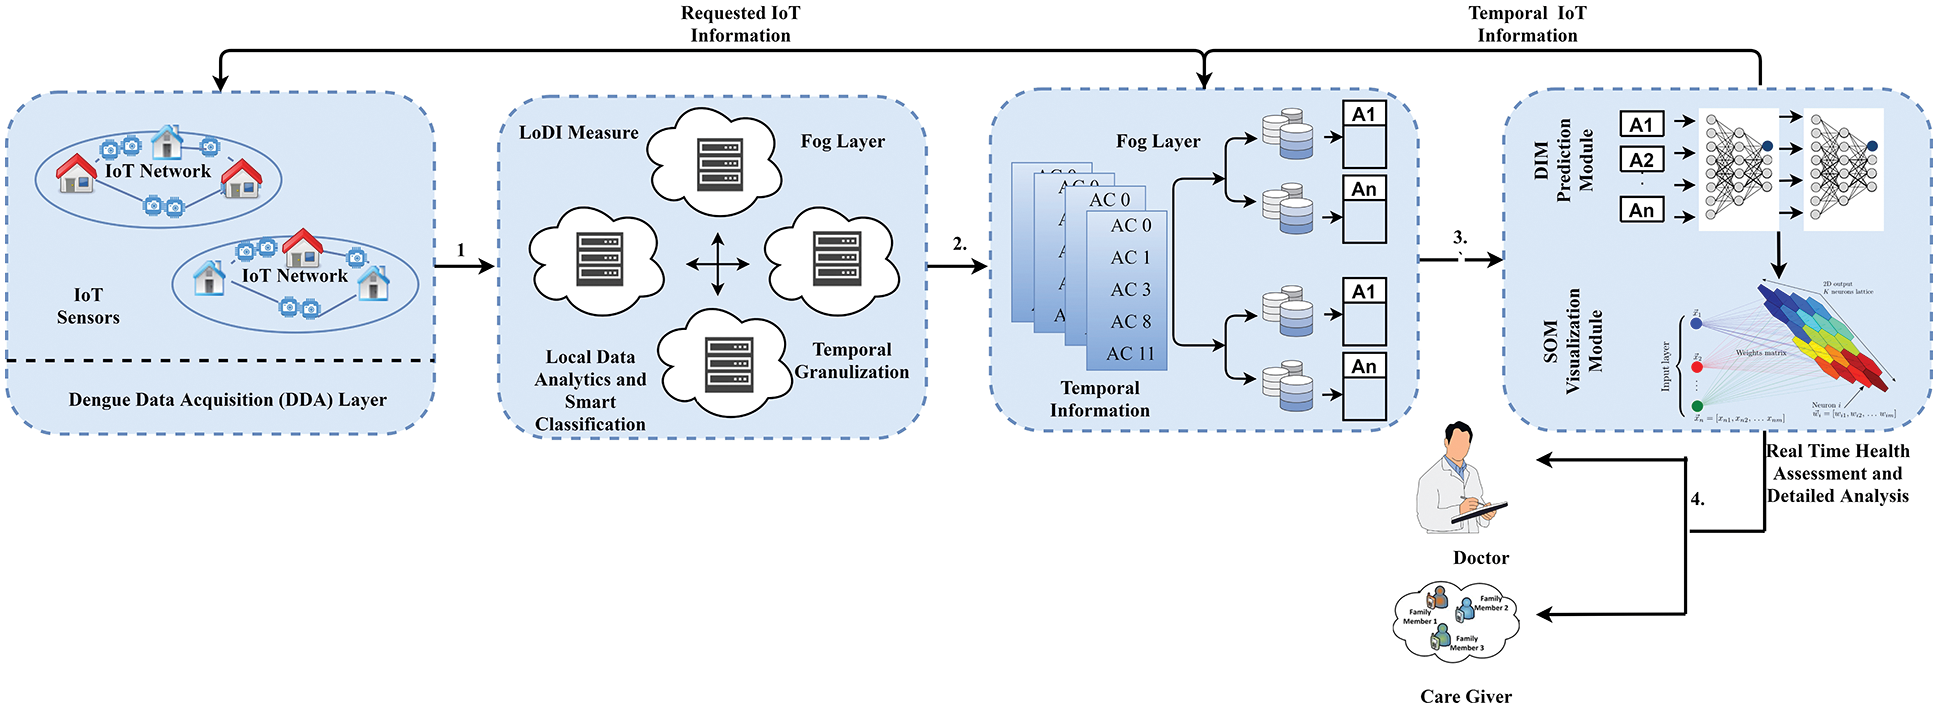
Figure 2: Modular framework for smart dengue virus infection detection
3.1 Dengue Information Acquisition (DIA) Level
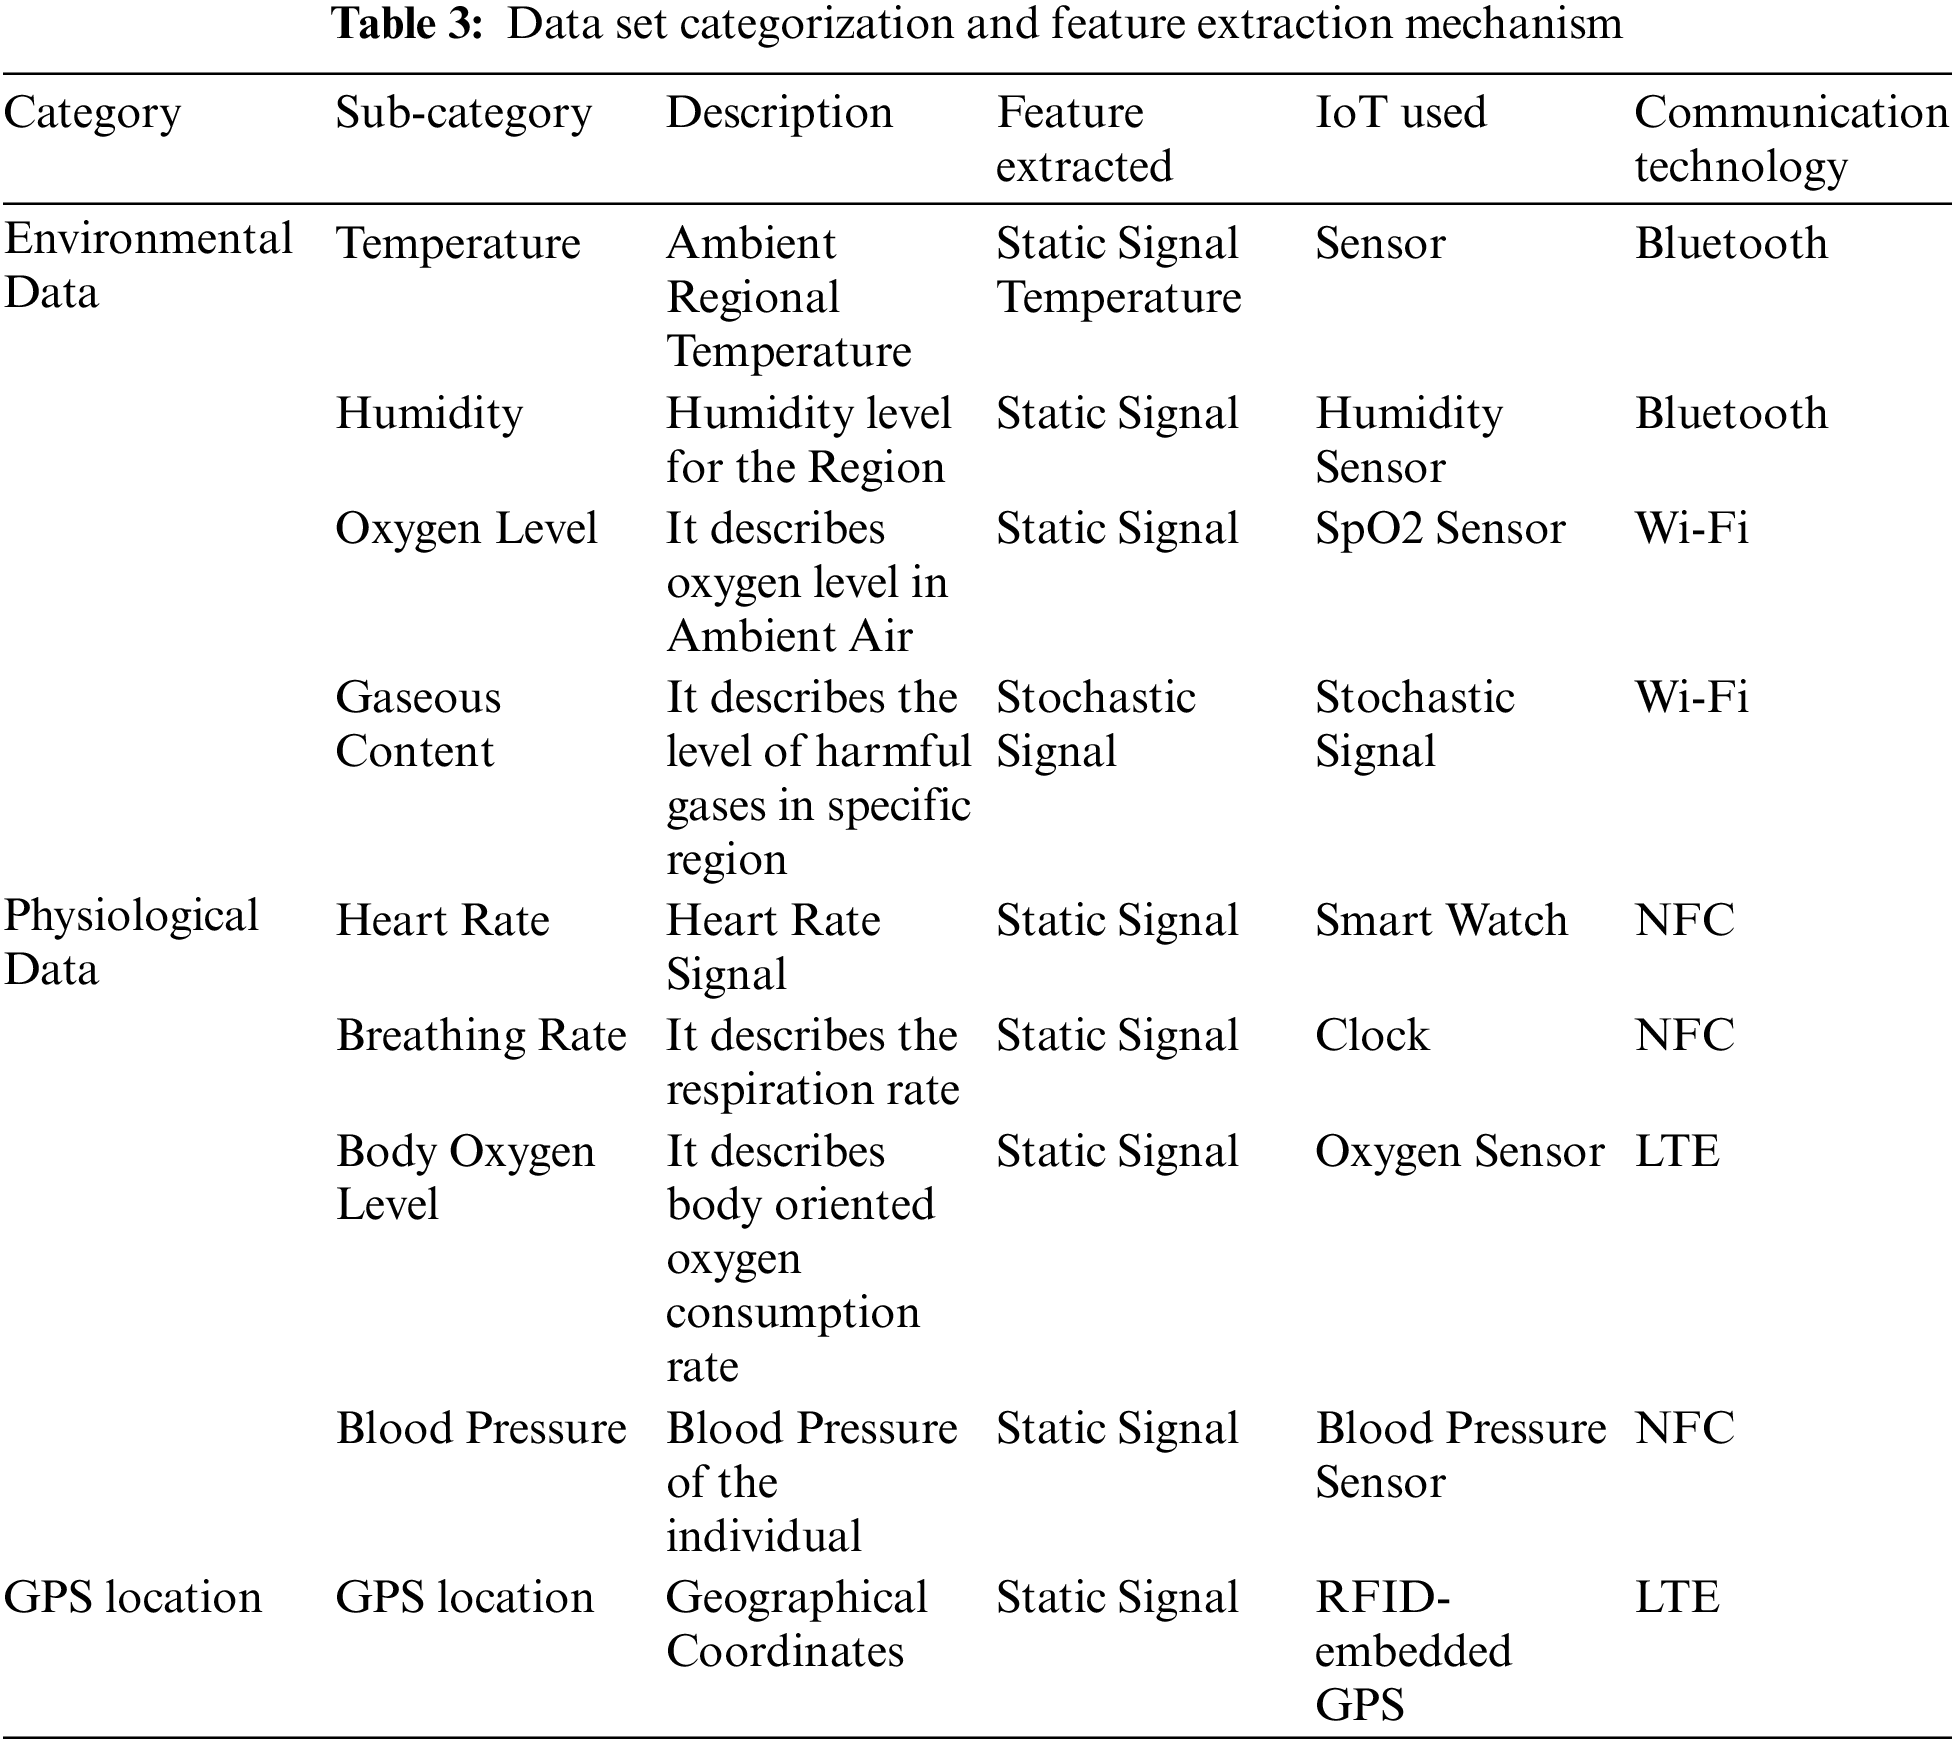
DIA level is used for collecting data from each user about health problems and different incidents from the surrounding environment. The information collected consists of data on health, ambient data, and data based on location. These data sets are obtained from the IoT sensor systems located in the user’s body as well as from the user’s circumforaneous areas. Using wireless communication technology, these sensors can continuously sense and relay data values. These values of data sets are disseminated to the fog level to identify the user class. The information collected from all IoT sensors is classified into three separate datasets and is depicted in Tab. 3:
1. Physiological Dataset: It contains the required health symptoms of users. It includes pain in the joints, fever headache, body rash, redness in eyes, nausea, tiredness of the muscles, and itchiness. The incorporation of health sensors into the user’s body collects such data values.
2. Environmental Dataset: It provides information about local mosquito breeding and extensive mosquito breeding sites of users. This type of information is continuously collected by mosquito sensors located at various spots. Sensors are often used for environmental analysis to perceive air temperature, carbon dioxide, and humidity values of water coolers, streams, ponds, springs, or refrigerators. Also, environmental sensors measure data about the atmosphere surrounding the individual, such as the lowest temperature, maximum temperature, humidity, and rainfall.
3. Location Dataset: It contains the identification of contaminated, prone, and untreated users as well as the identification of dense mosquito and breeding areas. The Radio Frequency Identification (RFID) tag is used to track close contact between contaminated, uninfected, sensitive, and unmasked users. Mosquito sensors are used to identify the nearby mosquito density and spawning sites of users.
The security of acquired data is another main activity accomplished in the DIA phase. It is predetermined to safeguard data transfer to cloud storage through the Secure Socket level (SSL) as it is a reasonably stable security-based protocol to date [31]. However, at data storage, the presented study presents a hybrid cryptography technique for data security.
Securing Data Acquisition
The information procurement system incorporates cryptography security techniques for information encryption. The proposed security method is comprised of various encryption and decoding methodology. In the whole strategy of information securing, the obtained information is separated into 2 portions D-ODD and DEVEN. The AES method is utilized to encode D-ODD part utilizing a private key KPri. The RSA is utilized to encode D-EVEN with the public key KPub. The private key X is utilized for decoding purposes at the capacity end, which is scrambled utilizing AES calculation. Tab. 4 shows the presented calculation for the introduced strategy. The general system is portrayed in Fig. 3. Moreover, the level of security can be defined both at the data acquisition level and data storage level.
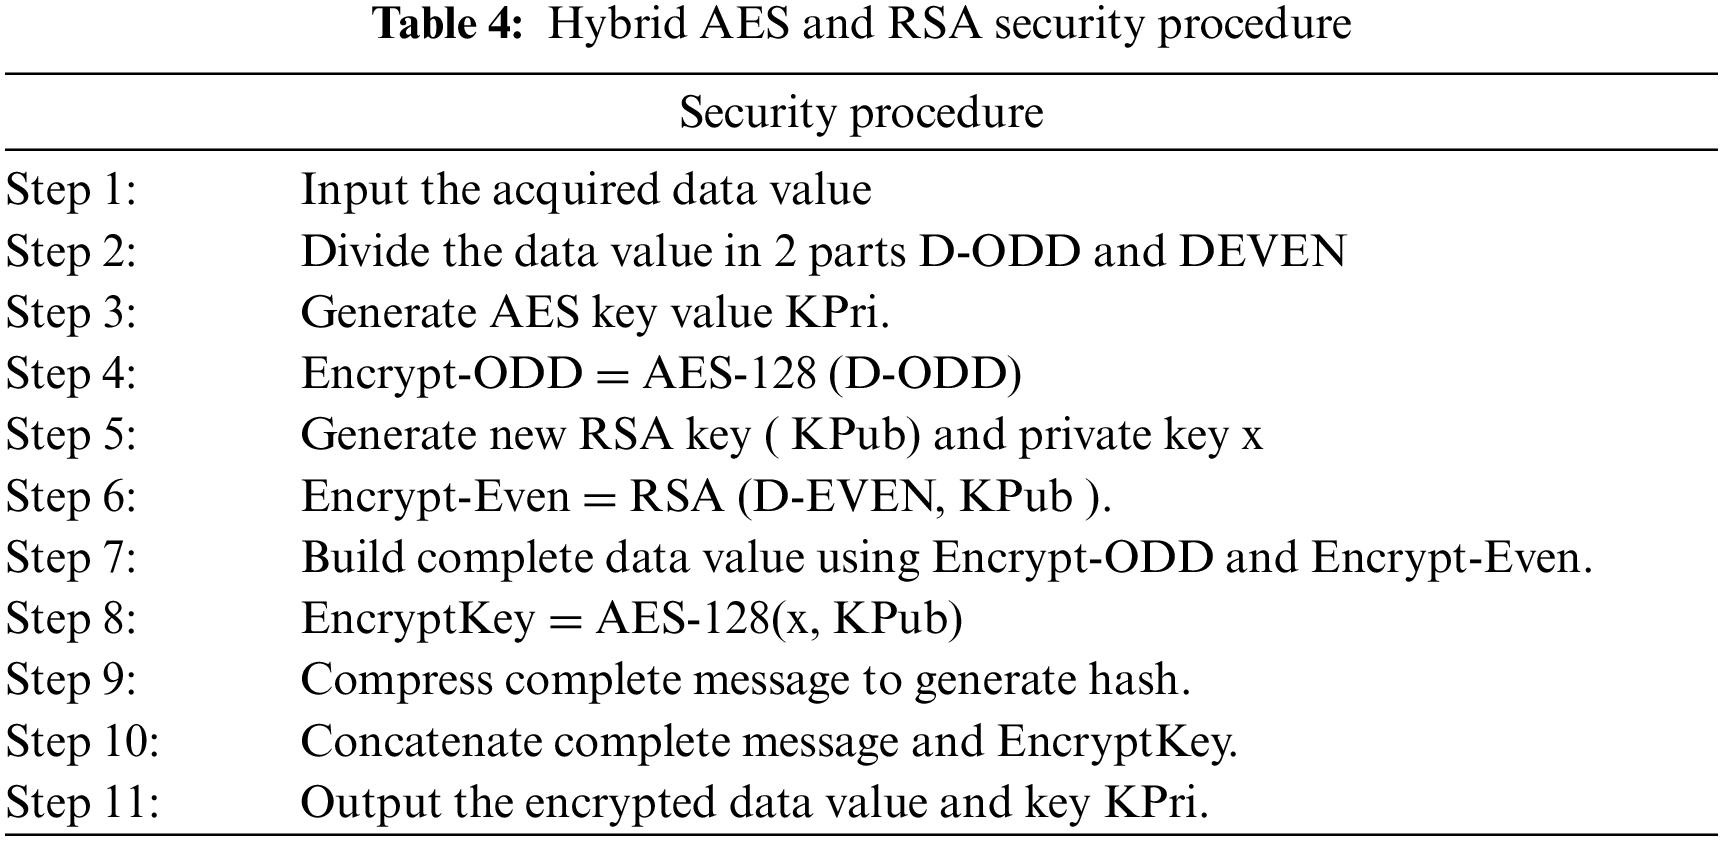
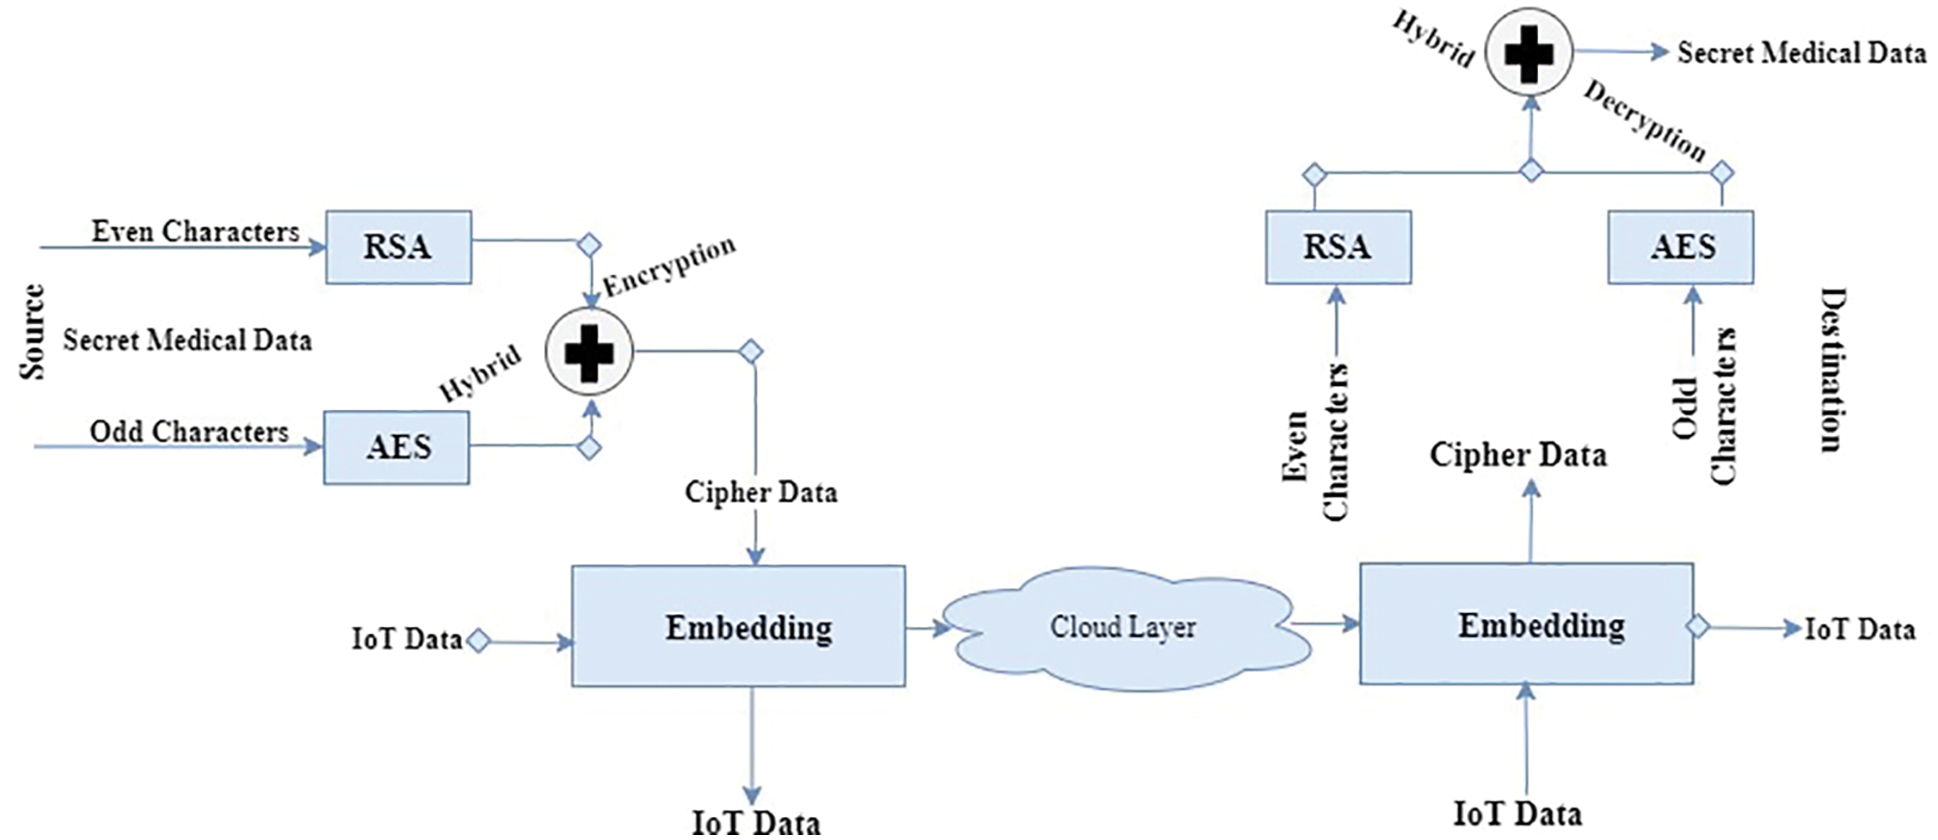
Figure 3: Hybrid security technique for iot medical data
3.2 Dengue Information Classification (DIC) Level
DVI parameters from IoT-medical devices are obtained in real-time. These parameters are evaluated for timesensitive decision-making using a fog computing system. Fog computing systems are lightweight, hardware systems with minimal storage capable of performing real-time computational tasks based on data segments [32]. In addition, it allows the processing, storing, and communication between IoT source devices and targeted cloud storage [33]. The Raspberry Pi, Arduino Gemma, and Intel Edison are various commercially available fog computing devices [34]. The DIC level’s key role is to accomplish efficient data analyses over the fog computing platform depending on the parameters specific to dengue. The Bayesian Network Model (BNM) is used to identify data fragments depending on a probabilistic estimate of LoDF. Specifically, the major reason for utilizing the BNM model is its effectiveness in the classification of probabilistic measures. Since BNM is based on probability-based categorization, the efficacy of BNM is significantly high as compared to other techniques.
Definition 1: Level of Dengue Fever (LoDF): It is a probabilistic measurement to evaluate the presence of DVI at a given time event Δt. Specially, LoDF measures a standardized quantification to represent the presence of dengue-oriented anomalies in the blood sample collected from the individual.
The aforementioned description is a quantifiable indicator for the identification of infection in the blood. In other words, LoDF calculates the interrelated parameters for DVI tracking in real time. Depending on the LoDF value, two classes of data segments are generated, namely Dengue infection Group and Non-Dengue Infection Group. This classification provides an adequate analysis for the diagnosis of DVI.
1. Dengue Infection Group:
This class contains certain DVI information that is delicate to well-being. Such sets comprise boundaries that fall past the standard range. For instance, raised the level of internal heat level, and decreased white platelet include in the blood. This classification contains irresistible information that needs dire treatment and preventive activity.
2. Non-Dengue Infection Group:
This class contains certain DVI information that fall inside the standard range to demonstrate the non-appearance of DVI. These parametric qualities are not infectious. Dengue Infection Class (DIC) adversely affects human well-being, and accordingly, it is critical to inspect these qualities to improve human well-being.
Mathematical Analysis
Let
Based on this, Posterior probability
Accordingly, probability
where
After scrutinizing k specification for a given blood sample in a time window
3.3 Dengue-Mining and Extraction (DME) Level
For extracting valuable data segments from the database server, the DME level is an important level. It enables data values for DVI data values to be extracted for efficient quantification over a time period. The Temporary Granulated Method (TGM) refers to the technique used for data abstraction. TGM is derived from the technique of temporary mining described in [35]. TGM consists of two main stages, namely TGM Mining and TGM Accumulation.
Definition 2: TGM Mining
In Definition 2,
Definition 3: TGM Accumulation (a1, t1),(a2, t2),…,(ak, tk): Given TGM Mining string of data fragments for Δt interval window, the TGM Accretion would lead in an accretion of diverse DVI parameter data segments that have susceptible values in the Δt timespan.
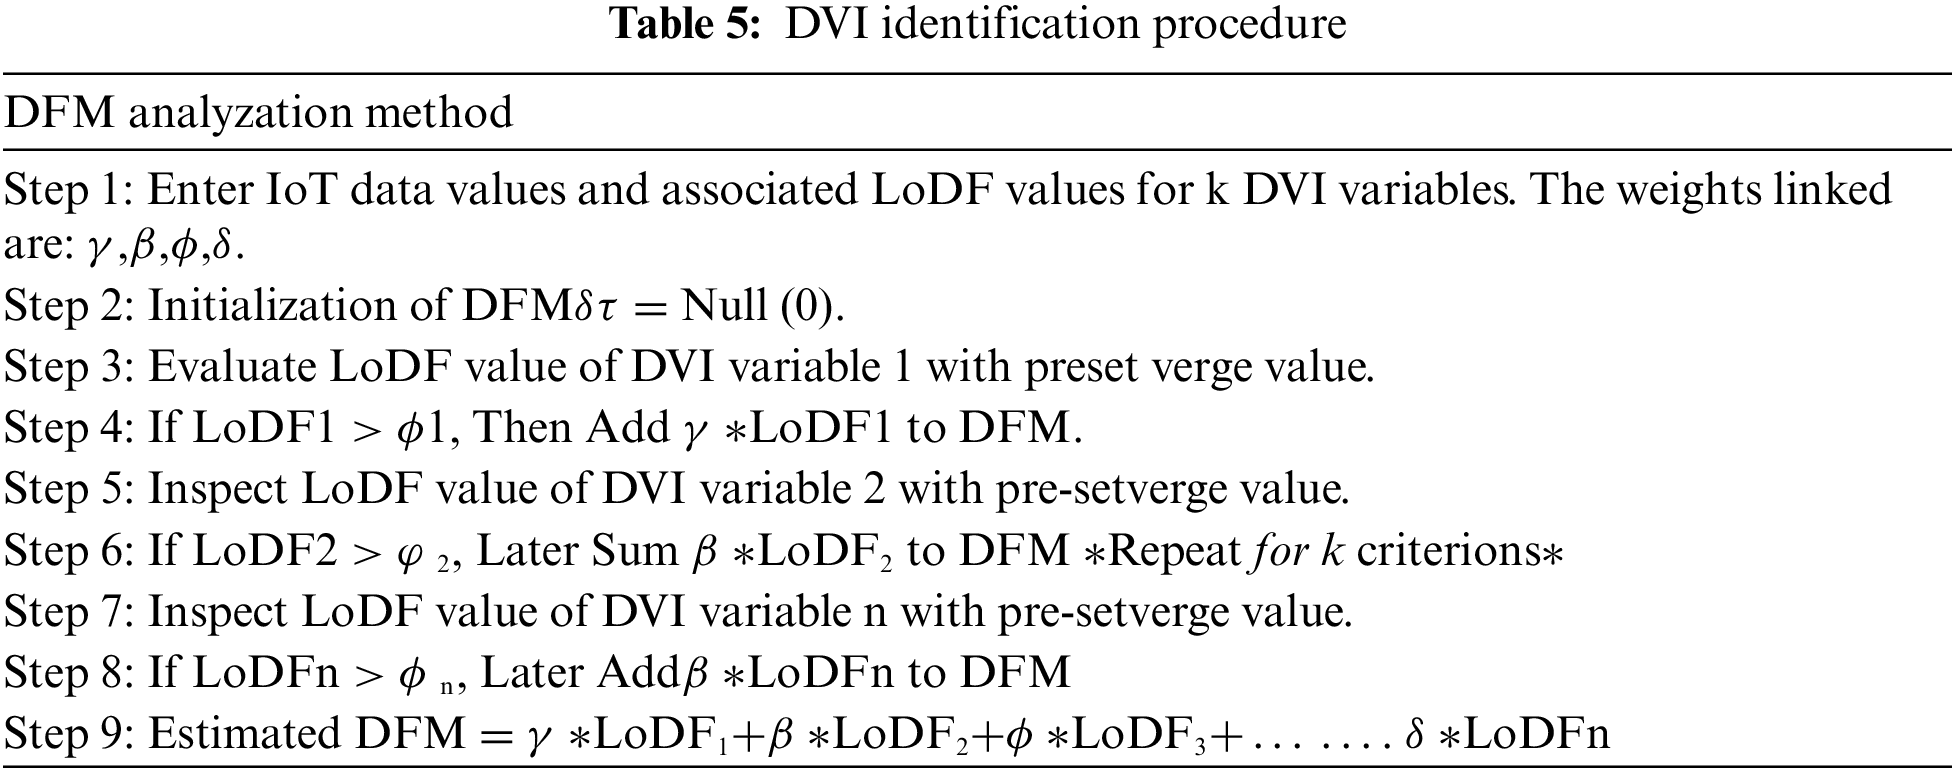
Definition 4: Dengue Fever Measure (DFM): Given a User U and associated TGM for DVI parameters in time-space of Δt, then DFM is described for U as a probabilistic metric for measurable dengue assessment based on DVI reported in Δt interval.
Definition 4 offers a definite evaluation of the DVI estimations in a User for a given time window. Fig. 4 gives a sensitive portrayal of the TGM strategy for the DFM estimate. A few stages have been given in Tab. 5 to dissect DFM in a given time window Δt.
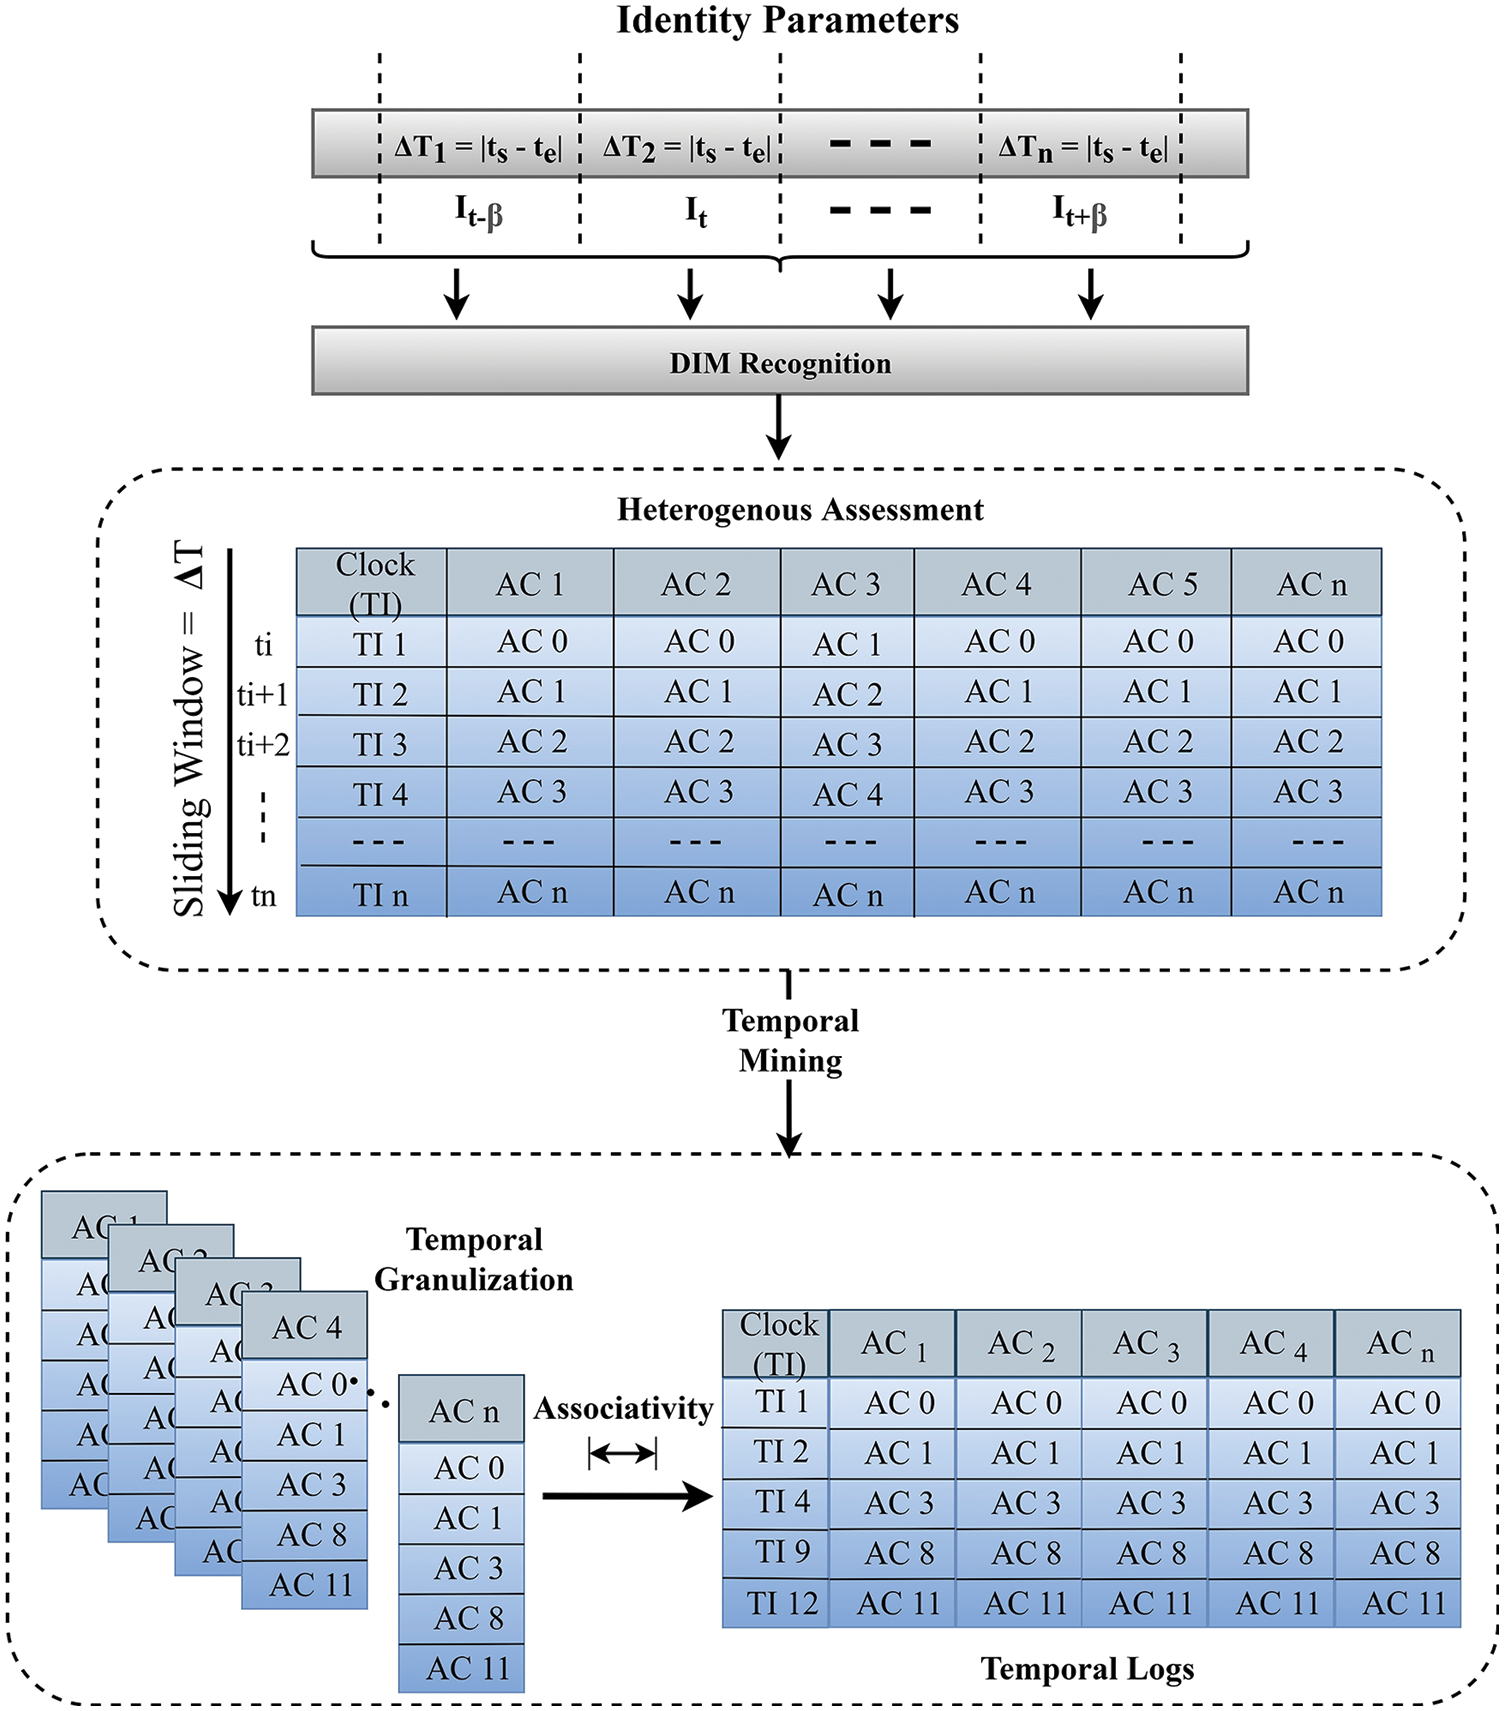
Figure 4: Temporal granulation
3.4 Dengue-Prediction Decision Modeling (DPDM) Level
The level of DPDM is the prediction level of the presented framework. The main aim is to carry out efficient analytics, based on acquired datasets, for early estimation of DVI. For the processing of large segments of datasets, numerous computational solutions for effective predictive modeling are available. The approach used is based on the Artificial Neural Network’s timebased variant called the Adaptive Neuro-Fuzzy Inference Framework (ANFIS). For real-time prediction approaches, ANFIS integrates time aspects of data acquired. Specifically, to formulate an effective prediction model, time relationships within data elements are addressed. ANFIS is the most effective method of realtime estimation of individual values based on historical results. Primarily focused on the multi-level perceptron method, it is also the most popular prediction machine learning method. ANFIS is the most effective method of real-time estimation of individual values based on historical evidence. Primarily focused on the multilevel perceptron method, it is also the prominent prediction machine learning method. ANFIS consists of multiple neurons that are organized in the form of sets. Fig. 5 displays the outline of the ANFIS model used in this analysis, in which the input and output functions are ξ (j) and ξ (q).
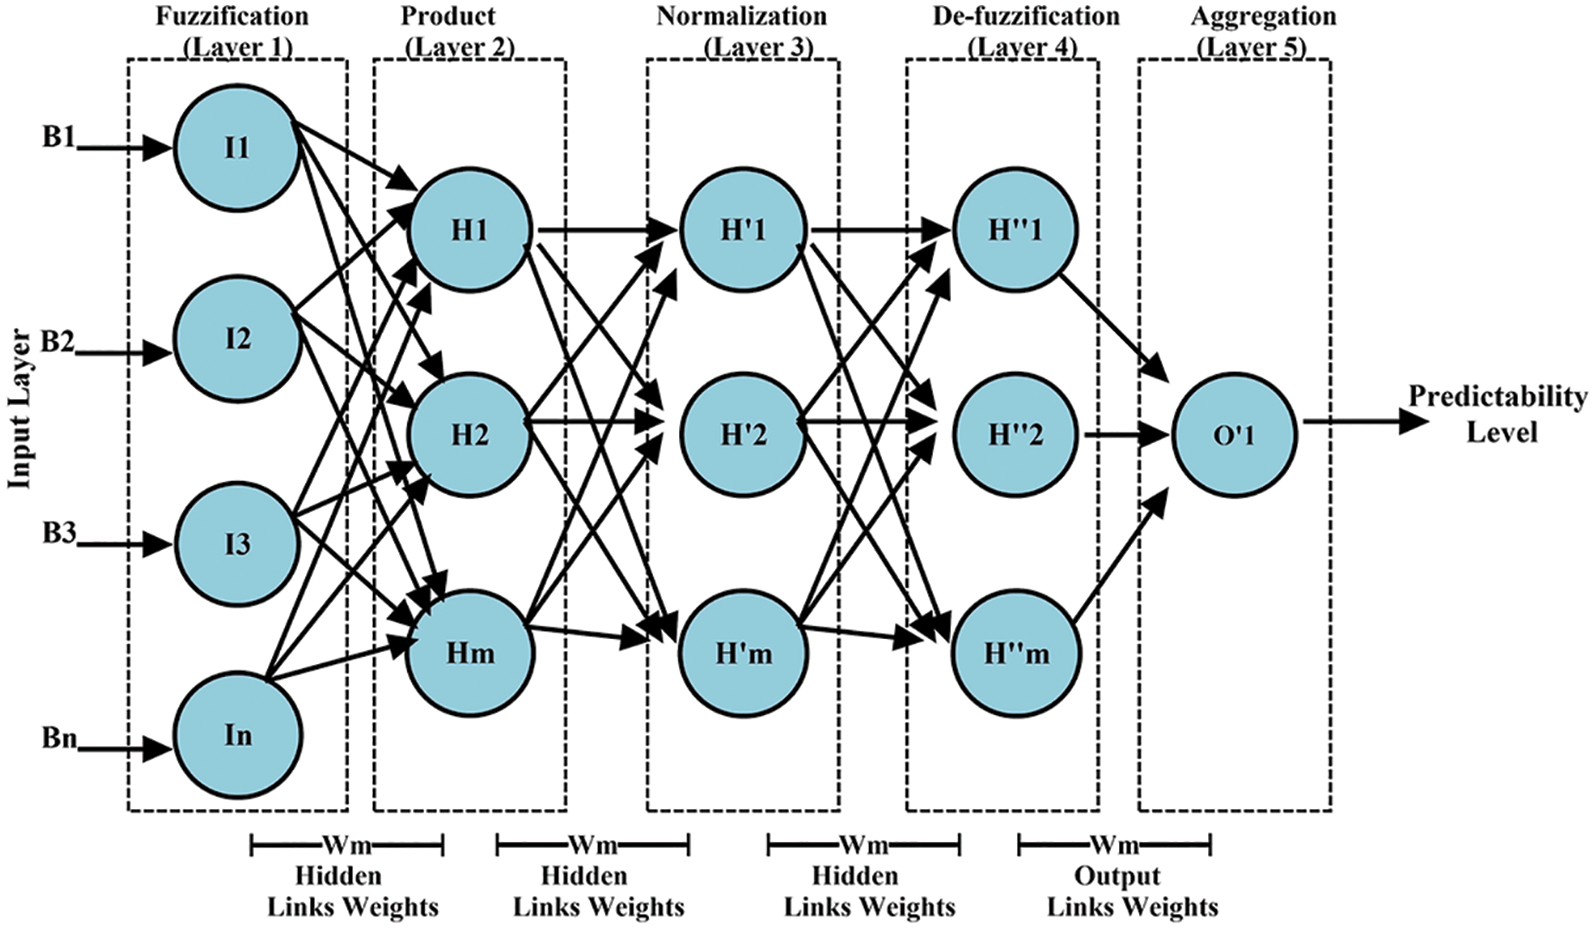
Figure 5: ANFIS structure
ANFIS Architecture
Numerous researchers in different fields are utilizing ANFIS technique for dynamic effectiveness [36]. ANFIS [37] is being utilized to determine complex issues. The ANFIS structure with input factors in 5 stages appears in Fig. 5. Fuzzy Logic gives a multi-esteem input rationale from one parental information vector, which indicates data values [38]. A fuzzy deduction model for the contribution of nonlinear guide vectors is utilized. In the current investigation, each DVI is assessed utilizing the proposed ANFIS model inside a space-time window. For instance, ANFIS can determine information over a predetermined time-space window. The definite numerical assessment of the ANFIS stages is discussed ahead.
a) Fuzzification (Stage 1): The ANFIS method’s initial phase is the fuzzy component, which uses Membership Functions (MFs) to transform admissions into a fuzzy set. Each node is receptive and demonstrated as follows in this step:
b) Product rule (Stage 2): The nodes in the first stage pass the input data to the next stage by performing the segment-based product formulation and are represented analytically as follows:
c) Normalization (Stage 3): Every node during this aspect specifies the dissemination of the particular firing strength rule to the quantity of each _ring strength rule in Eq. (3). The firing power of
d) De-fuzzification (Stage 4): This stage is responsible for determining the improvement to the final performance of the kth rule. The following defined consequent variables are identified as the hl, dl, and ol attributes. The de-fuzzification process in this stage is as follows
e) Output generation (Stage 5): The yield step is designed to analyze the total of all results from all nodes, and Eq. (5): indicates the eventual value of
A significant improvement in a wide scope of utilization of ANFIS was identified. The model technique can improve displaying quality and actness. A wide approach is accessible including Particle Swarm Optimization (PSO), to upgrade the results of the ANFIS framework. The three vectors Uk, Rk, and Sbestk represent the characteristics of a particle where Uk is the unique location, Rk is the current velocity, and Sbestk is the best spatial location in the search for the particle, and xbesto is the ideal solution for the whole particle group. Based on the following formula, the direction and trajectory of the particle are modified slowly:
where, r(⋅) is the particle pace in the Oth and (O+1) th recurrence, present (⋅) is the fragment location, f1 and f2 are learning constants that are greater than 0, and a random number between [0, 1] is alluded to as ran (⋅). Eq. (7) indicates a method for upgrading the particle frequency, including the historic momentum and the specific and global best location of a specific particle.
Visualization Procedure: The DVI forecast model representation is utilized as a strategy for the individual patient and guardian concerned. In particular, for effective use, the Liquid Crystal Display (LCD) framework is needed to show the outcomes to the client progressively. Besides, the perception of prescient results is upgraded utilizing the Self-Organized Mapping (SOM) strategy as opposed to a quantitative survey of boundaries. The SOM method is utilized for intelligent color-coded visualizations. The introduced model is utilized U-matrix to coordinate the SOM technique. Fig. 6 shows the utilization of U-Matrix for the perception of SOM. Red is the higher estimation of DFM and the lower estimation of DFM is checked utilizing a green tone. As such, with a shading marker on an LCD, quantitative qualities are determined. With a shading pointer on the LCD, quantitative qualities are determined. Comprehensively, High-risk DFM esteem guides to Red tone, Nominal-risk esteem guides to Yellow color, and LowRisk esteem guides to Green tone. Because of costviability and exactness, it ought to be noticed that utilizing remote innovation over the ZigBee convention, information transmitted from fog registering gadgets to the LCD device can be figured out.
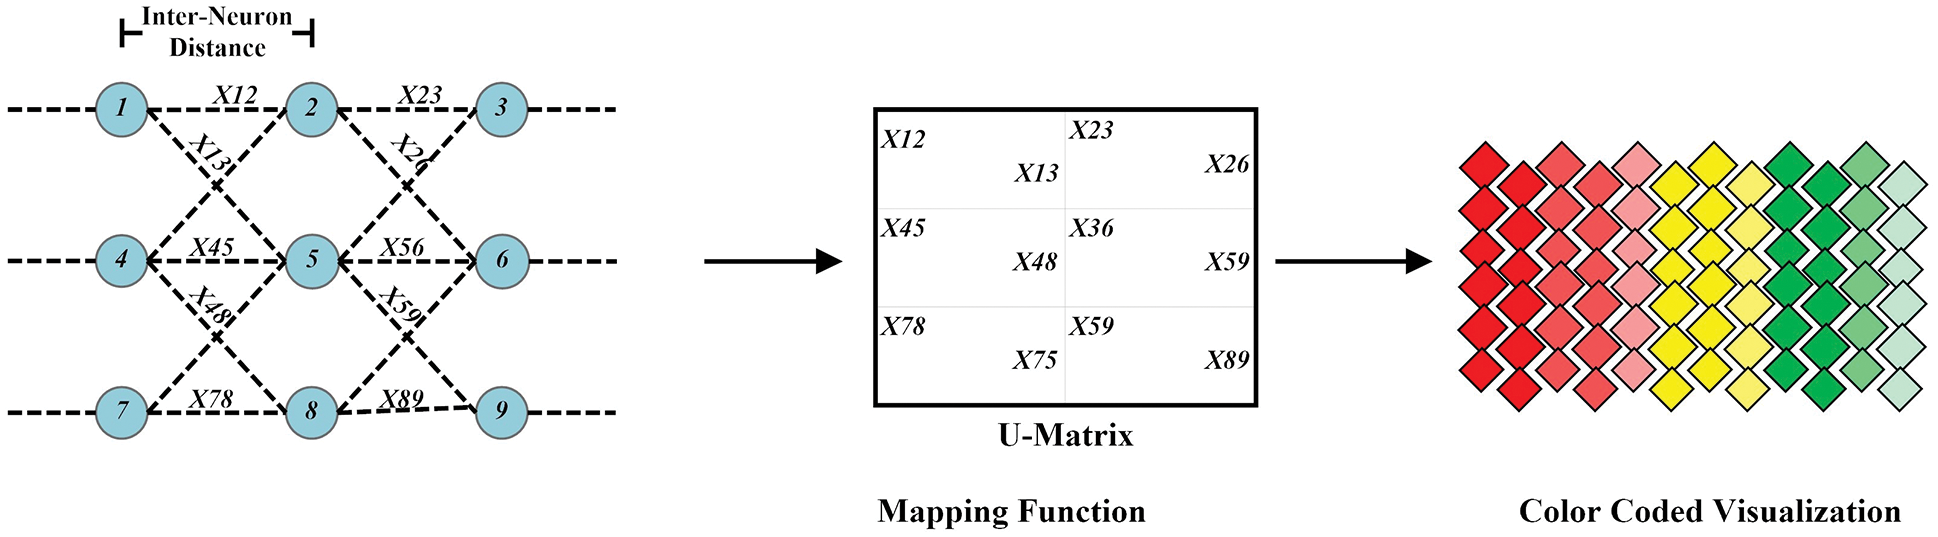
Figure 6: Self-Organized Mapping (SOM) technique for predictive indication
The efficacy of the proposed framework is evaluated in this section. The mechanism presented, as stated earlier, includes several levels. Initially, through using IoT sensors for DVI prediction, information is acquired. Using the BNM routine, which is then analyzed using the temporal mining technique, acquired data is divided into Dengue infection and non-infection datasets. Finally, it uses ANFIS-PSO as a paradigm for forecasting adversity. Assessment of the results is carried out with the following objectives.
1. Evaluate the delay effectiveness of the framework developed for real-time sensitivity.
2. Assess the efficiency of the categorization based on the BNM model for data classification provided.
3. Quantifiable assessment of DVI accuracy for recognizing the irregularity.
4. Assess the reliability over large segments of data of the proposed prediction model.
5. Assessing overall model stability to assess the longevity of the proposed model.
In a real-world scenario, the simulation of the model was carried out in which 16 people were monitored in 4 groups, resulting in 32,225 datasets. The physiological features of users have been depicted in the form of Tuple P = (Age(in years), Gender). Group 1 includes P = (less than 18 years, Male, Male, Female, Female), Group 2 has P = (between 18 and 32 years, Male, Male, Male, Female), Group 3 has P = (Between 32 to 50 years, Male, Female, Male, Female), and Group 4 has P = (Above 50 years, Male, Female, Male, Female). Moreover, datasets were acquired using several IoT sensors including Temperature sensor (for statistical ambient temperature), Humidity sensor (for statistical humidity value), Air sensor (stochastic air quality), G sensor (statistical geographical location), body wearable (body temperature, heart rate, and galvanic skin response). However, there are certain constraints for data collection. Data was acquired carefully with the proper disposition of the IoT devices concerning the user. Network bandwidth was another issue for consideration. Data were acquired after every time instance. Moreover, data including blood platelets and infection was acquired using manual clinical procedures by consistently monitoring the users. These included regular testing from the local laboratory at a specific instance of time for efficient result generation. DVI datasets consisting of datasets comprising characteristics such as the location of dense breeding sites and mosquitoes, humidity, carbon dioxide, body temperature, etc. were reported. For outcome assessment, dengue screening was done. It helps the patient to determine the number of platelets in the body on a normal basis. Informal approval was acquired from all Users before actual deployment. Random groups of people with heterogeneous physiological parameters were chosen for system efficiency. Also, all people’s sex, height, weight, and other physical features vary from one person to another. It encourages a much more general usage in the practical setting of the proposed solution. As shown in Fig. 7, specialized hardware instruments for the collection and analysis of blood have been incorporated. The iFogSim simulator is used for numerical modeling. It is an opensource toolkit for data processing through the use of the fog computing framework. You will see the details of iFogSim with [39].
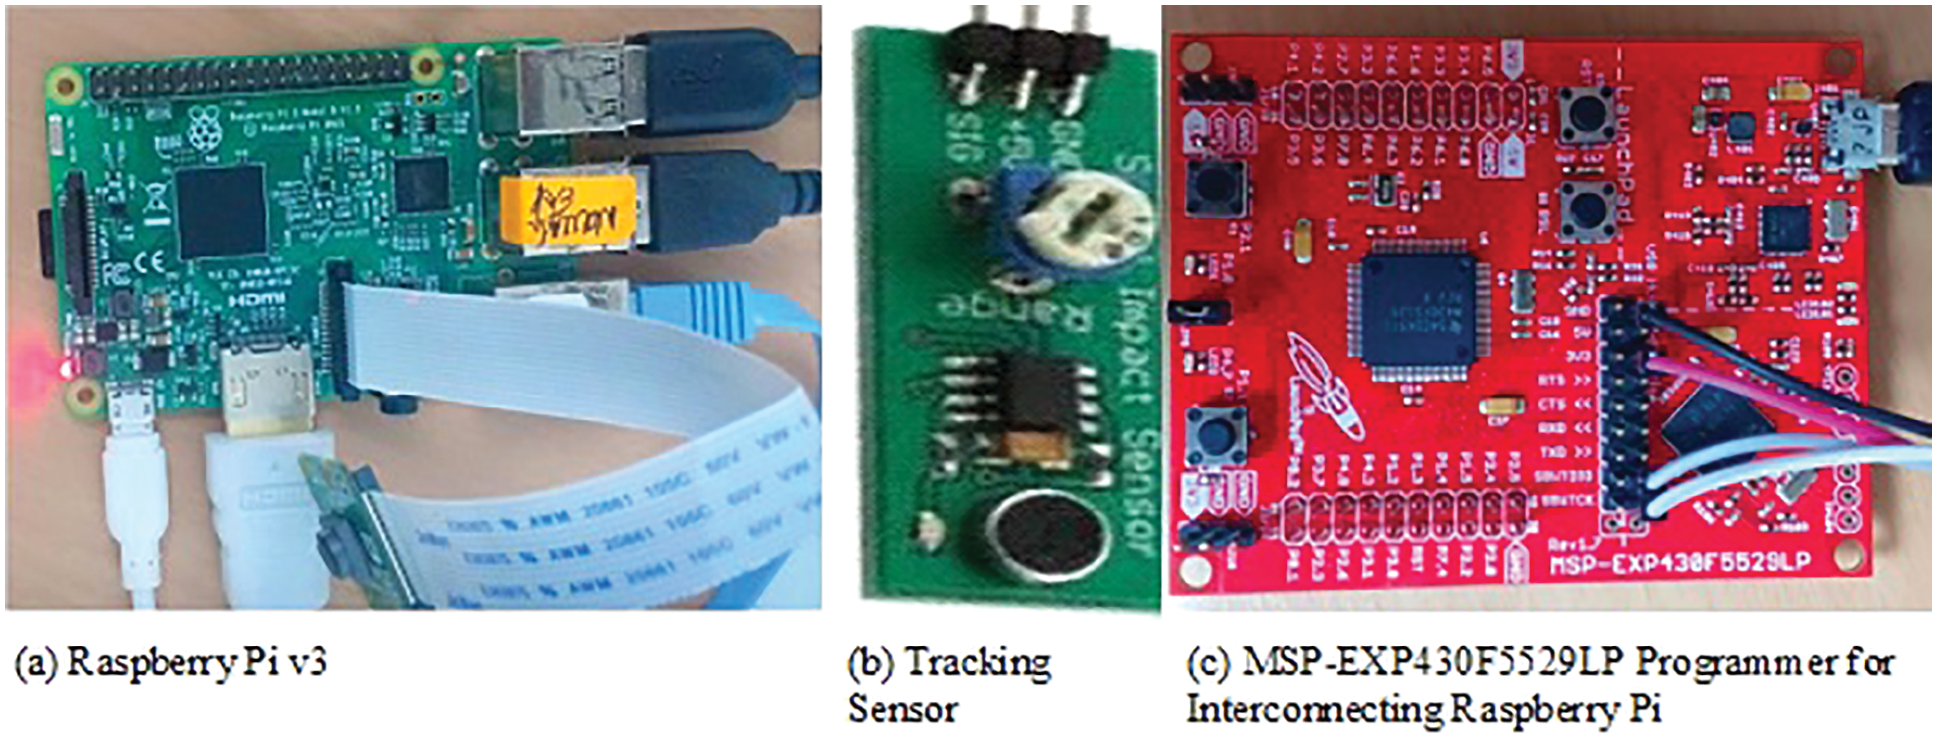
Figure 7: : Computing devices
4.2 Overall Temporal Delay Estimation
Temporary delay concerns the time taken based on the DVI parameters to obtain identify and forecast. In other words, the time delay for determining predictive outcomes is the time-lapse sustained by the proposed model. If T Monitoring denotes the time of DVI acquisition, T Classification signifies the time for data classification, and T Prediction, then T Temporal Overall is calculated as following
An instance of the iFogSim code for analyzing the overall temporal delay is shown in Fig. 8.
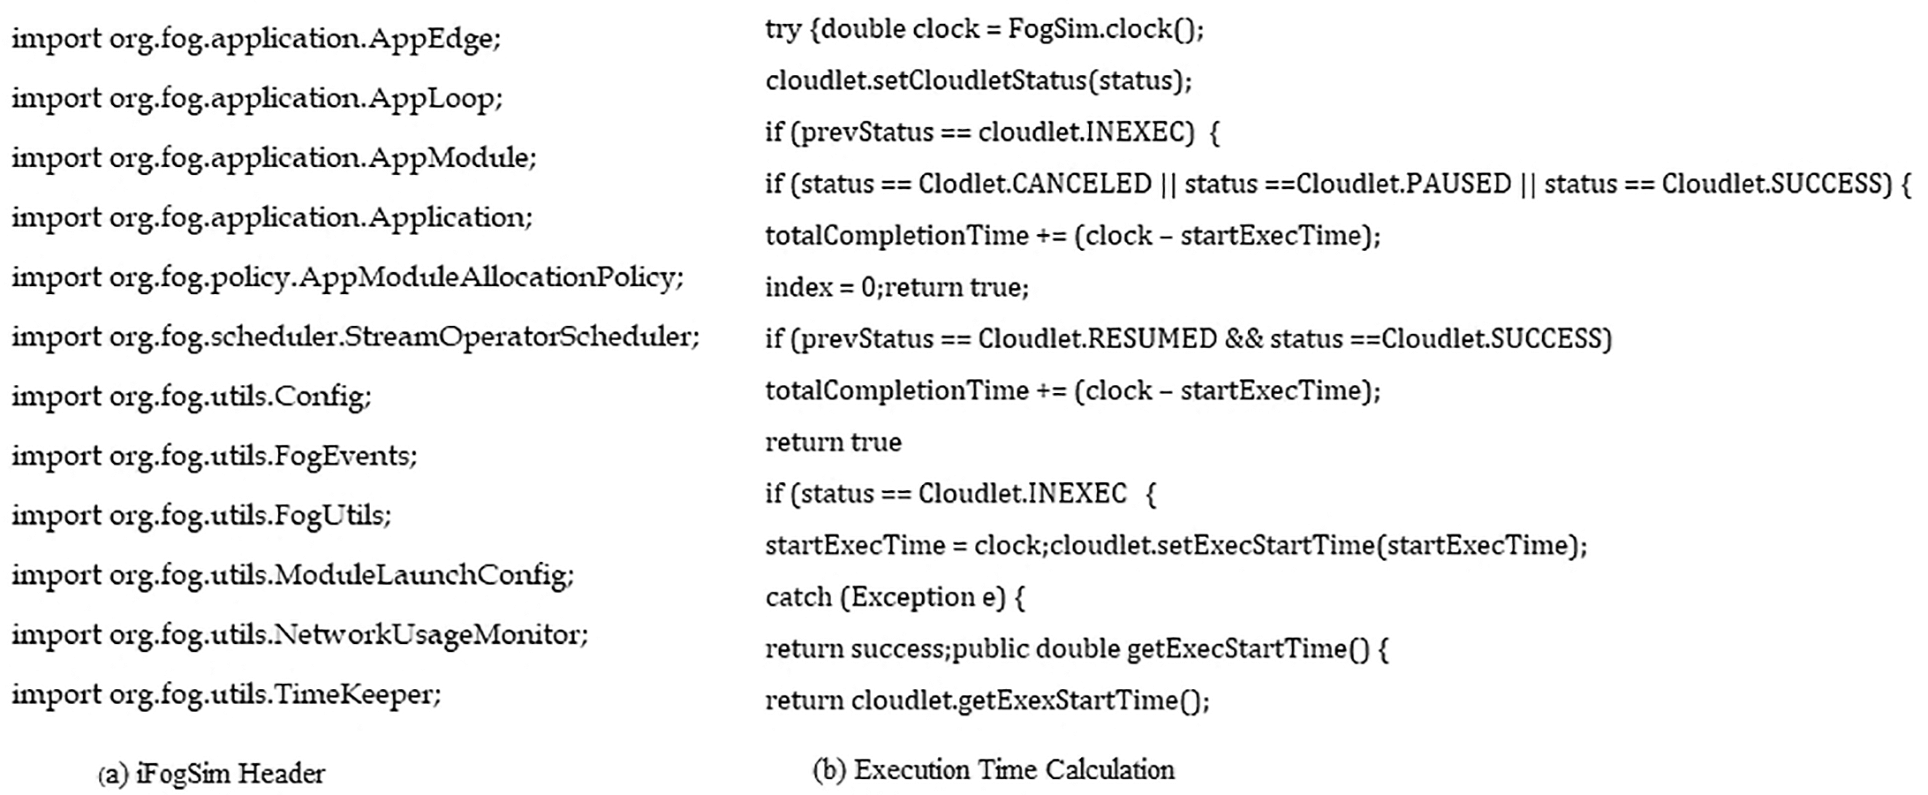
Figure 8: Embedded code for delay estimation
Results
1. Fig. 9a shows the result of the computation time for Group 1. It can be seen that the IoT tracking period for the acquisition of 8212 datasets is on average 96.02 s. This was followed by an average classification lag of 98.69 s. The proposed model forecast procedure reported an average delay of 108.66 s, resulting in an overall delay of 308.37 s.
2. For Group 2, the mean time delay for capturing data was 105.45 s over 8103 data instances, as seen in Fig. 9b. This was followed by an average delay of 100.55 s for the data classification and 110.69 s for the prediction. From now on, an overall delay of 310.50 s has been reported for the DVI Prediction System.
3. Fig. 9c indicates the cumulative delay in execution for the data segments of Group 3. Overall, a time delay of 310.87 s was observed, consisting of 96.92 s for IoT tracking, 110.73 s for data classification, and 110.22 s for prediction delay.
4. A similar trend in time delay has been reported for Group 4 as shown in Fig. 9d. The average execution delay of 305.86 s was acquired for the proposed model, which demonstrates the enhanced effectiveness of the technique provided over a time scale.
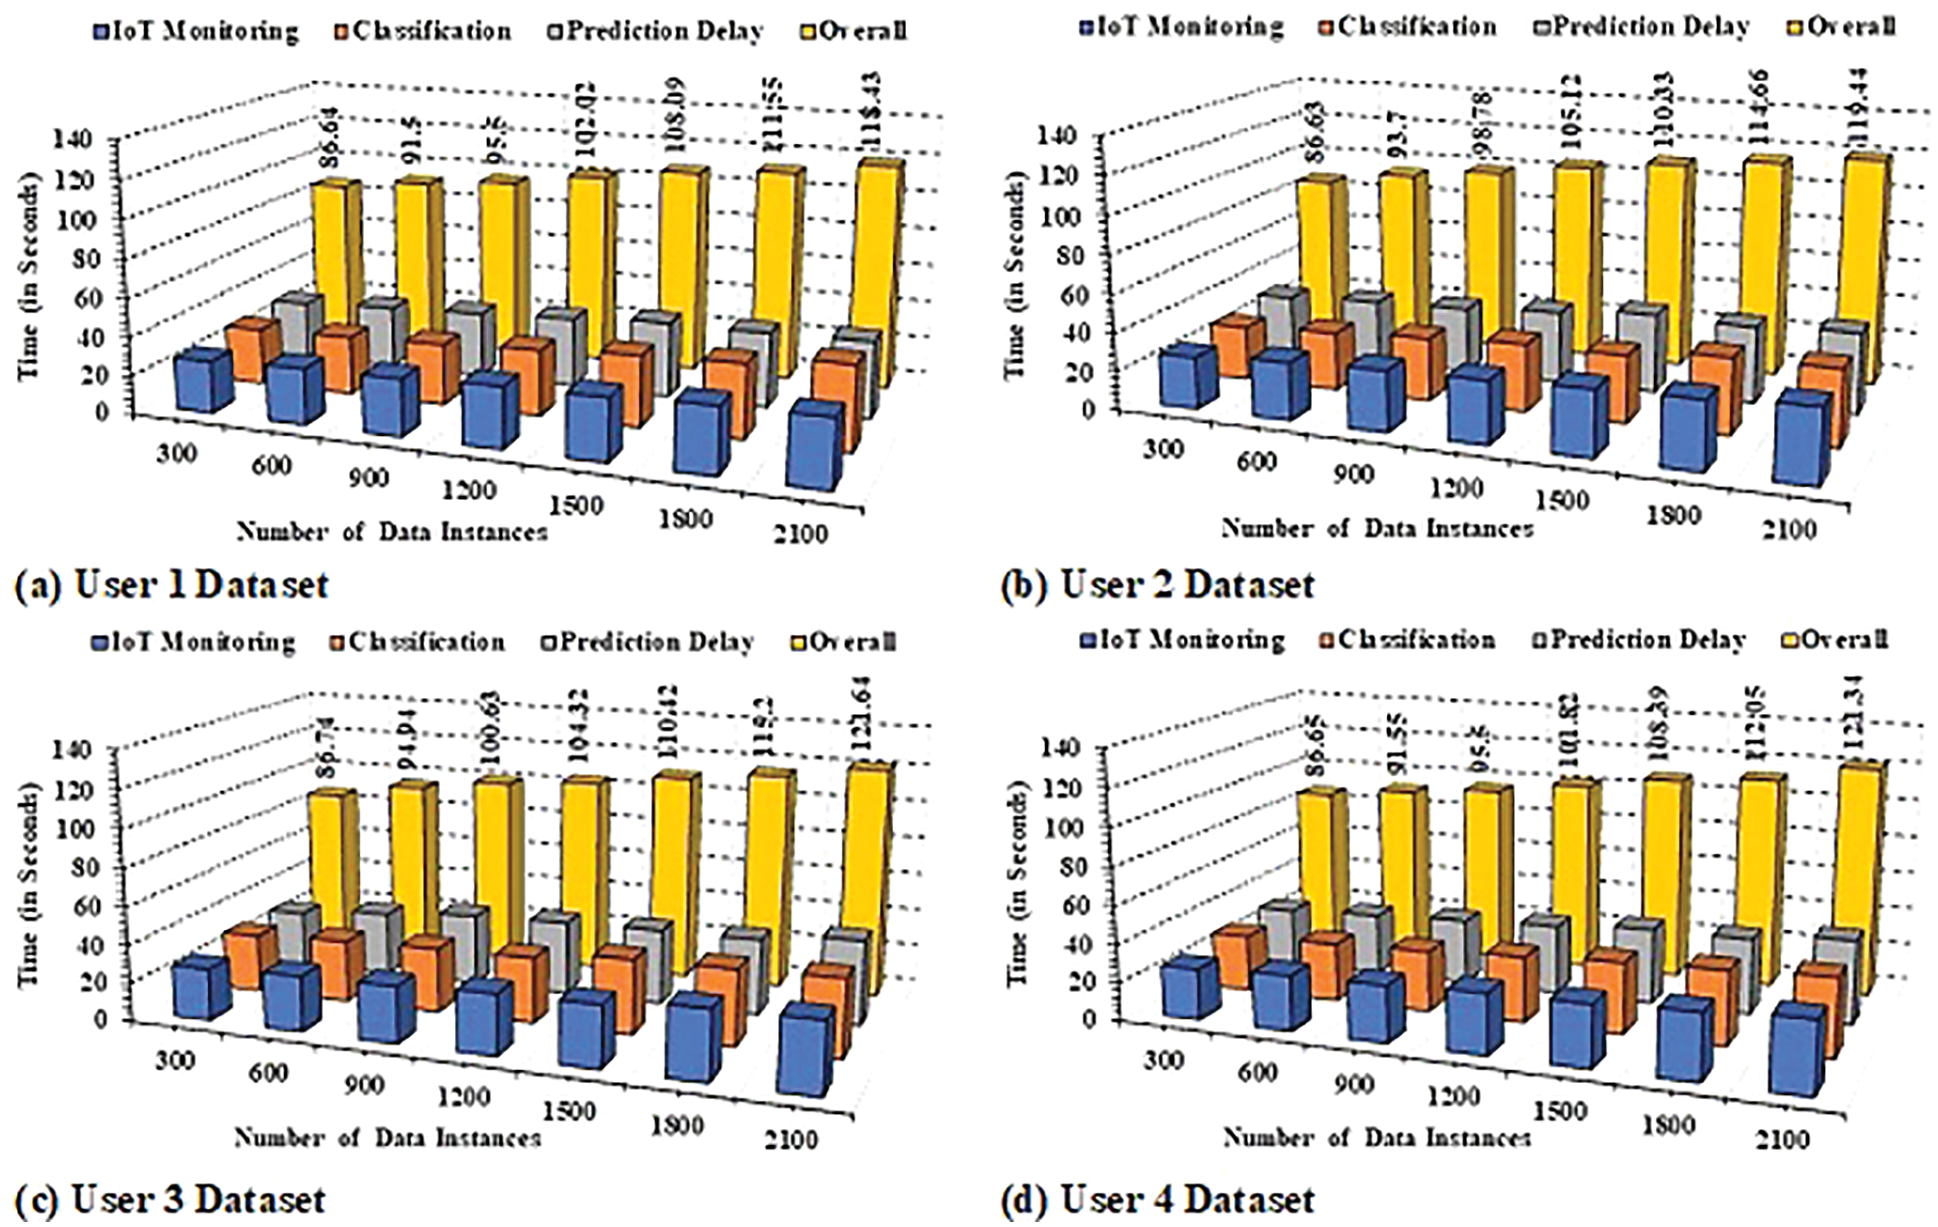
Figure 9: Temporal delay efficiency
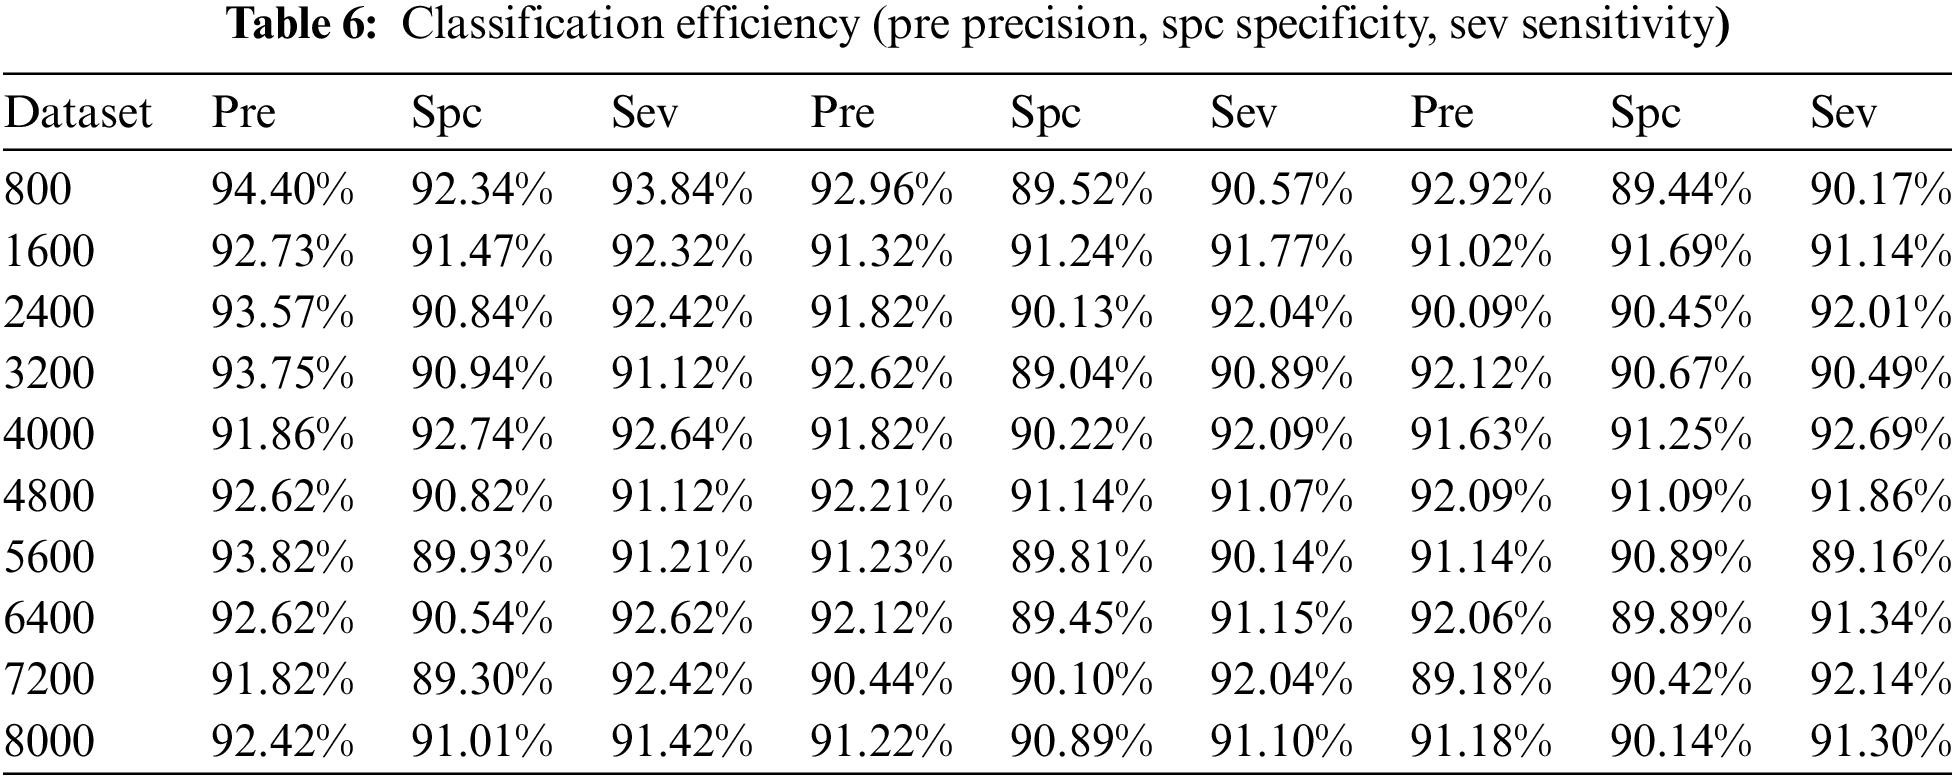
The assessment of 3 execution measures, specifically Precision (Pre), Specificity (Spc), and Sensitivity (Sev), figures the adequacy of the proposed strategy. As a default classifier, 2 cutting-edge grouping techniques have been presented including Decision Tree (DT) [40] and Support Vector Machine (SVM) [41]. Besides, for various datasets, the average of these outcomes are recorded, as found in Tab. 6. For classification purposes, Waikato Information Environment for Knowledge Analysis (WEKA) has been utilized. WEKA is an open-source toolbox unreservedly available for execution evaluation.
1. It should be noted that the proposed model is capable of recording an average accuracy of 94.56% for the data sets collected. In contrast, DT was able to achieve a precision value of 92.21%, while SVM reported a precision value of 91.76%. In the current situation, the proposed BNM model is much more effective than other classifiers.
2. The proposed model can register the highest value of 93.45% compared to DT (91.02%) and SVM (90.22%) for the specificity analysis. It indicates that the proposed approach is substantially better.
3. Another element of the realization of the proposed framework is sensitivity analysis. It should be noted that the proposed model achieves a high value of 94.14% in the current scenario, compared with 91.34% for DT and 90.95% for SVM. It is demonstrated that the proposed system is more effective and accurate based on the preliminary results from the dataset.
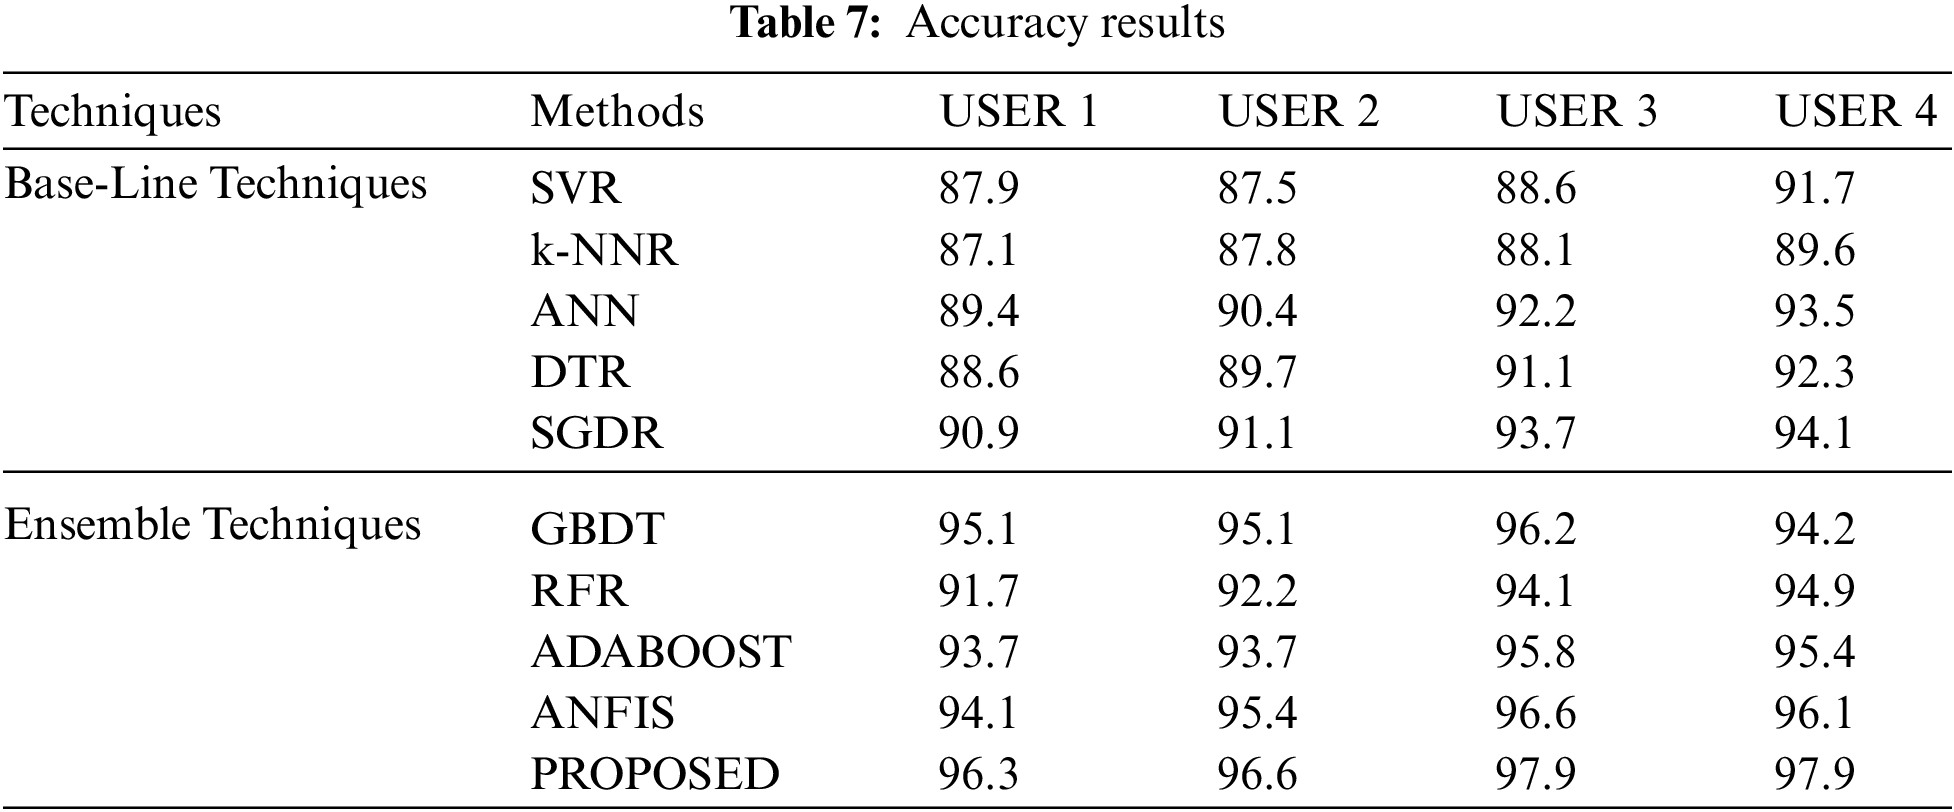
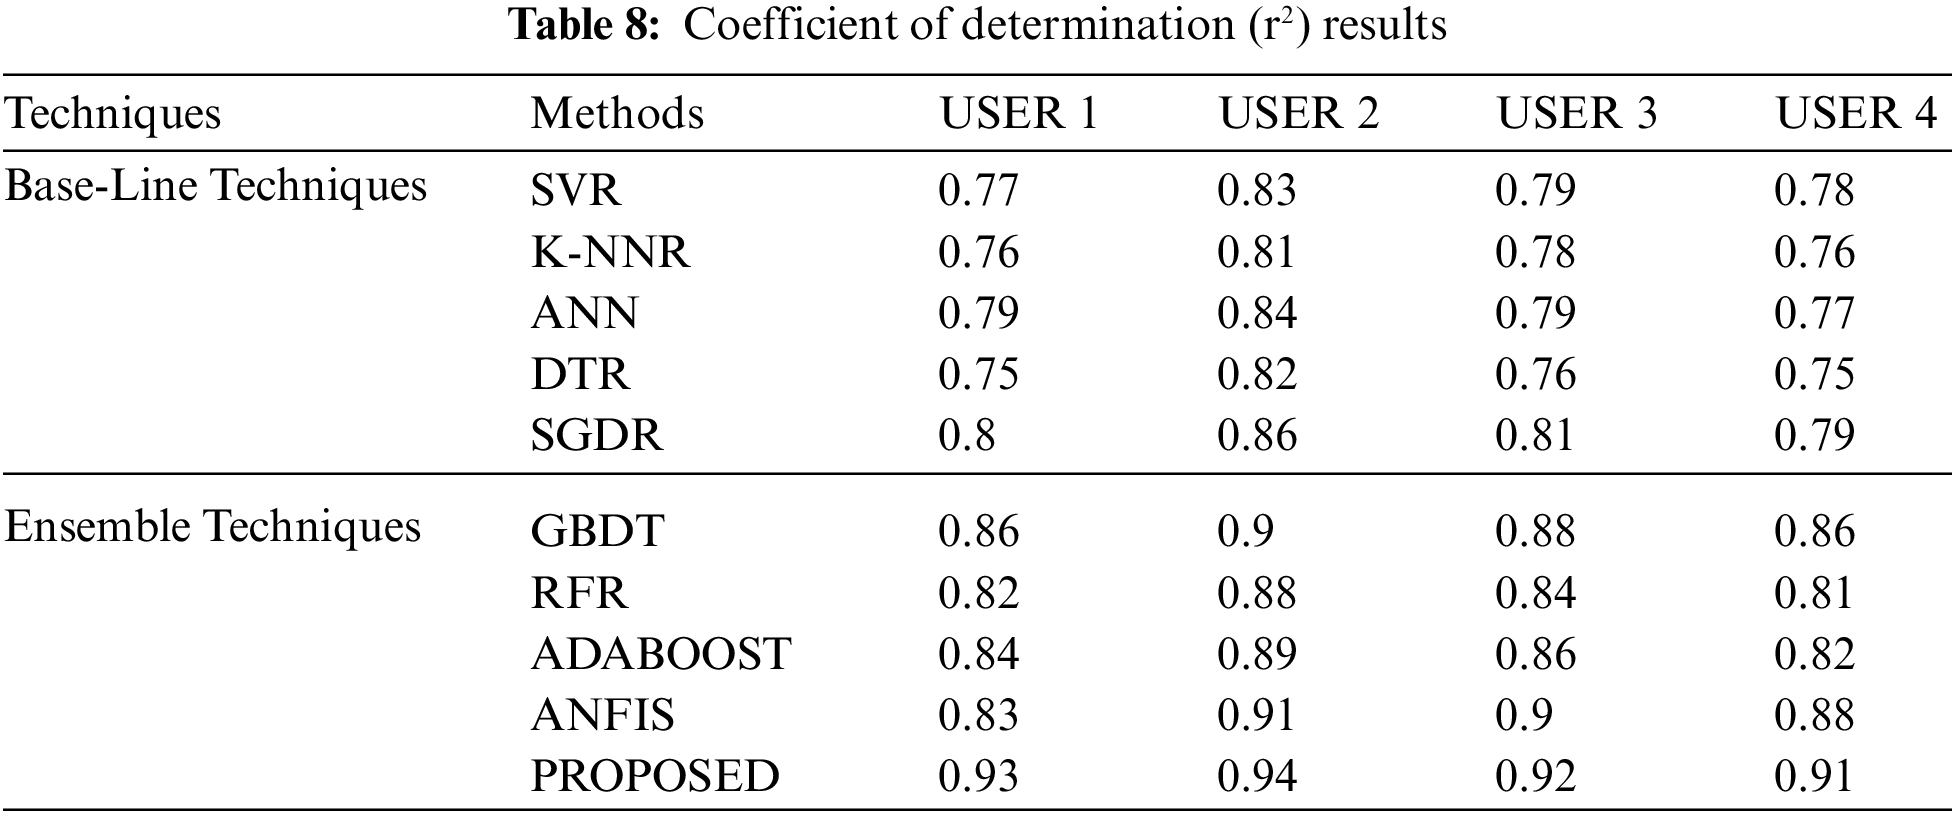
For prediction purposes, the prescient strategy is depicted by the Neural Designer Toolkit4. In the current examination, the quantity of information level units was set to 6 (number of DVI boundaries), while the number of shrouded levels was 3 each comprising of 9 neurons, lastly, the yield level contains 1 neuron for expectation. Tabs. 7 and 8 present the assessed outcomes for the assurance of prescient proficiency dependent on different informational collections. In particular, it suggests the connection between the coefficient of determination (r2) boundaries and the Root Mean Square Error (RMSE) values recorded on the datasets all through exploration. For a similarity assessment, cutting-edge forecast models have been presented. These forecast methods incorporate Stochastic Gradient Descent with Regression (SGDR) [42], Artificial Neural Network (ANN) [42], Decision-Tree Regression (DTR), K-Nearest Neighbor (K-NNR) [43], and Support Vector Regression (SVR) [44] due to the feasibility of implementation in the current domain. Also, different blend procedures, for example, Random Forest Regression (RFR) [45], Gradient Boosted Decision Trees (GBDT) [46], Adaptive Boosting (AdaBoost) [47], and ANFIS [48] have additionally been utilized for a similar investigation. As mentioned earlier, 16 users are confined to 4 groups as per age range as follows: Group 1 from less than 18 years, Group 2 from 18 to 32 years. Group 3 is from 32 to 50 years, and Group 4 range includes above 50 years. The detailed results are mentioned ahead.
Results
The accuracy of the predictive approach suggested is quantified in Tab. 6. The results show that, in the presented DVI forecast system, the proposed model achieved a higher accuracy of 97.3% compared to other baseline and ensemble methods with small variations in the Group 1 dataset. The proposed model also registered a value of 97.6% for the Group 2 dataset which was comparatively better than other approaches. Also, the proposed approach was able to achieve 98.9% and 97.9% for Group 3 and Group 4 datasets, respectively. Based on these results, the proposed predictive technique can be assumed to be extremely effective in the present scenario.
2. Another important measurable boundary known as the Coefficient of Determination (COD) (r2) appears in Tab. 7. In numerical terms,
where aggregate whole of squares
The estimations of Dxx, Dxz, Dzz are the qualities procured through testing and expectation, which are interjected over the x-y plane. It very well may be noticed that the proposed strategy was in a situation to outflank different strategies in the assurance of COD measures. All in all, for the User 1 dataset, the proposed strategy enlisted a COD estimation of 94%, which is a lot higher than other forecast draws near. Correspondingly, for User 2, User 3, and User 4, the COD an incentive for the proposed method was practically 95%, 93%, and 93% individually, which were a lot higher than the similar strategies. These outcomes recommend that the proposed gadget technique has improved effectiveness and is particularly Δt for the current DVI situation.
The readability results for the reliability examination are depicted in Fig. 10. Similar contrasts in unwavering quality with 3 cutting-edge expectation models, in particular k-Nearest Neighbor (k-NN), traditional Artificial Neural Network (cANN), and SVM, portray the normal exactness of the forecast model. The patterns in dependability conform to higher qualities for the introduced model comparative with other expectation strategies when the quantity of datasets for the test examination is raised. In particular, contrasted with the k-NN, cANN, and SVM expectation models, it is seen that the proposed model has a 95.86% higher quality score. For k-NN, cANN, and SVM, estimations of 91.25%, 93.45%, and 94.02%, were registered. The presented strategy is incredibly dependable over enormous datasets dependent on these outcomes, compared with other best-in-class forecast models.
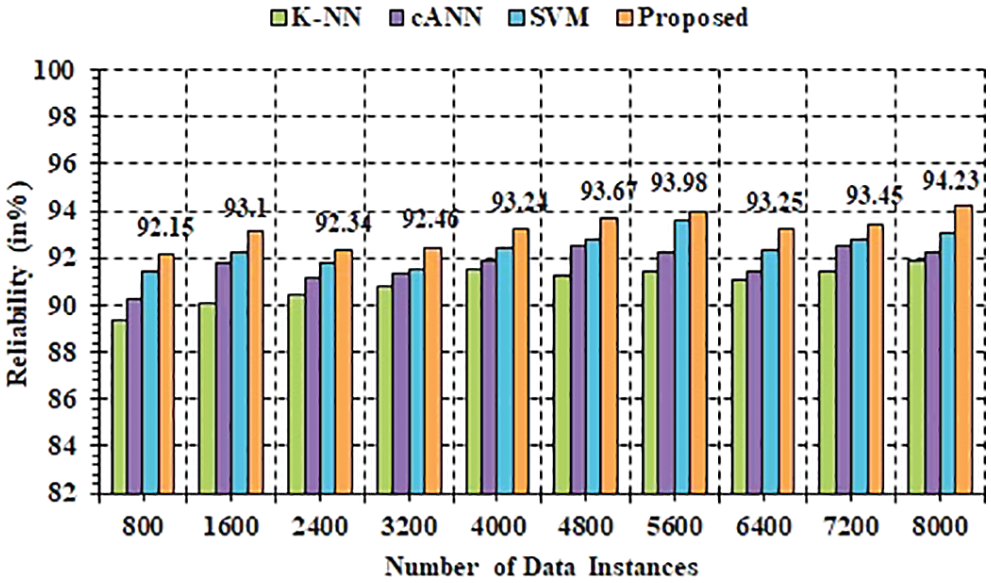
Figure 10: Reliability analysis
The dependability investigation is utilized over the life span period to evaluate the proposed system. As such, when the framework is sent over huge datasets for evaluation over a significant period, the soundness of the framework predicts full adjustment. As far as Mean Absolute Shift (MAS), the solidness of the framework is figured. The MAS esteem is inside the range (0, 1) where the 0 MAS esteem suggests the least security and the 1 MAS esteem infers the most extreme solidness. Fig. 11 shows the discoveries acquired concerning the proposed approach’s strength survey. The base worth was 0.51 in the MAS and the most noteworthy worth was 0.82, with a normal estimation of 0.70 more than 32,225 information instances. Given these outcomes, the proposed approach is very steady and appropriate for DVI disease assessment in the home-centric climate.
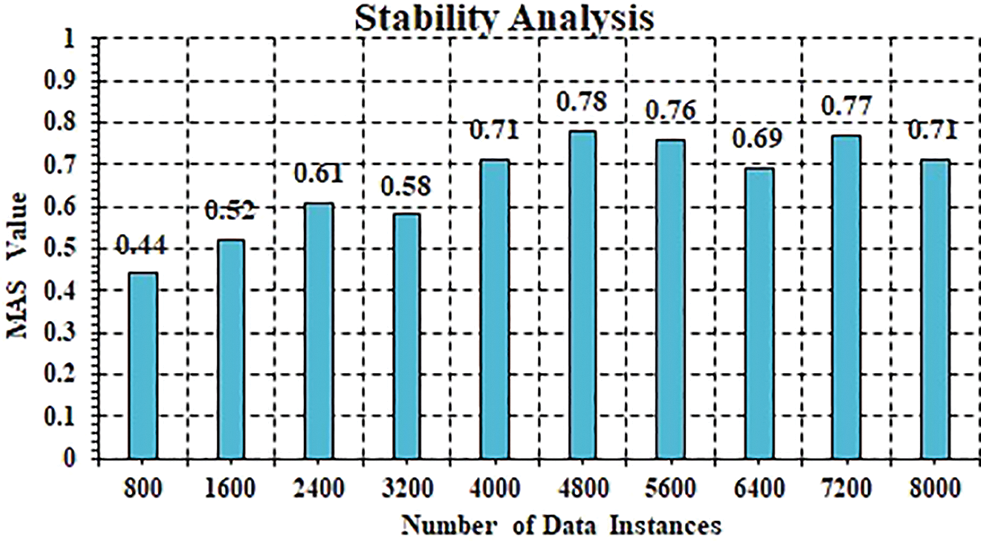
Figure 11: Overall system stability
The current paper provides a systematic system for early detection and prediction of Dengue Virus Infection (DVI) in the home. Specifically, the proposed framework consists of 4 levels, namely Dengue Information Acquisition (DIA) level, Dengue Information Classification (DIC) level, Dengue-Mining, and Extraction (DME) level, and Dengue-Prediction and Decision Modeling (DPDM) level. An effective prediction study based on the temporal aspects of the DVI variables is described in terms of the level of dengue fever (LoDF) and dengue fever measure (DFM). For this purpose, ANFIS-DE has been incorporated. Additionally, a SOM-based methodology was implemented to boost the visualization efficacy of the proposed model. Experimental simulations were conducted by a dataset of 16 individuals in the real world. In terms of time delay, classification efficiency, predictive quality, reliability, and stability analysis, the findings obtained at the implementation stage were compared with state-of-the-art techniques in which the proposed mechanism was able to outperform conventional systems. Henceforth, it is concluded that in monitoring and predicting DVI, the proposed methodology is effective and efficient.
Acknowledgement: The authors extend their appreciation to the Deputyship for Research and Innovation, Ministry of Education in Saudi Arabia for supporting this research work through the project number (IF-PSAU-2021/01/17795).
Funding Statement: The authors received no specific funding for this study.
Conflicts of Interest: The authors declare that they have no conflicts of interest to report regarding the present study.
1. J. Gubbi, R. Buyya, S. Marusic and M. Palaniswami, “Internet of things (IoTA vision, architectural elements, and future directions,” Future Generation Computer. Systems, vol. 29, no. 7, pp. 1645–1660, 2013. [Google Scholar]
2. M. Man, W. Aezwani Wan Abu Bakar, L. Chee Hwa, W. Nural Jawahir Wan Mohd Yusoff, M. Afenddi Mat Nor et al., “Dengue innovation: A sustainability approach for preventing and controlling of dengue diseases outbreaks via IoT technology,” IOP Conference. Series Material Science and Engineering, vol. 769, no. 1, pp. 1–10, 2020. [Google Scholar]
3. G. Yang, L. Xie, M. Mäntysalo, Zhou X., Pang Z. et al., “A Health-IoT platform based on the integration of intelligent packaging, unobtrusive bio-sensor, and intelligent medicine box,” IEEE Transactions of Industrial. Informatics, vol. 10, no. 4, pp. 2180–2191, 2014. [Google Scholar]
4. C. E. Koop, R. Mosher, L. Kun, J. Geiling, E. Grigg et al., “Future delivery of health care: Cybercare,” IEEE Engineering in Medicine and Biology Magazine, vol. 27, no. 6, pp. 29–38, 2008. [Google Scholar]
5. B. Xu, L. Da Xu, H. Cai, C. Xie, J. Hu et al., “Ubiquitous data accessing method in IoT-based information system for emergency medical services,” IEEE Transactions of Industrial Informatics, vol. 10, no. 2, pp. 1578–1586, 2014. [Google Scholar]
6. Y. Dong and Y. D. Yao, “IoT platform for covid-19 prevention and control: A survey,” IEEE Access, vol. 9, pp. 49929–49941, 2021. [Google Scholar]
7. Z. Mustaffa, M. H. Sulaiman, M. F. M. Mohsin, Y. Yusof, F. Ernawan et al., “An application of barnacle mating optimizer in infectious disease prediction: A dengue outbreak cases,” Iraqi Journal of Science, vol. 61, no. 8, pp. 2132–2141, 2020. [Google Scholar]
8. A. M. Rahmani, N. K. Thanigaivelan, T. N. Gia, J. Granados, B. Negash et al., “Smart e-health gateway: Bringing intelligence to internet-of-things based ubiquitous healthcare systems,” in 2015 12th Annu. IEEE Consumer Communication and Networking Conf. CCNC, Las Vegas, NV, USA, pp. 826–834, 2015. [Google Scholar]
9. H. Zhu, P. Podesva, X. Liu, H. Zhang, T. Teply et al., “IoT PCR for pandemic disease detection and its spread monitoring,” Sensors Actuators B Chem, vol. 303, pp. 127098, 2020. [Google Scholar]
10. R. V. Gibbons and D. W. Vaughn, “Dengue: An escalating problem,” British Medical Journal, vol. 324, no. 7353, pp. 1563–1566, 2002. [Google Scholar]
11. J. Whitehorn and J. Farrar, “Dengue,” British Medical Bulletin, vol. 95, no. 1, pp. 161–173, 2010. [Google Scholar]
12. X. Zhang, X. Sun, X. Sun, W. Sun and S. K. Jha, “Robust reversible audiowatermarking scheme for telemedicine and privacy protection,” Computers, Materials and Continua, vol. 71, no. 2, pp. 3035–3050, 2022. [Google Scholar]
13. X. Zhang, W. Zhang, W. Sun, X. Sun and S. K. Jha, “A robust 3-D medical watermarking based on wavelet transform for data protection,” Computer Systems Science and Engineering, vol. 41, no. 3, pp. 1043–1056, 2022. [Google Scholar]
14. S. Lai, Z. Huang, H. Zhou, K. L. Anders, T. A. Perkins et al., “The changing epidemiology of dengue in China, 1990–2014: A descriptive analysis of 25 years of nationwide surveillance data,” BMC Medicine, vol. 13, no. 1, pp. 1–12, 2015. [Google Scholar]
15. C. P. Simmons, J. J. Farrar, N. Van Vinh Chau and B. Wills, “Current concepts: Dengue,” New. England Journal of Medicine, vol. 366, no. 15, pp. 1423–1432, 2012. [Google Scholar]
16. P. Guo, T. Liu, Q. Zhang, L. Wang, J. Xiao et al., “Developing a dengue forecast model using machine learning: A case study in China,” PLoS Neglected Tropical Diseases, vol. 11, no. 10, pp. e0005973, 2017. [Google Scholar]
17. M. R. Capeding, N. H. Tran, S. R. S. Hadinegoro, H. I. H. M. Ismail, T. Chotpitayasunondh et al., “Clinical efficacy and safety of a novel tetravalent dengue vaccine in healthy children in Asia: A phase 3, randomised, observer-masked, placebo-controlled trial,” Lancet, vol. 384, no. 9951, pp. 1358–1365, 2014. [Google Scholar]
18. N. L. Achee, F. Gould, T. A. Perkins, R. C. Reiner Jr, A. C. Morrison et al., “A critical assessment of vector control for dengue prevention,” PLoS Neglected Tropical Diseases, vol. 9, no. 5, pp. e0003655, 2015. [Google Scholar]
19. S. B. Halstead, “Dengue vaccine development: A 75% solution?,” Lancet, (London, England), vol. 380, no. 9853, pp. 1535–1536, 2012. [Google Scholar]
20. H. M. Aburas, B. G. Cetiner and M. Sari, “Dengue confirmed-cases prediction: A neural network model,” Expert Systems and Applications, vol. 37, no. 6, pp. 4256–4260, 2010. [Google Scholar]
21. S. Sareen, S. K. Sood and S. K. Gupta, “Secure internet of things-based cloud framework to control zika virus outbreak,” International Journal of Technological Assessment in Health Care, vol. 33, no. 1, pp. 11–18, 2017. [Google Scholar]
22. S. K. Sood and I. Mahajan, “A Fog-based healthcare framework for chikungunya,” IEEE Internet of Things Journal, vol. 5, no. 2, pp. 794–801, 2018. [Google Scholar]
23. S. K. Sood and I. Mahajan, “Fog-cloud based cyber-physical system for distinguishing, detecting and preventing mosquito borne diseases,” Future Generation Computing System, vol. 88, pp. 764–775, 2018. [Google Scholar]
24. A. Pravin, T. P. Jacob and G. Nagarajan, “An intelligent and secure healthcare framework for the prediction and prevention of dengue virus outbreak using fog computing,” Health Technology. (Berl), vol. 10, no. 1, pp. 303–311, 2020. [Google Scholar]
25. I. Azimi, J. Takalo-Mattila, A. Anzanpour, A. M. Rahmani, J. P. Soininen et al., “Empowering healthcare IoT systems with hierarchical edge-based deep learning figure 1: A three-tier IoT-based health monitoring system,” in Proc. IEEE/ACM Int. Conf. on Connected Health: Applications, Systems and Engineering Technologies, Washington DC, USA, vol. 18, pp. 63–68, 2018. [Google Scholar]
26. A. M. Rahmani, T. N. Gia, B. Negash, A. Anzanpour, I. Azimi et al., “Exploiting smart e-health gateways at the edge of healthcare internet-of-things: A fog computing approach,” Future Generation Computing System, vol. 78, pp. 641–658, 2018. [Google Scholar]
27. A. Manocha and R. Singh, “A novel edge analytics assisted motor movement recognition framework using multi-stage convo-GRU model.” Mobile Networks and Applications, vol. 2019, pp. 1–20, 2019. [Google Scholar]
28. A. Nayyar, V. Puri and N. G. Nguyen, “Biosenhealth 1.0: A novel internet of medical things (IoMT)-based patient health monitoring system,” Lecture Notes Networks and Systems, vol. 55, pp. 155–164, 2019. [Google Scholar]
29. S. Tuli, N. Basumatary, S. S. Gill, M. Kahani, R. C. Arya et al., “HealthFog: An ensemble deep learning based smart healthcare system for automatic diagnosis of heart diseases in integrated IoT and fog computing environments,” Future Generation Computer Systems, vol. 104, pp. 187–200, 2020. [Google Scholar]
30. B. Negash, T. N. Gia, A. Anzanpour, I. Azimi, M. Jiang et al., “Leveraging fog computing for healthcare IoT,” Fog Computing Internet of Things Intelligence at Edge, USA: Springer, Cham, 2018. [Online] Available: https://link.springer.com/book/10.1007/978-3-319-57639-8. pp. 145–169, 2018. [Google Scholar]
31. O. H. Alhazmi and K. S. Aloufi, “Fog-based internet of things: A security scheme,” in 2nd Int. Conf. Computer Applications and Information Security ICCAIS, Riyadh, Saudi Arabia, pp. 1–6, 2019. [Google Scholar]
32. A. V. Dastjerdi and R. Buyya, “Fog computing: Helping the internet of things realize its potential,” Computer, vol. 49, no. 8, pp. 112–116, 2016. [Google Scholar]
33. B. Tang, Z. Chen, G. Hefferman, S. Pei, T. Wei et al., “Incorporating intelligence in fog computing for big data analysis in smart cities,” IEEE Transactions on Industrial Informatics, vol. 13, no. 5, pp. 2140–2150, 2017. [Google Scholar]
34. H. F. Atlam, R. J. Walters and G. B. Wills, “Fog computing and the internet of things: A review,” Big Data and Cognitive Computing, vol. 2, pp. 10, 2018. [Google Scholar]
35. M. Bhatia and S. K. Sood, “Temporal informative analysis in smart-ICU monitoring: M-health care perspective,” Journal of Medical Systems, vol. 40, no. 8, pp. 1–15, 2016. [Google Scholar]
36. D. Nauck, F. Klawonn and R. Kruse, “Foundations of Neuro-Fuzzy Systems,” New York, USA: John Wiley and Sons, Inc. pp. 305, 1997. [Google Scholar]
37. J. S. R. Jang, “ANFIS: Adaptive-network-based fuzzy inference system,” IEEE Transactions on System Man Cybernetics, vol. 23, no. 3, pp. 665–685, 1993. [Google Scholar]
38. N. Nedjah and L. de Macedo Mourelle, “Fuzzy Systems Engineering Theory and Practice,” 1st ed., vol. 181 Springer, Science and Business Media. 2005. [Google Scholar]
39. H. Gupta, A. Vahid Dastjerdi, S. K. Ghosh and R. Buyya, “Ifogsim: A toolkit for modeling and simulation of resource management techniques in the internet of things, edge and fog computing environments,” Software Practice and Experience, vol. 47, no. 9, pp. 1275–1296, 2017. [Google Scholar]
40. S. Alex, K. J. Dhanaraj and P. P. Deepthi, “Private and energy-efficient decision tree-based disease detection for resource-constrained medical users in mobile healthcare network,” IEEE Access, vol. 10, pp. 17098–17112, 2022. [Google Scholar]
41. A. V. Anandhalekshmi, V. S. Rao and G. R. Kanagachidambaresan, “Hybrid approach of baum-welch algorithm and SVM for sensor fault diagnosis in healthcare monitoring system,” Journal of Intelligent and Fuzzy Systems, vol. 42, no. 4, pp. 2979–2988, 2022. [Google Scholar]
42. I. Izonin and R. Tkachenko, “An approach towards the response surface linearization via ANN-based cascade scheme for regression modeling in healthcare,” Procedia Computer Science, vol. 198, pp. 724–729, 2022. [Google Scholar]
43. S. Sangeetha, G. Sudha Sadasivam and A. Srikanth, “Differentially private model release for healthcare applications,” International Journal of Computers and Applications, vol. 44, no. 4, pp. 1–6, 2022. [Google Scholar]
44. G. Buchanna, P. Premchand and A. Govardhan, “Classification of epileptic and non-epileptic electroencephalogram (EEG) signals using fractal analysis and support vector regression,” Emerging Science Journal, vol. 6, no. 1, pp. 138–150, 2022. [Google Scholar]
45. A. Avdeef, M. Kansy and A. Avdeef alex, “Predicting solubility of newly-approved drugs (2016–2020) with a simple ABSOLV and GSE(Flexible-acceptor) consensus model outperforming random forest regression,” Journal of Solution Chemistry, vol. 54, no. 4, pp. 1–36, 2022. [Google Scholar]
46. A. Garg, V. V. Venkataramani, A. Karthikeyan and U. D. Priyakumar, “Modern AI/ML methods for healthcare: Opportunities and challenges,” in Int. Conf. on Distributed Computing and Internet Technology, Bhubaneswar, India, pp. 3–25, 2022. [Google Scholar]
47. S. Saroja, S. Haseena and B. P. M. Blessa, “Data-driven decision making in IoT healthcare systems COVID-19: A case study,” Smart Healthcare Systems Design: Security and Privacy Aspects, Beverly, USA: Wiley Online Library [Online]. Available: https://onlinelibrary.wiley.com/doi/book/10.1002/9781119792253. pp. 57–70, 2022. [Google Scholar]
48. Z. Rahimi Rise and M. M. Ershadi, “Socioeconomic analysis of infectious diseases based on different scenarios using uncertain SEIAR system dynamics with effective subsystems and ANFIS,” The Journal of Economic and Administrative Sciences, vol. ahead-of-print, no. ahead-of-print, 2022. [Google Scholar]
 | This work is licensed under a Creative Commons Attribution 4.0 International License, which permits unrestricted use, distribution, and reproduction in any medium, provided the original work is properly cited. |