DOI:10.32604/cmc.2022.027896
| Computers, Materials & Continua DOI:10.32604/cmc.2022.027896 | |
| Article |
Deep Learning Enabled Computer Aided Diagnosis Model for Lung Cancer using Biomedical CT Images
1Department of Information Systems, College of Science & Art at Mahayil, King Khalid University, Saudi Arabia
2Department of Information Systems, College of Computer and Information Sciences, Princess Nourah Bint Abdulrahman University, Riyadh, 11671, Saudi Arabia
3Department of Computer Sciences, College of Computing and Information System, Umm Al-Qura University, Saudi Arabia
4Department of Computer and Self Development, Preparatory Year Deanship, Prince Sattam bin Abdulaziz University, AlKharj, Saudi Arabia
*Corresponding Author: Anwer Mustafa Hilal. Email: a.hilal@psau.edu.sa
Received: 27 January 2022; Accepted: 08 March 2022
Abstract: Early detection of lung cancer can help for improving the survival rate of the patients. Biomedical imaging tools such as computed tomography (CT) image was utilized to the proper identification and positioning of lung cancer. The recently developed deep learning (DL) models can be employed for the effectual identification and classification of diseases. This article introduces novel deep learning enabled CAD technique for lung cancer using biomedical CT image, named DLCADLC-BCT technique. The proposed DLCADLC-BCT technique intends for detecting and classifying lung cancer using CT images. The proposed DLCADLC-BCT technique initially uses gray level co-occurrence matrix (GLCM) model for feature extraction. Also, long short term memory (LSTM) model was applied for classifying the existence of lung cancer in the CT images. Moreover, moth swarm optimization (MSO) algorithm is employed to optimally choose the hyperparameters of the LSTM model such as learning rate, batch size, and epoch count. For demonstrating the improved classifier results of the DLCADLC-BCT approach, a set of simulations were executed on benchmark dataset and the outcomes exhibited the supremacy of the DLCADLC-BCT technique over the recent approaches.
Keywords: Biomedical images; lung cancer; deep learning; machine learning; metaheuristics; hyperparameter tuning
Lung cancer is the primary cause of mortality around the world. Even though targeted therapeutics and different chemotherapy regimens were adopted for treating cancer, still it is challenging to thoroughly cure advanced lung cancer [1]. The earlier diagnoses of lung cancer are identified as the significant approach for increasing the possibility of survival. Hence, there is need for developing accurate and efficient lung nodule diagnoses for the detection of possible malignant cancer [2]. The medical doctor detects lung cancer through examining the pulmonary nodules in CT scans, however, this process is challenging for physicians, and factors including fatigue, inattention and lack of knowledge might impact the consequences [3]. Computer-aided diagnosis (CAD) technique was designed for relieving the burden on physicians and enhance the efficiency and accuracy of diagnoses. Even though authors earlier on considered the concept of applying computers to perform automated diagnoses, a lack of respective technologies and theories intended that the expansion of CAD technique was still in early stages, once the idea advanced from automated computer diagnoses to CAD [4,5]. Now, computer technologies and corresponding theories have been rapidly emerging. Each factor collectively supports the growth of CAD technology.
Artificial intelligence (AI) is the competency for machine to stimulate the behavior of human that is very proficient to handle wide-ranging number of information. The machine learning (ML) method is the application of AI technology that enables computer systems to automatically train from knowledge without explicitly being programmed [6]. Basically, ML methods learn from the training of utilizing algorithms to parse data, later make a decision or prediction regarding the upcoming situations of novel datasets [7]. In cancer, ML method has been previously utilized for exploring the prognostic and survival prediction method in bladder cancer, pancreatic cancer, breast cancer, and advanced nasopharyngeal carcinoma [8]. In few instances, the efficiency had accomplished similar to human experts [9]. ML methods have appeared as methods of developing the approach through learning from understanding and improving its efficiency. This model aims at discovering efficient parameters and the relations among themselves. In the last decade, the domain of AI has stirred from theoretic study to real time application [10]. The application of AI in various fields is currently related to greater expectation and simultaneously exists a greater vacancy in cancer study particularly lung lesions.
This article introduces novel deep learning enabled CAD technique to lung cancer using biomedical CT image, named DLCADLC-BCT technique. The proposed DLCADLC-BCT technique intends for detecting and classifying lung cancer utilizing CT image. The proposed DLCADLC-BCT technique initially uses gray level co-occurrence matrix (GLCM) model for feature extraction. Also, long short term memory (LSTM) model was executed for classifying the existence of lung cancer in the CT images. Moreover, moth swarm optimization (MSO) algorithm is employed to optimally choose the hyperparameters of the LSTM model such as learning rate, batch size, and epoch count. For demonstrating the improved classifier results of the DLCADLC-BCT approach, a set of simulations were carried out on benchmark dataset.
In [11], lung patient CT scans are utilized for detecting and classifying the lung nodules and to distinguish the malignancy level. The CT scans are classified by utilizing U-Net framework. The study presents three-dimensional multi-path VGG-like network that is estimated on three dimensional cubes. Prediction from U-Net and three-dimensional multi-path VGG-like networks are integrated for concluding outcomes. In [12], the 121-layer convolution neural networks called DenseNet-121 and the transfer learning system was examined as a method of categorizing lung lesion with chest x-ray image. The algorithm has been trained on lung nodule datasets beforehand training on the lung cancer datasets for alleviating the issue of utilizing a smaller data set.
Tian et al. [13] focus on achieving high detection and classification performance of benign and malignant glands on the basis of metaheuristics and DL method. In our work, firstly, the CT scans of the lung are preprocessed and later pattern segmentation region can be accomplished by an enhanced version of fuzzy possibilistic c-ordered mean based novel version of meta-heuristic, named Converged Search and Rescue (CSAR) model. Next, Enhanced Capsule Networks (ECN) are utilized for concluding diagnoses.
Sun et al. [14] focus on analyzing the capacity of automatically extracting produced features through deep structured algorithm in lung nodule CT scan diagnoses. The Three multi-channel ROI based deep structured algorithm has been implemented and designed: deep belief network (DBN), stacked denoising autoencoder (SDAE), and convolution neural network (CNN). In [15], explored an Extreme Learning Machine (ELM) and analysis model based Deep Transfer Convolution Neural Network (DTCNN), that integrates the synergy of 2 approaches to manage benign–malignant nodule classification.
In this study, a novel DLCADLC-BCT approach was established for detecting and classifying of lung cancer using CT images. The presented DLCADLC-BCT technique employed GLCM model for deriving feature vectors. Moreover, LSTM model is applied for classifying the existence of lung cancer from the CT images. Furthermore, MSO technique was employed to optimally choose the hyperparameters of the LSTM model such as learning rate, batch size, and epoch count.
3.1 Feature Extraction: GLCM Model
Primarily, the GLCM model [16] is used to derive a useful set of features from the test CT images. A GLCM always signifies the matrix where the count of rows and columns were corresponding to the amount of gray levels, G. The matrix component
• Contrast
• Correlation
• Entropy
• Energy
Energy
During the GLCM, the Angular Second Moment is also named as Uniformity or Energy refers the sum entire of squares of the entry. It is called ‘uniformity’. The value of energy to a set image has considered that one. The formula to evaluate the energy was provided as:
where,
Entropy
During the area of image, the entropy offers an assisting influence to signify the texture image and for evaluating the distribution alteration. The demonstrating parameter effectually estimates the condition of images. If the image doesn't perform that textually same, the amount of GLCM components include negligible value, exposing the detail that entropy was extremely large. The entropy was measured as per the subsequent formula.
Contrast
It is termed as CON in small procedure. The name of Contrast is ‘Sum of Square Variance’. It accepts the computation of intensity contrasts connecting pixel and their neighbor on every image. A continuous image contrast value has 0. The weight improved proportionally
While (i − j) enhances the contrast endures for improvement proportionally. If i and j are equivalent for instance
Correlation
It permissions the computation of correlation of the pixels and their neighbor on the entire image implies it finds out linear dependences of gray levels on individuals of neighboring pixel. During the cause of constant image, their value has
3.2 Image Classification: LSTM Model
The derived features are passed into the LSTM model [17] for the detection and classification of lung cancer. Usually, the RNN network studies the input hidden sequential design by concatenating the preceding data with existing data in combination of spatial and temporal dimensional and forecasting the future order. While RNN removes the hidden time-series pattern from consecutive data (for instance, video/audio, sensor data), it can be ineffective for remembering or holding longer data to longer periods and generally failed to manage the issue containing long-term sequence. Such a kind of issue has signified as gradient exploding/vanishing gradients that are overcoming with special type of RNNs is called as LSTM containing the abilities for remembering data to longer time. The internal structure of LSTM contains different gates (comprises input, forget, and output gate), whereas all gates process the input in the preceding gate and forwarded it the next gate so monitoring the data flow nearby the last output. Fig. 1 illustrates the structure of LSTM.
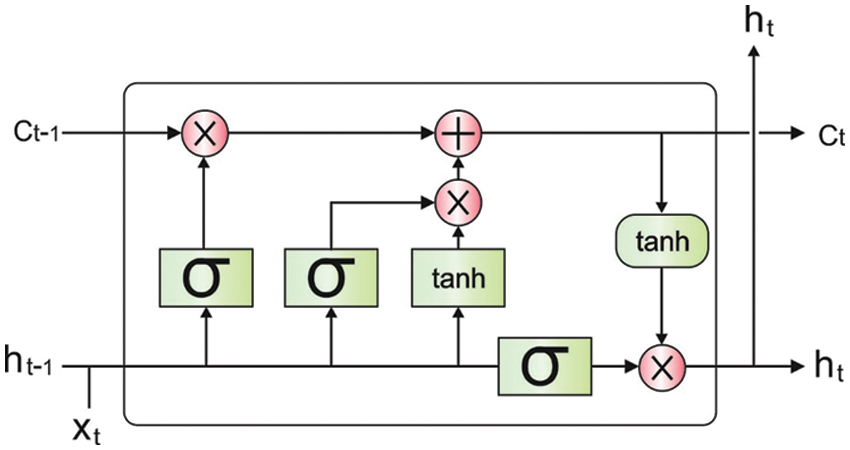
Figure 1: LSTM structure
Every gate is generally by sigmoid or tanh activation function, i.e., an input gate
3.3 Hyperparameter Tuning: MSO Algorithm
For effectually modifying the hyperparameter values of the LSTM model, the MSO algorithm can be employed to it. MSO is a type of bug, that usually belongs to the Lepidoptera family [18]. Generally, 160,000 moth classes were found which exit mainly at nighttime. In comparison to other moth features, the Levy flight (LF) and phototaxis were considered as important feature that is mentioned in the following. Consequently, weight of NN is given as input. This technique recognizes the optimization weight by implementing the exploration process. Fig. 2 depicts the steps involved in MSO technique.
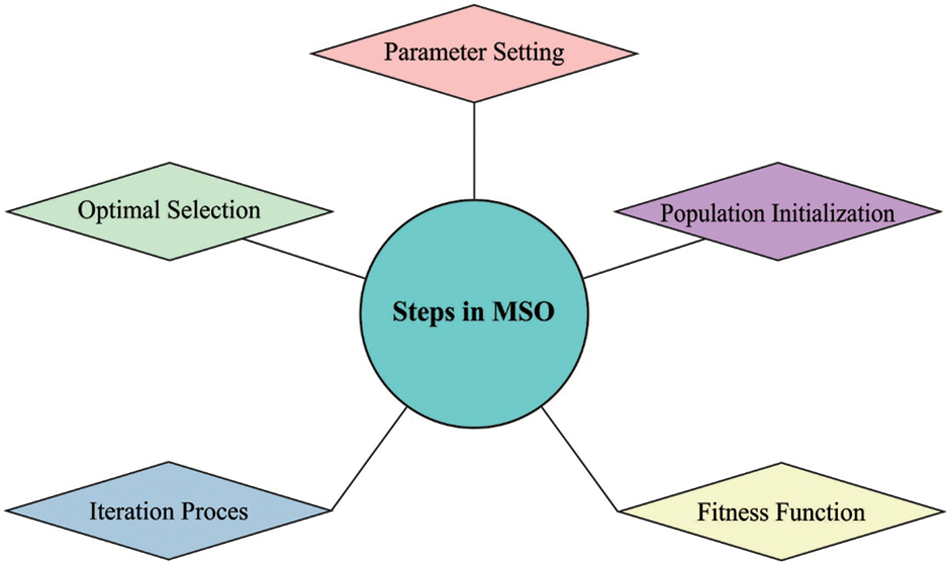
Figure 2: Steps involved in MSO
Phototaxis
The process behindhand moth fly is that it encircles the light is called phototaxis. But, a precise algorithm of phototaxis couldn't be discovered, which has foremost hypothesis to define the phototaxis method. Amongst other algorithms, it is critical hypotheses in celestial navigation that are conducted in transverse direction when flying. For saving a feasible angle for celestial light namely moon, moth travels directly. At the same time, the angle that exists from source light and moth can be focused on, however, it is incapable of seeking the transformation because the celestial object is recognized as outlying distance. It moves to the source light since moth will adapt the flight direction to the best location. Consequently, it permits airborne moths to fall downward. It forms a spiral route for travelling near light sources.
Levy flights
Heavy-tailed, non-Gaussian statistics are identified as common models in distinct functions of enormous animals and insects. The LF is a type of arbitrary progression, hence in natural surroundings, we considered as the major flight model. Other moth flies, the Drosophila shows the LF, however, the flight is estimated as a power law supply comprising the feature exponent nearer to 3/2. Generally, the Levy distribution is showing in the kind of power-law as follows,
Whereas,
The moth individual contains the distance as adjacent the optimum one would fly in the LF process almost the suitable one. If not, it would inform the location by using the LF, however, the moth is informed by using subsequent formula:
Whereas,
Here,
The s found maximum when compared to 0.
Fly straight
The existing moth is detached from light source flutter directly to the light. This representation of j moth can be expressed by using Eq. (16):
Whereas
If not, the moth would fly further than the source light to termination location. It can be expressed by the following equation:
For integrity, the location of moth j is informed by implementing the Eqs. (24) & (25), by half percentage probability. The optimal, actual, and updated location of moth can be denoted by
In this section, a detailed experimental result analysis of the DLCADLC-BCT model is carried out under several dimensions using benchmark lung image database (available at http://www.via.cornell.edu/lungdb.html). The results are inspected under training and testing processes.
Fig. 3 demonstrates the confusion matrix generated by the DLCADLC-BCT method on the training dataset. The figure reported that the DLCADLC-BCT model has categorized 24 images into Normal class, 19 images into malignant class, and 20 images into benign class.
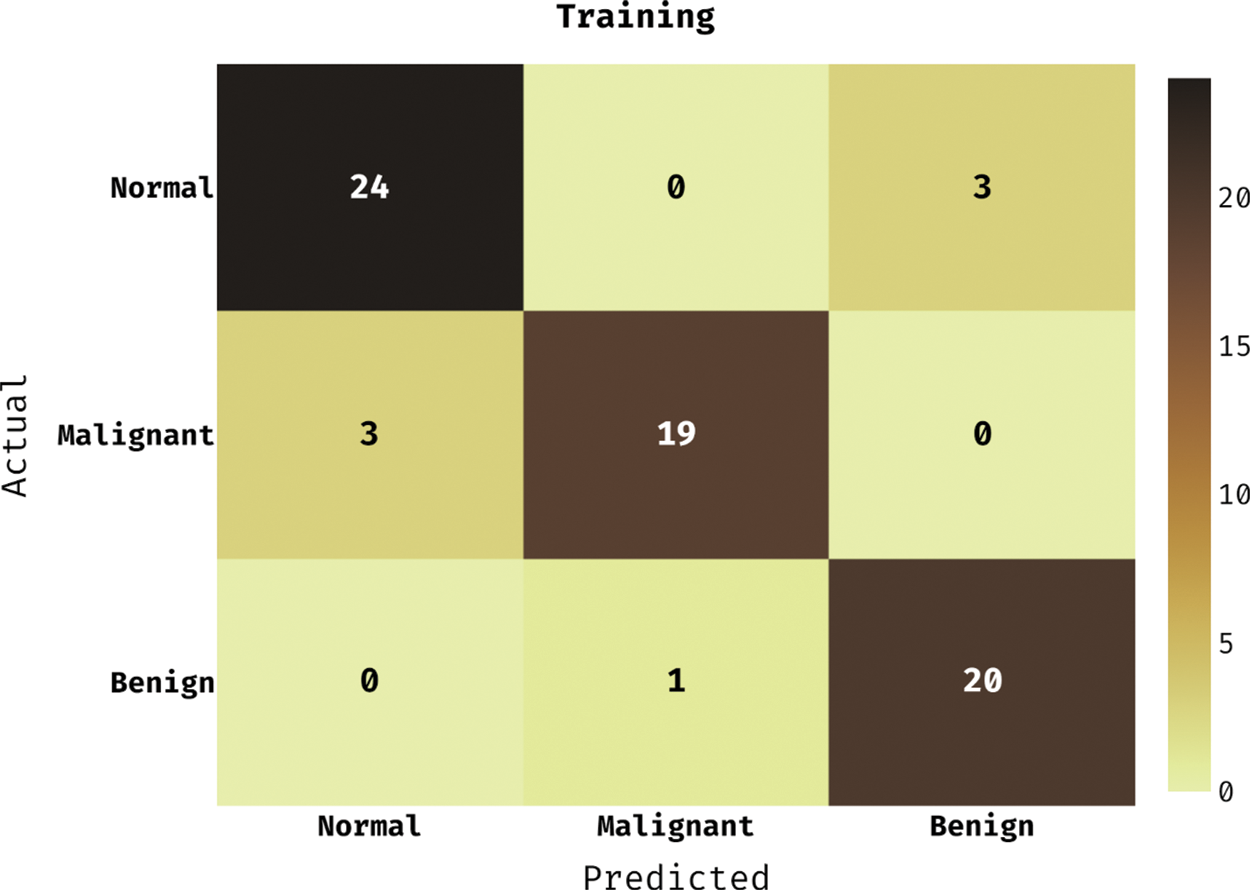
Figure 3: Confusion matrix of DLCADLC-BCT technique under training dataset
Fig. 4 reveals the confusion matrix produced by the DLCADLC-BCT model on the testing dataset. The figure described that the DLCADLC-BCT model has classified 7 images into Normal class, 9 images into malignant class, and 10 images into benign class.
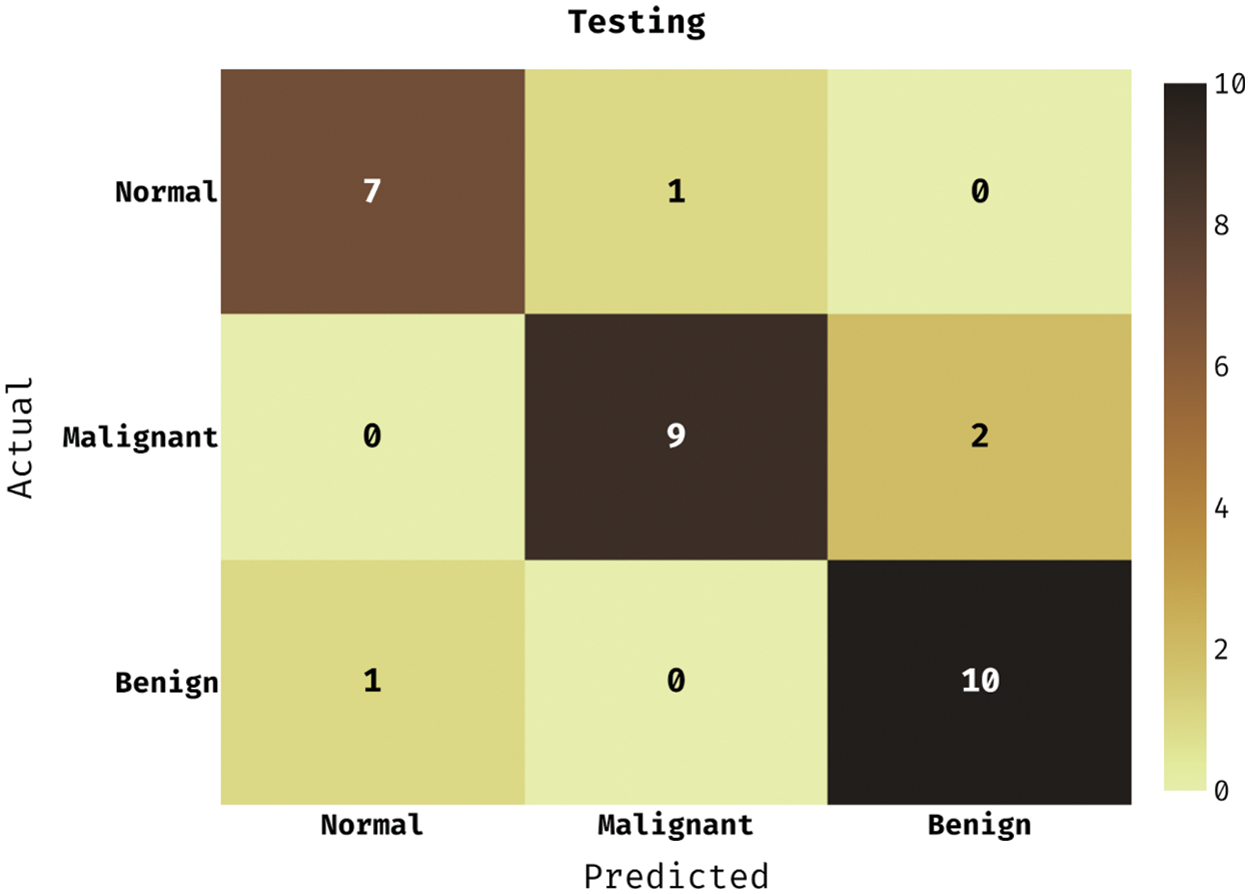
Figure 4: Confusion matrix of DLCADLC-BCT technique under testing dataset
Tab. 1 depicts the overall classification results of the DLCADLC-BCT technique under ten distinct runs. Fig. 5 inspects the comparative
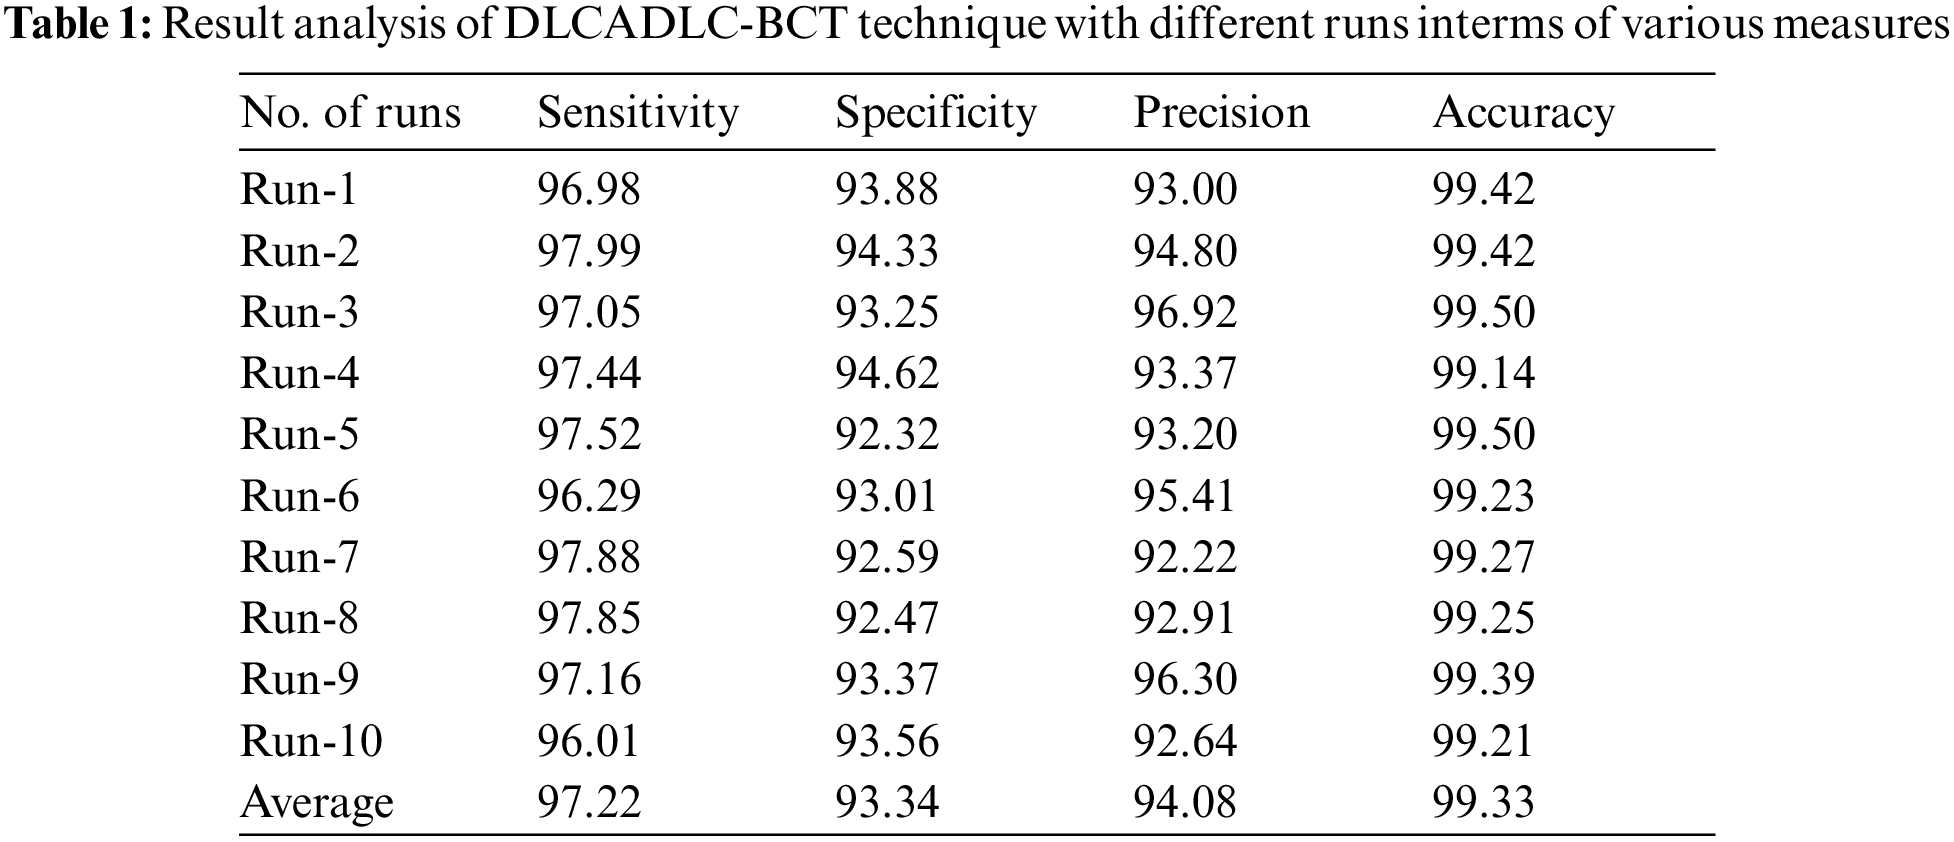
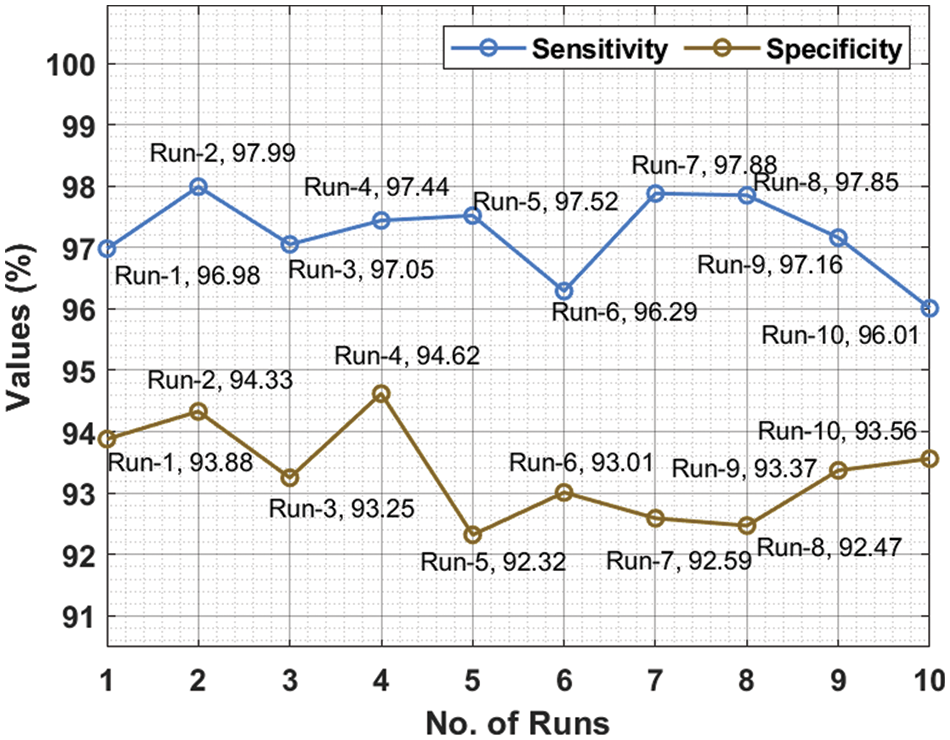
Figure 5:
For instance, on run-1, the DLCADLC-BCT model has offered
Fig. 6 reviews the comparative
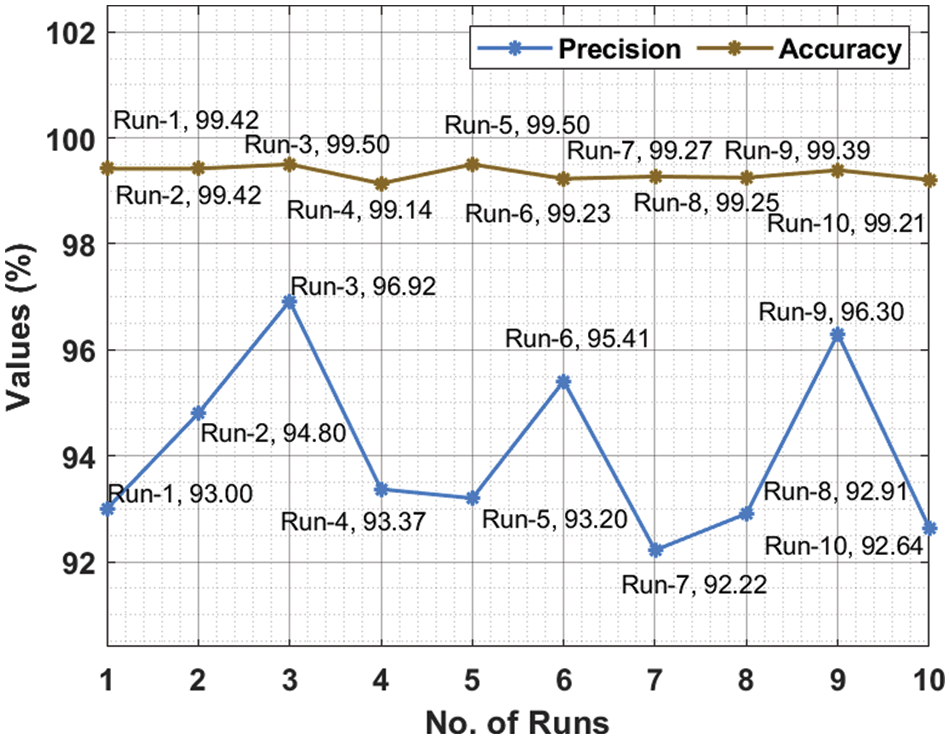
Figure 6:
A comparative classifier result inspection of the DLCADLC-BCT model with recent methods takes place in Tab. 2 [19]. Fig. 7 offers a brief
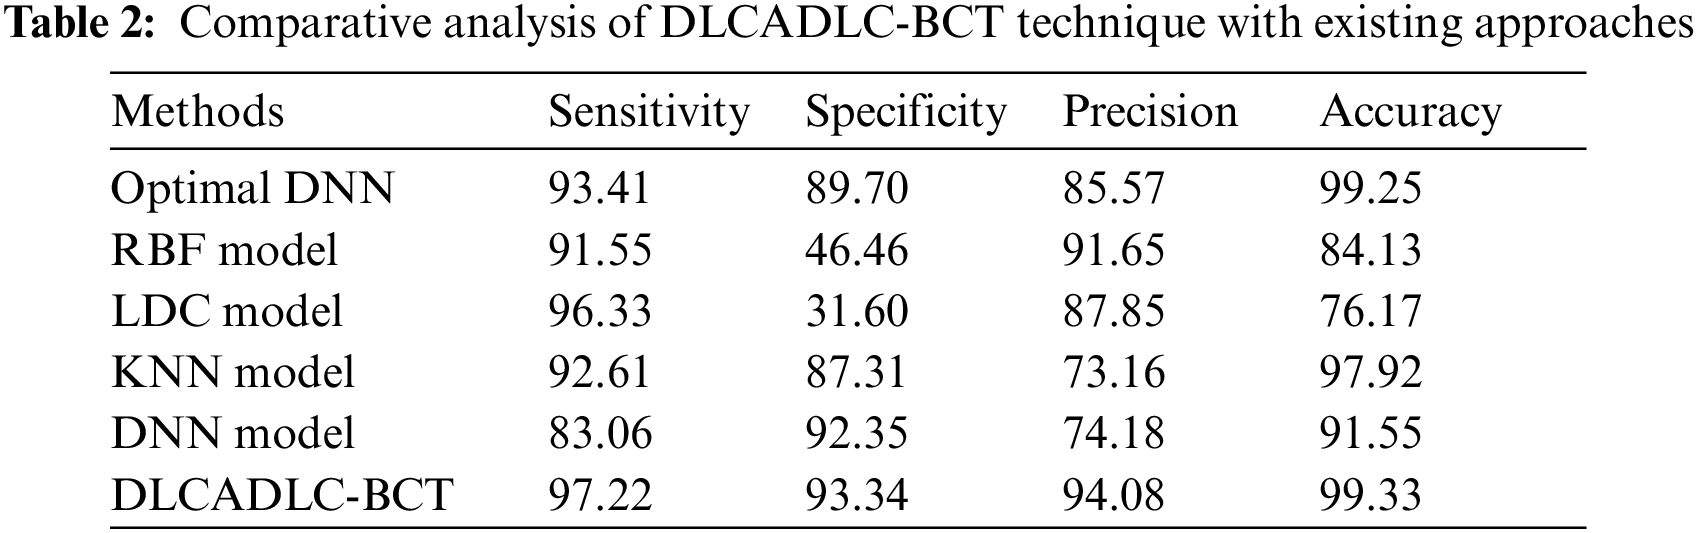
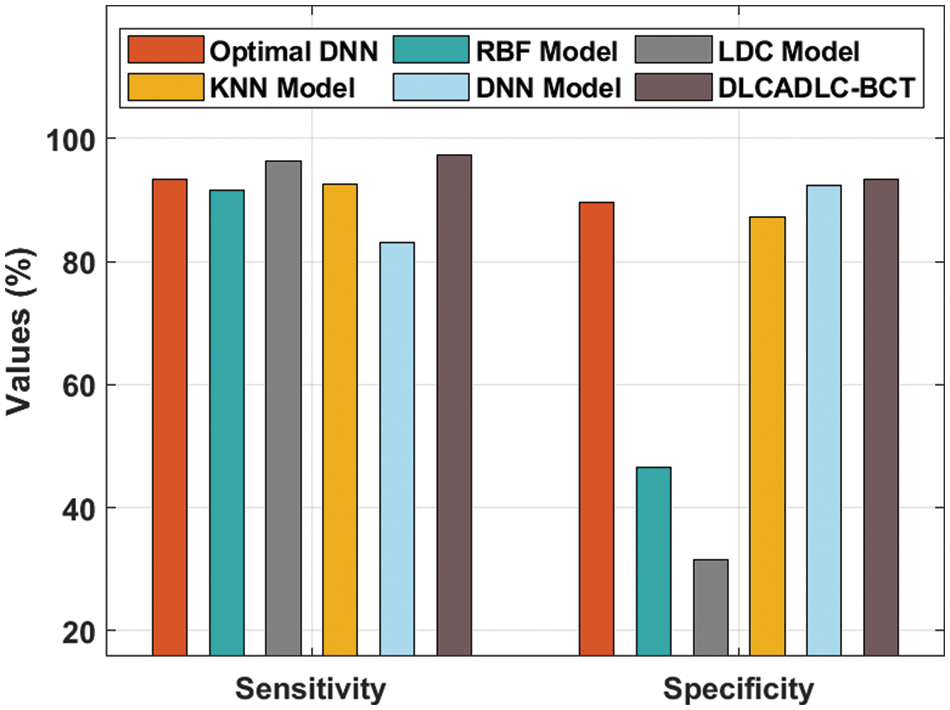
Figure 7: Comparative analysis of DLCADLC-BCT technique interms of
Fig. 8 exhibits a detailed
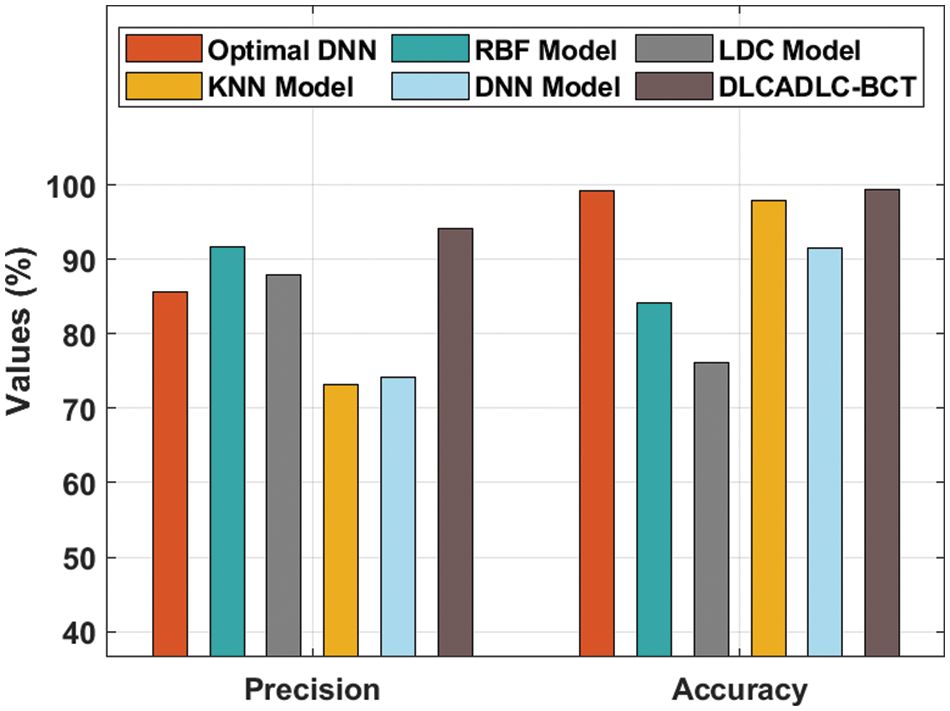
Figure 8: Comparative analysis of DLCADLC-BCT technique interms of
In this study, a novel DLCADLC-BCT approach was established for the detecting and classifying of lung cancer using CT images. The proposed DLCADLC-BCT technique employed GLCM model for deriving feature vectors. Moreover, LSTM model is applied for classifying the existence of lung cancer in the CT images. Furthermore, MSO technique was employed to optimally choose the hyperparameters of the LSTM model such as learning rate, batch size, and epoch count. For demonstrating the improved classifier results of the DLCADLC-BCT method, a set of simulations were executed on benchmark dataset and the outcomes exhibited the supremacy of the DLCADLC-BCT technique over the recent approaches. In future, deep instance segmentation models can be derived to boost the classification outcomes.
Funding Statement: The authors extend their appreciation to the Deanship of Scientific Research at King Khalid University for funding this work under Grant Number (RGP 2/180/43). Princess Nourah bint Abdulrahman University Researchers Supporting Project Number (PNURSP2022R114), Princess Nourah bint Abdulrahman University, Riyadh, Saudi Arabia. The authors would like to thank the Deanship of Scientific Research at Umm Al-Qura University for supporting this work by Grant Code: (22UQU4310373DSR03).
Conflicts of Interest: The authors declare that they have no conflicts of interest to report regarding the present study.
1. K. Pradhan and P. Chawla, “Medical internet of things using machine learning algorithms for lung cancer detection,” Journal of Management Analytics, vol. 7, no. 4, pp. 591–623, 2020. [Google Scholar]
2. P. R. Radhika, R. A. S. Nair and G. Veena, “A comparative study of lung cancer detection using machine learning algorithms,” in 2019 IEEE Int. Conf. on Electrical, Computer and Communication Technologies (ICECCT), India, pp. 1–4, 2019. [Google Scholar]
3. W. Sun, G. Z. Dai, X. R. Zhang, X. Z. He and X. Chen, “TBE-net: A three-branch embedding network with part-aware ability and feature complementary learning for vehicle re-identification,” IEEE Transactions on Intelligent Transportation Systems, pp. 1–13, 2021. https://doi.org/10.1109/TITS.2021.3130403. [Google Scholar]
4. W. Sun, L. Dai, X. R. Zhang, P. S. Chang and X. Z. He, “RSOD: Real-time small object detection algorithm in UAV-based traffic monitoring,” Applied Intelligence, pp. 1–16, 2021. https://doi.org/10.1007/s10489-021-02893-3. [Google Scholar]
5. O. Gunaydin, M. Gunay and O. Sengel, “Comparison of lung cancer detection algorithms,” in 2019 Scientific Meeting on Electrical-Electronics & Biomedical Engineering and Computer Science (EBBT), Istanbul, Turkey, pp. 1–4, 2019. [Google Scholar]
6. S. Bhatia, Y. Sinha and L. Goel, “Lung cancer detection: A deep learning approach,” Soft Computing for Problem Solving, pp. 699–705, 2019. https://doi.org/10.1007/978-981-13-1595-4_55. [Google Scholar]
7. P. M. Shakeel, M. A. Burhanuddin and M. I. Desa, “Lung cancer detection from CT image using improved profuse clustering and deep learning instantaneously trained neural networks,” Measurement, vol. 145, pp. 702–712, 2019. [Google Scholar]
8. W. J. Sori, J. Feng, A. W. Godana, S. Liu and D. J. Gelmecha, “DFD-net: Lung cancer detection from denoised CT scan image using deep learning,” Frontiers of Computer Science, vol. 15, no. 2, pp. 152701, 2021. [Google Scholar]
9. C. L. Chen, C. C. Chen, W. H. Yu, S. H. Chen, Y. C. Chang et al., “An annotation-free whole-slide training approach to pathological classification of lung cancer types using deep learning,” Nature Communications, vol. 12, no. 1, pp. 1193, 2021. [Google Scholar]
10. T. L. Chaunzwa, A. Hosny, Y. Xu, A. Shafer, N. Diao et al., “Deep learning classification of lung cancer histology using CT images,” Scientific Reports, vol. 11, no. 1, pp. 5471, 2021. [Google Scholar]
11. R. Tekade and K. Rajeswari, “Lung cancer detection and classification using deep learning,” in 2018 Fourth Int. Conf. on Computing Communication Control and Automation (ICCUBEA), Pune, India, pp. 1–5, 2018. [Google Scholar]
12. W. Ausawalaithong, A. Thirach, S. Marukatat and T. Wilaiprasitporn, “Automatic lung cancer prediction from chest x-ray images using the deep learning approach,” in 2018 11th Biomedical Engineering Int. Conf. (BMEiCON), Chiang Mai, pp. 1–5, 2018. [Google Scholar]
13. Q. Tian, Y. Wu, X. Ren and N. Razmjooy, “A new optimized sequential method for lung tumor diagnosis based on deep learning and converged search and rescue algorithm,” Biomedical Signal Processing and Control, vol. 68, pp. 102761, 2021. [Google Scholar]
14. W. Sun, B. Zheng and W. Qian, “Automatic feature learning using multichannel ROI based on deep structured algorithms for computerized lung cancer diagnosis,” Computers in Biology and Medicine, vol. 89, pp. 530–539, 2017. [Google Scholar]
15. X. Huang, Q. Lei, T. Xie, Y. Zhang, Z. Hu et al., “Deep transfer convolutional neural network and extreme learning machine for lung nodule diagnosis on CT images,” Knowledge-Based Systems, vol. 204, pp. 106230, 2020. [Google Scholar]
16. C. Priya and S. Sudha, “Adaptive fruitfly based modified region growing algorithm for cardiac fat segmentation using optimal neural network,” Journal of Medical Systems, vol. 43, no. 5, pp. 104, 2019. [Google Scholar]
17. I. Khan, S. Afzal and J. Lee, “Human activity recognition via hybrid deep learning based model,” Sensors, vol. 22, no. 1, pp. 323, 2022. [Google Scholar]
18. G. I. Sayed and A. E. Hassanien, “Moth-flame swarm optimization with neutrosophic sets for automatic mitosis detection in breast cancer histology images,” Applied Intelligence, vol. 47, no. 2, pp. 397–408, 2017. [Google Scholar]
19. S. K. Lakshmanaprabu, S. N. Mohanty, K. Shankar, N. Arunkumar and G. Ramirez, “Optimal deep learning model for classification of lung cancer on CT images,” Future Generation Computer Systems, vol. 92, pp. 374–382, 2019. [Google Scholar]
 | This work is licensed under a Creative Commons Attribution 4.0 International License, which permits unrestricted use, distribution, and reproduction in any medium, provided the original work is properly cited. |