DOI:10.32604/cmc.2022.028044
| Computers, Materials & Continua DOI:10.32604/cmc.2022.028044 | |
| Article |
Text-Independent Algorithm for Source Printer Identification Based on Ensemble Learning
1Department of Computer Science, Faculty of Computers and Artificial Intelligence, Benha University, 13518, Egypt
2School of Information Technology and Computer Science (ITCS), Nile University, 12677, Egypt
*Corresponding Author: Naglaa F. El Abady. Email: naglaa.fathy@fci.bu.edu.eg
Received: 31 January 2022; Accepted: 12 April 2022
Abstract: Because of the widespread availability of low-cost printers and scanners, document forgery has become extremely popular. Watermarks or signatures are used to protect important papers such as certificates, passports, and identification cards. Identifying the origins of printed documents is helpful for criminal investigations and also for authenticating digital versions of a document in today’s world. Source printer identification (SPI) has become increasingly popular for identifying frauds in printed documents. This paper provides a proposed algorithm for identifying the source printer and categorizing the questioned document into one of the printer classes. A dataset of 1200 papers from 20 distinct (13) laser and (7) inkjet printers achieved significant identification results. A proposed algorithm based on global features such as the Histogram of Oriented Gradient (HOG) and local features such as Local Binary Pattern (LBP) descriptors has been proposed for printer identification. For classification, Decision Trees (DT), k-Nearest Neighbors (k-NN), Random Forests, Aggregate bootstrapping (bagging), Adaptive-boosting (boosting), Support Vector Machine (SVM), and mixtures of these classifiers have been employed. The proposed algorithm can accurately classify the questioned documents into their appropriate printer classes. The adaptive boosting classifier attained a 96% accuracy. The proposed algorithm is compared to four recently published algorithms that used the same dataset and gives better classification accuracy.
Keywords: Document forensics; source printer identification (SPI); HOG; LBP; principal component analysis (PCA); bagging; AdaBoost
In the early modern era, documents in digital format and their use became more common due to the fast development of advanced and sophisticated technologies. Nowadays, avoiding utilizing them is almost Impossible. Official contract images, invoices, contracts, bills, checks, and scientific literature are digital documents. These documents are unsecure because they lack the necessary security measures. Manipulation of documents has become more accessible as a result of this limitation. These operations are simple to carry out with the help of efficient technologies such as printers and scanners. After scanning the original document, the scanned image has readily been tampered with. As a result, before relying on a document, it is necessary to verify its authenticity. In most cases, active approaches are used to authenticate documents. These approaches are extensively used to protect digital documents [1,2], such as a watermark or signature. These strategies add different extrinsic fingerprints to the document, which can be easily traced if disturbed. However, because such technology is costly and time-consuming, it is impossible to utilize it for all publications. Another strategy is passive, which is based on the intrinsic properties of document images. The fingerprints of hardware and could be used as intrinsic features to prove the authenticity of the document. knowing the source printer might be incredibly beneficial when looking for modifications in printed documents. Each printer has a distinct printing style. This component can be used to inspect the printed document and trace it back to the printer that was used.
When a printed document is scanned, it becomes a traditional pattern recognition problem with feature extraction and classification [3]. Chemical or microscopic techniques are used in traditional approaches, which are time-consuming and can harm or even destroy the investigated documents. As a result, all what is required for digital approaches is a scanner and a computer. Several methodologies [4–7], including as examination and machine learning-based approaches, have been developed in the relevant literature. Text-dependent and text-independent approaches are the two primary categories of techniques proposed in the literature. The majority of text-dependent approaches depend on character or word-level imperfections introduced by printers. Despite their effectiveness, such procedures necessarily involve the comparison of semantically similar units (characters or words). Either pre-divided characters (or words) or the integration of an Optical Character Recognition (OCR) system that allows for the comparison of identical characters words is required. Text-independent approaches are more relevant to real-world applications, although they need a huge amount of training data to simulate printer discrimination. Text-independent approaches, on the other hand, are not content-specific and often recommend the use of statistical features acquired from a large number of observations (paragraphs or images).
This paper proposes a feature-based classification of source printers based on scanned images of printed papers. The following are the main contributions:
• Detect forged documents with high accuracy using source printer identification.
• Identifying the source printer and categorizing the questioned document into one of the printer classes.
• Investigate the global and local characteristics of the entire printed documents without using pre-divided characters (or words) or the usage of an OCR system.
• Propose and construct an efficient document classifier capable of identifying a foreign document from a set of questioned documents printed on a separate printer.
The following is how the rest of the paper is structured: Section 2 highlights related work, while Section 3 discusses the details of the suggested method. Section 4 describes the results of the conducted experiments along with an elaborate discussion of these results and a comparison with related work reported in literature. Section 5 concludes the paper.
Detecting document tampering can be done in a variety of ways. The majority of these approaches detect the source of the variations to determine the likelihood of alteration. Other approaches search for the source printer of document images to authenticate the documents. This section will go over the most common methods for authenticating a document and confirming that it was printed by a legal printer. These methods are classified into two types: text-dependent (Local features are examined) and text-independent (global features are examined). Tab. 1 depicts a summary of (Source Printer Identification) SPI techniques based on printed documents.
Text-dependent approaches typically depend on character or word-level constraints imposed by printers. Such approaches require the comparison of semantically related components (characters or words). Generally, it needs the use of either pre-divided words (or characters) or incorporating an OCR system that permits the comparison of identical words or characters. Mikkilineni et al. suggested a texture feature-based descriptor-based method for detecting the source of a document in [3]. It examines the document’s connected components (CCs) or characters, as well as the statistics of some specific, frequently occurring characters, such as “e” or “a” for indications of alteration. Text documents scanned at a resolution of 2400 dpi were taken into consideration. For this experiment, all “e” letters were used. The Gray-Level Co-occurrence Matrix (GLCM) was applied to extract 22 statistical features per character to create a feature vector. ‘Each feature vector is classified individually using a 5-Nearest-Neighbor (5NN) classifier. Different texture feature extraction methods, such as Discrete Wavelet Transform (DWT) and GLCM, are used in [8] to examine the Chinese printed source and determine the impact of different output devices. When 12 printers were examined, they achieved an identification accuracy rate of 98.4%. Kong [9], proposed the first attempt to differentiate documents produced by an inkjet printer, copier, and laser printer based on attributes obtained from unique characters in the documents. The document’s signatures from the standard device(s) that were used to make the document are evaluated. The experimental results showed that the accuracy reached 90% for all the inkjet printers and most laser printers and copiers. Ferreira et al. [10], proposed three solutions for identifying laser printers. In these solutions, low-resolution scanned documents were employed. The first technique applied two descriptors based on multi-directional and multi-scale textural features of micro-patterns. Letters or areas of interest were used to create these descriptions. As a second descriptor, the Convolution Texture Gradient Filter (CTGF) was proposed. The third method had the advantage of identifying a document’s printing source even if portions of it were unavailable. For frames, characters, and documents, the accuracy of the first method was 98.38%, 97.60%, and 88.58%, respectively. The accuracy rates for frames and papers were 94.19% and 88.45%, respectively.
In a system proposed in [11], all of the printed letters were used at the same time to identify the source printer from scanned images of printed documents. A single classifier is used to classify all printed letters, as well as local texture patterns-based features. From scanned images, letters are extracted. Each character is separated into a flat and an edge region, and local binary patterns for these two regions are calculated individually. The method was tested on a public dataset of 10 printers as well as a new dataset of 18 printers scanned at 600 and 300 dpi resolution and printed in four different fonts. The system can simultaneously deal with all the printed letters and use a single classifier outperforming existing hand-crafted feature-based methods. In [12], The authors proposed a solution for the printer attribution problem that can learn discriminative features directly from available training data. The back-propagation process and convolutional neural networks are used in the solution. The method is based on artifacts extracted from various letters of texts in various languages. The authors were able to achieve a 98% accuracy by employing various representations of raw data as input to a Convolutional Neural Network (CNN). Tsai et al. proposed a four-layered CNN architecture for SPI from documents in [13] and compared the results to hand-crafted features. In [14], proposed a deep learning approach to address the difficult image classification problem. Textual documents are classified with an accuracy of 98.4 percent, while natural image-based scanned documents are classified with an accuracy of 99.96 percent, using a 7-layered CNN. Authors reported textual and image-based document accuracy of 97.37 percent and 97.7 percent, respectively, after raising the layers to 13.
2.2 Text Independent Approaches
Text independent strategies look at the entire document at the same time. The algorithms in this category examine statistical properties such as noise across the document to detect modifications. The number of studies in this category is relatively small. Automatically source printers are identified using common-resolution scans (400 dpi) [15]. The proposed system is based on the printer’s unique noise. The overall categorization accuracy was 76.75%. A text-independent method for an adequate description of source printers using deep visual Features has been implemented by [16]. Using transfer learning on a pre-trained CNN, the system detected 1200 documents from 20 different (13) laser and (7) inkjet printers. In [17], the authors presented a document source printer with a passive technique. Some of the feature extraction techniques that have been used include Key Printer Noise Features (KPNF), Speeded Up Robust Features (SURF), and orientated FAST rotated and BRIEF (ORB). For the classification job, three classification strategies are considered: k-NN, random forest, DT, and the majority vote of these three classification techniques. The system achieved the best accuracy of 95.1% by combining KPNF, ORB, and SURF with a random forest classifier and adaptive boosting technique. For printer attribution, a novel technique based on (SURF), Oriented Fast Rotated, and BRIEF feature descriptors is proposed in [18]. Random Forest, Naive Bayes, k-NN, and other combinations of these classifiers were employed for classification. The proposed model is capable of accurately classifying the questioned documents into the appropriate printer. The accuracy was 86.5% using a combination of Naive Bayes, k-NN, and random forest classifiers, as well as a simple majority voting system and adaptive boosting algorithms. In [19], the authors proposed a system for distinguishing inkjet-printed pages from laser-printed pages based on differences in edge roughness. The whole process used, appropriate intrinsic features from the document image are extracted in the first step. The extracted features are compared in the second step to identify documents that did not use the similar printing technique as most of the documents. The key advantage of this technique is that it does not require any prior experience with genuine documents.
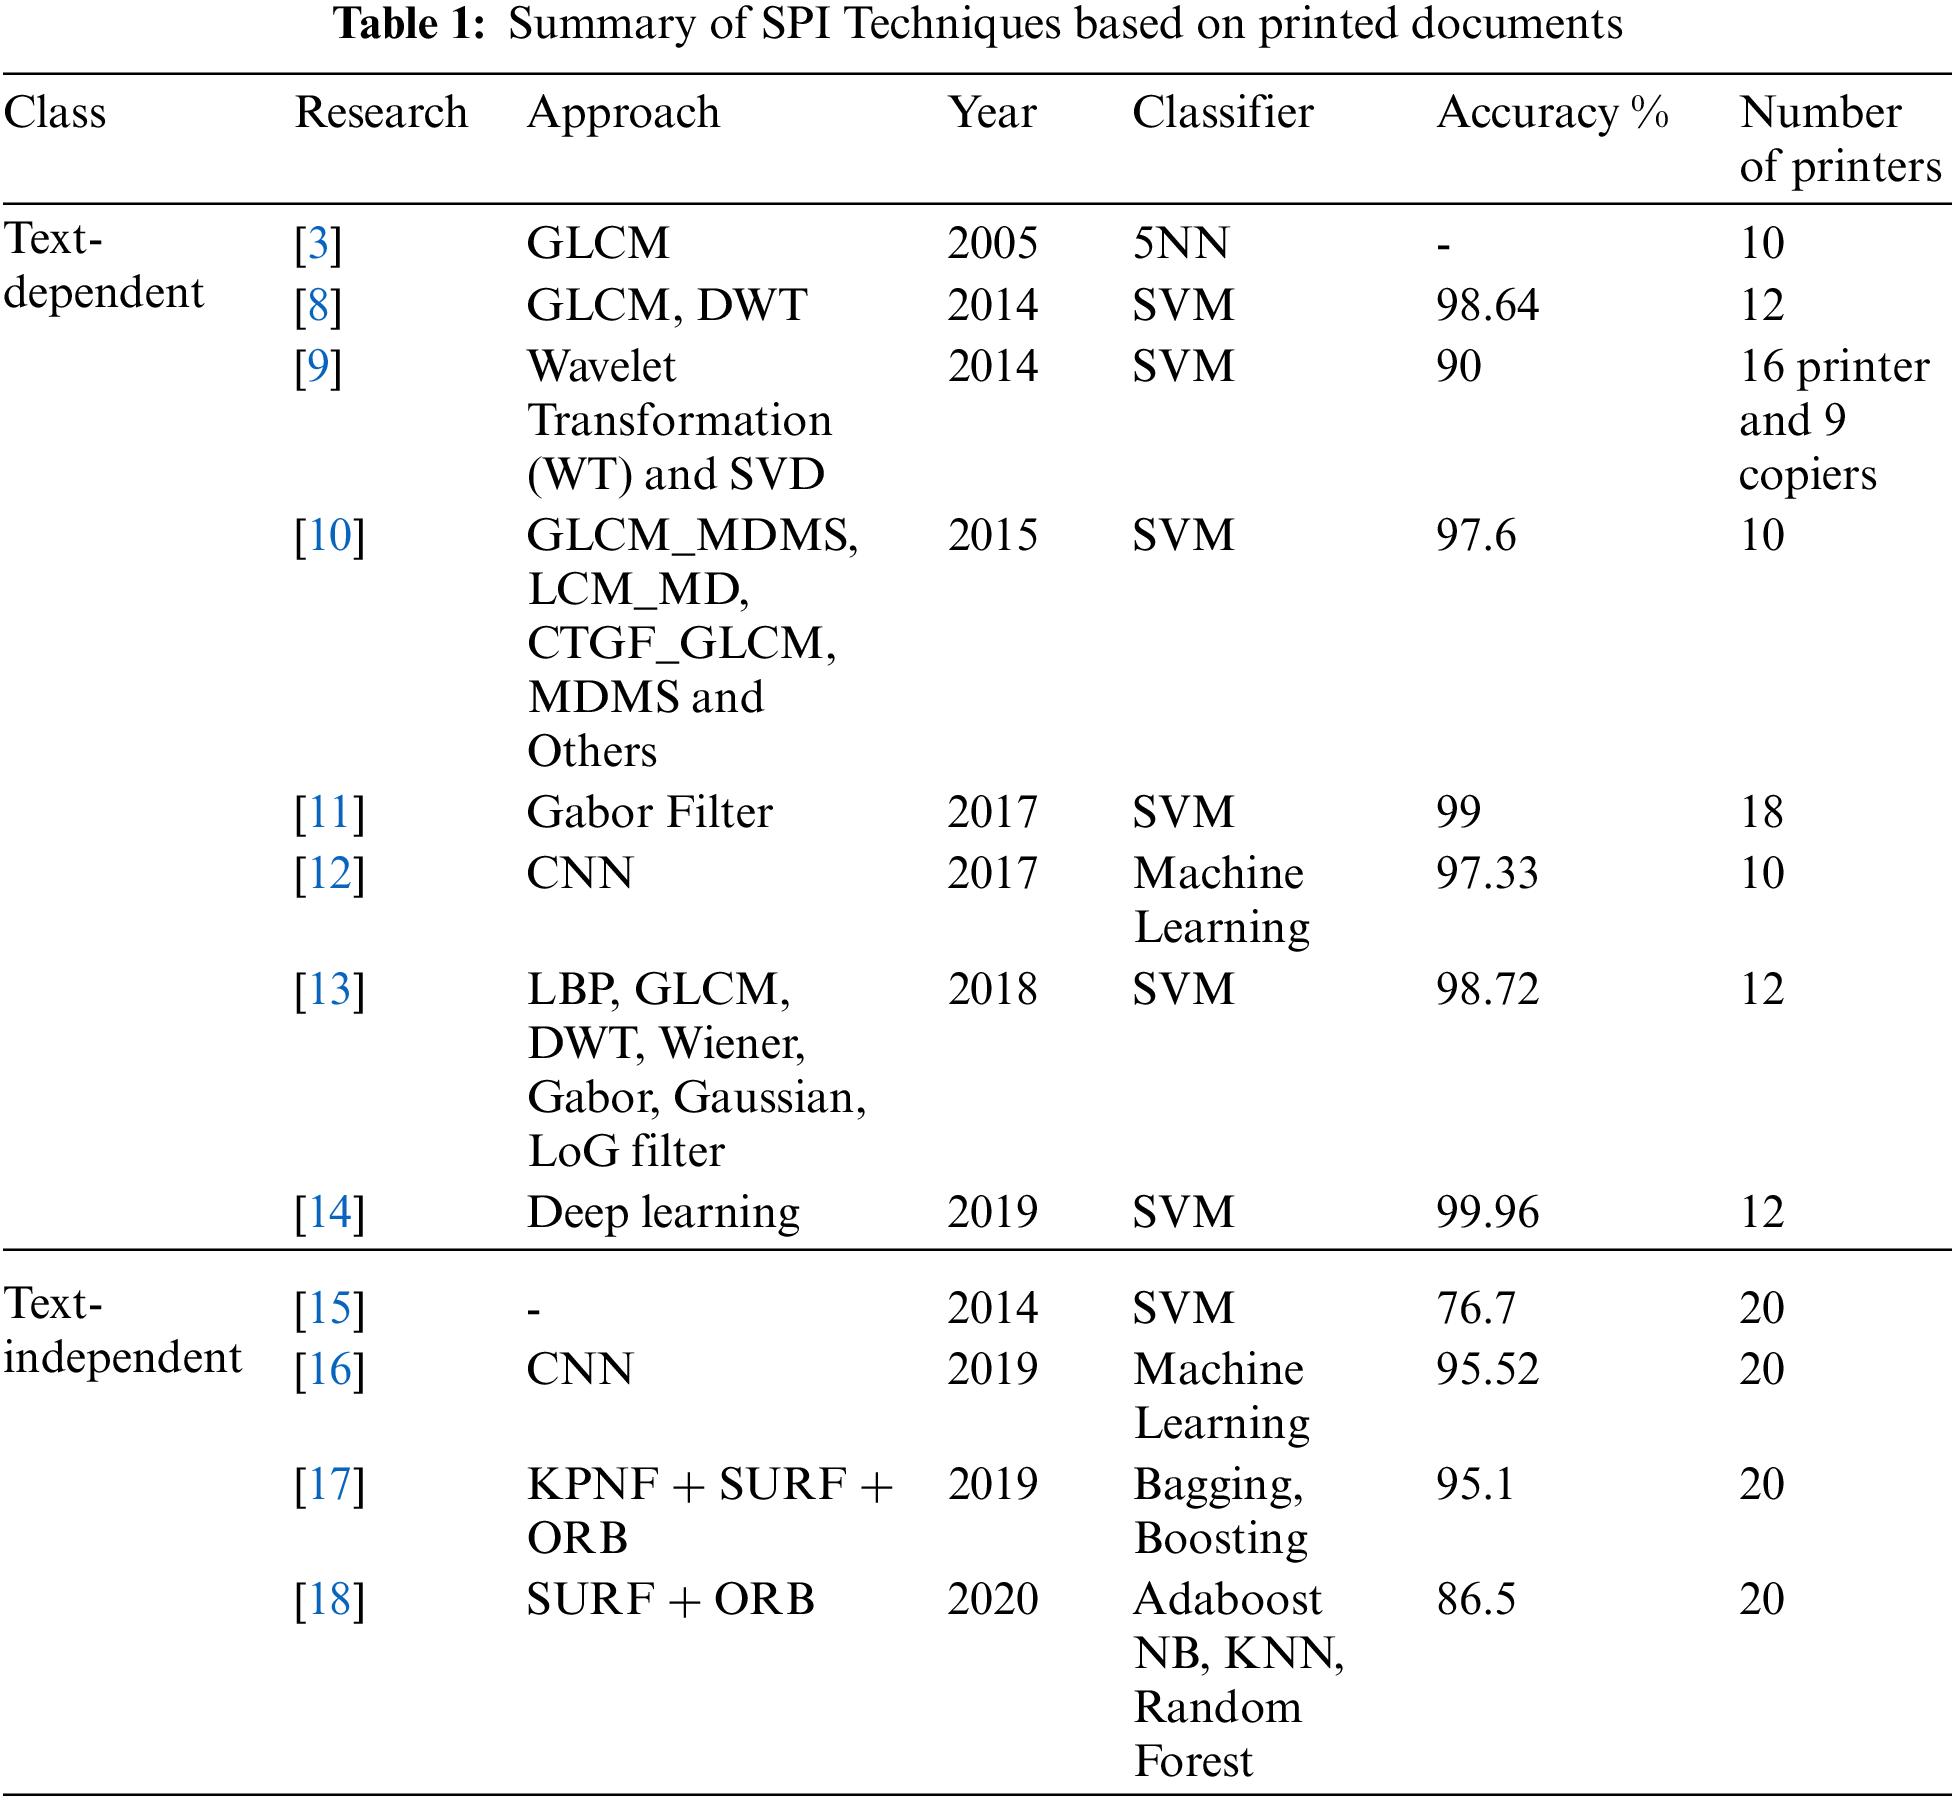
On every printed page, there are some fingerprints left by the printer. Every printer has its own set of fingerprints. These fingerprints are a printer’s distinguishing feature. This research provides an algorithm for identifying the source printer and categorizing the questioned document into one of the printer types. The proposed algorithm is depicted in Fig. 1 in two steps. The training phase includes preprocessing, feature extraction, and classification. The testing phase is similar to the training phase after adding the prediction.
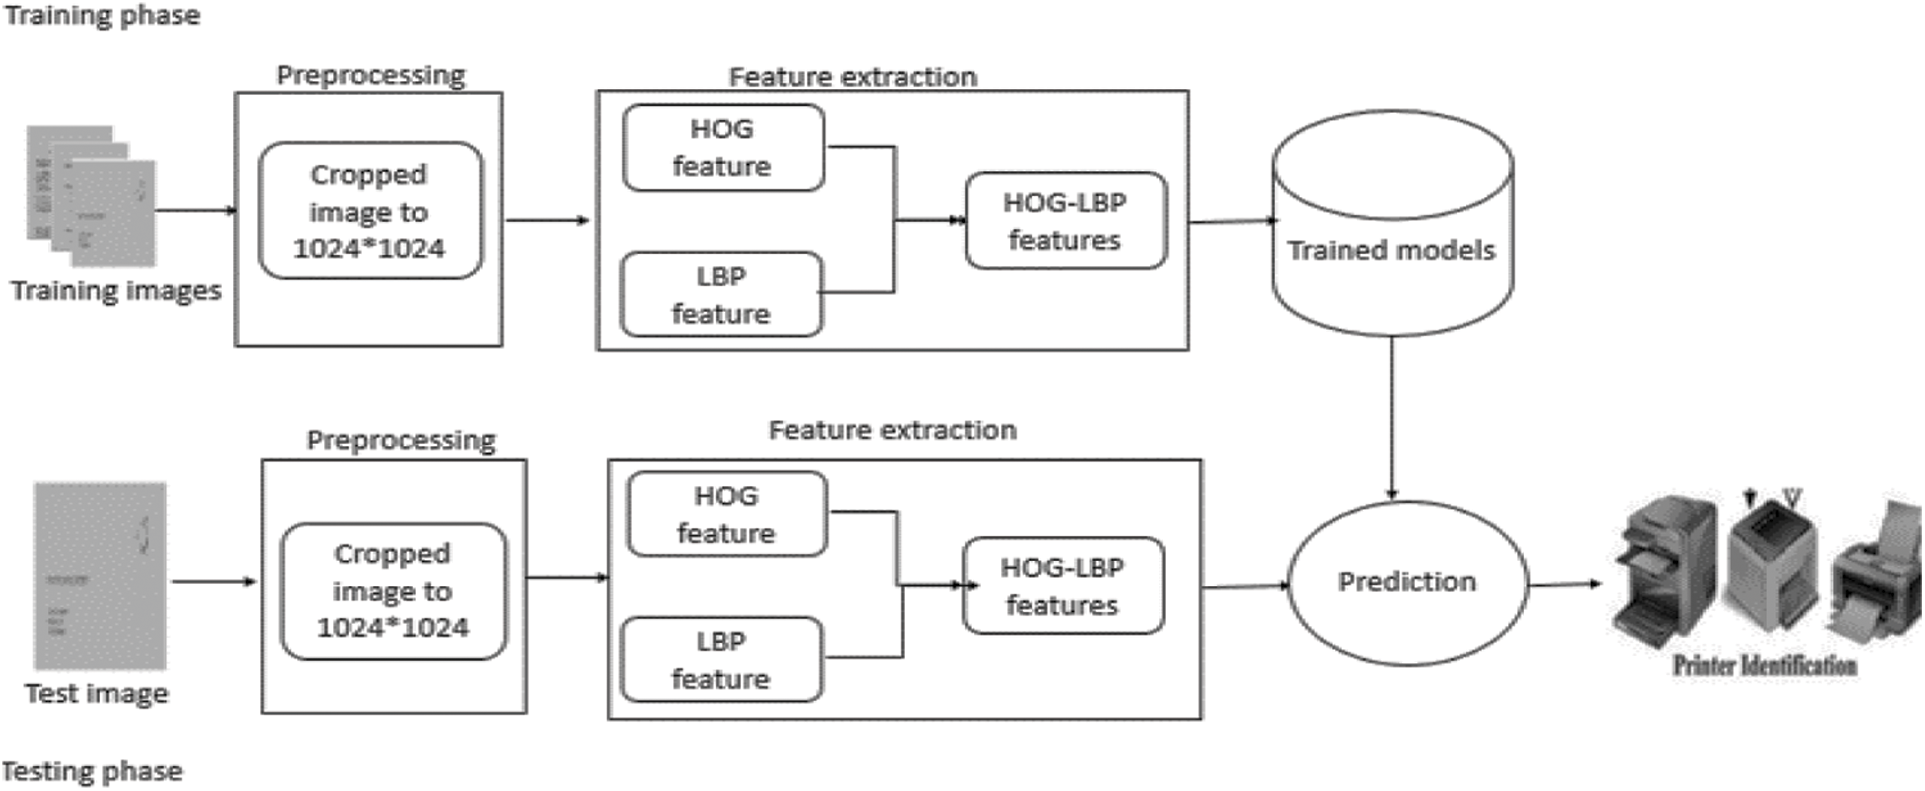
Figure 1: The proposed algorithm diagram
The printed document image is cropped from the beginning of the image to three equal images (top, middle, and bottom). Then each image in every collection is cropped to 1024X 1024 pixels. For each image in the collection, global feature descriptor vectors are extracted using HOG features. Using LBP features, local feature descriptor vectors are extracted for each image. For training purposes, both HOG and LBP feature vectors are concatenated. To create the trained models, the proposed algorithm is trained using DT, k-NN, SVM, a combination of them, Bagging, Boosting, and random forest classifiers. For testing purposes, HOG and LBP feature vectors are also concatenated. By inputting the HOG and LBP features of the questioned documents, we can use the trained models to predict the class of the documents.
Because the size of the input image is too large, applying the proposed algorithm takes a long time. As a result, resizing the input document image will decrease feature extraction time. To avoid this issue, each document image is cropped from the beginning of the image to three equal images (top, middle, and bottom). Then each image in every collection is cropped to 1024X 1024 pixels, as shown in Fig. 2. These cropped photos are then used to extract features. An extra benefit of cropping an image is the generation of the part containing fingerprints left by the printer.
Figure 2: Samples of document images used in the proposed algorithm. (a) at the top (b) at the middle (c) at the bottom
Two feature extraction strategies are utilized in the proposed algorithm. The HOG is used first. The HOG is a robust feature descriptor that uses an intensive feature extraction technique. It retrieves features from all an image’s location areas of interest. HOG extracts the object structures from the gradient information in a picture [16]. The feature extraction steps using HOG consist of preprocessing, calculating the gradient directions, and Gradient Magnitude from Eqs. (1) and (2). A HOG features vector is generated by combining the gradient calculations of each pixel, as shown in Fig. 3. Generating a histogram for each block by using gradients value. Calculating the normalization [20] of the histograms.
where
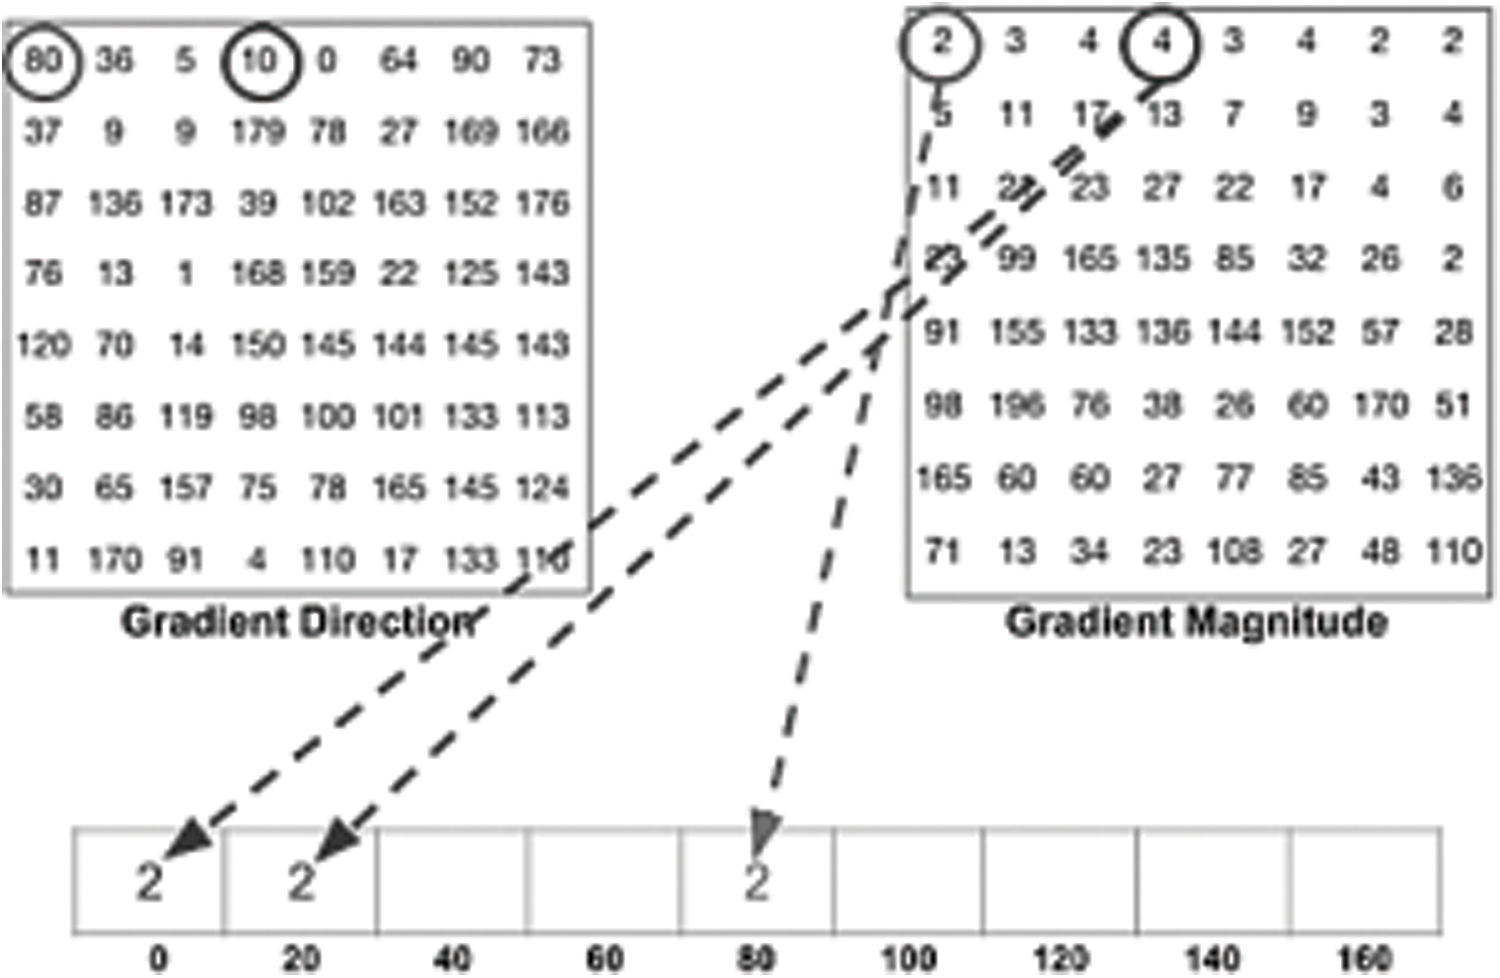
Figure 3: Gradient Directions (left), Gradient Magnitude (right)
In the proposed system, the default ExtractHOGFeatures of MATLAB is used with cell size 128*128. Fig. 4 shows the input image and visual HOG feature Extraction.

Figure 4: Input image and visual HOG feature extraction
Finally, one of the operators used to extract texture characteristics is Local Binary Pattern (LBP) used in [21–23]. It calculates the image’s local contrast. The LBP is first specified in an eight-pixel radius around the grey value center pixel. The LBP is easy to use and has a low processing complexity, as indicated in Eq. (3).
where

Figure 5: The calculation process of the original LBP
The default of LBP is used in the proposed algorithm , with an average number of neighbors of 8, a radius of 1, and a cell size 256*256.
A model-training algorithm that uses a feature set as input is called a classifier. A classifier creates a model when the training dataset has successfully trained it. The test data is then classified using this model. Depending on the problem, multi-class or binary classifiers may be used. There are two types of classifiers, single and ensemble [24]. Single classifiers such as decision tree (DT) [25,26], K-Nearest Neighbors (K-NN) [27], and Support Vector Machine (SVM) [28]. Ensemble classifiers such as Random Forests (RF) [29], Adaptive-Boosting (Boosting) [30], and Aggregate Bootstrapping (Bagging) [31,32]. In this paper, the two types are used and generate trained models, which are stored to be used later in the prediction process in the testing phase.
3.4 Trained Models and Prediction
Following the classification technique outlined in the previous section, a group of trained models, including the DT model, KNN model, SVM model, DT-KNN model, DT-SVM model, KNN-SVM model, RF model, boosting model, and Bagging model, are generated. Use the obtained trained models provided after applying various classifiers to predict the type of printer during the testing phase. Choose a model with a high level of accuracy
3.5 Principal Component Analysis (PCA)
PCA is one of the greatest widely used approaches for reducing data dimensionality. PCA can reduce the dimensions of multi-variables while still maintaining the relationship of data as much as possible. PCA is an unsupervised learning method that employs input data regardless of the target output. To reduce the dimension of a feature vector, PCA uses four steps [33]: normalize the image, calculate the covariance matrix, compute eigenvectors and related eigenvalues, and transform the original data into the new reduced feature vector.
The experimental results based on the classifiers stated above and their combinations are discussed in the next section.
4 Experimental Results and Discussion
The proposed algorithm is implemented using MATLAB R2019b and was run and verified with a DELL PC machine with the following configuration: Intel (R) Core (TM) i5–2430 M CPU @ 2.40 GHz, and 12.00 GB of RAM, 64-bit Windows 10. Several experiments were carried out to evaluate the proposed algorithm’s performance. Section 4.1 describes the datasets utilized to train and test the proposed algorithm. The setup of the experiment is provided in Section 4.2. Evaluation measures are offered in Section 4.3. The fourth subsection, introduces a discussion of results. Finally, a comparison with other techniques is discussed.
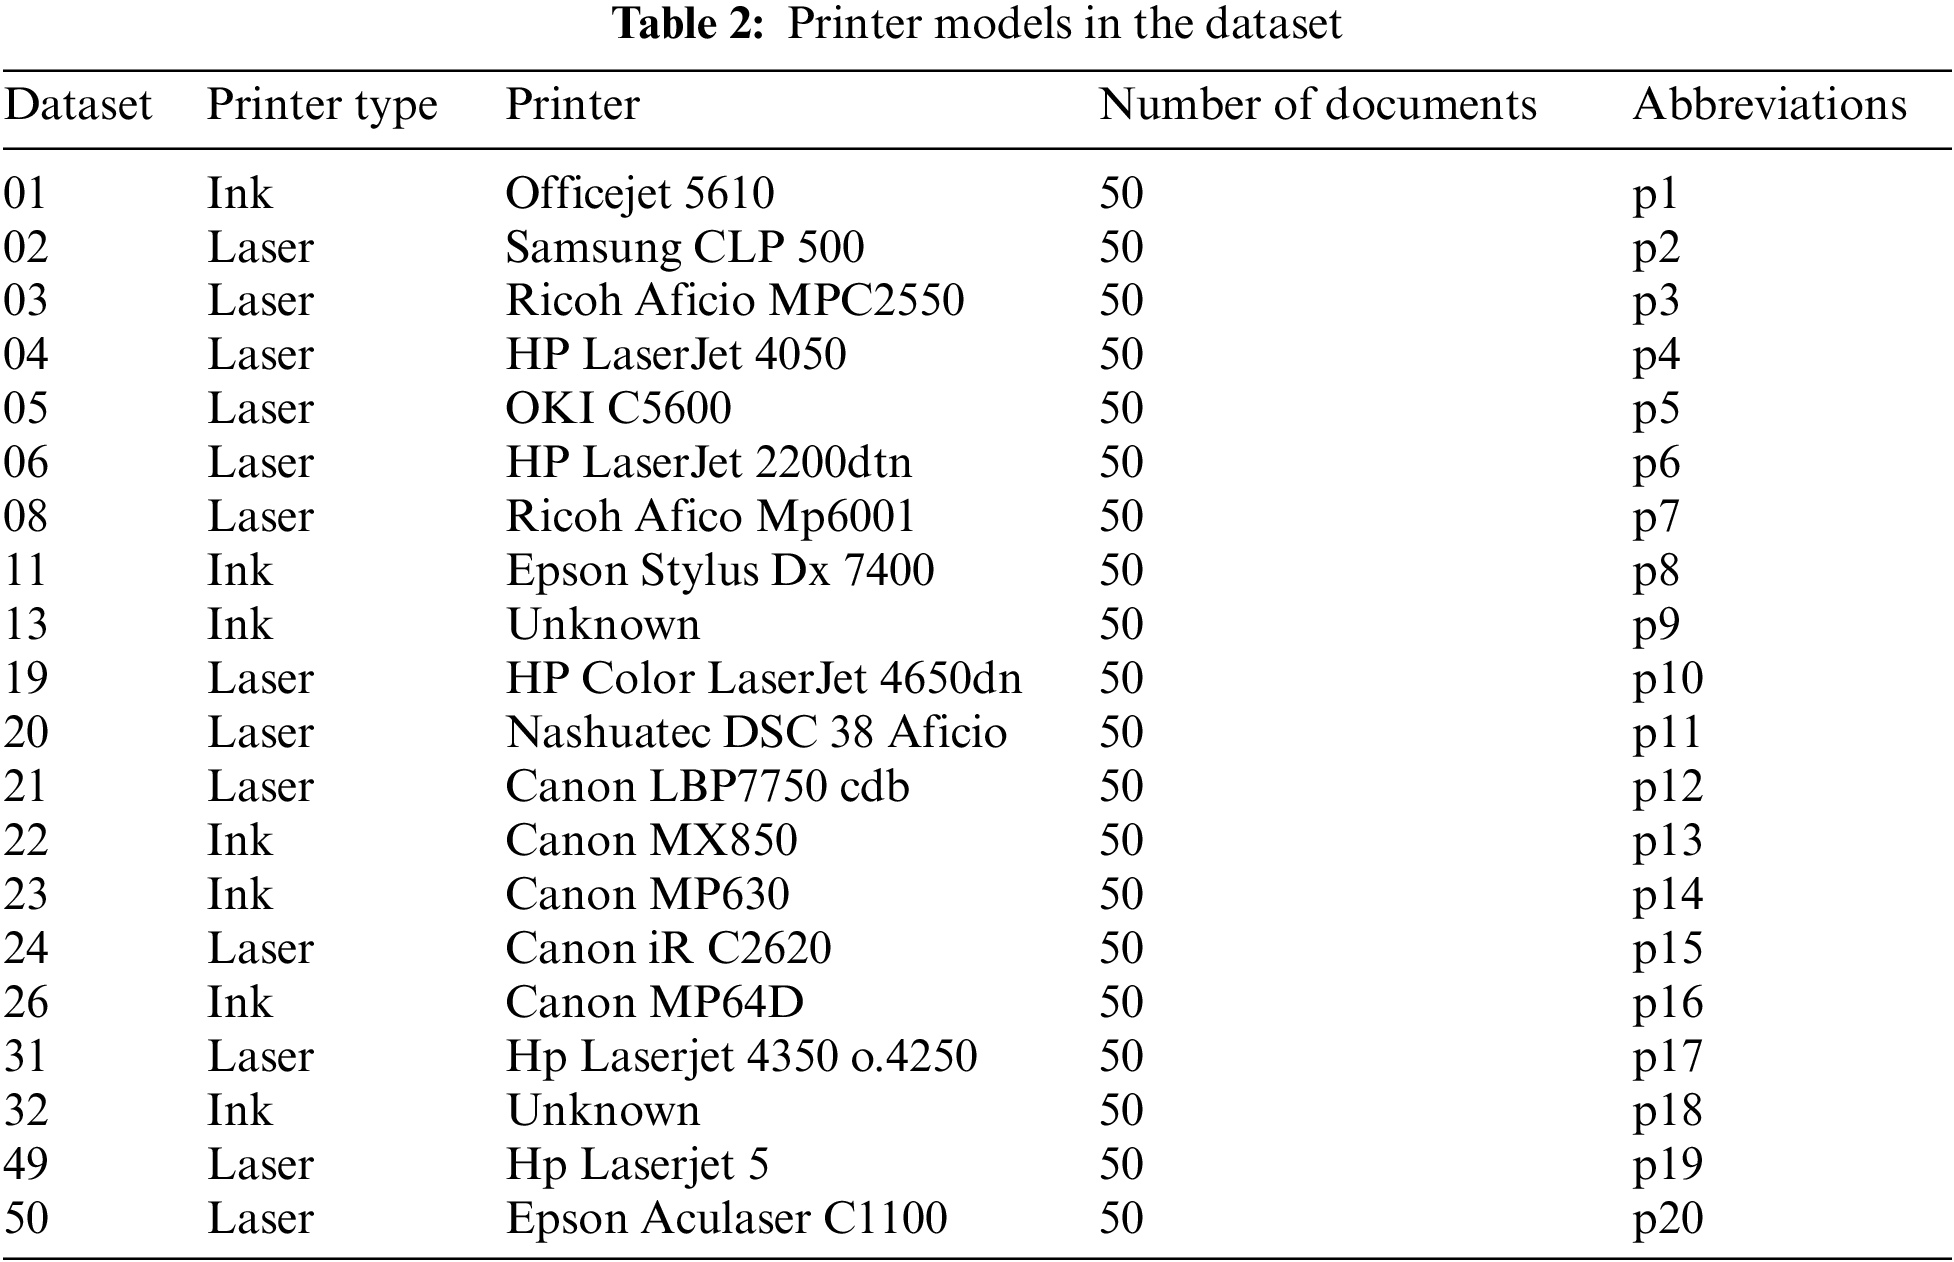
The experimental findings for the proposed algorithm were obtained using Khanna et al.’s public’s dataset [34]. The documents in this collection were printed on 13 laser printers and 7 inkjet printers. Each printer is given a total of 50 documents to consider. A printer’s documents are all one-of-a-kind. The dataset contains documents from three categories: contracts, invoices, and scientific papers. The contract only contains text but in different font types and sizes. A contract will never contain pictures, lines and diagrams. The invoices feature different font sizes , logos, composed of a small picture and colored text. The contracts and invoices documents were created artificially. The Scientific Literature consists of real-world examples. All documents of the scientific literature type originally have been released under a license that allows reusing them. The printer model’s datasets used in this paper are listed in Tab. 2.
The entire dataset is divided into two parts: 80% of the data is used as a training dataset, while the rest 20% is used as a testing dataset. The suggested system’s effectiveness is also evaluated using the 10-fold cross-validation technique. To classify the data, this work considers six classifiers: DT, SVM, KNN, their combinations, random forest, bagging, and boosting.
The performance of the proposed algorithm is assessed using a variety of evaluation metrics, including accuracy, recall, precision, and F-measure metrics [15,35,36].
The accuracy is calculated using the formula shown in Eq. (4) and is defined as the percent ratio of successfully identified documents.
where TP stands for the number of correctly classified samples, FP for the number of wrongly classified samples, TN for the number of correctly rejected samples, and FN for the number of wrongly rejected samples. The recall is the percentage of real positive instances compared to all positive cases that are correctly classified. It’s also called the true positive rate (TPR), and it’s calculated with the following Eq. (5):
Precision is also known as a positive predictive value, and it can be calculated using the formula:
The F-measure is calculated as follows [37]:
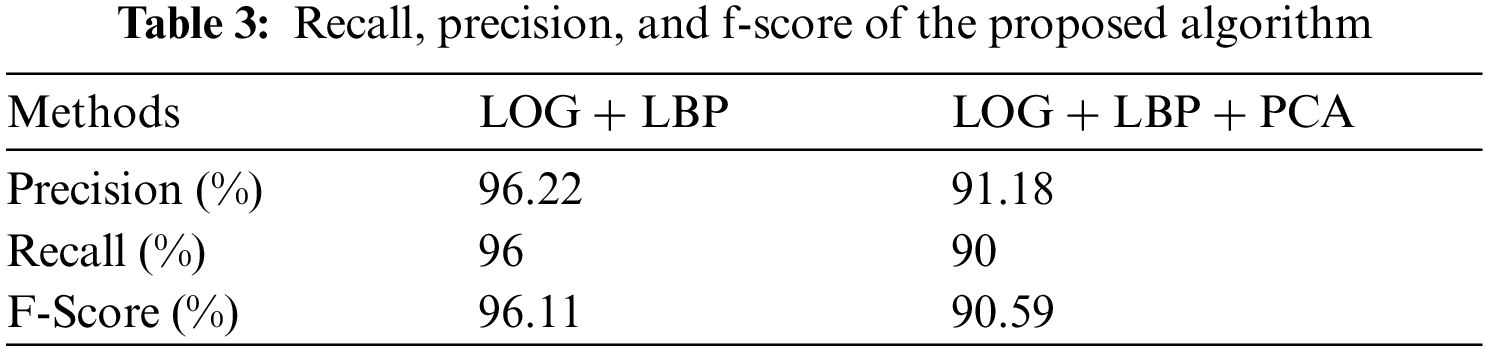
Tab. 3 depicts the proposed algorithm’s recall, precision, and F-score.
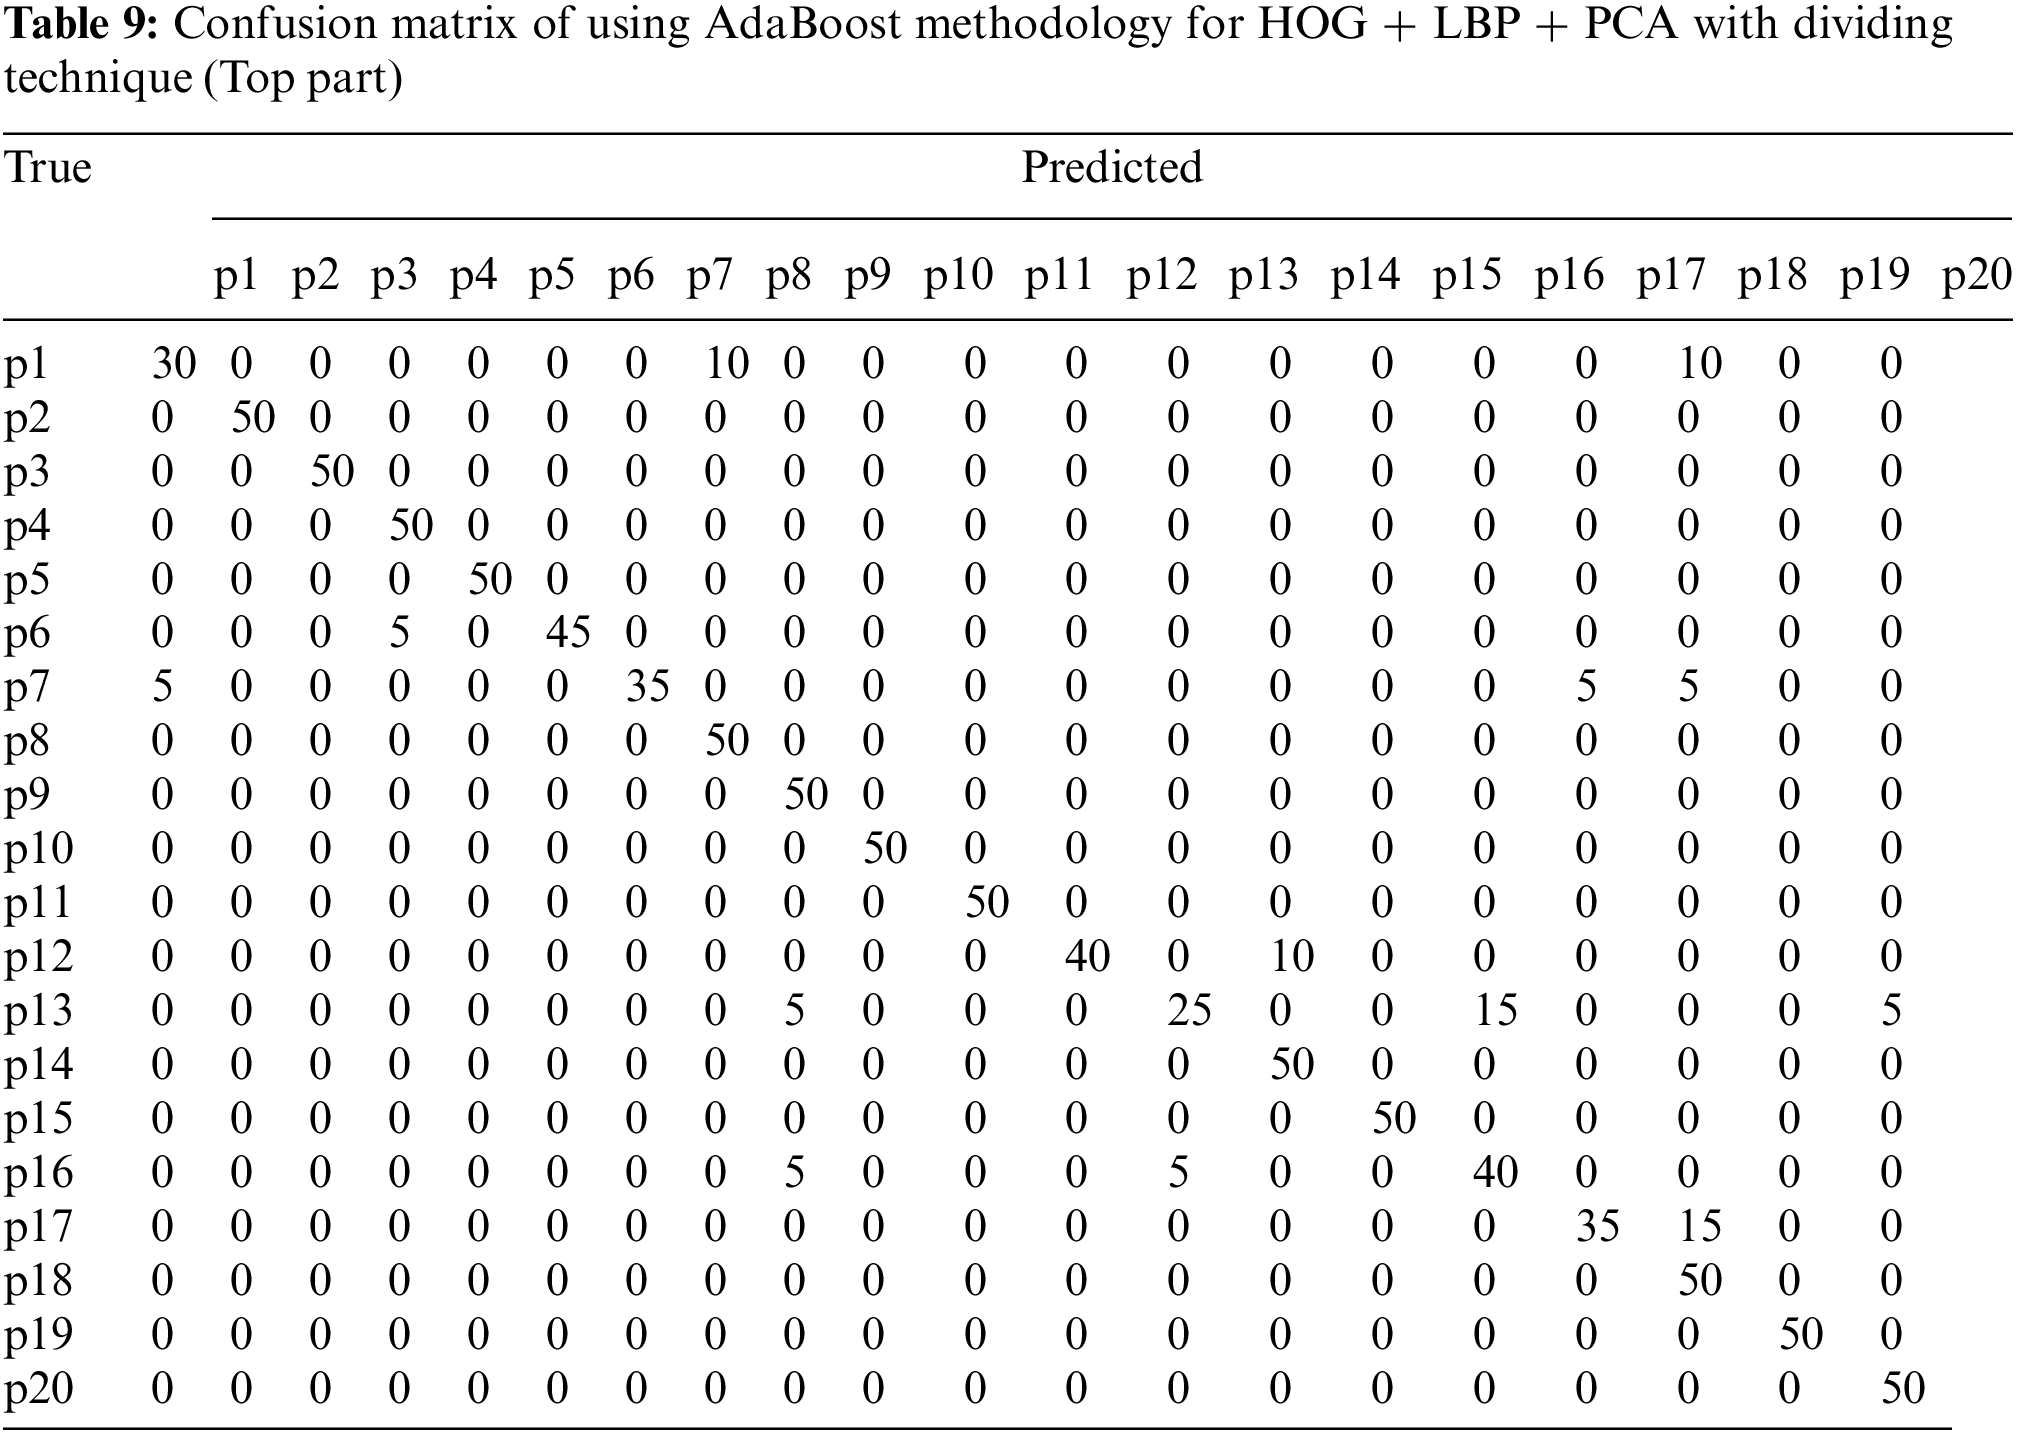
In this algorithm, the image is partitioned into three parts: top, middle, and bottom. The algorithm was trained and tested for all three parts. However, the top part yielded the best results because it contains most of the printer’s fingerprints see the result in Tabs. 4–6. For partitioning technique and bagging and boosting classifiers, recognition rates of 94.5% and 96% were attained, respectively. Figs. 6, 7 and Tab. 4 illustrate that a 90.5% and 92.5% recognition rate was attained using a 10-fold cross-validation technique and bagging and boosting classifiers, respectively. The confusion matrix of employing AdaBoost methodology for HOG + LBP with partition technique is shown in Tab. 7. When PCA is applied for dimension reduction, feature vectors decrease from 2708 to 1000. Using PCA, a 90% and 90% recognition rate was attained for the partitioning technique with bagging and boosting classifiers. With a 10-fold cross-validation technique with bagging and boosting classifiers, a recognition rate of 90.5% and 92.5% was attained, as depicted in Tab. 8, Figs. 8 and 9. The confusion matrix using AdaBoost methodology for HOG + LBP + PCA with partition technique is shown in Tab. 9. Several experiments revealed that our system could achieve an accuracy rate of 96% by combining HOG and LBP with a boosting classifier.
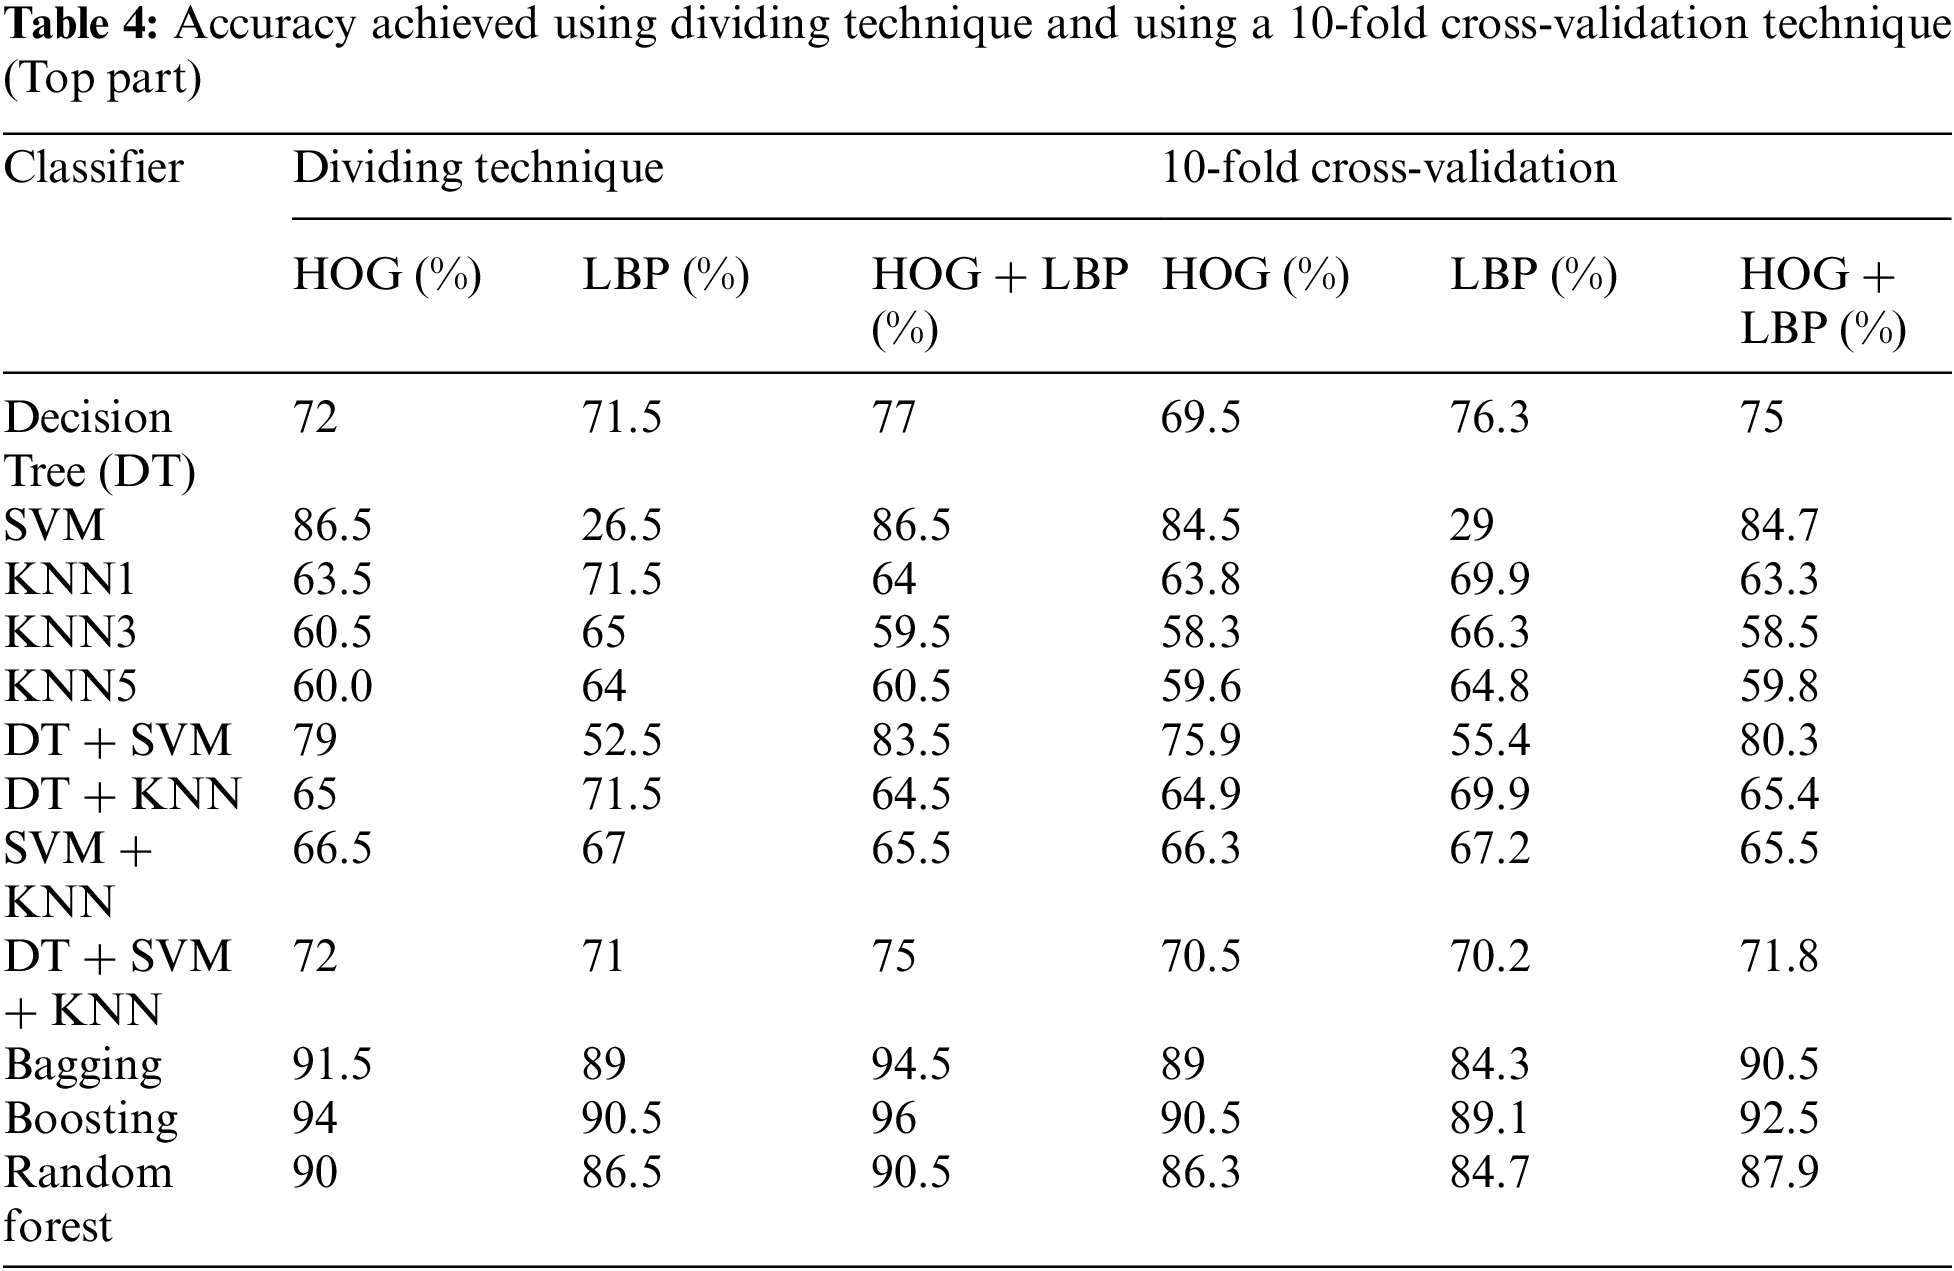
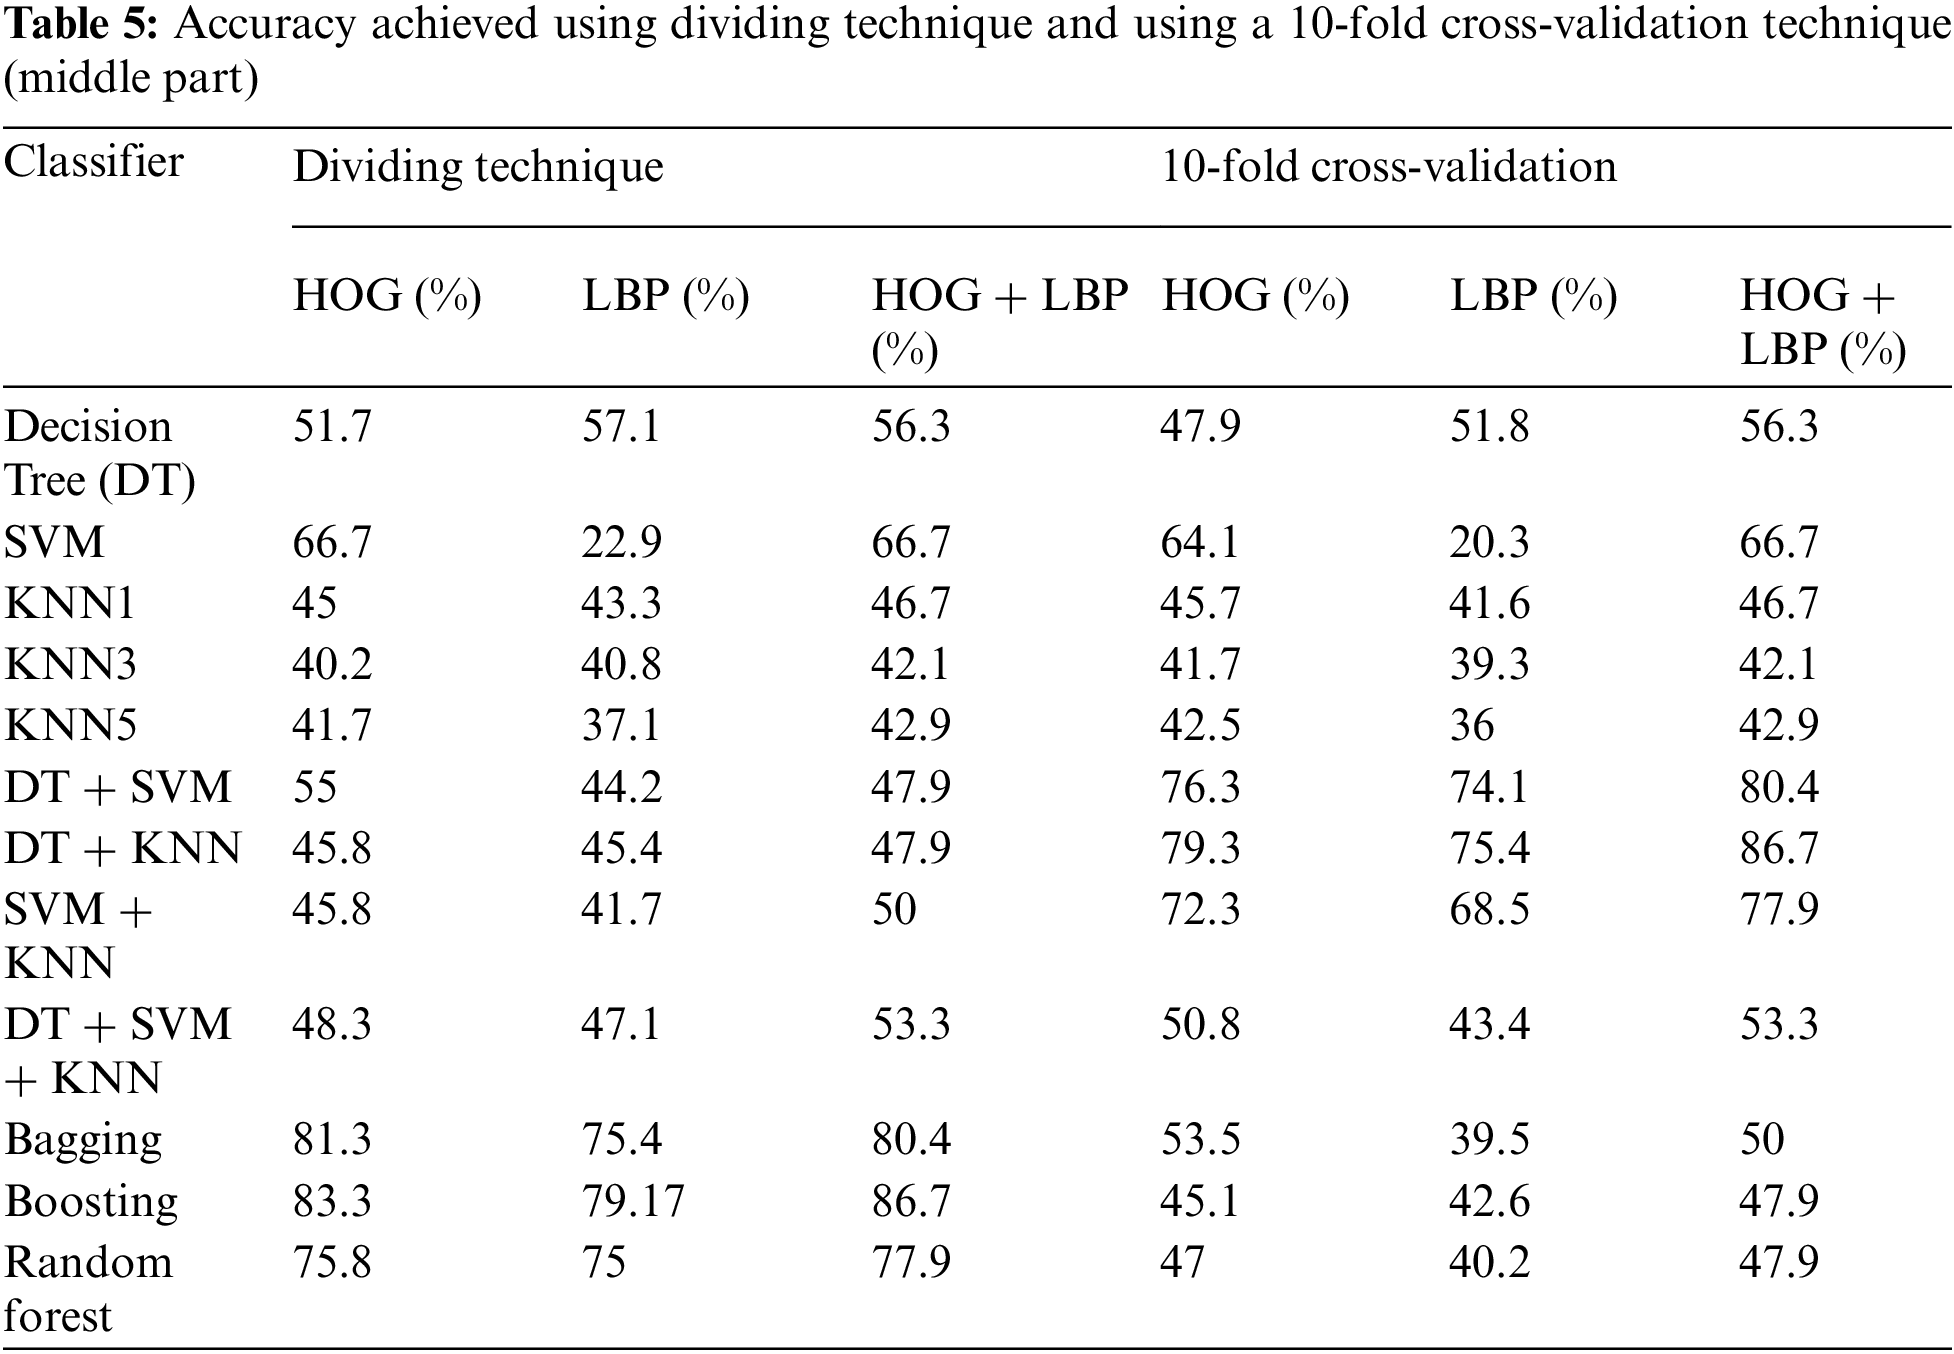


Figure 6: The accuracy achieved using the dividing technique (Top part)

Figure 7: Accuracy was achieved using a 10-fold cross-validation technique (Top part)
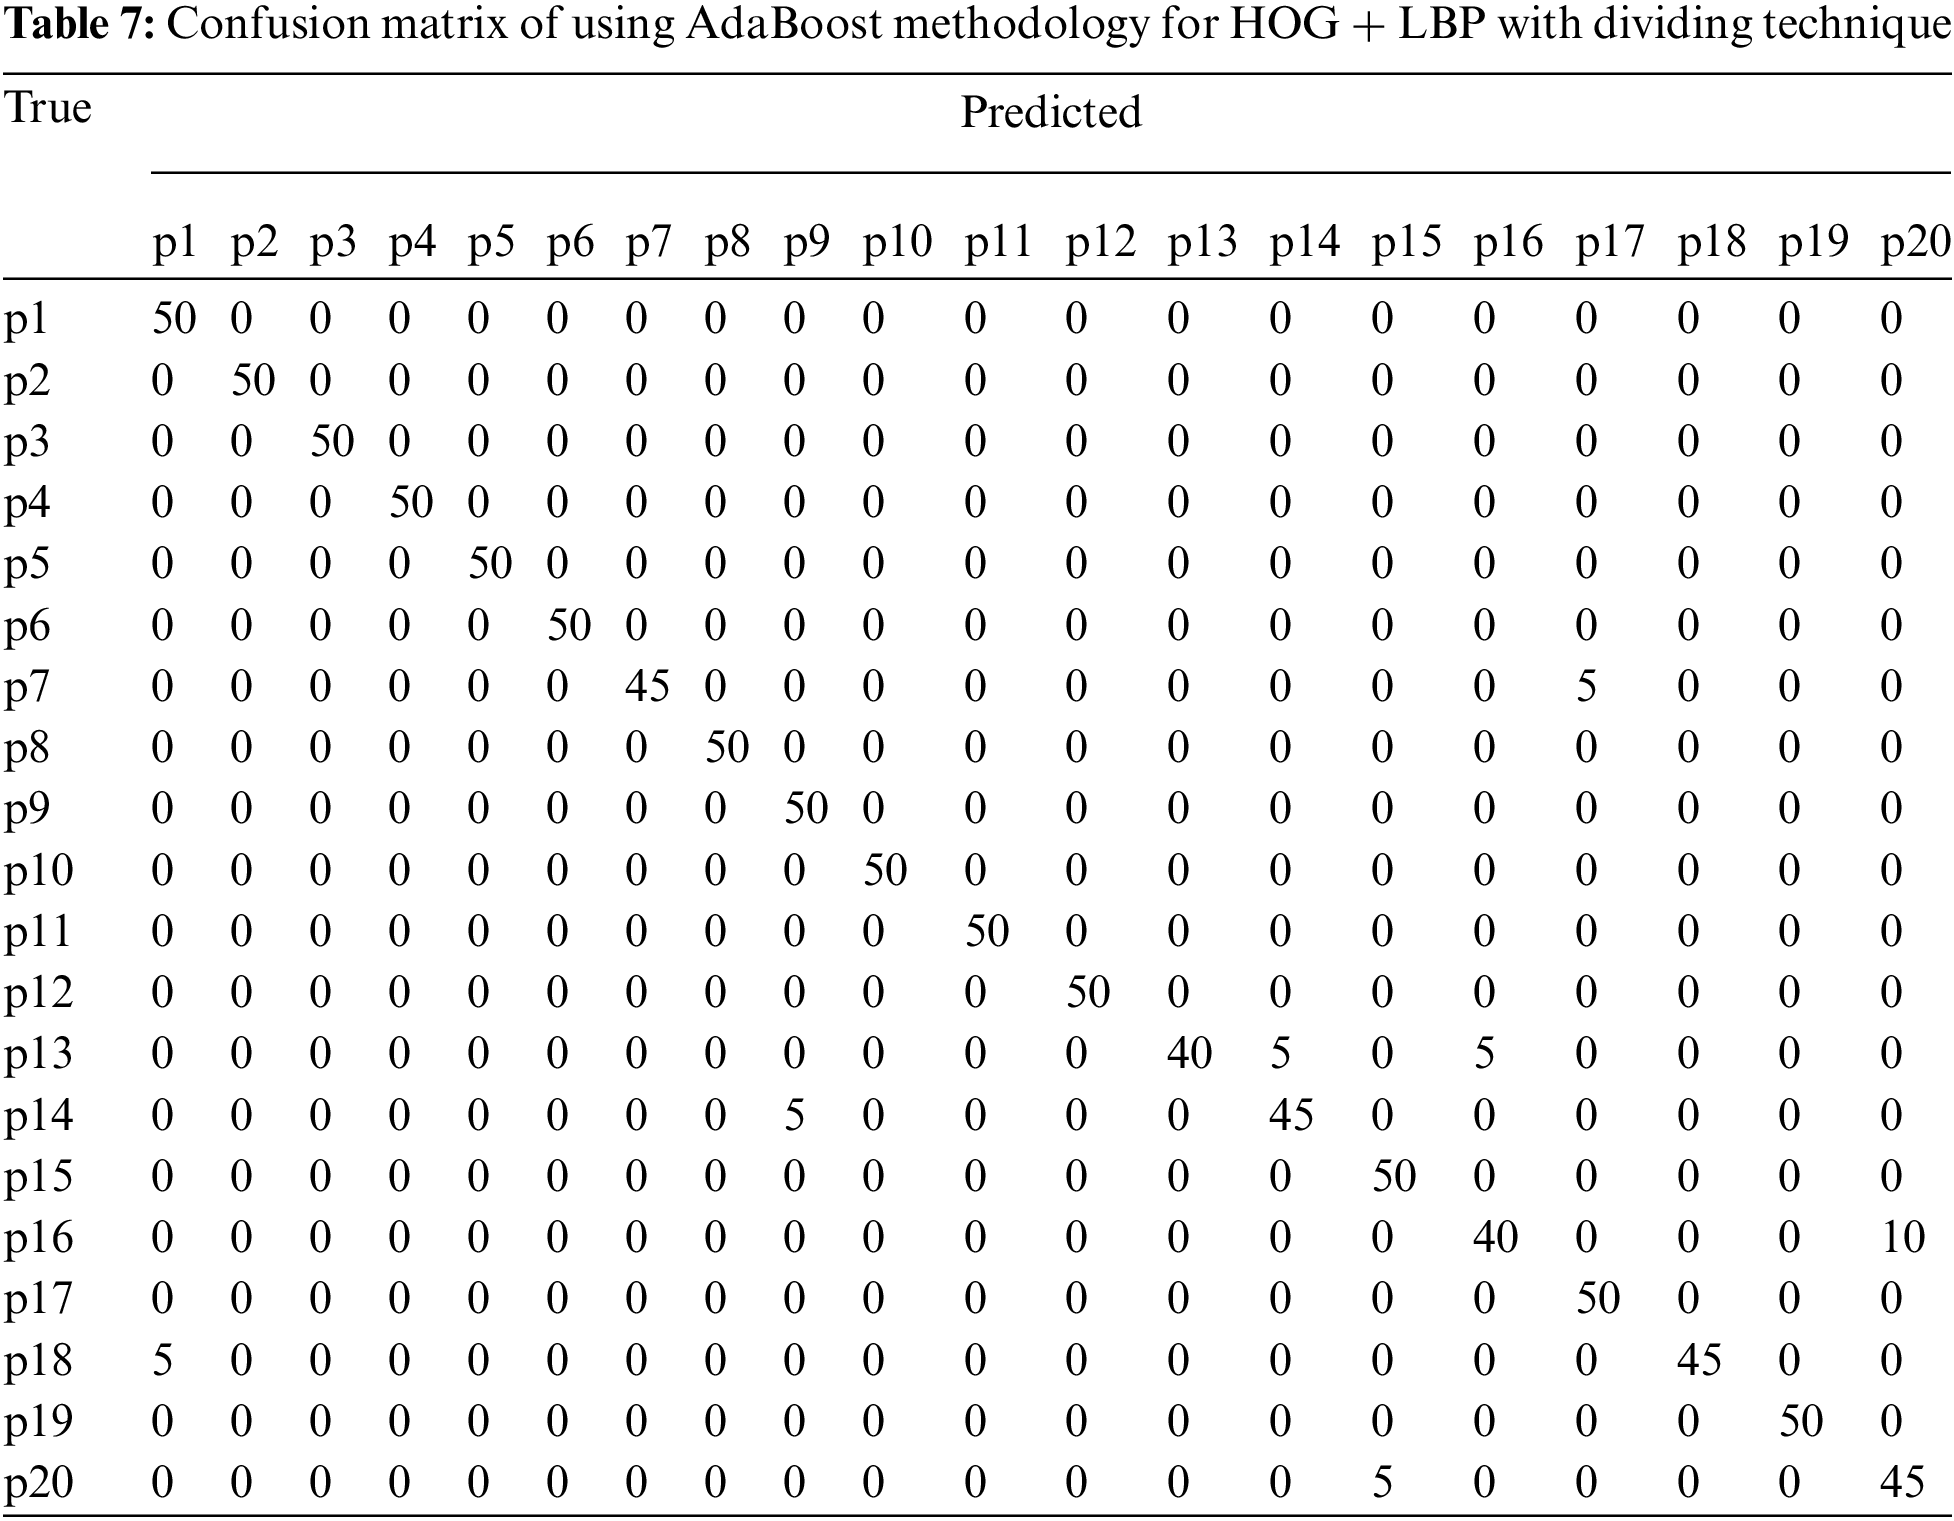
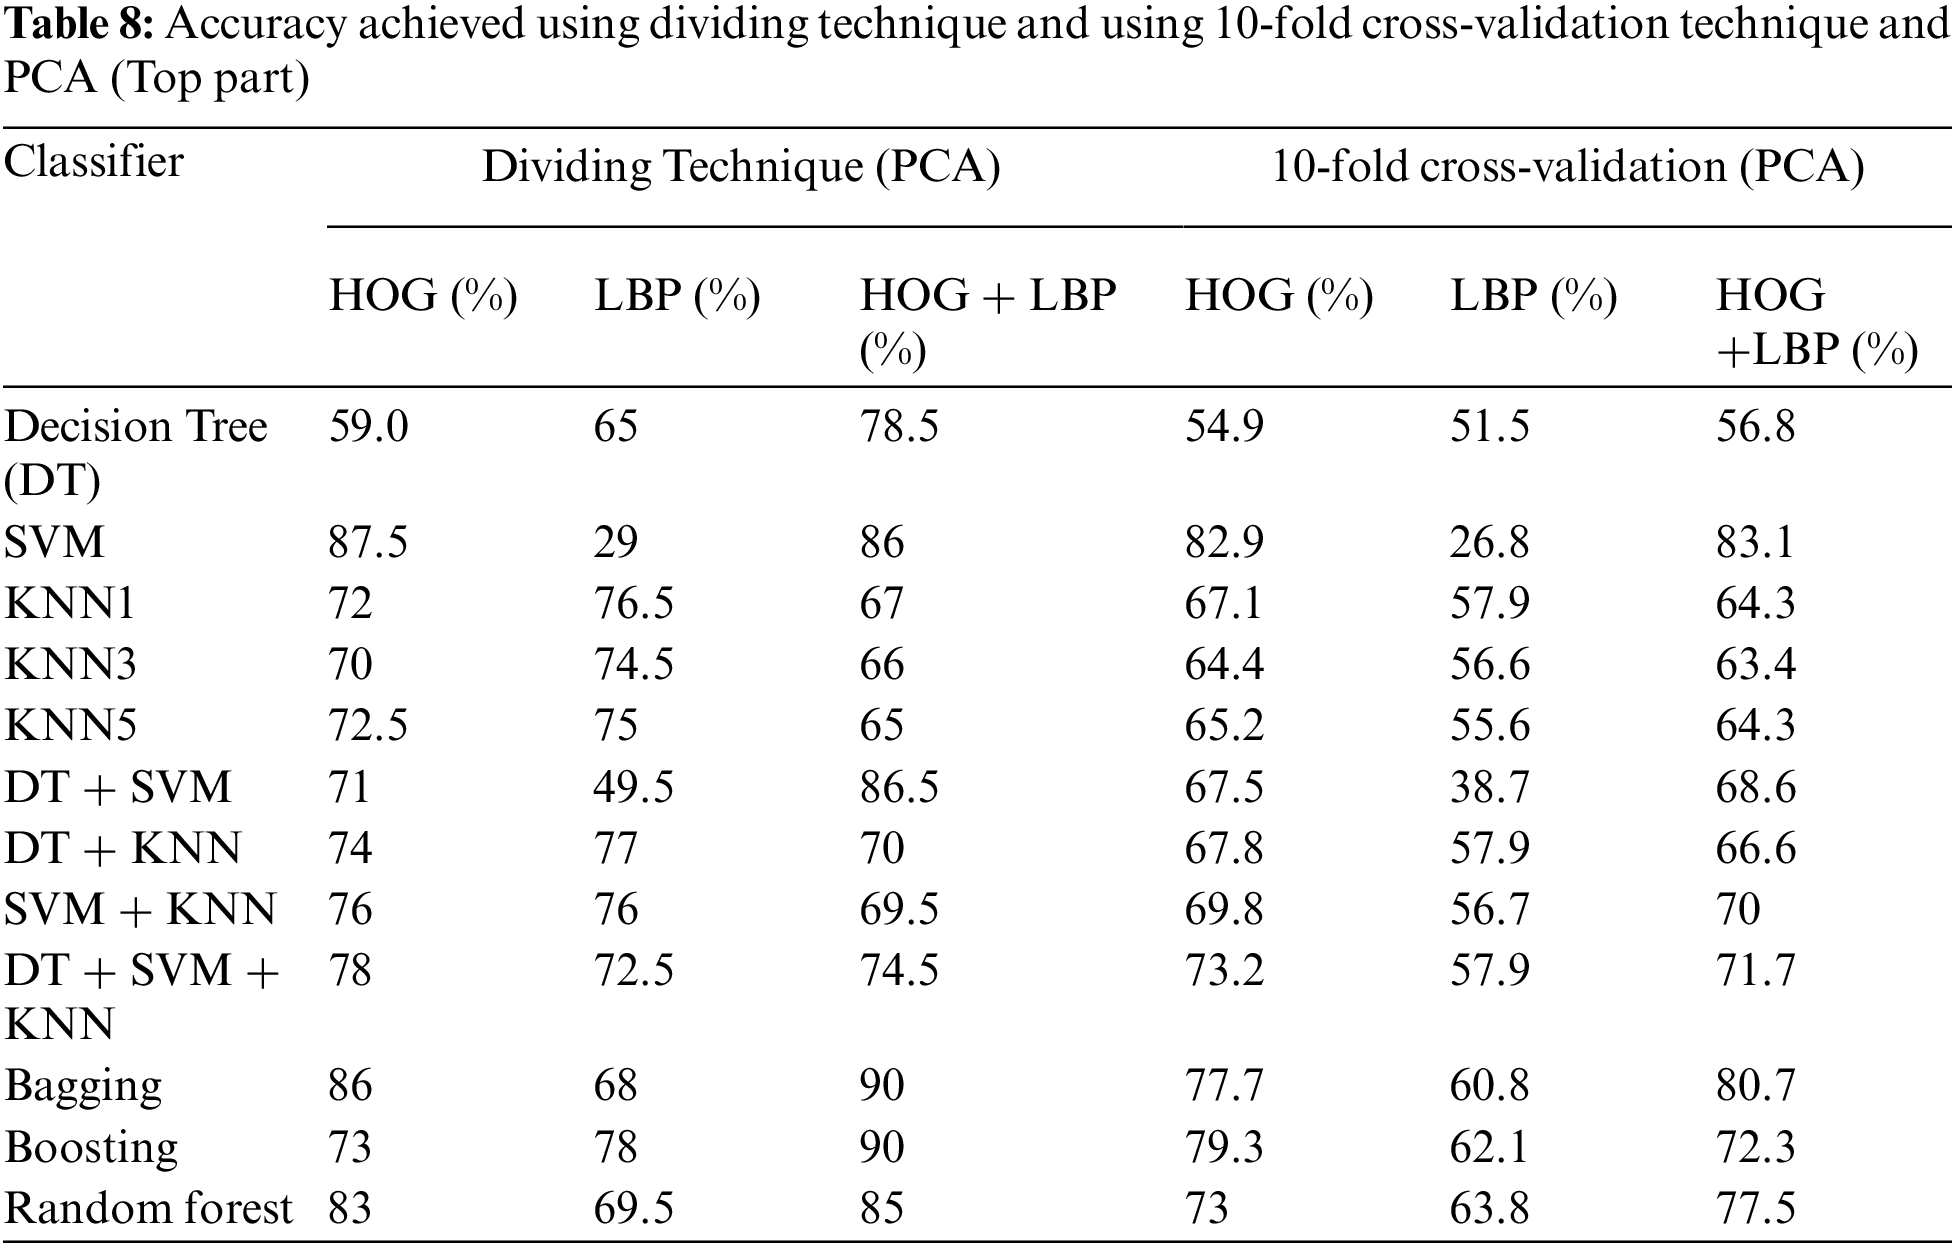

Figure 8: Accuracy achieved using dividing technique and PCA (Top part)

Figure 9: Accuracy achieved using a 10-fold cross-validation technique (Top part)
4.5 Comparison with Other Techniques
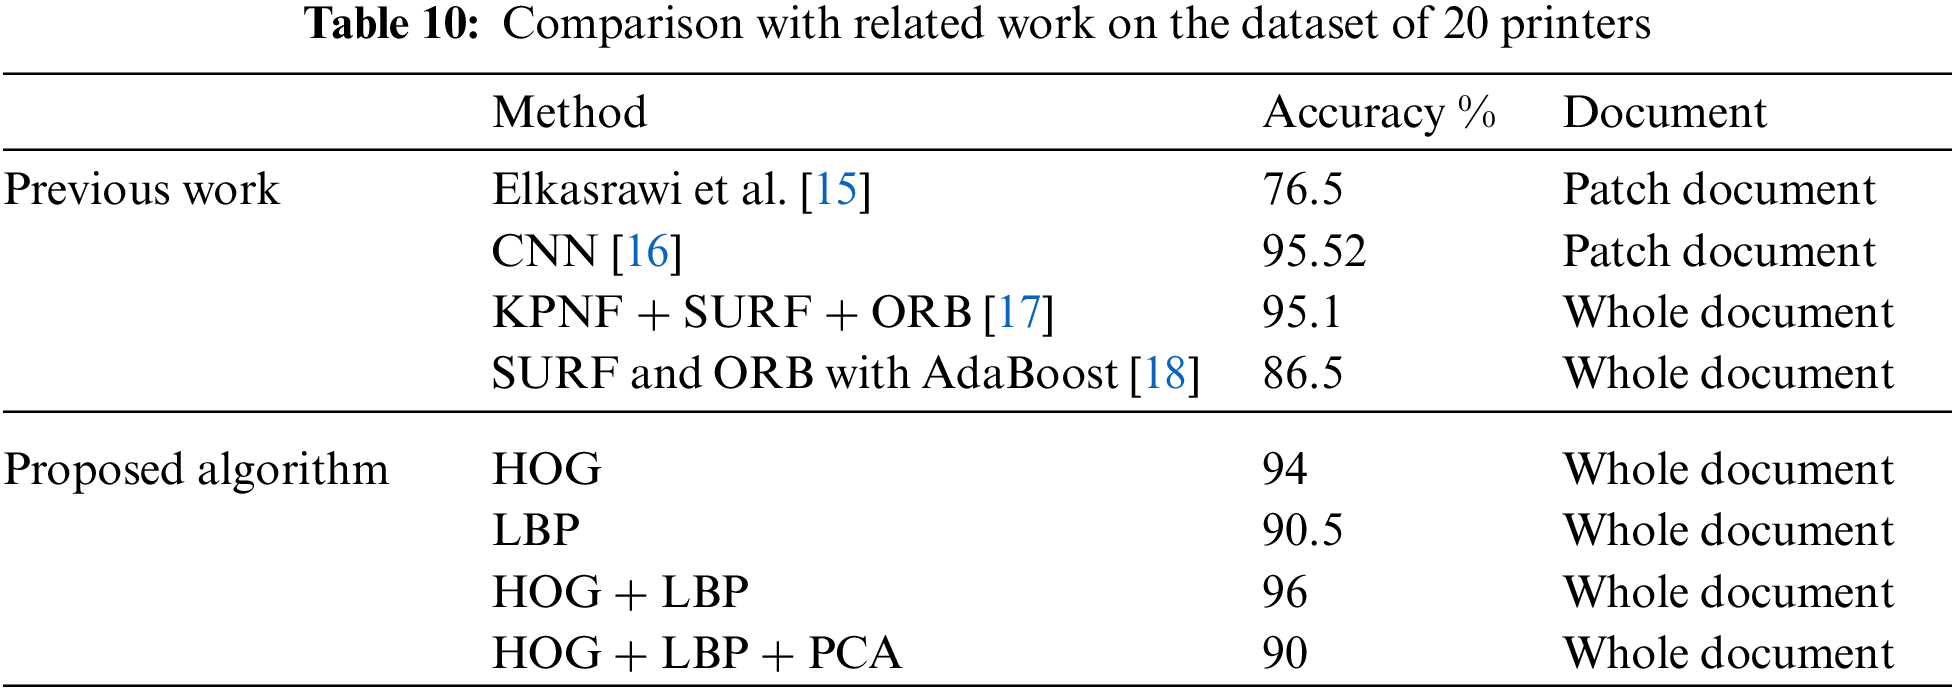
Despite the fact that much research on SPI has been proposed, it has all been analyzed using different datasets and experimental setups. As previously mentioned, many studies employ individual characters in a text-dependent framework for experimental purposes. Elkasrawi et al. [15], CNN [16], KPNF + SURF + ORB [17], and SURF and ORB with AdaBoost [18] are some current algorithms that the proposed technique is compared to. Comparison with related work on the dataset of 20 printers is highlighted in Tab. 10. On both textural and deep learned features, our proposed algorithm employing HOG and LBP with Adaboost outperforms [15–17] and [18], as shown in Fig. 10. It is obvious that the proposed algorithm using both HOG and LBP and testing the whole document outperforms the other four algorithms previously reported in literature.

Figure 10: Comparison with related work on the dataset of 20 printers
This paper proposes a text-independent algorithm for detecting document forgeries based on source printer identification SPI. The classifier’s goal is to determine the type of printer that produced the printed documents. The document classifier can classify an odd document out of several tested documents. In this research, the image is partitioned into three parts: top, middle, and bottom. HOG and LBP are used as feature extraction methodologies. For printer identification, classification methodologies such as decision tree, k-NN, SVM, random forest, bagging, and boosting are considered. A public dataset of printed documents from various printers is used to validate the results. Several experiments with multiple classifiers were performed, and the most efficient classifier was chosen. The algorithm was trained and tested for all three parts. However, the Top part yielded the best results because it contains most of the printer’s fingerprints. The AdaBoost classifier achieves the highest classification accuracy (96%) on our proposed algorithm. The proposed algorithm is compared to four recently published algorithms that used the same dataset and gives better classification accuracy.
Funding Statement: The authors received no specific funding for this study.
Conflicts of Interest: The authors declare that they have no conflicts of interest to be reported regarding the present study.
1. X. R. Zhang, W. F. Zhang, W. Sun, X. M. Sun and S. K. Jha, “A robust 3-D medical watermarking based on wavelet transform for data protection,” Computer Systems Science & Engineering, vol. 41, no. 3, pp. 1043–1056, 2022. [Google Scholar]
2. X. R. Zhang, X. Sun, X. M. Sun, W. Sun and S. K. Jhan, “Robust reversible audio watermarking scheme for telemedicine and privacy protection,” Computer Systems Science & Engineering, vol. 71, no. 2, pp. 3035–3050, 2022. [Google Scholar]
3. A. K. Mikkilineni, P. -J. Chiang, G. N. Ali, G. T. C. Chiu, J. P. Allebach et al., “Printer identification based on graylevel co-occurrence features for security and forensic applications,” in Security, Steganography, and Watermarking of Multimedia Contents VII, San Jose, California, USA, vol. 5681, pp. 430–440, 2005. [Google Scholar]
4. B. Kumar Sharma and M. Kaur Purba, “A study of certain characteristic features of various printed documents to determine the type printer used in forensic investigations,” Turkish Journal of Computer and Mathematics Education (TURCOMAT), vol. 12, no. 12, pp. 1070–1076, 2021. [Google Scholar]
5. A. Bashir, H. Abass, Y. A. Fadlalla and S. Khartoum-Sudan, “A review: Strategies for recognizing forgery in identity documents,” International Journal of Computer Science Trends and Technology (IJCST), vol. 8, no. 5, pp. 51–60, 2020. [Google Scholar]
6. H. Jain, S. Joshi, G. Gupta and N. Khanna, “Passive classification of source printer using text-line-level geometric distortion signatu from scanned images of printed documents,” Multimedia Tools and Applications, vol. 79, no. 11–12, pp. 7377–7400, 2020. [Google Scholar]
7. S. Sarode, U. Khandare, S. Jadhav, A. Jannu, V. Kamble et al., “Document manipulation detection and authenticity verification using machine learning and blockchain,” International Research Journal of Engineering and Technology(IRJET), vol. 7, no. 5, pp. 4758–4763, 2020. [Google Scholar]
8. M. J. Tsai, J. S. Yin, I. Yuadi and J. Liu, “Digital forensics of printed source identification for Chinese characters,” Multimedia Tools and Applications, vol. 73, no. 3, pp. 2129–2155, 2014. [Google Scholar]
9. S. Shang, N. Memon and X. Kong, “Detecting documents forged by printing and copying,” EURASIP Journal on Advances in Signal Processing, vol. 2014, no. 1, pp. 1–13, 2014. [Google Scholar]
10. A. Ferreira, L. C. Navarro, G. Pinheiro, J. A. do. Santos and A. Rocha, “Laser printer attribution: Exploring new features and beyond,” Forensic Science International, vol. 247, pp. 105–125, 2015. [Google Scholar]
11. S. Joshi and N. Khanna, “Single classifier-based passive system for source printer classification using local texture features,” IEEE Transactions on Information Forensics and Security, vol. 13, no. 7, pp. 1603–1614, 2018. [Google Scholar]
12. A. Ferreira, L. Bondi, P. Bestagini, J. Huang, S. Tubaro et al., “Data-driven feature characterization techniques for laser printer attribution,” IEEE Transactions on Information Forensics and Security, vol. 12, no. 8, pp. 1860–1873, 2017. [Google Scholar]
13. M. J. Tsai, I. Yuadi and Y. H. Tao, “Decision-theoretic model to identify printed sources,” Multimedia Tools and Applications, vol. 77, no. 20, pp. 27543–27587, 2018. [Google Scholar]
14. M. J. Tsai, Y. H. Tao and I. Yuadi, “Deep learning for printed document source identification,” Signal Processing: Image Communication, vol. 70, pp. 184–198, 2019. [Google Scholar]
15. S. Elkasrawi and F. Shafait, “Printer identification using supervised learning for document forgery detection,” in Proc. 11th IAPR Int. Workshop on Document Analysis Systems, DAS 2014, Tours, France, vol. 1, pp. 146–150, 2014. [Google Scholar]
16. M. Bibi, A. Hamid, M. Moetesum and I. Siddiqi, “Document forgery detection using printer source identification-A text-independent approach,” in 2019 Int. Conf. on Document Analysis and Recognition Workshops, (ICDARW), Sydney, NSW, Australia, vol. 8, pp. 7–12, 2019. [Google Scholar]
17. S. Gupta and M. Kumar, “Forensic document examination system using boosting and bagging methodologies,” Soft Computing, vol. 24, no. 7, pp. 5409–5426, 2020. [Google Scholar]
18. M. Kumar, S. Gupta and N. Mohan, “A computational approach for printed document forensics using SURF and ORB features,” Soft Computing, vol. 24, no. 17, pp. 13197–13208, 2020. [Google Scholar]
19. J. Gebhardt, M. Goldstein, F. Shafait and A. Dengel, “Document authentication using printing technique features and unsupervised anomaly detection,” in Proc. 12th Int. Conf. on Document Analysis and Recognition, Washington (ICDARDC, USA, pp. 479–483, 2013. [Google Scholar]
20. F. A. I. Achyunda Putra, F. Utaminingrum and W. F. Mahmudy, “HOG feature extraction and KNN classification for detecting vehicle in the highway,” Indonesian Journal of Computing and Cybernetics Systems(IJCCS), vol. 14, no. 3, pp. 231–242, 2020. [Google Scholar]
21. C. Sudha Sree, “Survey on extraction of texture based features using local binary pattern,” Accessed: Nov. 19, 2021. [Online]. Available: https://www.ijert.org. [Google Scholar]
22. T. Ojala, M. Pietikäinen and D. Harwood, “A comparative study of texture measures with classification based on featured distributions,” Pattern Recognition, vol. 29, no. 1, pp. 51–59, 1996. [Google Scholar]
23. S. Fekri-Ershad, S. Fakhrahmad and F. Tajeripour, “Impulse noise reduction for texture images using real word spelling correction algorithm and local binary patterns,” International Arab Journal of Information, vol. 15, no. 6, pp. 1024–1030, 2018. [Google Scholar]
24. S. B. Kotsiantis, “Supervised machine learning: A review of classification techniques,” Informatica, vol. 31, pp. 249–268, 2007. [Google Scholar]
25. B. Charbuty and A. Abdulazeez, “Classification based on becision tree algorithm for machine learning,” Journal of Applied Science and Technology Trends, vol. 2, no. 1, pp. 20–28, 2021. [Google Scholar]
26. G. Stein, B. Chen, A. S. Wu and K. A. Hua, “Decision tree classifier for network intrusion detection with GA-based feature selection,” in Proc. 43rd Annual Southeast Regional Conf., Kennesaw, Georgia, Alabama, USA, vol. 2, pp. 2136–2141, 2005. [Google Scholar]
27. M. A. Jabbar, B. L. Deekshatulu and P. Chandra, “Classification of heart disease using K-nearest neighbor and genetic algorithm,” Procedia Technology, vol. 10, pp. 85–94, 2013. [Google Scholar]
28. J. H. Choi, H. Y. Lee and H. K. Lee, “Color laser printer forensic based on noisy feature and support vector machine classifier,” Multimedia Tools and Applications, vol. 67, no. 2, pp. 363–382, 2013. [Google Scholar]
29. L. Breiman, “Random forests,” Machine Learning, vol. 45, no. 1, pp. 5–32, 2001. [Google Scholar]
30. Y. Freund and R. E. Schapire, “A short introduction to boosting,” Journal of Japanese Society for Artificial Intelligence, vol. 14, no. 5, pp. 771–780, 1999. [Google Scholar]
31. R. Polikar, “Ensemble based systems in decision making,” IEEE Circuits and Systems Magazine, vol. 6, no. 3, pp. 21–44, 2006. [Google Scholar]
32. P. Y. Taser, “Application of bagging and boosting approaches using decision tree-based algorithms in diabetes risk prediction,” in Proc. 7th Int. Management Information Systems Conf., MDPI, Basel, Switzerland, vol. 74, no. 1, pp. 1–9, 2021. [Google Scholar]
33. L. Zhan, Y. Zhu and Z. Mo, “An image splicing detection method based on PCA minimum eigenvalues,” Journal of Information Hiding and Multimedia Signal Processing, vol. 7, no. 3, pp. 610–619, 2016. [Google Scholar]
34. N. Khanna, A. K. Mikkilineni, G. T. C. Chiu, J. P. Allebach and E. J. Delp, “Scanner identification using sensor pattern noise,” in Proc. Security, Steganography, and Watermarking of Multimedia Contents IX, San Jose, CA, United States, vol. 6505, pp. 65051K(1-112007. [Google Scholar]
35. J. G. Han, T. H. Park, Y. H. Moon and I. K. Eom, “Efficient markov feature extraction method for image splicing detection using maximization and threshold expansion,” Journal of Electronic Imaging, vol. 25, no. 2, pp. 023031–023038, 2016. [Google Scholar]
36. Y. Zhang, J. Goh, L. L. Win and V. Thing, “Image region forgery detection: A deep learning approach,” in Proc. Singapore Cyber-Security Conf. (SG-CRC), Singapore, USA, vol. 14, pp. 1–11, 2016. [Google Scholar]
37. S. Q. Saleh, M. Hussain, G. Muhammad and G. Bebis, “Evaluation of image forgery detection using multi-scale weber ocal descriptors,” International Journal on Artificial Intelligence Tools, vol. 8034, no. 2, pp. 416–424, 2013. [Google Scholar]
 | This work is licensed under a Creative Commons Attribution 4.0 International License, which permits unrestricted use, distribution, and reproduction in any medium, provided the original work is properly cited. |