DOI:10.32604/cmc.2022.028184
| Computers, Materials & Continua DOI:10.32604/cmc.2022.028184 | |
| Article |
Rough Sets Hybridization with Mayfly Optimization for Dimensionality Reduction
1Faculty of Computers and Artificial Intelligence, Benha University, Benha, 13518, Egypt
2College of Computer and Information Sciences, Prince Sultan University, Riyadh, 11586, Saudi Arabia
3Faculty of Computer Studies, Arab Open University, Cairo, Egypt
4Faculty of Information Technology and Computer Science, Nile University, Shikh Zaid, Egypt
*Corresponding Author: Ahmad Taher Azar. Emails: ahmad.azar@fci.bu.edu.eg; aazar@psu.edu.sa
Received: 04 February 2022; Accepted: 24 March 2022
Abstract: Big data is a vast amount of structured and unstructured data that must be dealt with on a regular basis. Dimensionality reduction is the process of converting a huge set of data into data with tiny dimensions so that equal information may be expressed easily. These tactics are frequently utilized to improve classification or regression challenges while dealing with machine learning issues. To achieve dimensionality reduction for huge data sets, this paper offers a hybrid particle swarm optimization-rough set PSO-RS and Mayfly algorithm-rough set MA-RS. A novel hybrid strategy based on the Mayfly algorithm (MA) and the rough set (RS) is proposed in particular. The performance of the novel hybrid algorithm MA-RS is evaluated by solving six different data sets from the literature. The simulation results and comparison with common reduction methods demonstrate the proposed MA-RS algorithm’s capacity to handle a wide range of data sets. Finally, the rough set approach, as well as the hybrid optimization techniques PSO-RS and MA-RS, were applied to deal with the massive data problem. MA-hybrid RS’s method beats other classic dimensionality reduction techniques, according to the experimental results and statistical testing studies.
Keywords: Dimensionality reduction; metaheuristics; optimization algorithm; mayfly; particle swarm optimizer; feature selection
Creating big data applications has become increasingly important in recent years. Indeed, numerous businesses from diverse industries are becoming increasingly reliant on data-driven expertise. Traditional data methodologies and platforms, on the other hand, are less effective in large data settings. They have poor reactivity as well as a lack of scalability, performance, and accuracy. Much effort has been expended in addressing the troubling significant data concerns. As a result, numerous distributions and technologies have emerged. Dimension reduction is the process of converting a huge set of data into data with tiny dimensions so that equal information may be expressed easily. While dealing with machine learning concerns, these tactics are frequently employed to create stronger features for use in classification or regression tasks. In most circumstances, training a machine-learning model with multiple properties is a tough task. The appearance of vulnerable model overfitting is always proportional to the increase in model features. That resulted from the fact that not all of the features are usually significant. Some qualities, for example, may simply increase the volume of the data. To address this issue, dimensionality reduction (DR) methods are used [1–6]. Dimensionality Reduction is a preprocessing procedure that removes unnecessary and redundant data from the data set to be processed [7].
Feature extraction (FE) and feature selection (FS) are the two DR approaches [8]. The goal of projecting actual high-dimensional data into a new low-dimensional feature space in the first class is to extract more features. FS enhances generalizability by reducing overfitting, computation time, and memory requirements, as well as improving classification accuracy by establishing an accurate prediction model [9,10]. In the final class, however, the FS techniques choose the fewest features that adequately represent the original data set.
To use FS, it’s important to determine how to select a feature set and then analyze the selected subset. Following the selection of a search method, three fundamental algorithms will be examined: complete, random, and heuristic search algorithms. As the name implies, all possible feature subset combinations should be thoroughly investigated. Because it considers all of the subsets in the search region, it is obvious that a comprehensive search will aid in locating the best one. However, because to the exponential growth of the number of features in a dataset (2 M, where M is the number of features), accurate approaches for large-scale datasets are slow and impracticable. A random search can also be used as an alternative. In the worst-case situation, a random search will be as difficult as an in-depth search [11]. A complete search with high-dimensional data records is impossible since it would require a large amount of processing power to determine which solution was the best, and in the worst scenario, a random search might be as good as a full search. The third strategy is capable of making “educational judgments” and directing the search process. Such heuristic information is task-dependent and is frequently inapplicable.
Metaheuristic algorithms are search methods that can be utilized for a variety of purposes [12]. The literature demonstrates how beneficial and efficient this strategy is when compared to other techniques such as complete and random searches [13]. Metaheuristic techniques include Genetic Algorithm (GA), Particle Swarm Optimization (PSO), Ant Colony Optimization (ACO), and Differential Evolutionary (DE). They are all methods for determining the optimum solution to a problem, but they are not the only ones. The Whale Optimization Algorithm (WOA), Harris Hawks Optimizer (HHO), and Gray Wolf Optimizer are a few of the new methodologies being used (GWO) [14–16]. Zervoudakis et al. [17] proposed the Mayfly algorithm (MA), which is a creative approach of dealing with FS difficulties. Immature mayflies grow and change for a long time as aquatic nymphs before becoming adult mayflies. A few meters above the water, they form a group of male adults. In this way, they might attract ladies. They execute a wedding dance in which they move up and down in a particular beat. The female mayflies then congregate to mate. Particle swarm optimization (PSO) is a metaheuristic that is based on the premise that people work together to solve issues. PSO was founded in 1995 by Kennedy and Eberhart [18]. The PSO process begins with a random selection of particles (possible solutions). It then attempts to enhance the solutions using a quality metric (fitness function). Particles are moved across the search space using a simple set of mathematical equations that move them in such a way that they resemble how particles communicate with one another.
Missing-values ratio (MVR), low variance filter (LVF), high correlation filter (HCF), random forest (RF), principal component analysis (PCA), linear discriminant analysis (LDA), backward feature elimination (BFE), forward feature construction (FFC), and rough set (RS) theory are some methods for locating missing values [19] in a population (RS). RS theory is a creative mathematician’s solution to the problem of having insufficient information. The rough sets have been thought to be useful for a variety of purposes. Researchers in Artificial Intelligence (AI) and cognitive science feel that the rough set method is critical [20], particularly in machine learning, data mining, expert systems, approximate reasoning, and pattern recognition.
In this paper, new supervised feature selection strategies for diverse data sets are presented, which are based on a hybridization of the Mayfly algorithm-rough set MA-RS, Particle Swarm Optimization-Rough Set (PSO-RS), and other standard dimensionality reduction methodologies [21]. Experimental results on a variety of typical datasets show that the suggested strategy is both efficient and superior to current feature selection approaches. The results showed that reducing dimensionality could reduce overfitting while keeping performance comparable to or better than the original. According to the findings, the hybrid algorithm MA-RS outperforms all other algorithms.
The rest of the paper is organized as follows: Section 2 presents the related work of this study. Section 3 presents the preliminaries of this study. The proposed method of a hybrid MA with the rough set algorithm is discussed in Section 4. Experimental analysis and results are presented in Section 5. Conclusions with future work are presented in Section 6.
In the literature, several FS algorithms employ metaheuristic algorithms. PSO, for example, was frequently utilized in FS approaches [4,6]. The PSO algorithm’s performance with various update methodologies for the inertia weight parameter was investigated. Dimensionality reduction was a huge stride forward in many industries because it made it easier to group, display, or compress large amounts of data. Data dispersed across a vast region could be relocated to a smaller area with fewer dimensions [22]. In this situation, the purpose was to decrease the impact of large data difficulties [23]. Several advancements have contributed to minimize the overall size of various objects. When analyzing nonparametric data, linear approaches such as Principal component analysis (PCA) are commonly used. PCA was originally introduced by Pearson [24] and developed independently by Hotelling [25]. Approaches like this are useful in complex or nonlinear situations.
High-dimensional data was widespread in computers, and each of these datasets took up less space than the entire dataset. To better characterize this lower-dimensional space, several dimensional reduction approaches have been improved. The data map reduced the amount of signs indicating supervised learning isn’t working while also making them more visible. In the last few years, there has been a substantial increase in the use of biologically inspired hybrid algorithms in optimization and feature selection. Hybrid models were the best choice for many optimization issues [4]. Li et al. in [26] proposed a feature selection approach that ranks features in a high-dimensional dataset by combining feature weighted k-nearest neighbors algorithm (K-NN) and the real-valued GA algorithm. Hosseini et al. In [27] proposed Simulated annealing as a feature selection method in flash-flood hazard assessment. Mafarja & Mirjalili in [28] proposed a hybrid WOA with simulated annealing (SA) technique. It used two hybrid models: The low-level teamwork hybrid and the high-level hybrid. When the SA was incorporated into the WOA, it became more powerful in terms of exploitation. Following the WOA, the SA was employed in the second model to im-prove it beyond the best overall solution. In [29], a hybrid method using PSO and the flower pollination algorithm have been used as feature selection techniques for software effort prediction and on popular University of California Irvine (UCI) repository [30] datasets.
The authors in [31] demonstrated a hybrid FS technique that integrated the Differential evolution (DE) and Artificial bee colony algorithm (ABC) algorithms to improve their performance. The proposed hybrid technique solves the broad classification problem, as does data mining. The DE approach was combined with the binary mutation’s new phase, making it much more effective. To prevent becoming stuck in local optima (LO), the proposed technique modifies the bystander bee process (LO).
According to [32], swarm-based and evolutionary algorithms could be integrated to create a new hybrid biology-inspired algorithm. To integrate the search process with a selection operator and the grasshopper optimization algorithm (GOA), a concept known as evolutionary population dynamics (EPD) was developed. GOA enables the search to select the essential qualities based on correlation data. According to the findings of bio-logical approaches, the method can increase classification accuracy. The authors in [33] suggested a multi-label feature selection technique based on ant colony optimization (ACO) employing swarm intelligence. Using the multi-level knn (ML-knn) classifier, the method outperformed five state-of-the-art feature selection algorithms in nine well-known datasets.
In the literature, there are three types of hybrids like this one. Mohamed et al. [34] stated that WOA and GWO can be merged. Both algorithms included crossover and mutation operators. They were utilized to solve optimal power dispatch issues, demonstrating that the hybrid model outperforms standalone of GWO and WOA. The most serious issue with this hybrid is the high cost of operation. As a result, the WOA must be completed first, with the best response serving as the beginning point for the GWO that follows. Singh and Hachimi in [35] adapted WOA’s spiral equation into GWO and applied it to structural design problems. The authors in [36] developed a hybrid WOA and GWO strategy similar to [35] and applied it to data clustering methods. Although this hybrid method has numerous advantages, the authors used it for continuous improvement, hence it cannot deal with scenarios requiring binary variables. Too and Mirjalili in [37] presented the hyper learning binary dragonfly algorithm (HLBDA), a dragonfly-based method, which demonstrated improved performance in the classification of twenty-one datasets from the University of California Irvine (UCI) repository [30] and Arizona State University, as well as a coronavirus disease (COVID-19) dataset (2020).
Although these approaches have done well in certain areas of their applications, none of them have taken into account a hybridization with rough set feature selection task. To our knowledge, there are a limited number of metaheuristic algorithms combined with rough set feature selection problems. These constraints apply to the work presented in this publication. This work contributes to the literature by combining rough sets hybridization with the mayfly optimization methodology for feature selection and dimensionality reduction.
3 Preliminaries of Mayfly Algorithm
Butterflies belong to the order Ephemeroptera, which is a suborder of the insect order Palaeoptera. Mayflies (MA) are a type of butterfly in this order. These butterflies are most numerous in the UK around May, hence they’re known as Mayflies by the locals. Before becoming adult mayflies, immature mayflies spend a lengthy time as aquatic nymphs. Most men adults form a group a few meters above the sea. That is how men attempt to attract females. They execute a wedding dance in which they move up and down in a rhythmic manner. Female mayflies congregate in these swarms to mate. During mating, the eggs are dropped into the water, and the cycle begins again. Allan et al. [38] provides in-depth descriptions of the method described above.
Male mayfly flight: A male mayfly’s position is updated as in Eq. (1):
where
Female mayfly flight: is the female mayfly moves towards the males to breed. The following is an update to a female mayfly’s position [17]:
Mating Process: Crossover between mayflies is the process that begins with the selection of a male mayfly followed by the selection of a female mayfly. The selection is based on their fitness value, meaning that the best male breeds with the best female [17]. Following a crossing, two offspring are generated as:
Here
Mutation of a mayfly: The freshly created children are altered to improve the algorithm’s exploring ability. As explained in [17], a regularly randomly generated number is appended to the offspring’s variable.
To improve overall search efficiency, hybrid algorithms are developed by combining two or more algorithms. Researchers frequently aim to exploit the benefits of specific algorithms for the larger good, or so the thinking goes. It is questionable whether a hybrid can actually increase performance and discovering techniques to merge dis-similar algorithms [39]. As a result, two proposed hybrid techniques are implemented, and their performance is evaluated in this section. The names of two proposed hybrid techniques are MA-RS and PSO-RS. The structure of the proposed hybrid algorithm is shown in Fig. 1. The most important stage is generating precise, ready-to-use data. A preprocessing phase began by deleting any missing values from the dataset’s rows. Then, employ the “dimensionality reduction” approach (RS). The dataset is divided into two parts: training and testing. Using the looping function, various splits were examined, and the optimal split was 67–33. (67% of the samples were used as training samples and 33% as testing samples). To get the optimal option, differential evolution normalization for feature scaling is employed. For classification, three models Artificial Neural Networks (ANN), Random Forest Classifier (RFC), and Support Vector Machine (SVM) were chosen. The random search cross-validation (CV) method was used to select the best hyperparameter for each model. To validate models and avoid overfitting, five-fold cross validation is performed.
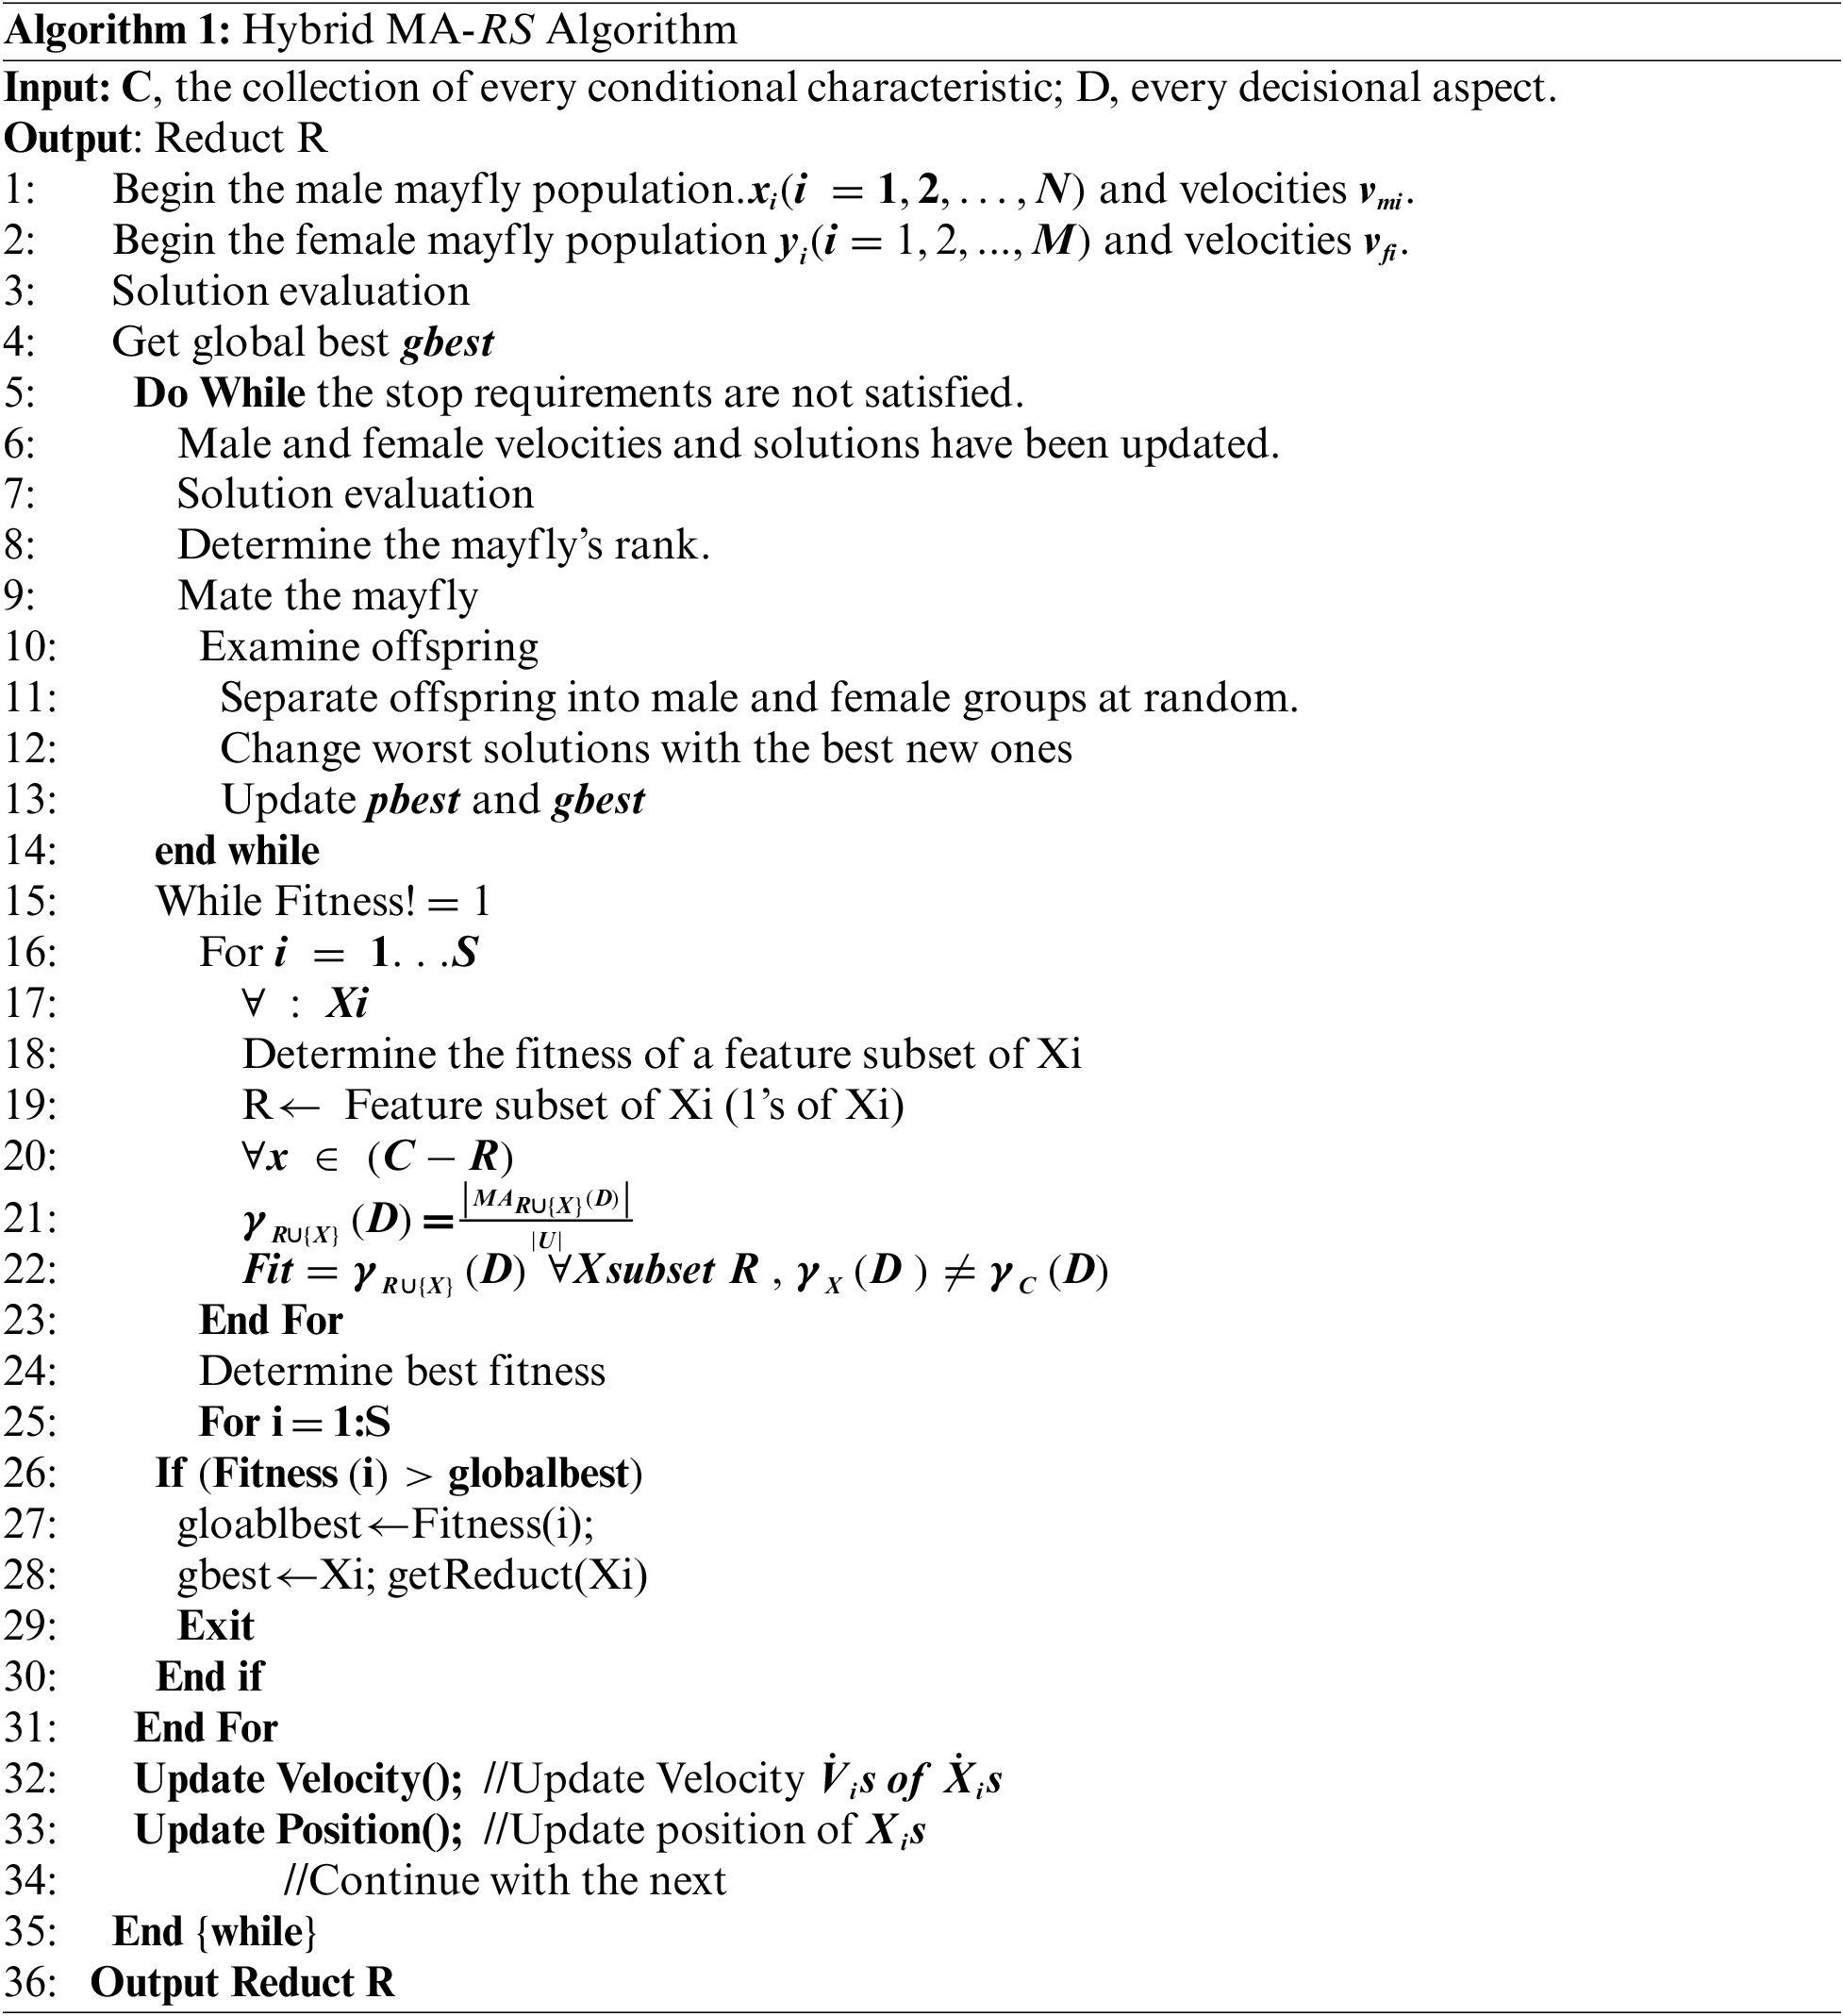
The pseudo-code of MA-RS algorithm is shown in Algorithm 1 to generate a redacted set. There is nothing in the set when it begins. It adds one by one. Begin with male mayflies. The fitness function of each mayfly is examined. As soon as feasible, the feature with the highest fitness level is chosen. It is designed with all of the possible combinations of this feature and other characteristics in mind. The compatibility of the qualities in various combinations is discovered. This post is the best because it is presently exceeding the best. Its location as well as its fitness are saved. The current behavior of mayflies is compared to the previous one. If the value exceeds global best fitness (Gbest), the mayfly position is established, and the global best fitness level changes. The location displays the best features discovered thus far, and it is saved in R. The procedure is repeated until the halting condition is met, which is usually a predetermined number of times. As a subset of features, an MA-R set is used. The approach determines the importance of each attribute subset based on its relevance to the decision attribute. Finally, the best particle is selected, see Fig. 1 below.
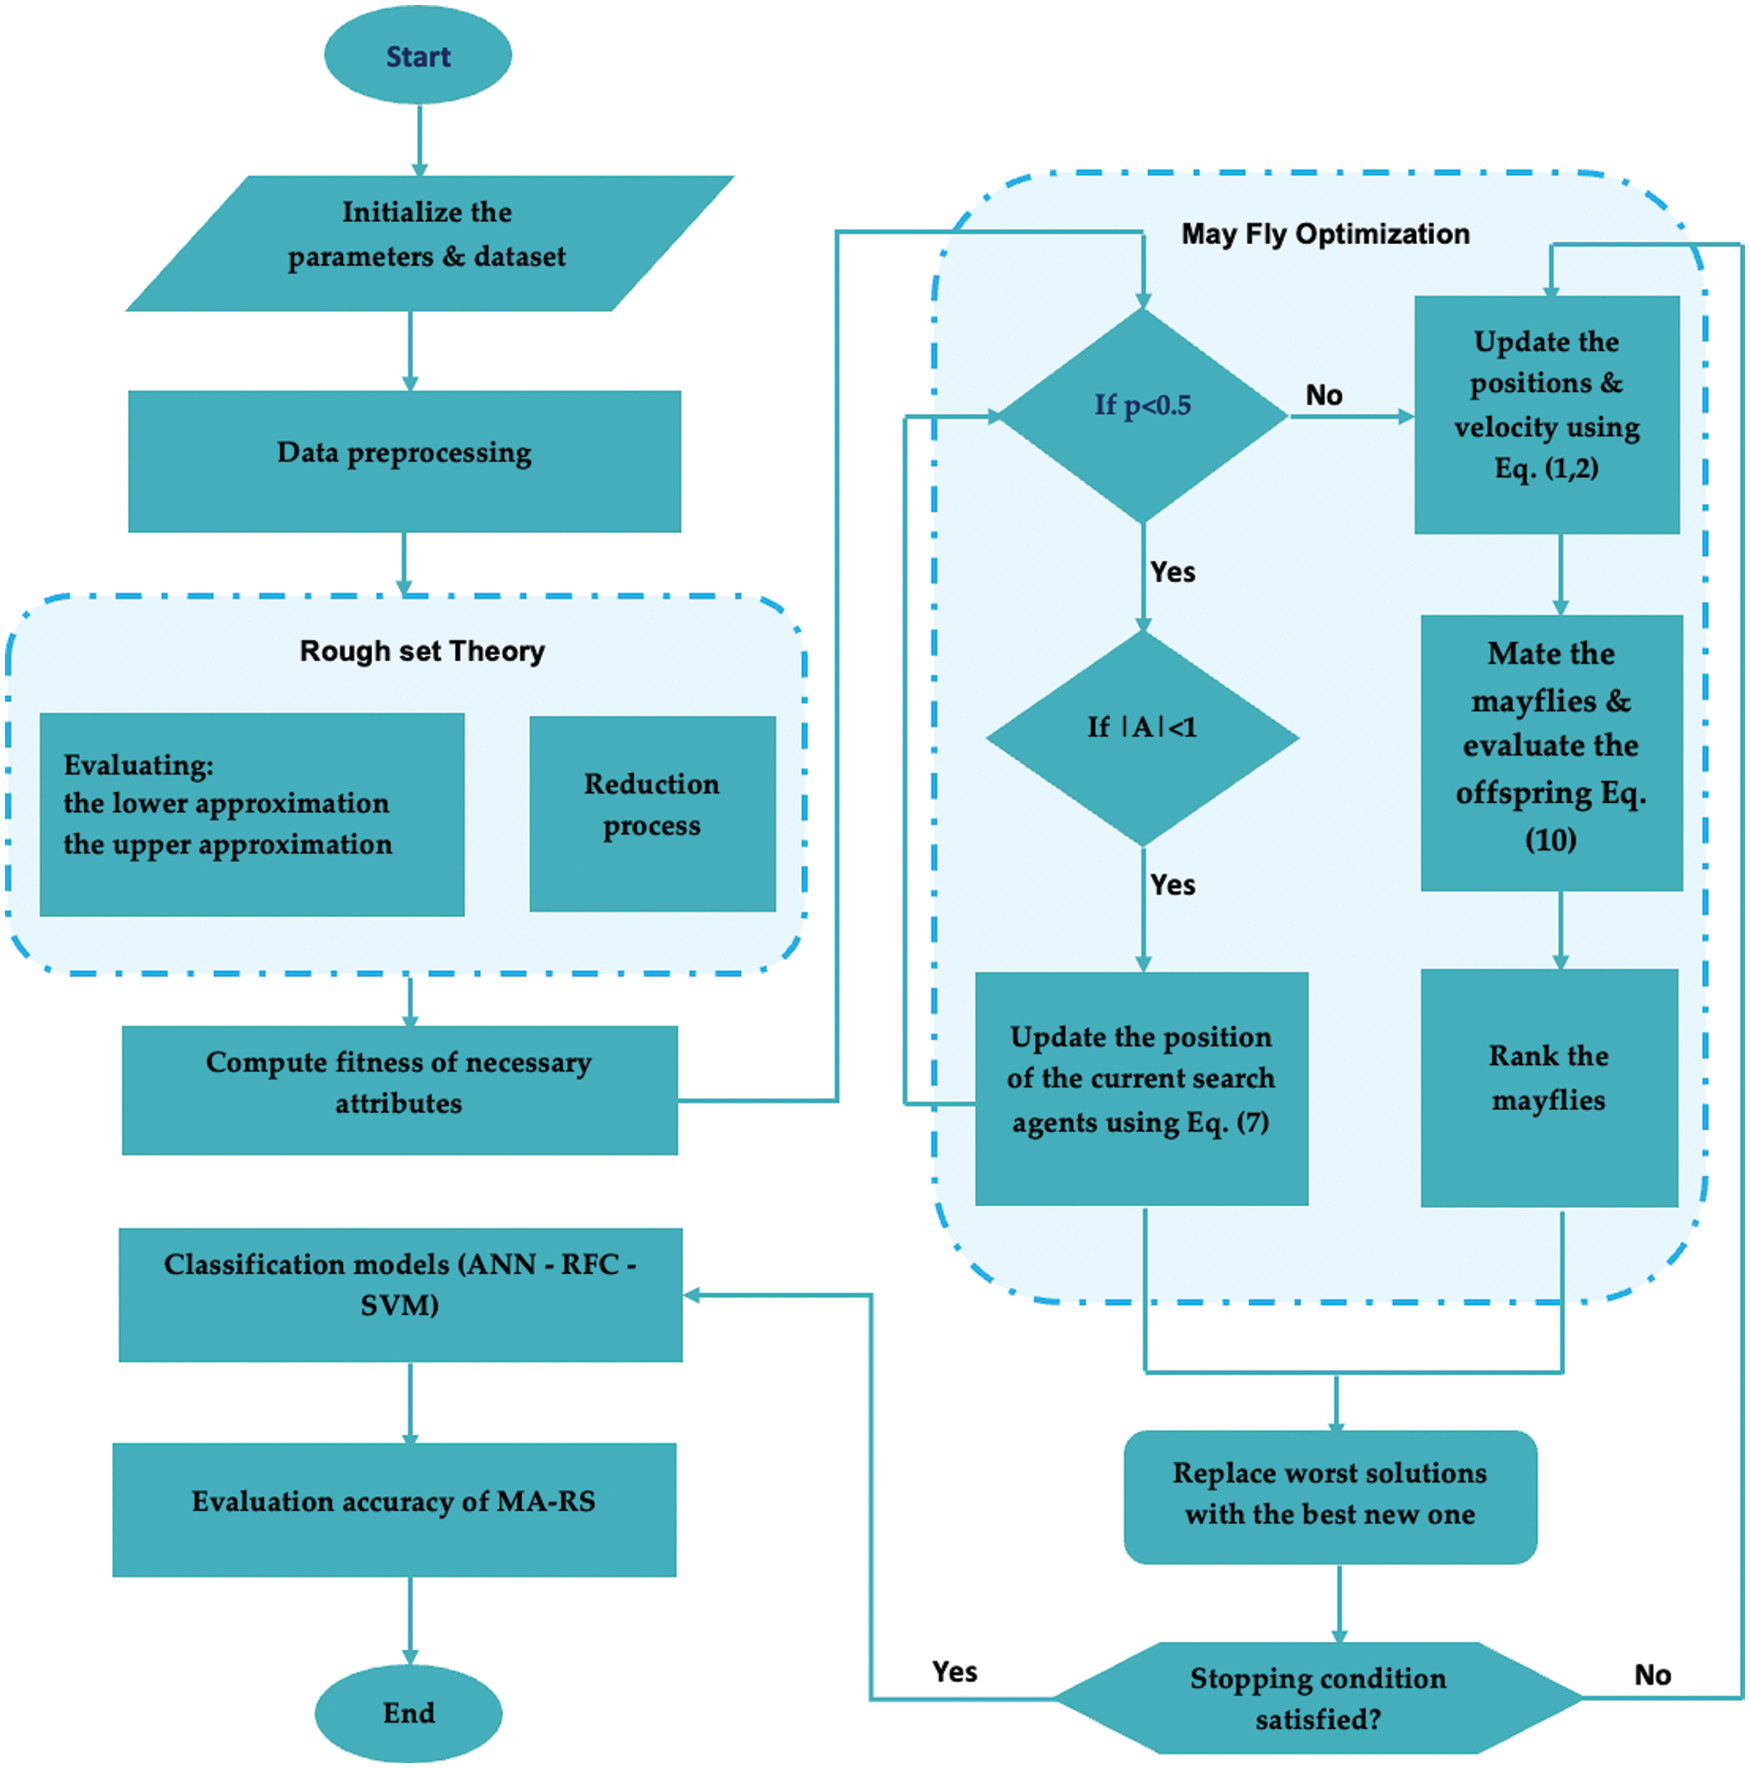
Figure 1: Structure of hybrid algorithm MA-RS
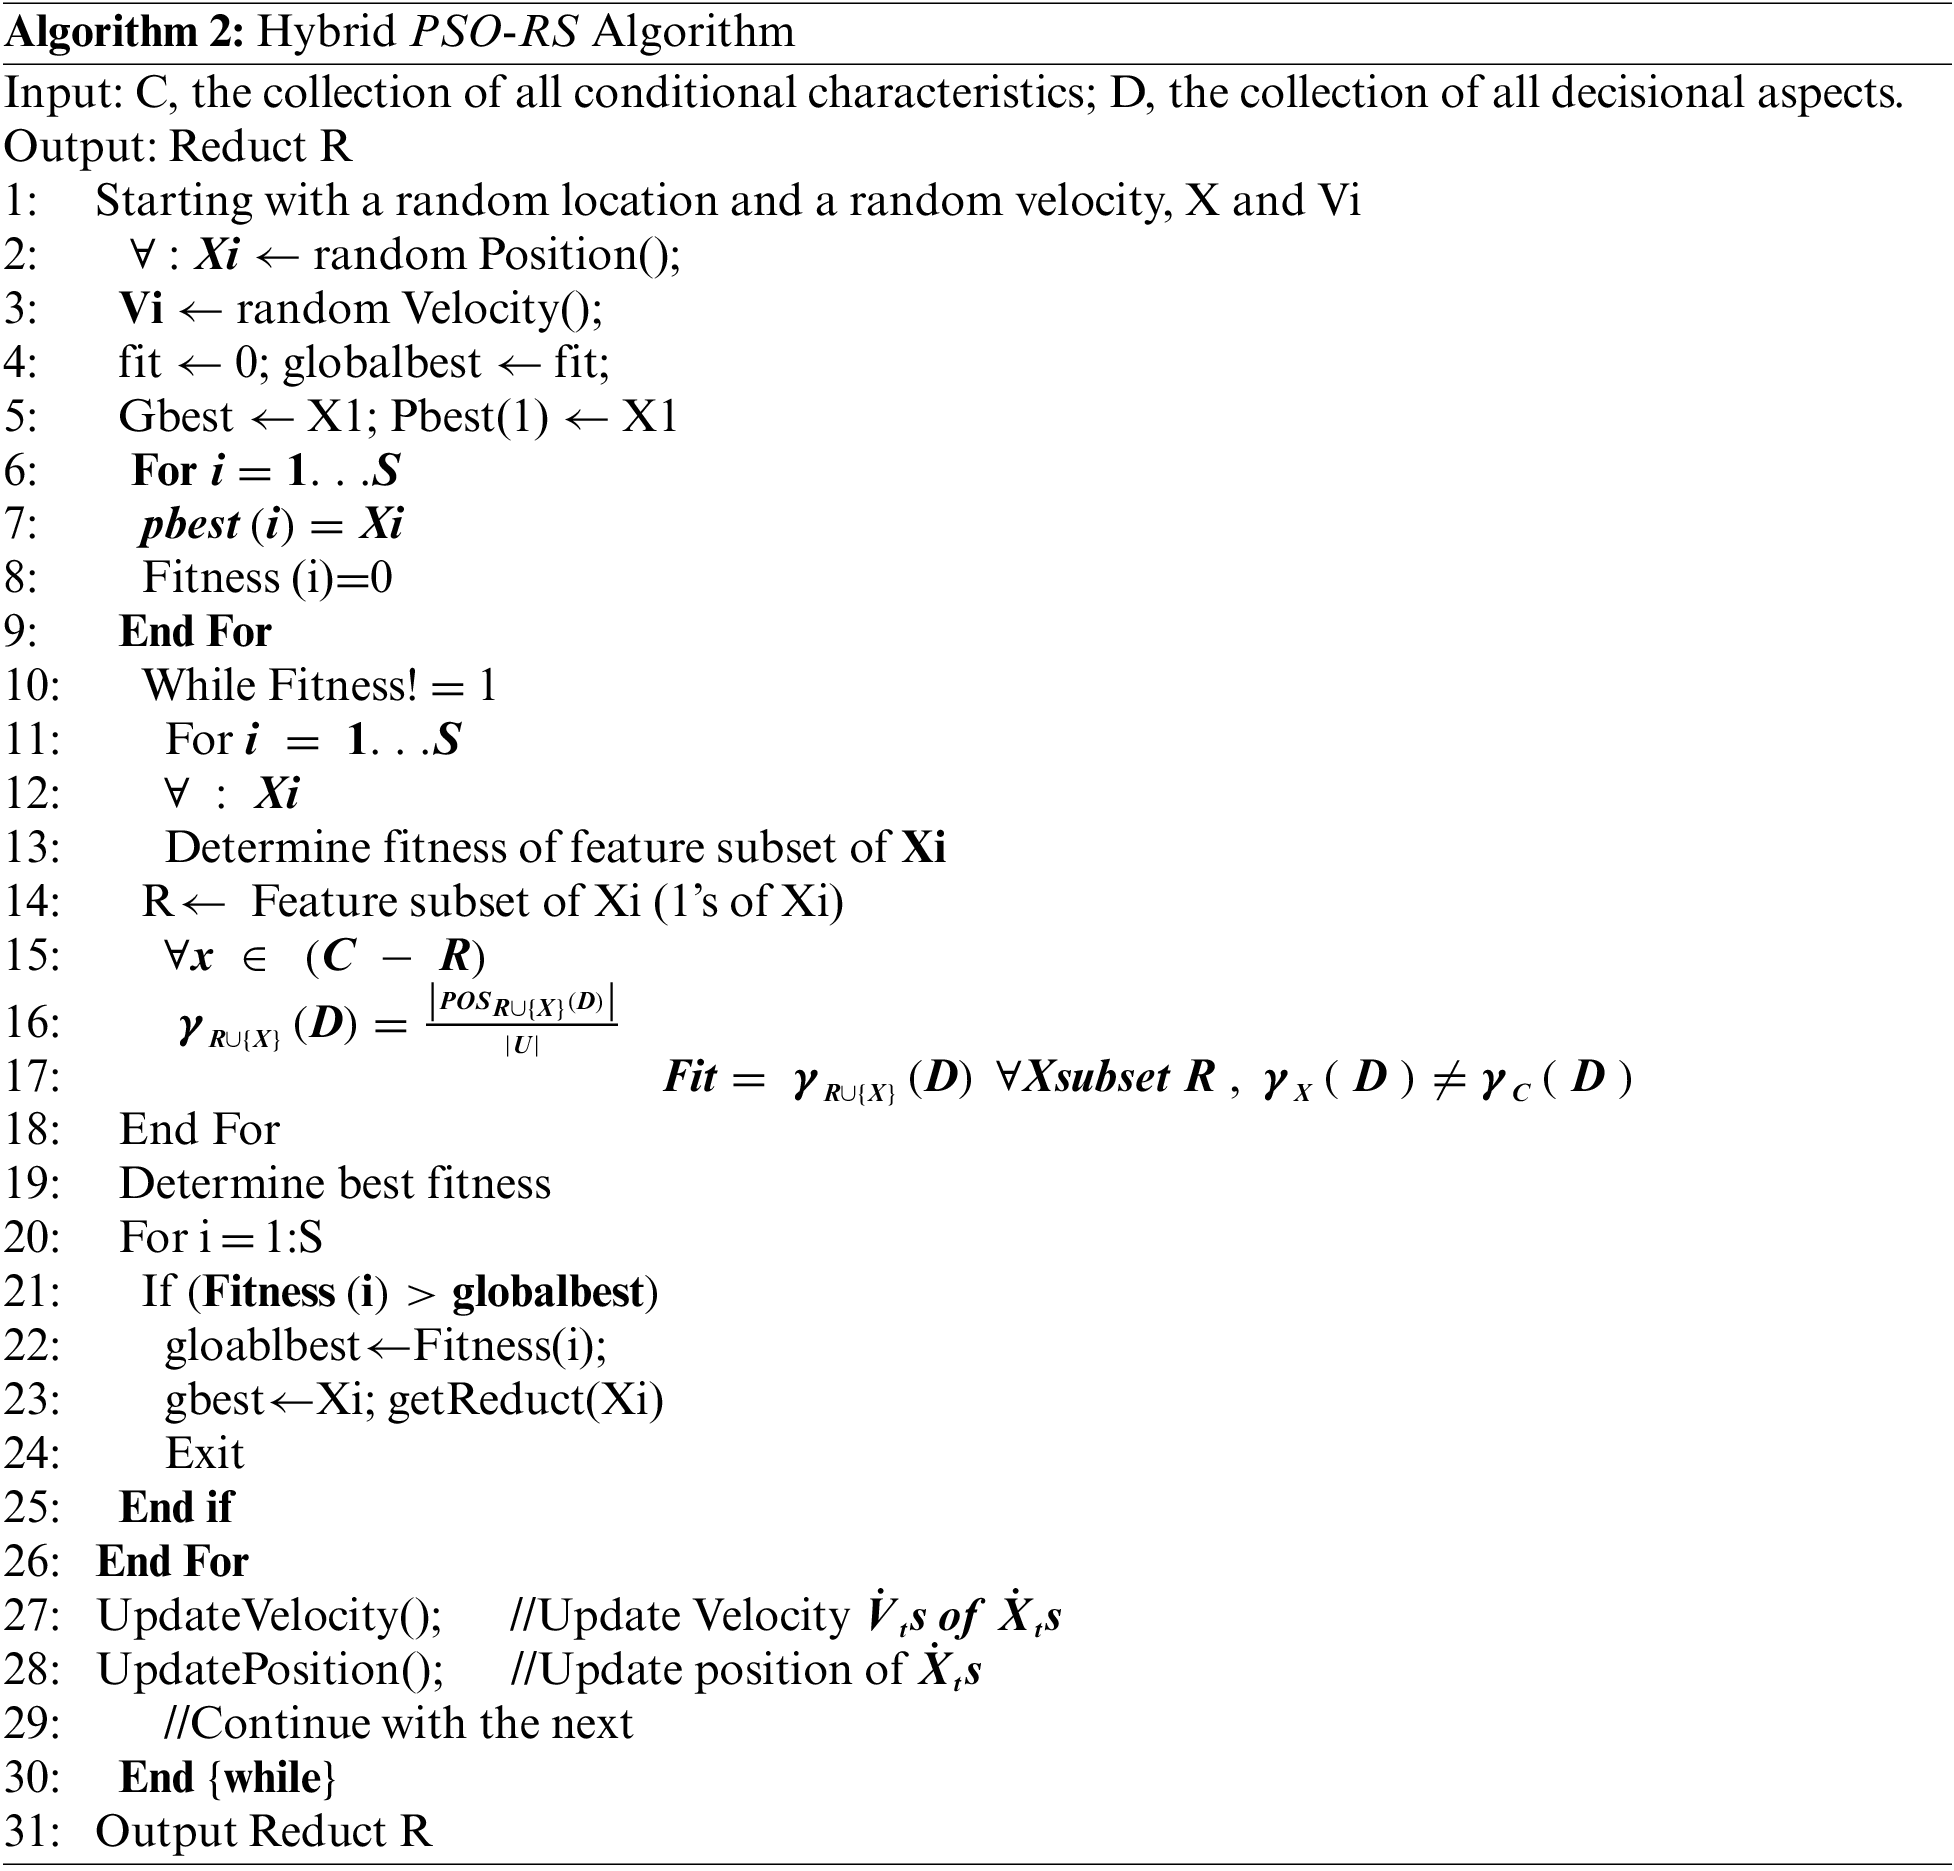
Algorithm 2 depicts the pseudo-code for the PSO-RS algorithm. A hybrid technique does not produce all of the redact set’s available subsets. Each item is added to the collection one by one. Particles with random positions and velocities are thrown into the problem area. The “fitness function” of each particle is examined and validated. The important element is picked first, and then all feasible combinations with other features are created. The compatibility of the qualities in various combinations is determined. The present particle becomes the best particle as long as it is more fit than the best. Its position in the game and fitness are both saved. When the fitness of the current particle is examined, it is compared to the population’s total best fitness from the previous P. If the current value is greater than Gbest, it is substituted for the current particle, modifying the global best fitness. The location displays the best features discovered thus far, and it is saved in R. After then, the particle’s speed and location are altered. The procedure is repeated until the halting condition is reached, which is usually a predetermined number of times. The feature set that returns is the PSO-RS set. The approach determines the importance of each attribute subset based on its relevance to the decision attribute. The best particle is selected.
Because FS is linked to multiple goals, it is referred to as a multi-objective optimization issue. The subset is evaluated based on two factors: the number of criteria chosen and the accuracy of the categorization. These are two contradictory goals that must be balanced when developing FS algorithms [8]. The initial goal is to keep the number of features picked to a minimum. The second purpose is to maintain a classifier’s accuracy. The fitness score for each solution in a population of solutions created across several iterations is computed as follows:
The constants η and μ signify the relevance of the classification’s accuracy and the length of the subset, respectively. Note that η + μ = 1. The error rate of the classifier is represented by υ. At the same time, ϒ is the total number of attributes in the data set.
5 Experimental Results and Discussions
This section contains the outcomes of the proposed techniques. To evaluate the overall performance of the offered approaches, a set of comparisons are done. The hybrid MA-RS and PSO-RS techniques are compared to the classic methodology’ results (i.e., MVR, LVF, HCF, RF, PCA, LDA, BFE, FFC, RS). The most recent approaches are then employed in order to perform comparative study. Finally, a comparison with a few well-known results from the literature on feature selection is given.
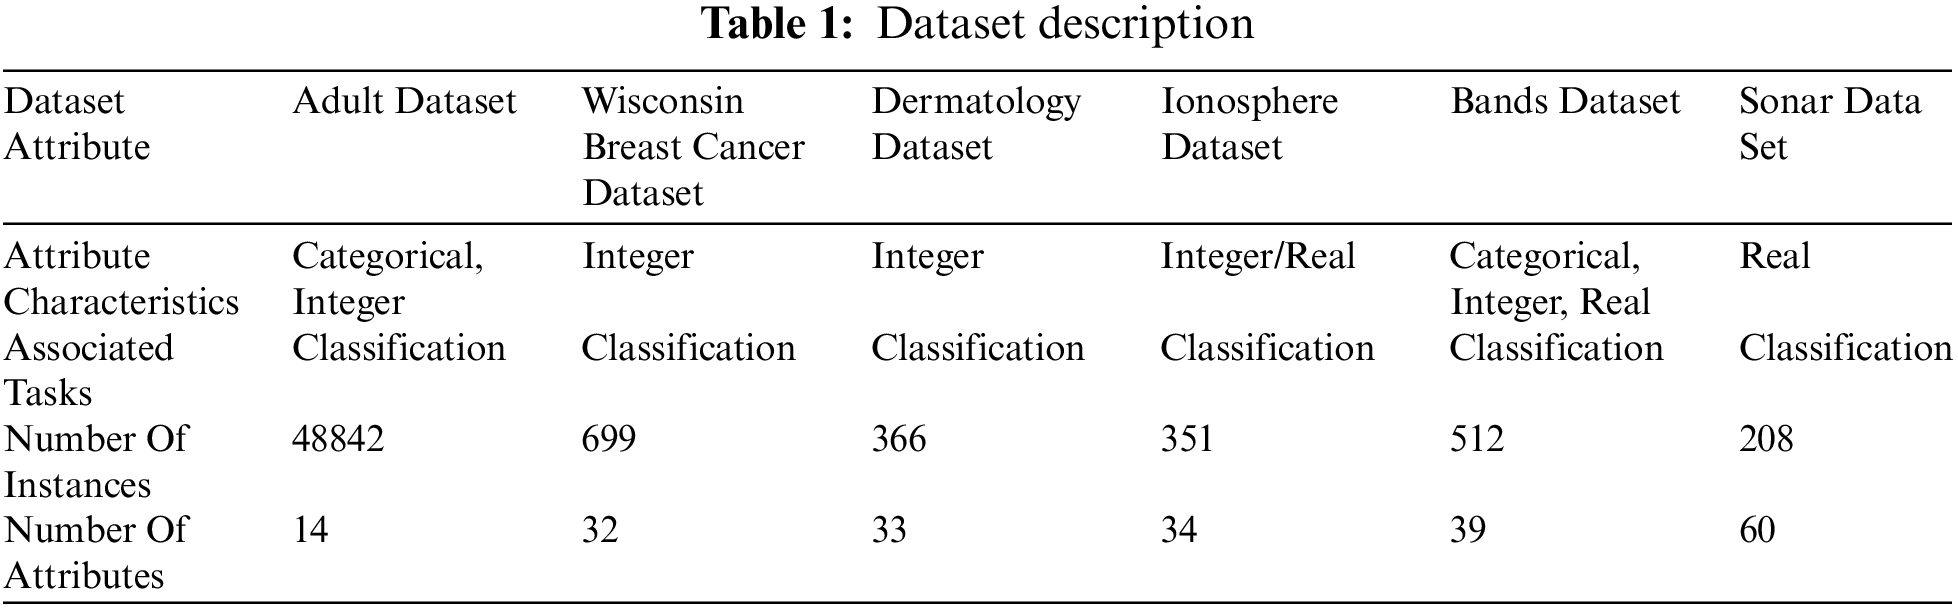
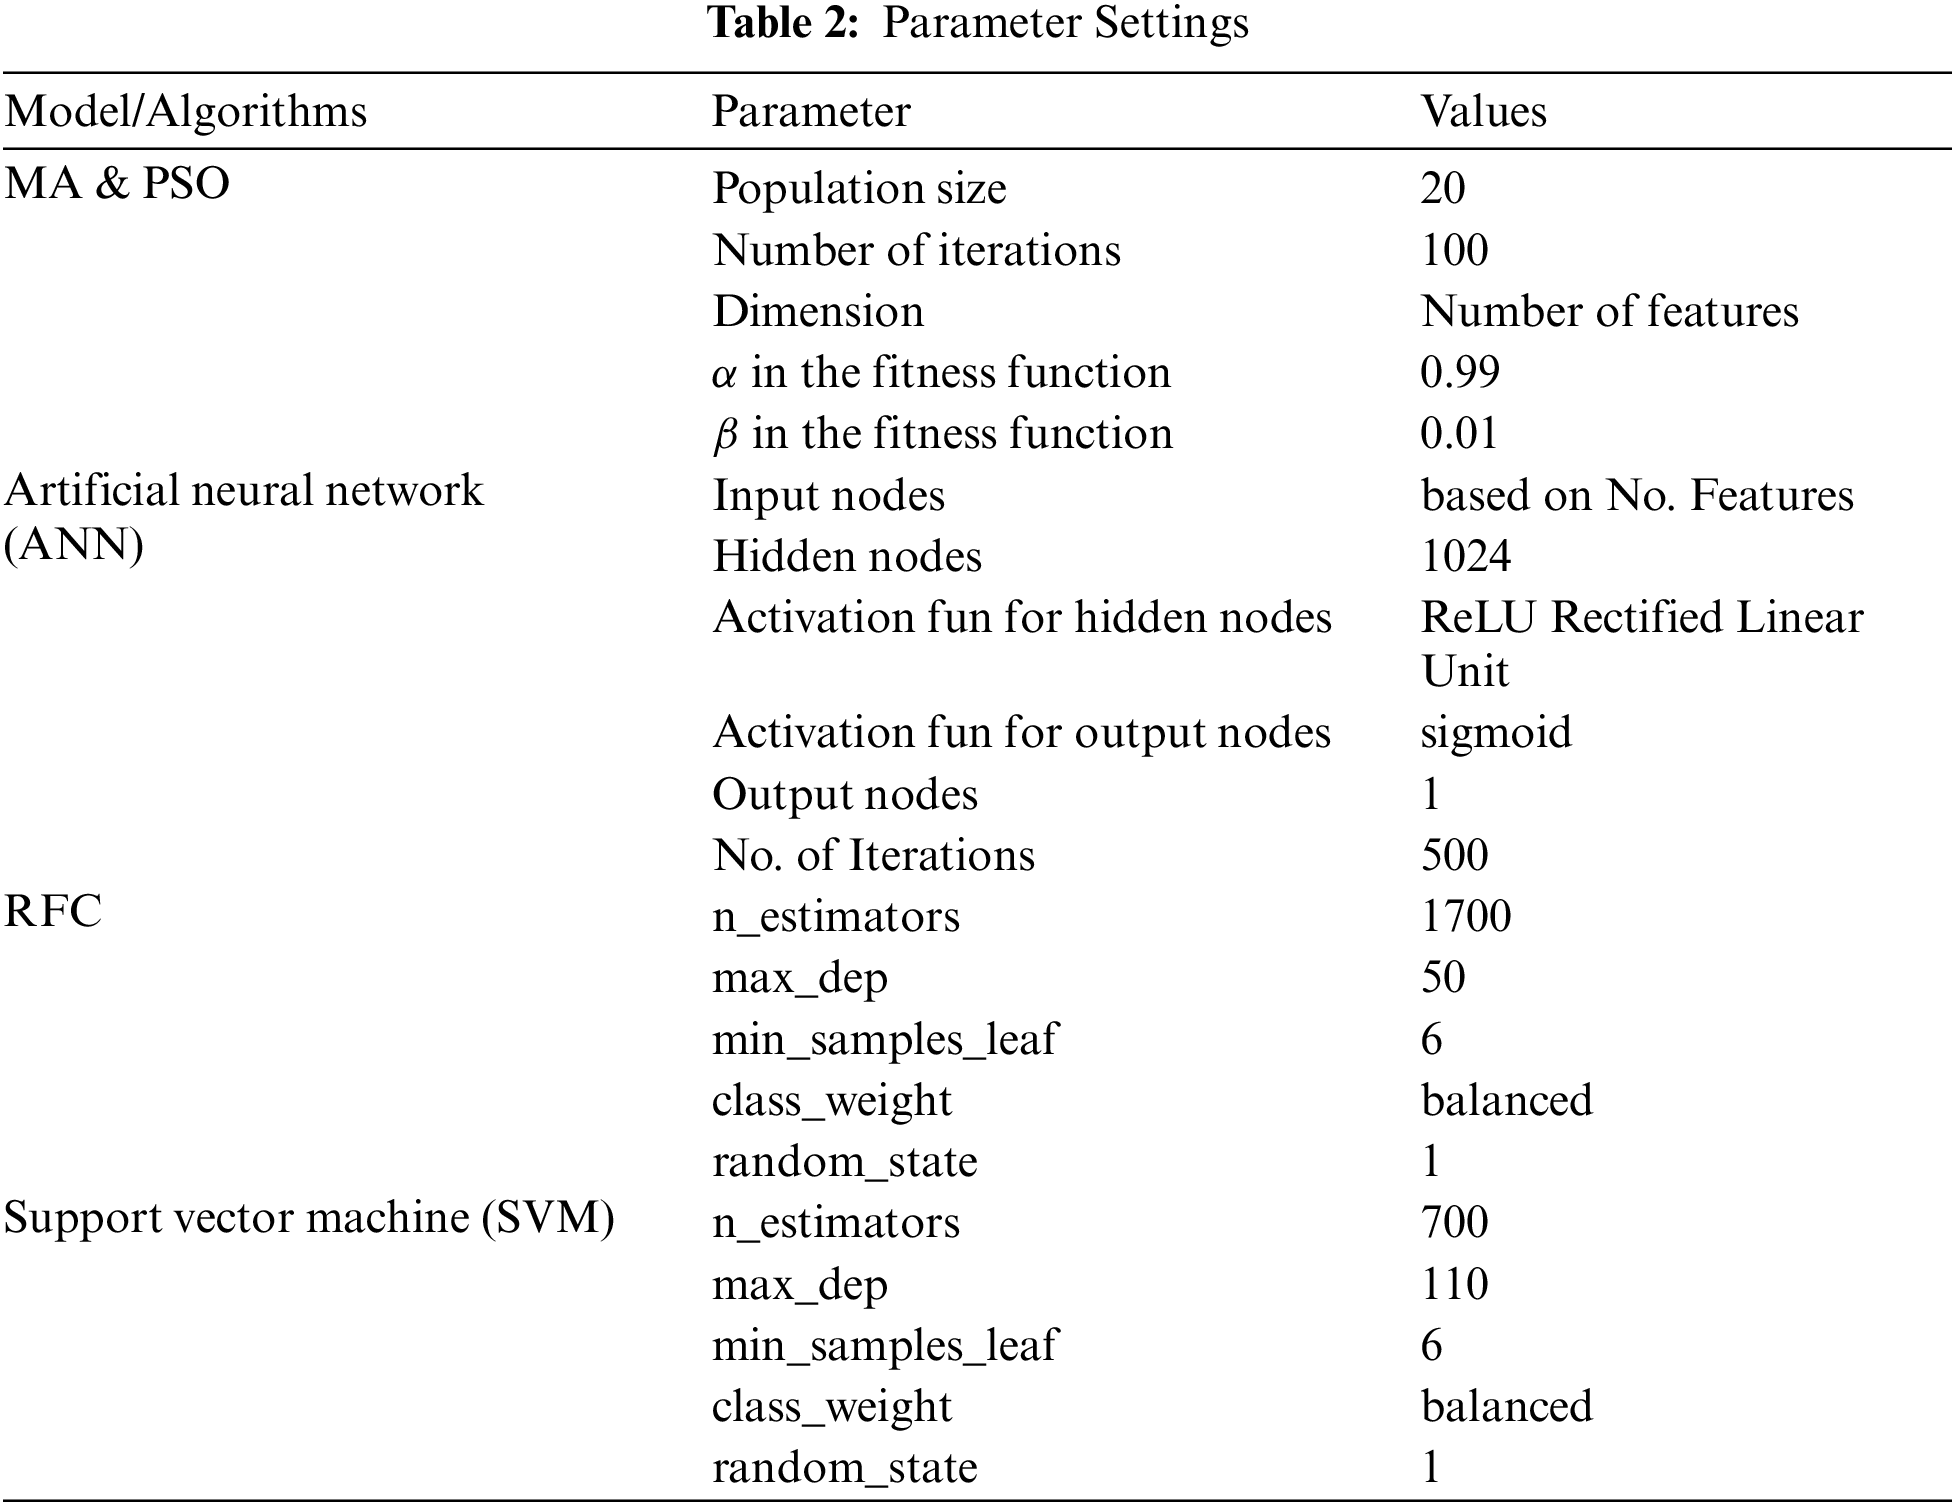
The proposed approaches are implemented in Matlab and Python, and all experiments in this section were performed on a computer equipped with an Intel(R) Core(TM) i7–7500U CPU running at 2.70ghz and 2.90ghz with 8.0GB RAM. The Experiments entail investigating the effect of the population size (N) parameter and the number of iterations on the MA and PSO. Tab. 2 displays the most popular parameter values for MA, PSO, and other algorithms, as suggested by the original MA and PSO papers. The results of the various DR algorithms (MVR, LVF, HCF, RF, PCA, LDA, BFE, FFC, RS) were documented and compared to the recommended methods. Six data sets from the University of California, Irvine’s machine-learning library were utilized to explain and validate the evaluated models [30]. Tab. 1 depicts the dataset properties in terms of feature count, occurrences, associated tasks, and attribute characteristics.
5.2 Model Selection and Parameters Settings
The artificial neural network model was composed primarily of an input layer, two hidden layers, and an output layer. Three different models were used (ANN [40], RFC, and SVM). The number of characteristics determines the Input Layer. The first hidden layer comprised 1024 neurons with a Rectified linear unit activation function (ReLU). The second hidden layer has 512 neurons and the same activation function as the first (ReLU). The output layer consisted of only one neuron. It has Sigmoid functions for its classification issue and activation function. The random search cross-validation (CV) approach was developed to ensure that hyperparameters such as (number of estimators, maximum depth, etc.) were as accurate as possible. The chaotic search CV method that maximizes the hyperparameters is the random forest classifier (RFC) (number of estimators, maximum depth, etc.). After ten iterations, the best-obtained parameter value would be used in RFC. A kernel is a support vector machine, and the support vector classifier employs the radial basis function. To select the specific support vector machine, hyper-parameters have to be manually adjusted. The setting of model parameters is summarized in Tab. 2.
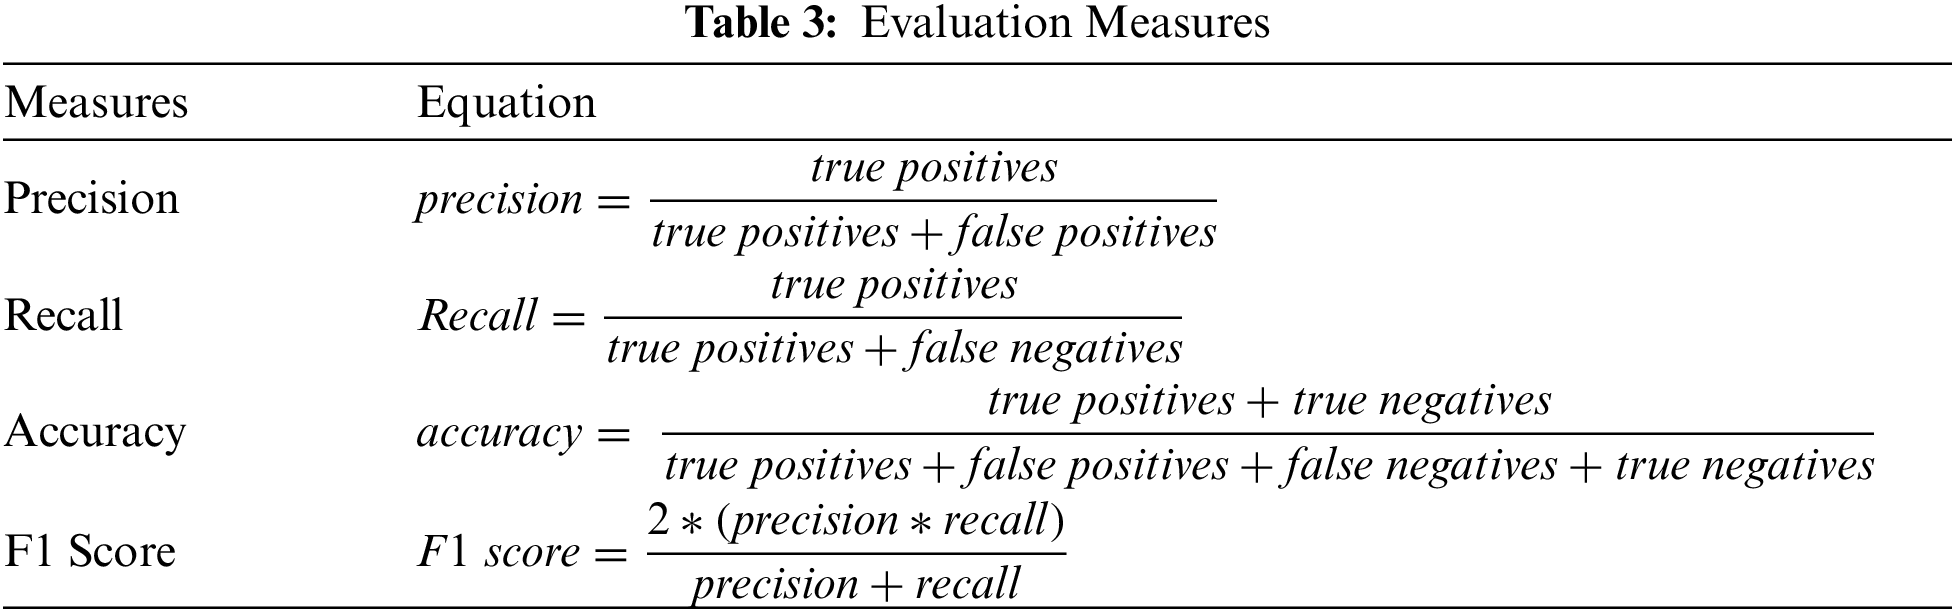
Each algorithm was run, and the results were computed and reported in this section, as well as compared to the evaluation metrics listed in Tab. 3. A confusion matrix is used to determine the outcomes of a classifier. It is used to ensure that true values (the true positives and negatives) are acceptable. As stated in Tab. 3, the assessment measures are precision, recall, accuracy and F1 score.
5.4 Results and Comparative Analysis
In this section, the results of the proposed methodologies are presented and compared to established algorithms. The results of the proposed technique (MA-RS) are compared to those of other DR algorithms. (For example, MVR, LVF, HCF, RF, PCA, LDA, BFE, FFC, and RS). The hybrid algorithm (PSO-RS) investigates the impact of this hybrid version on assessment metrics such as classification accuracy, F1 Score (F1 s), precision, and recall. Following the analysis of the acquired findings, the performance of the MA-RS will be compared to several common DR approaches from the literature in order to validate the applicability of these fields in FS situations for dimensionality reduction [41].
5.4.1 Results of Hybrid and Basic Approaches Applied on (ANN) Model
The findings of the proposed hybrid techniques demonstrate that the proposed algorithm outperforms standard algorithms based on the (ANN) model. Tab. 4 compares the performance of the suggested strategies in terms of classification accuracy and average, which is derived in the same way. The average is calculated using the F1 score, precision, and recall. When we analyze the methods in Tab. 4, we see that the worst scenario occurs at the bands dataset because it has the most attributes at the high-correlation filter. The average accuracy of bands dataset was 33%, which was the worst case scenario when compared to the other 5 datasets. The proposed hybrid method outperforms traditional algorithms for 6 datasets and improves the results of the bands dataset. In general, the hybrid algorithm’s (MA-RS) best average values were 97% at dermatology. All feature selection approaches enhance classification accuracy and average values for all datasets when compared to performing classification without any feature selection. In dermatology datasets with 97% accuracy, the number of selected features for the best scenario was 33, while the number of features for the worst case was 39.
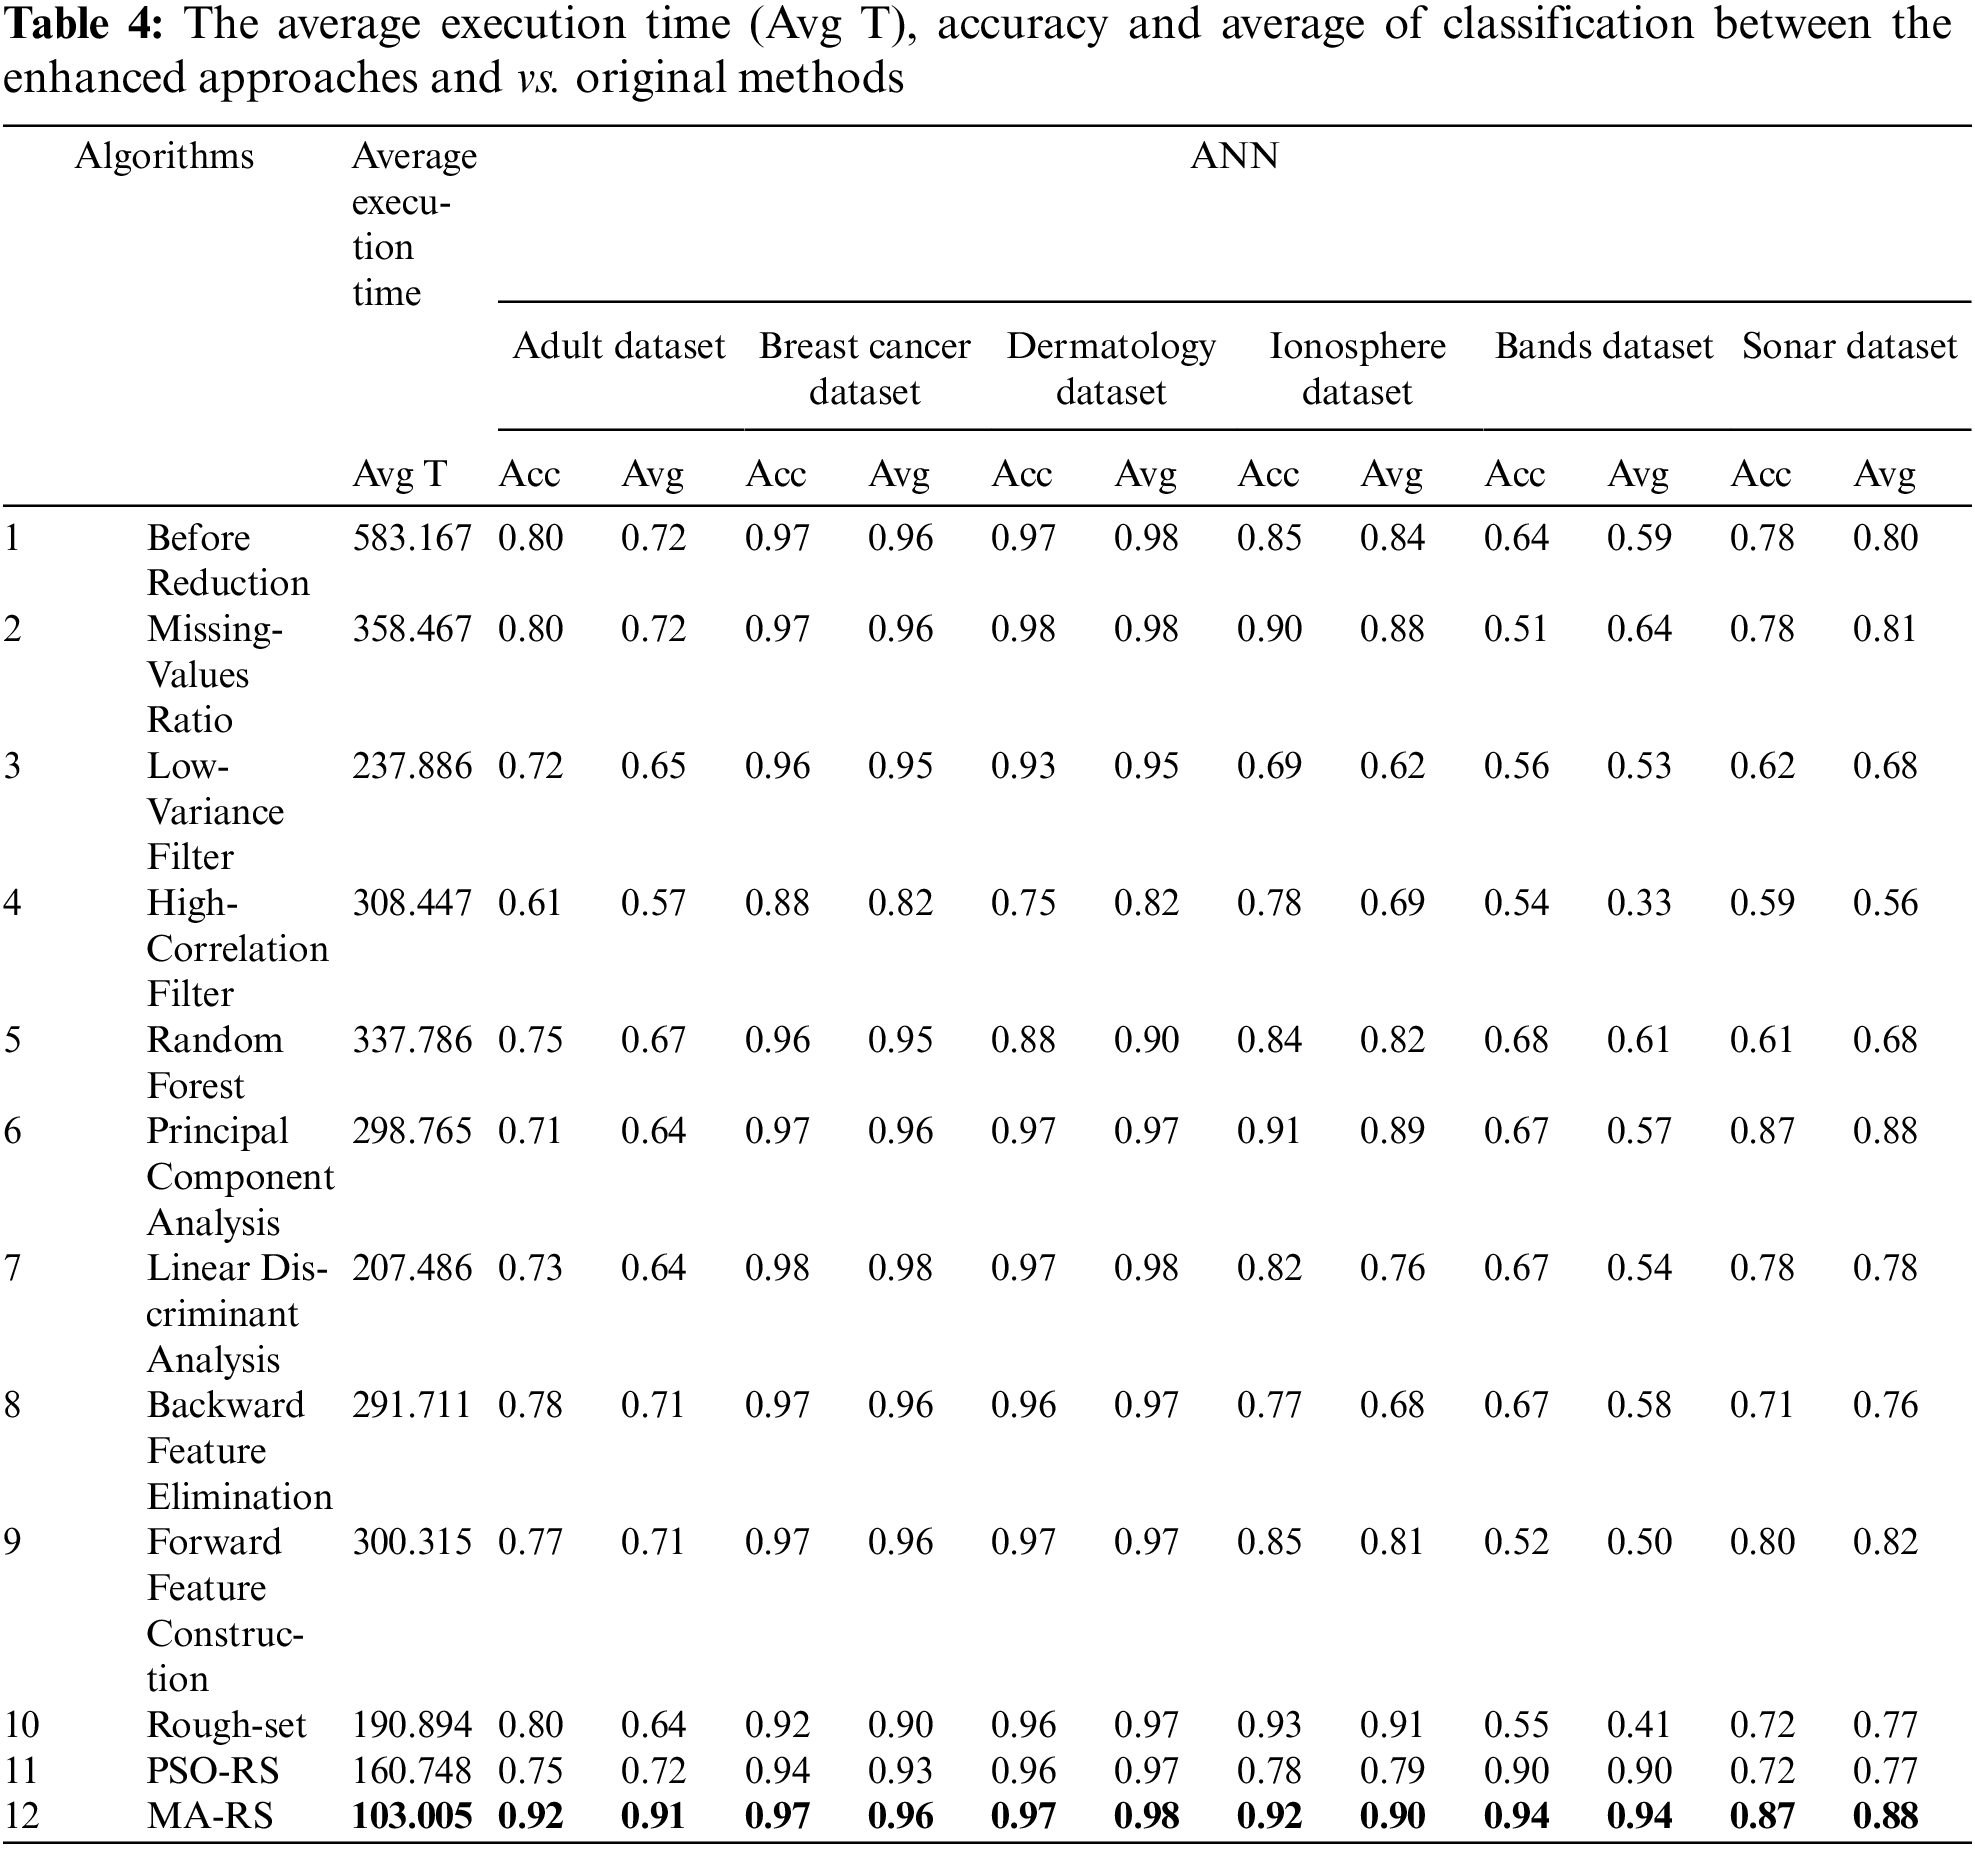
Fig. 2 shows Boxplots of accuracy rates for MVR, LVF, HCF, RF, PCA, LDA, BFE, FFC and RS compared to PSO-RS and MA-RS optimizers for all data sets. A boxplot is a graph’s visual representation of a five-number summary. The central portion of the chart box represents the position of the data’s middle component: the interquartile range. The first quartile is 25% and the third quartile is 75%, which are located at the box’s extremes. The minimum (the lowest value in the set) is near the bottom of the chart (near the end of the bottom “box”), while the maximum is near the top (the largest number in the set).
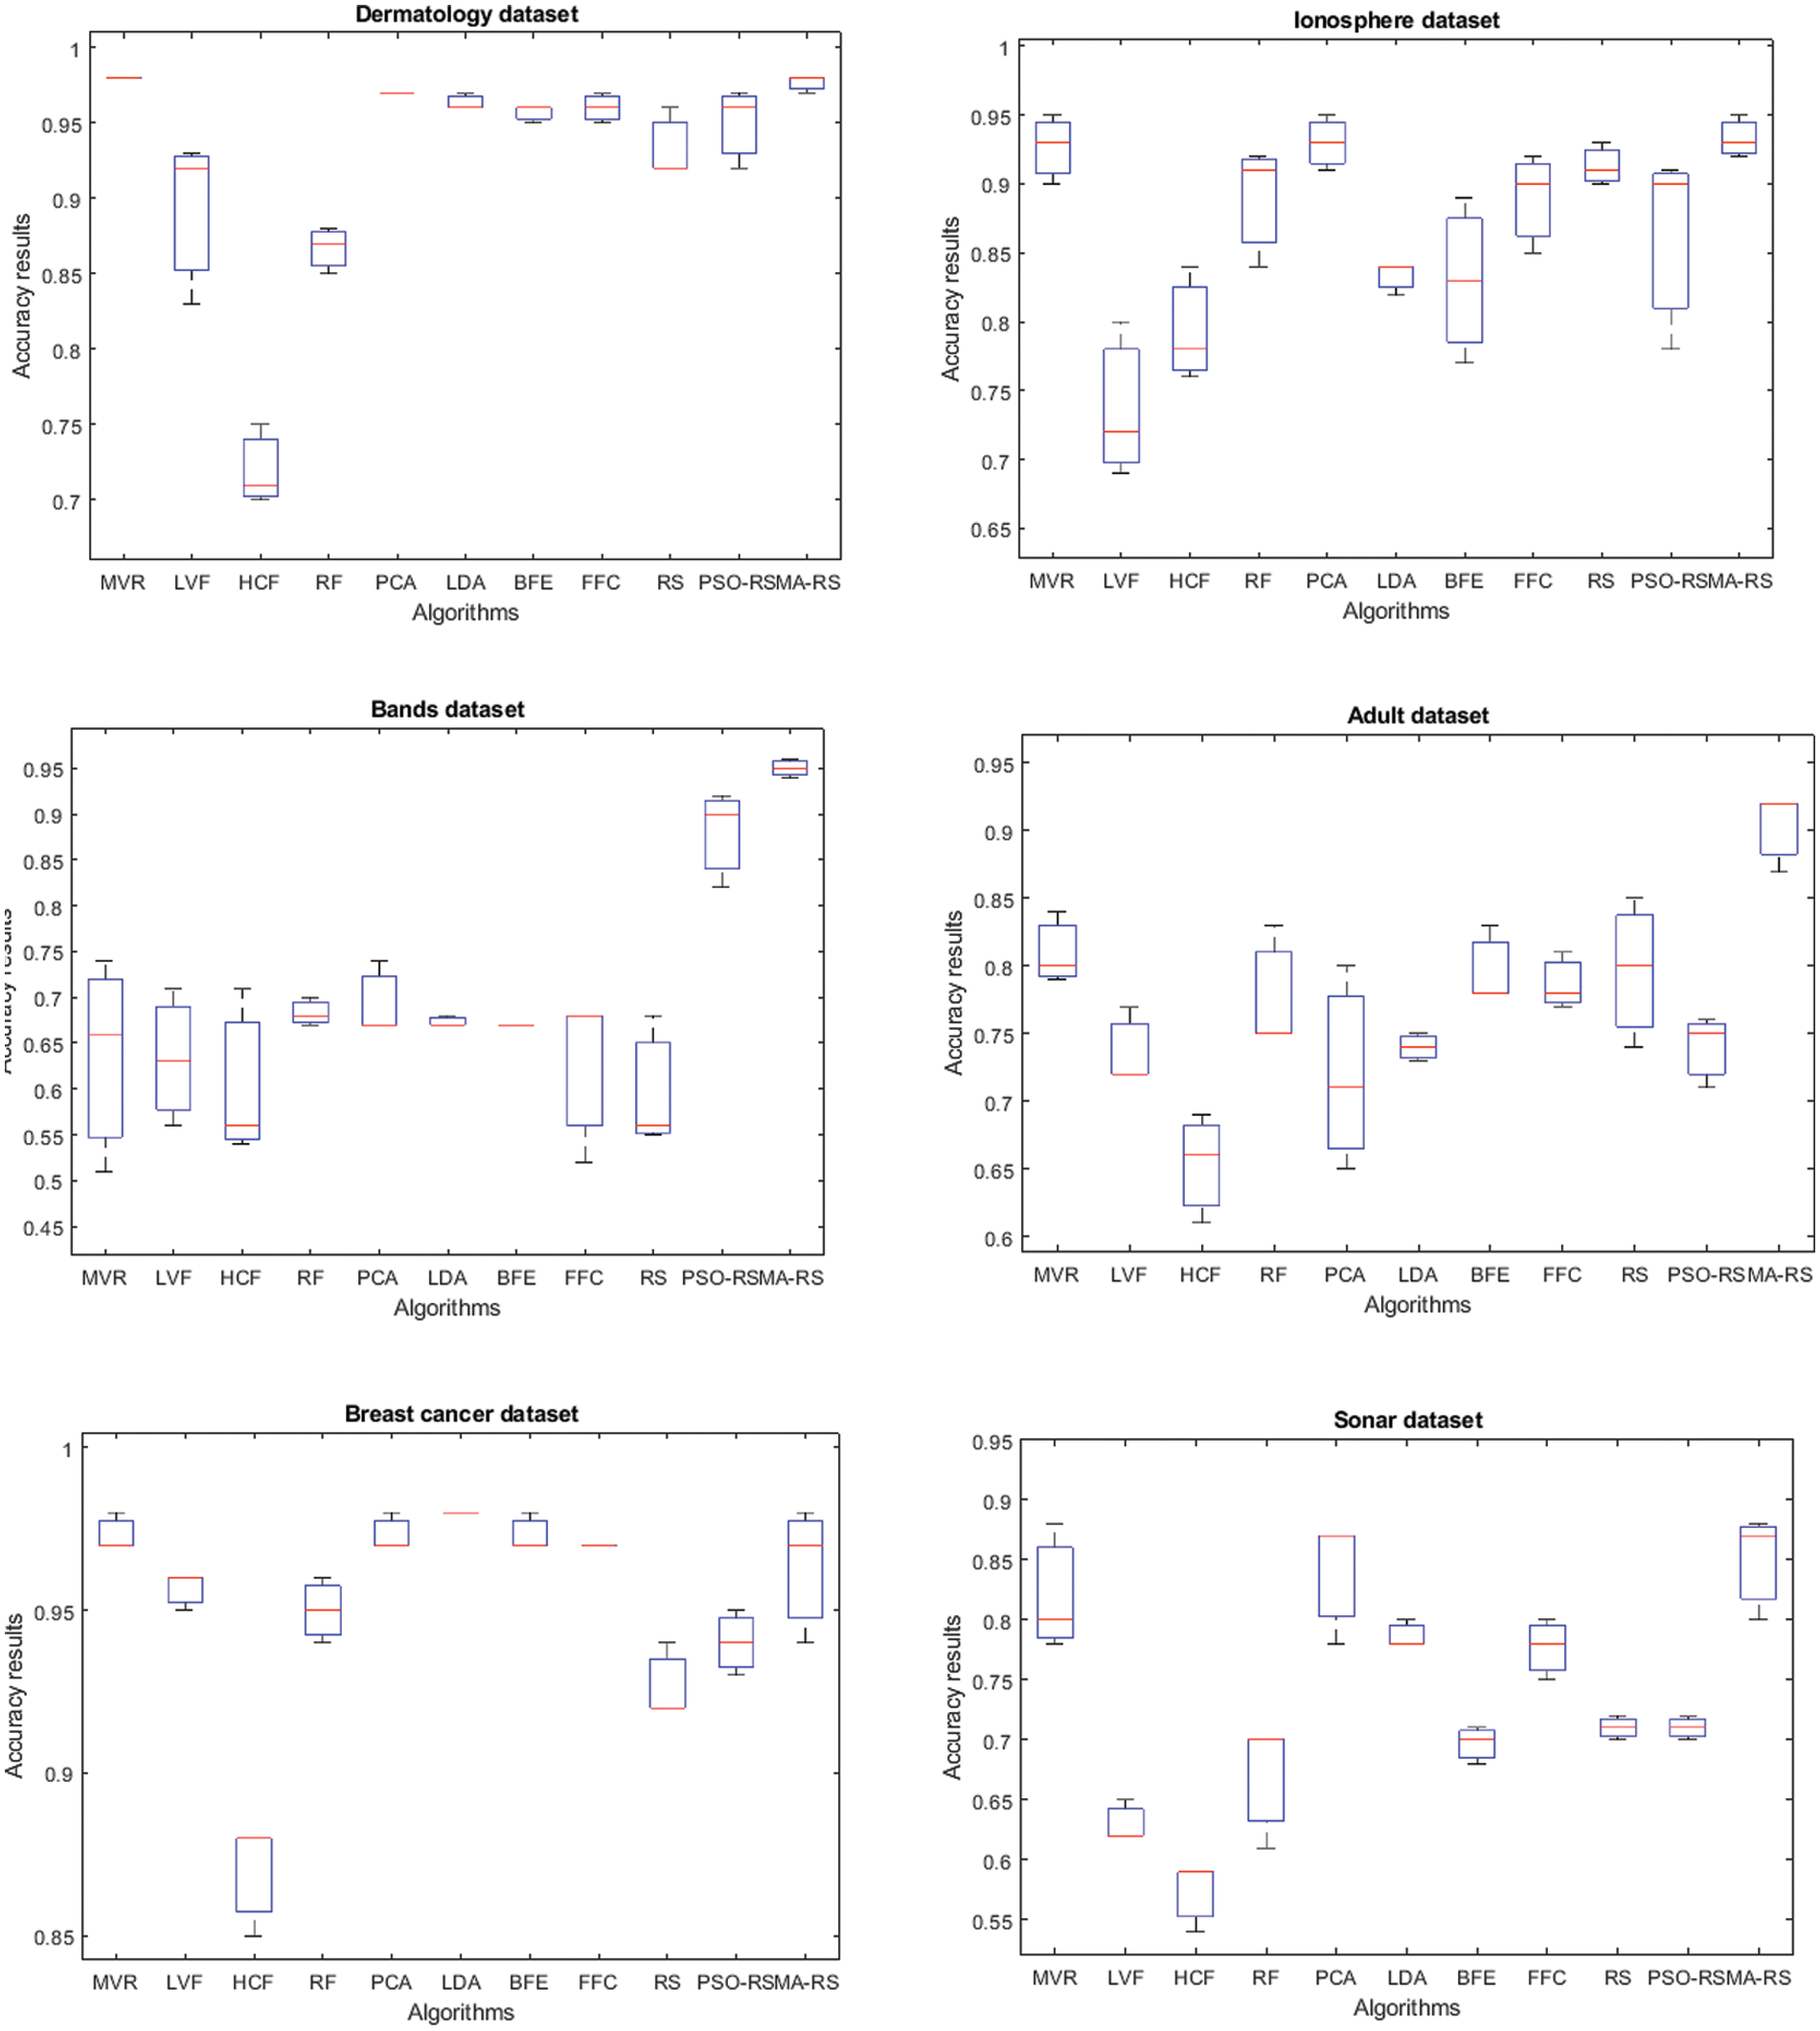
Figure 2: Boxplots of accuracy rates for MVR, LVF, HCF, RF, PCA, LDA, BFE, FFC, RS compared to PSO-RS and MA-RS optimizers in dealing with Adult, Breast cancer, Dermatology, Ionosphere, Bands and Sonar datasets
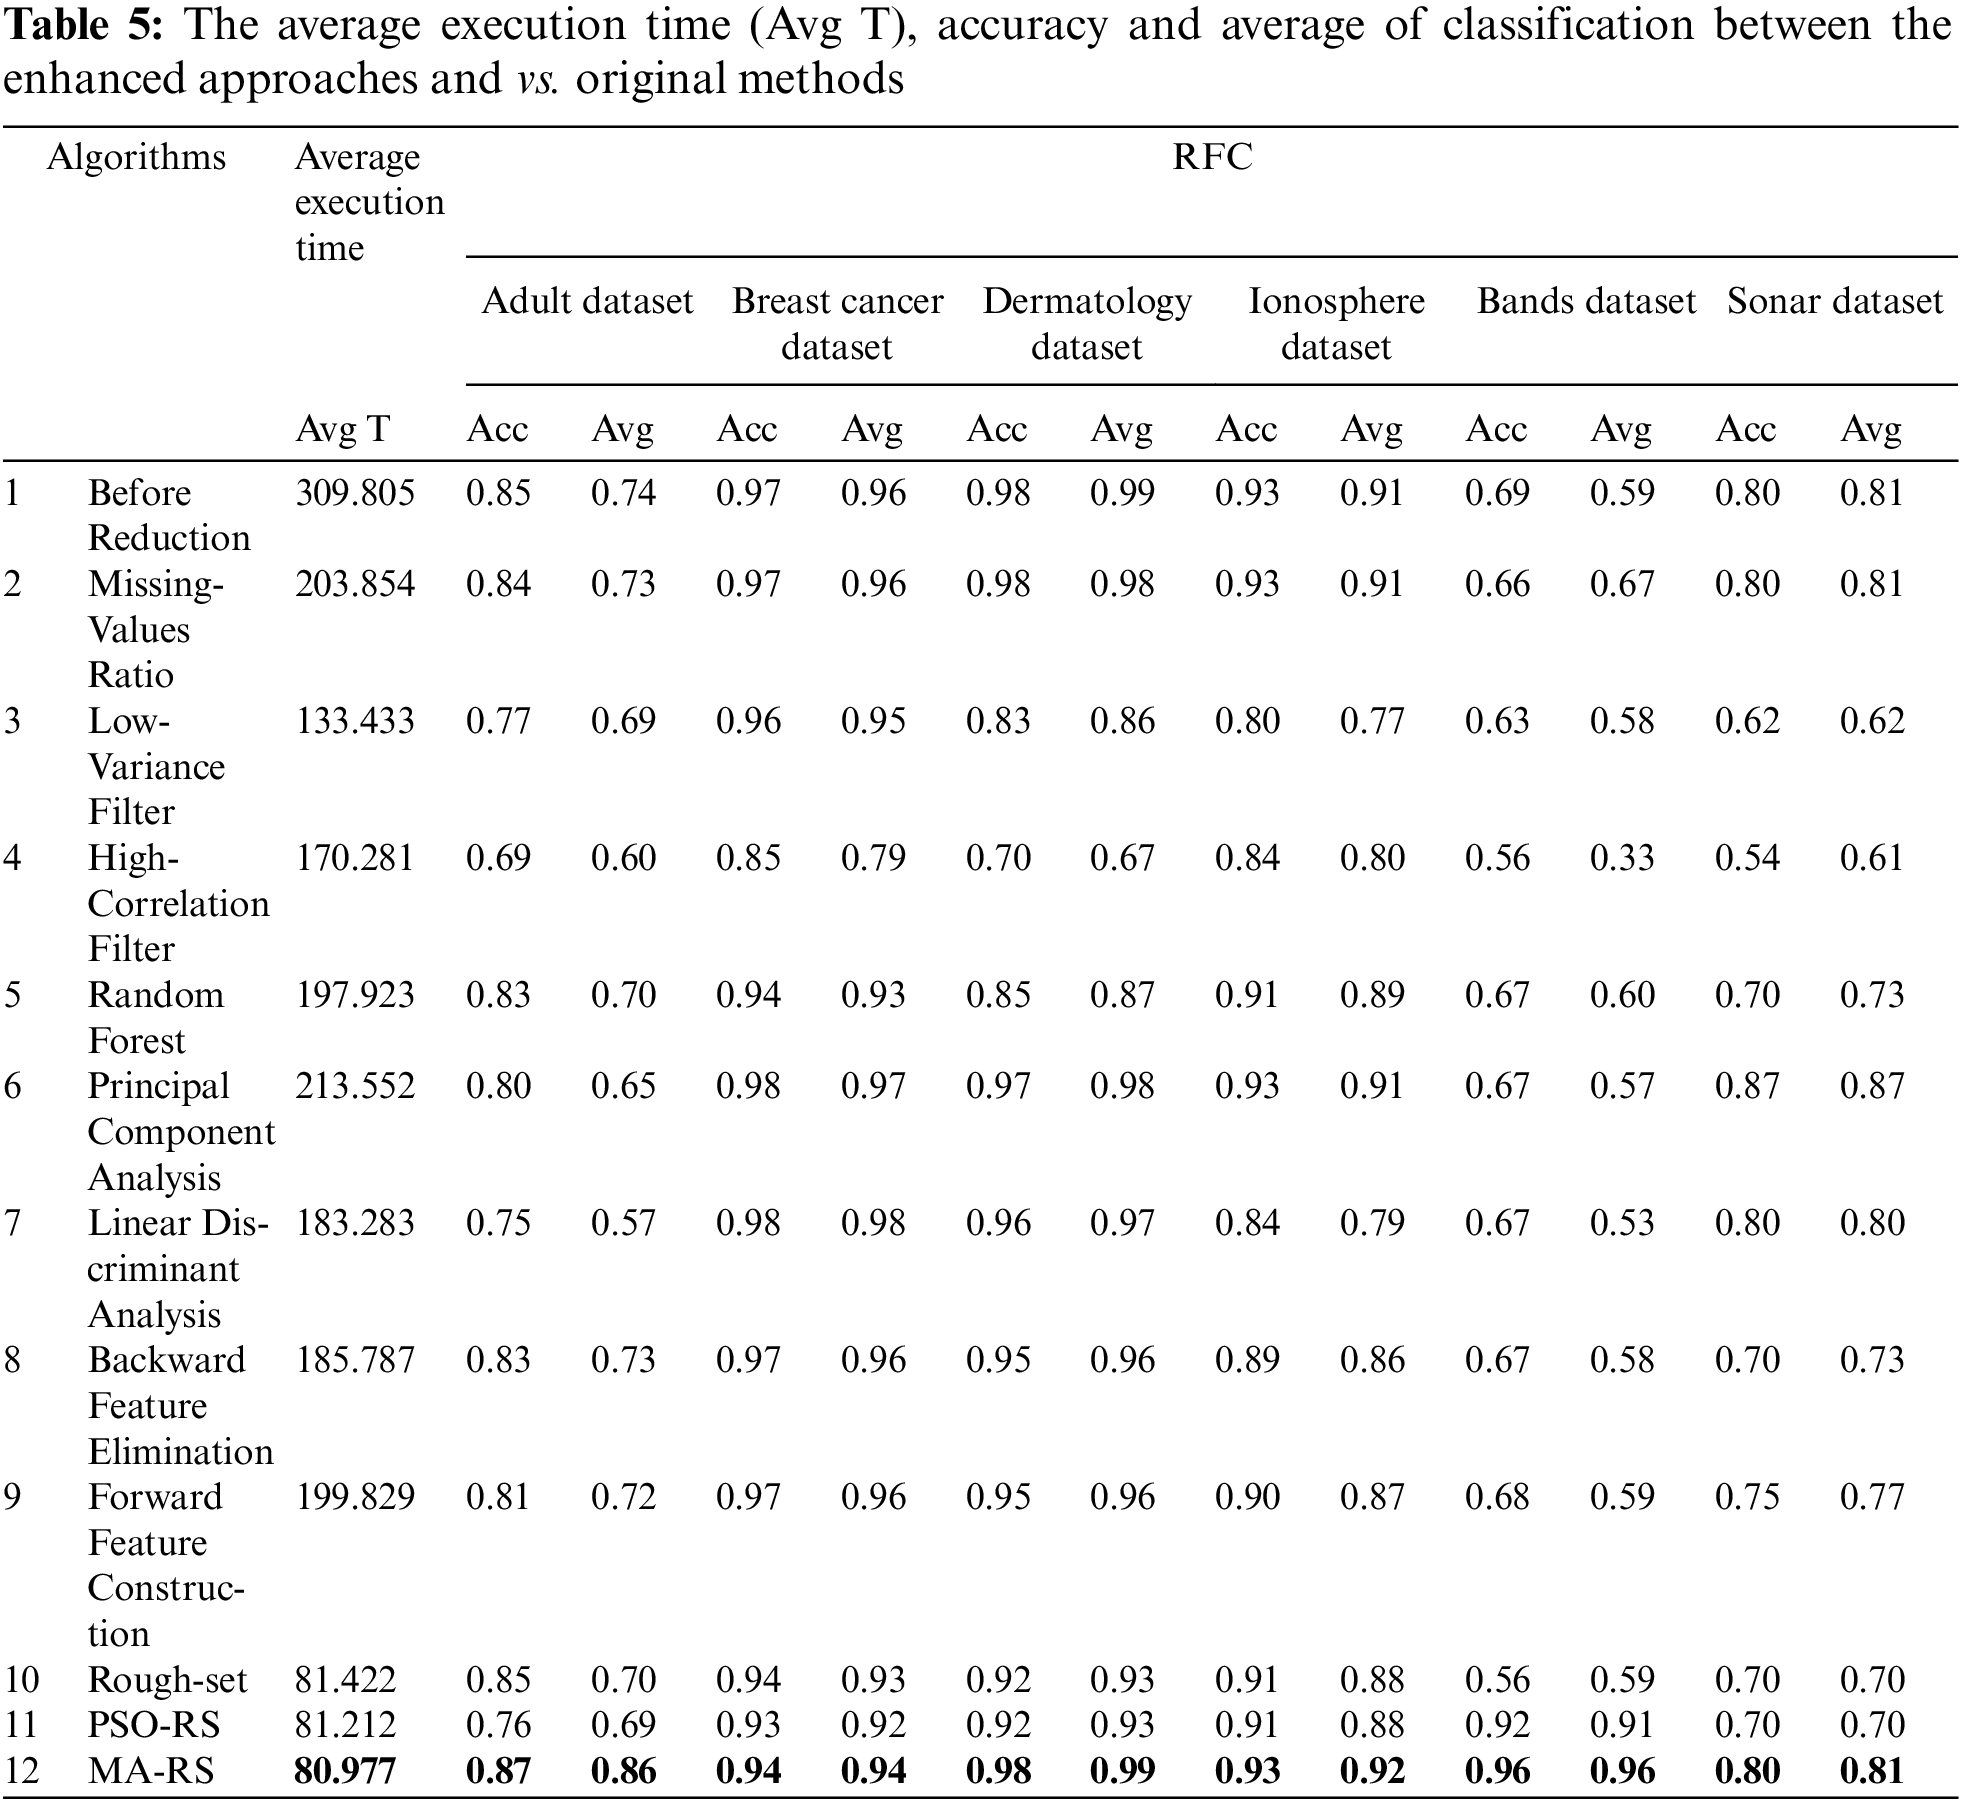
5.4.2 Results of Hybrid and Basic Approaches Applied on (RFC) Model
In this subsection, the efficacy of the proposed approaches is compared against algorithms from the literature using RFC model. The most recent FS wrapper techniques include hybrid algorithms and other reduction algorithms. The comparison is based on classification accuracy and average, where average is computed using F1 score, precision, and recall, as with previous testing. As demonstrated in Tab. 5, the worst-case scenario also happens in the band’s dataset due to the fact that it has the most features. The accuracy and average at the High-Correlation Filter and Rough set are 56% and 33%, respectively, resulting in the lowest accuracy when compared to the other 5 data sets. However, the proposed hybrid technique outperforms the standard methods in the other six datasets. The performance of the proposed hybrid method was improved in the band’s dataset, where accuracy and average became 92% and 96%, respectively. In most circumstances, hybrid techniques outperform traditional algorithms on average. When compared to doing classification without feature selection on any specific dataset, all feature selection algorithms improve classification accuracy and average values for all datasets. According to dermatology datasets with a 98% accuracy, the number of selected features for the best scenario was 33, while the number of selected features for the worst situation was 39.
The average accuracy rates for each number of features in the train and test datasets are shown in Fig. 3. Fig. 3c shows that the train and test are close to each other, and the best accuracy occurs when the number of features reaches 9. The best results are demonstrated in the dermatological dataset, where the number of features is 9, and the test and train accuracy are close to each other, indicating that we have the best models. The hybrid approaches achieved the highest accuracy rates in the majority of the dataset. The accuracy at each number of features is determined by the test score and training applied to the RFC model on various datasets. As shown in Fig. 3, the greatest reduction occurs when training and testing are completed at their highest levels.
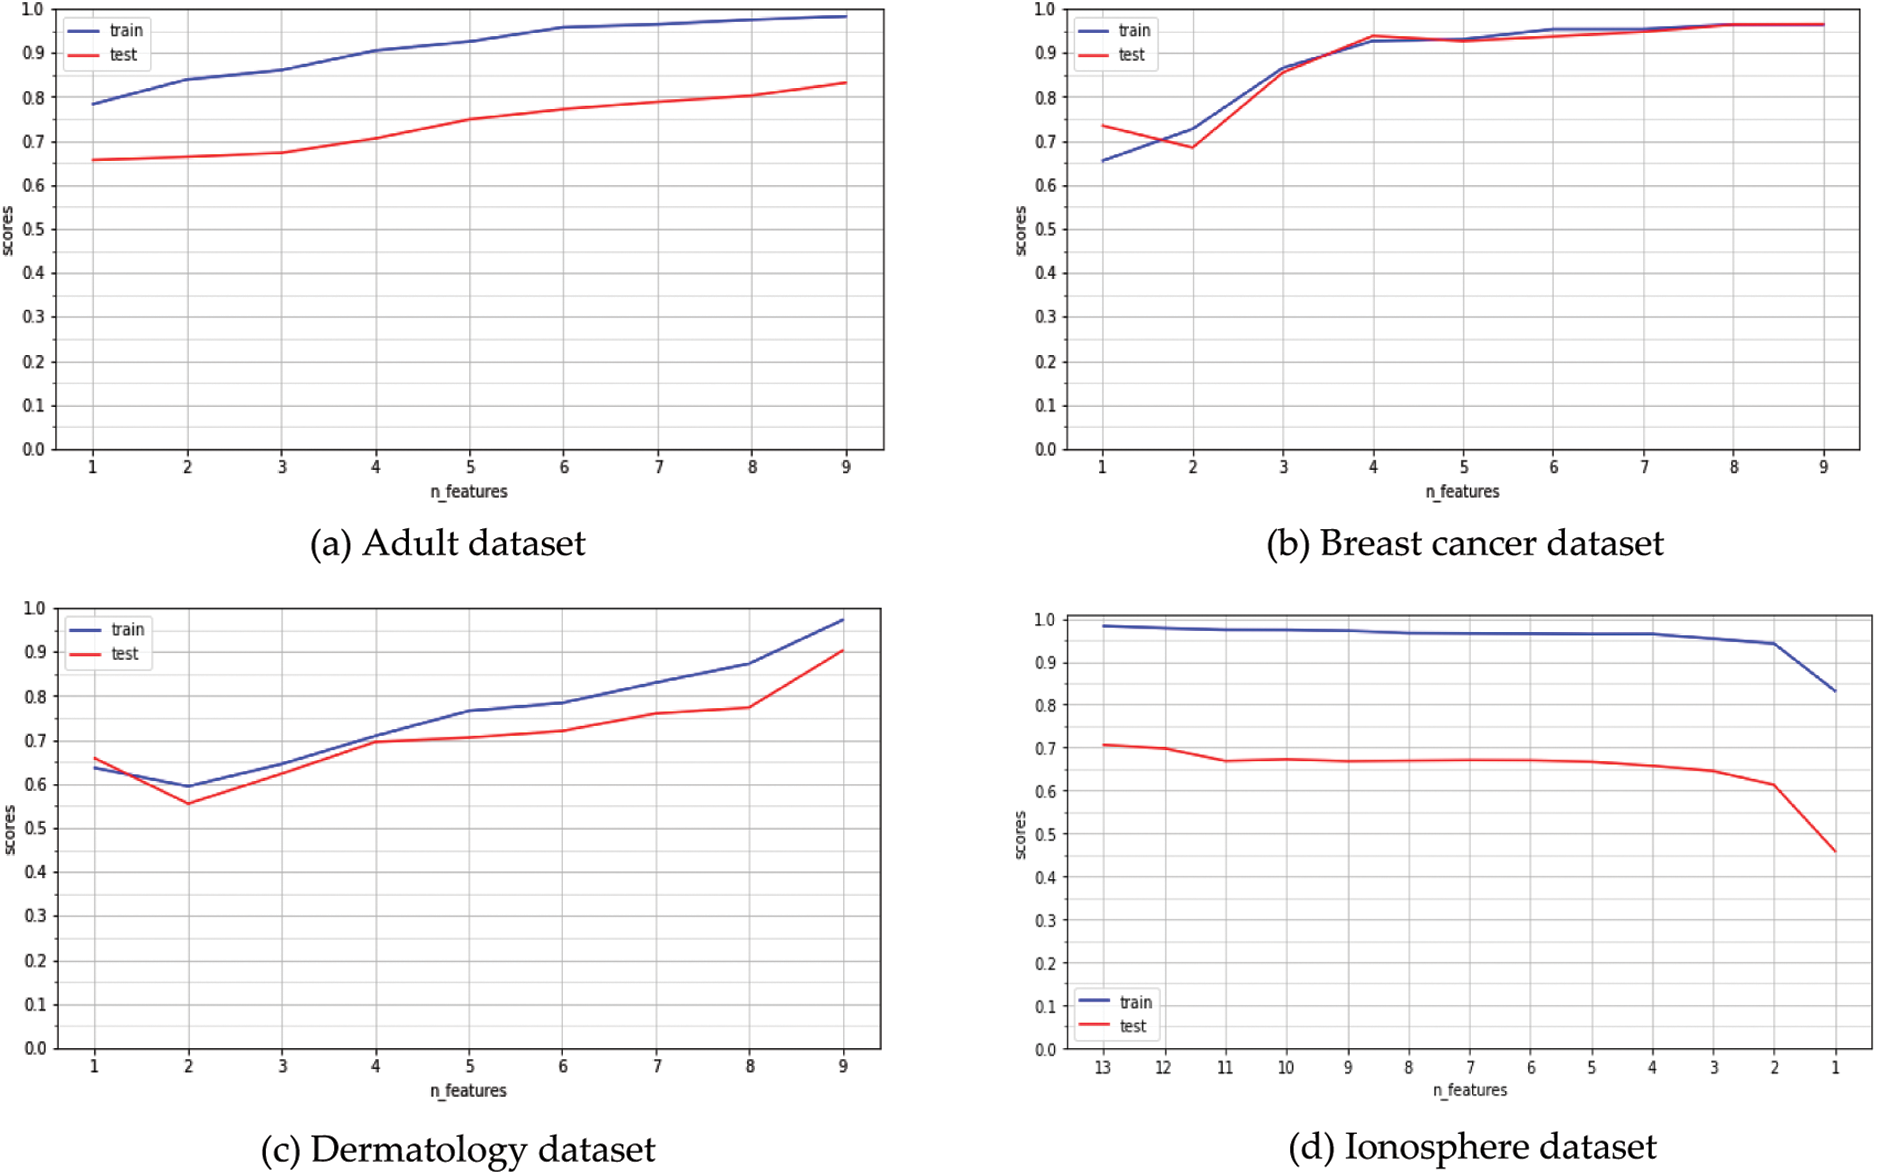
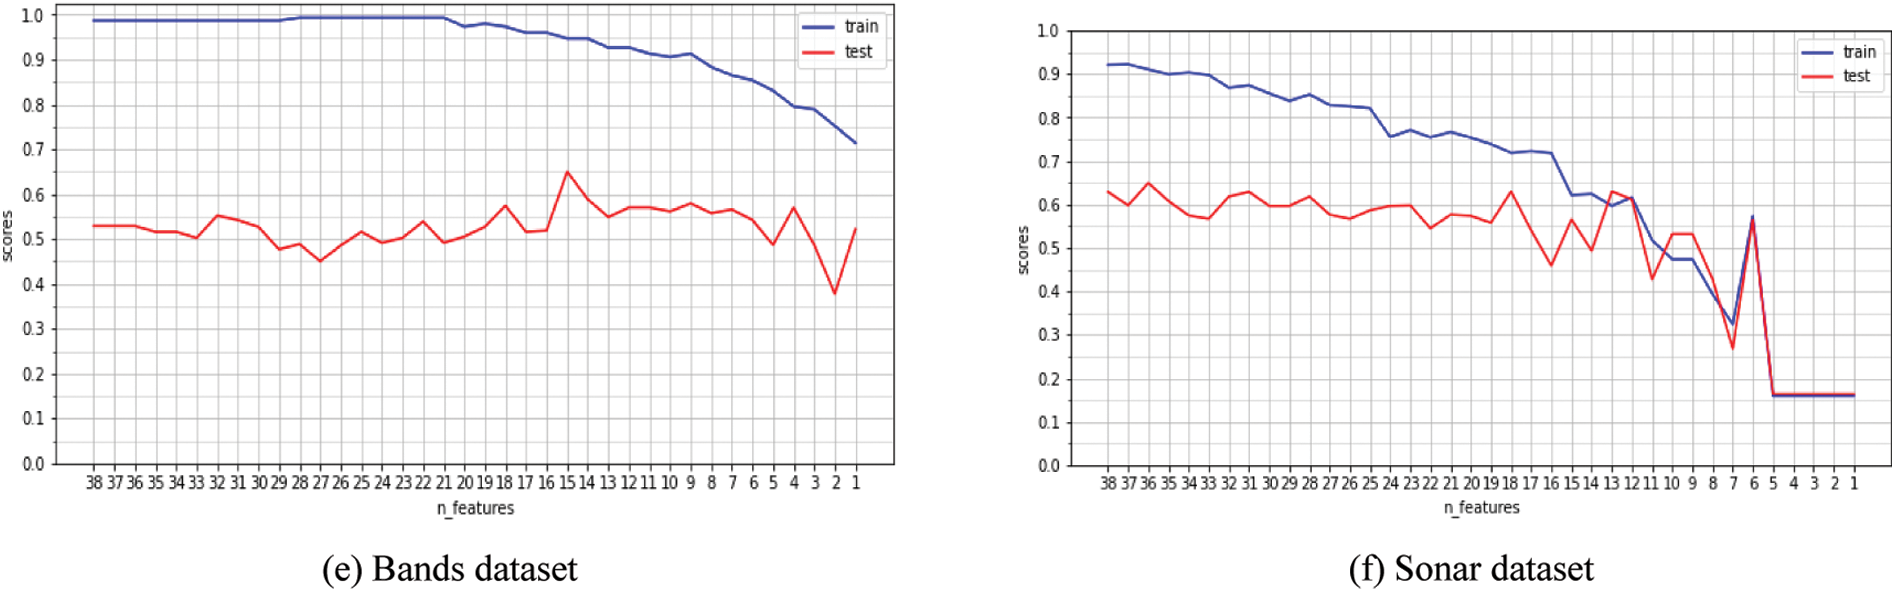
Figure 3: The average accuracy rates for each number of features from RFC model on training & test dataset.
5.4.3 Results of Hybrid and Basic Approaches Applied on (SVM) Model
According to the full analysis of Tab. 6, the best reduction strategy in testing dataset utilized on SVM was (MA-RS). On the vast majority of datasets, it has the highest accuracy. The performance improved and was so close to the real-world data. As shown in Tab. 6, the proposed hybrid technique outperforms the standard methods for all six datasets, with the performance of the proposed hybrid method improving in the band’s dataset, where accuracy and average became 95% and 95%, respectively. In most circumstances, hybrid approaches outperform conventional algorithms in terms of average and accuracy. All feature selection methods improve classification accuracy and average values across all datasets when compared to performing classification on any given dataset without feature selection. According to dermatology datasets with a 98% accuracy, the number of selected features for the best scenario was 33, while the number of selected features for the worst situation was 39. Because the band’s dataset has the most attributes, the worst-case scenario occurs. The accuracy and average at the Linear Discriminant Analysis are 68% and 54%, respectively.
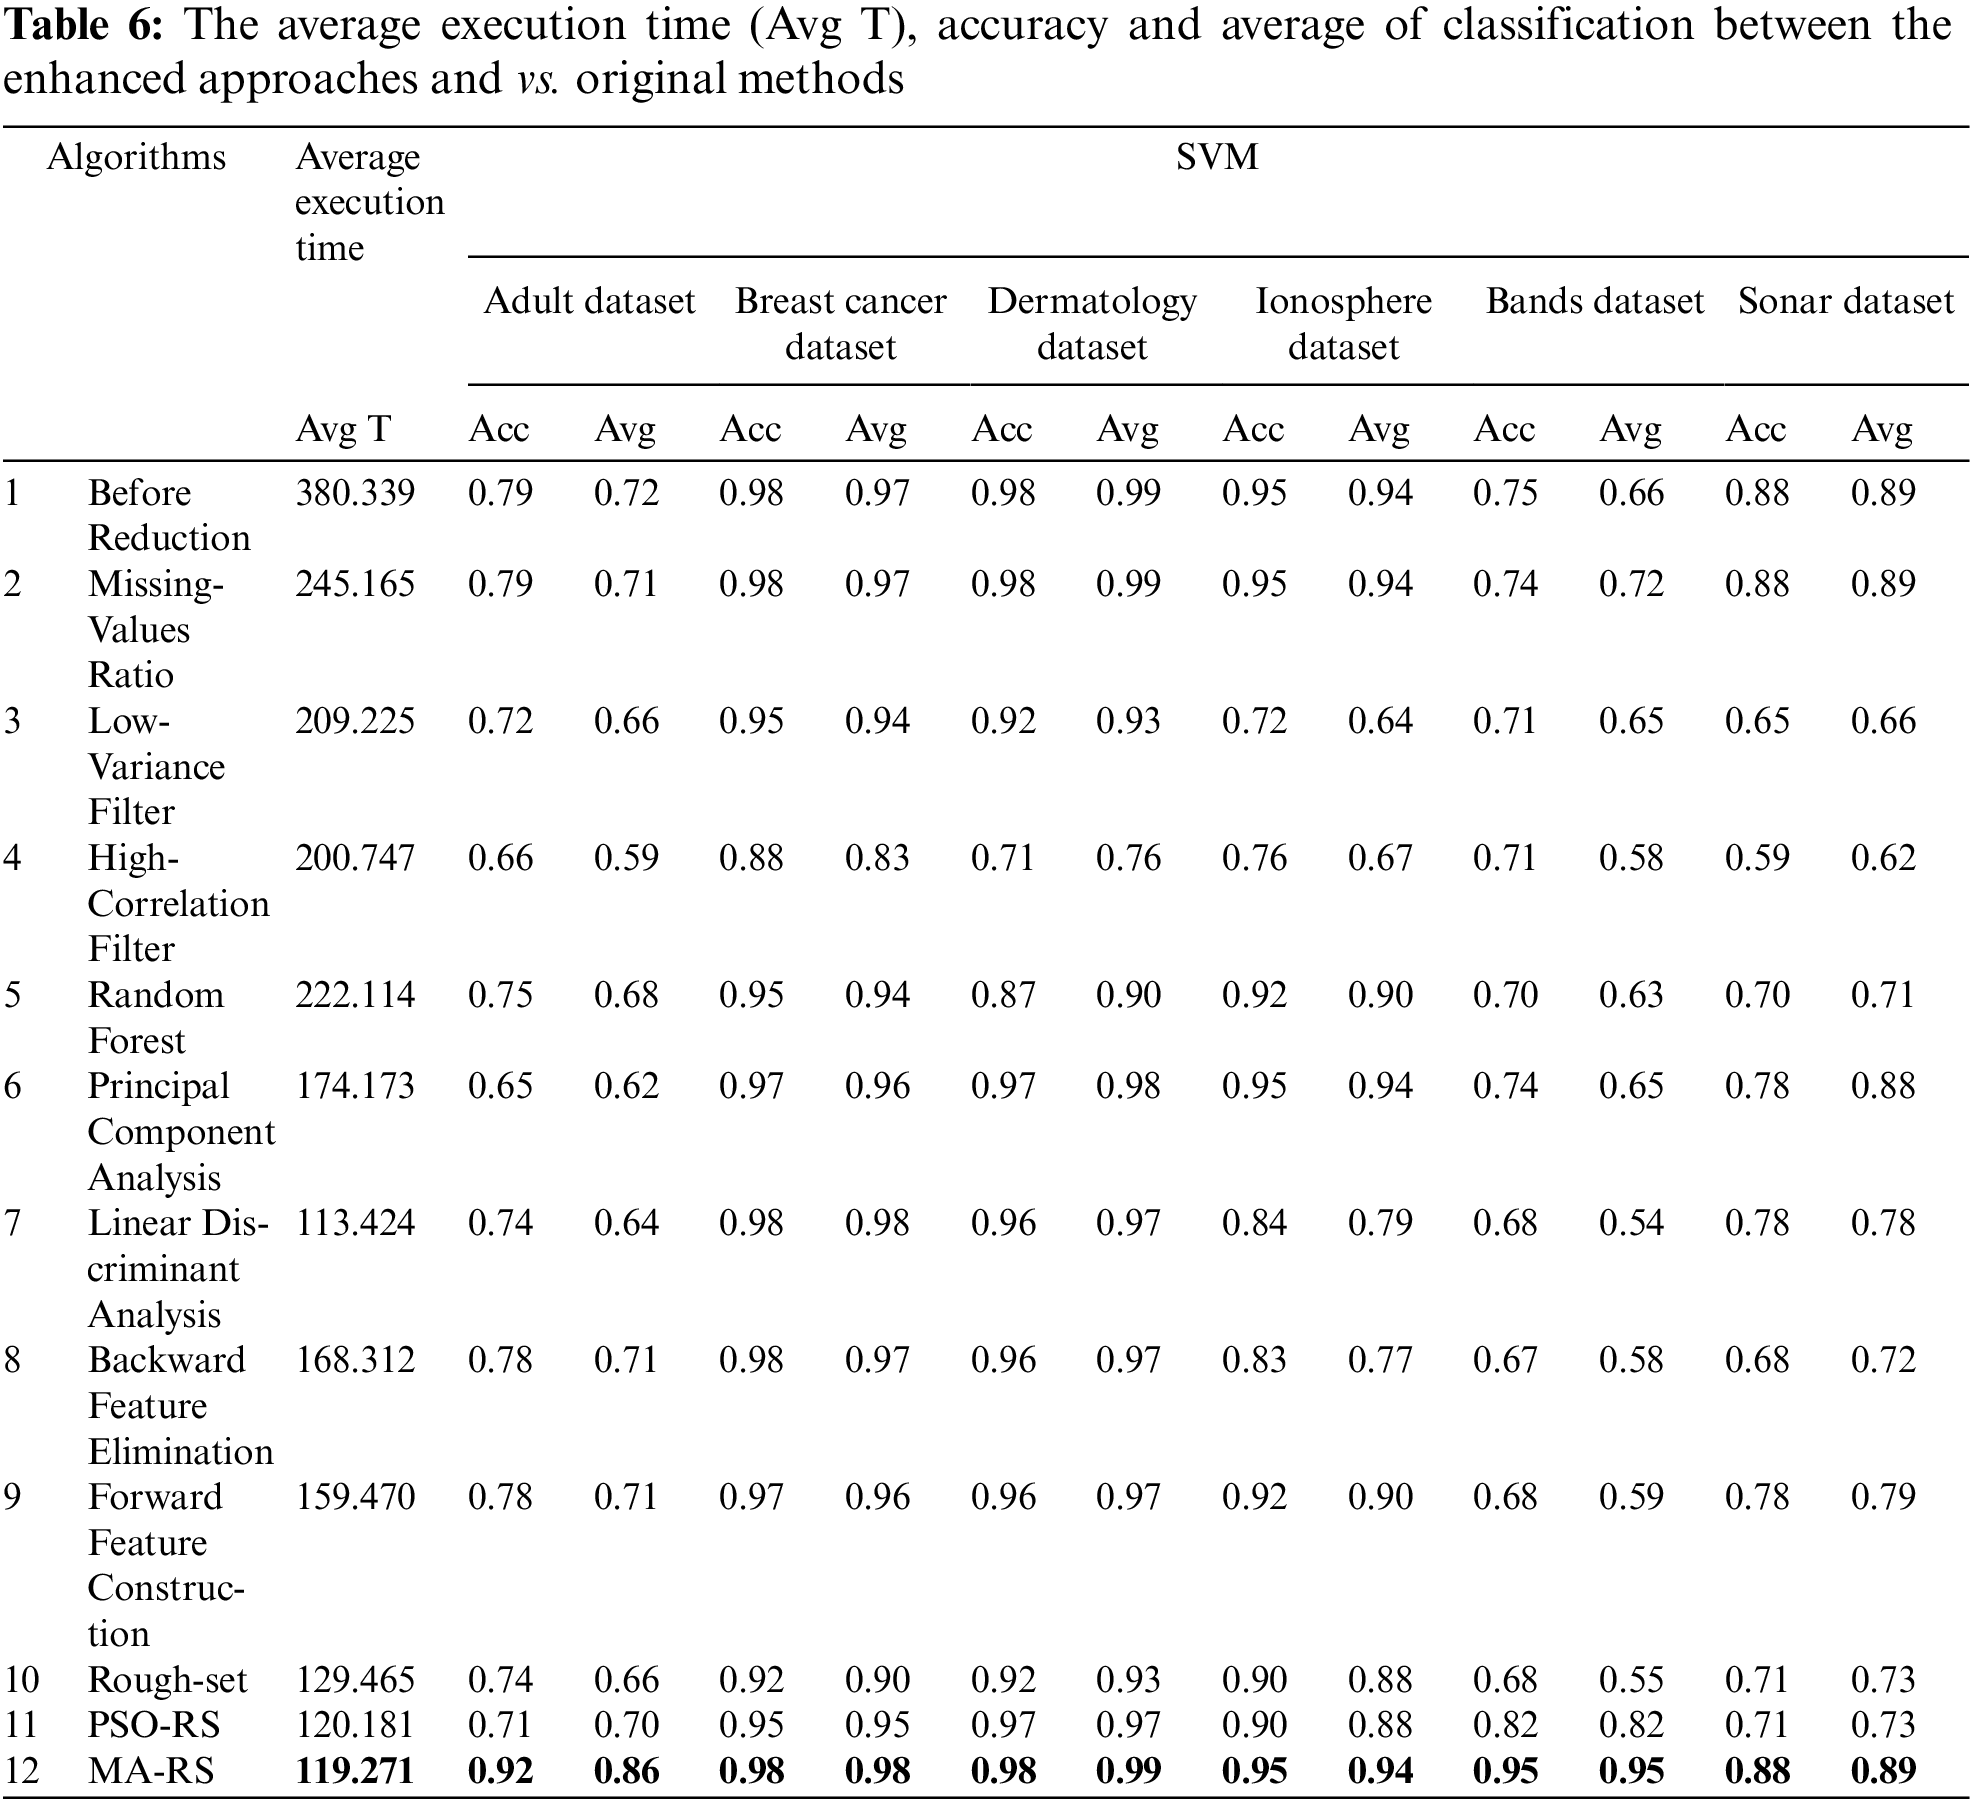
Fig. 4 illustrates the results of all approaches from six testing datasets, with the average results shown as (avg). On the hybrid methodology, the optimal reduction approach was applied (MA-RS). The number of features was reduced. The training and testing accuracy in the MA-RS algorithm ranges from 88% to 98%. As a result of the test score for the three models for each reduction technique, the best model was SVM, and the accuracy of most of the algorithms reached 98%, as shown in Fig. 5.
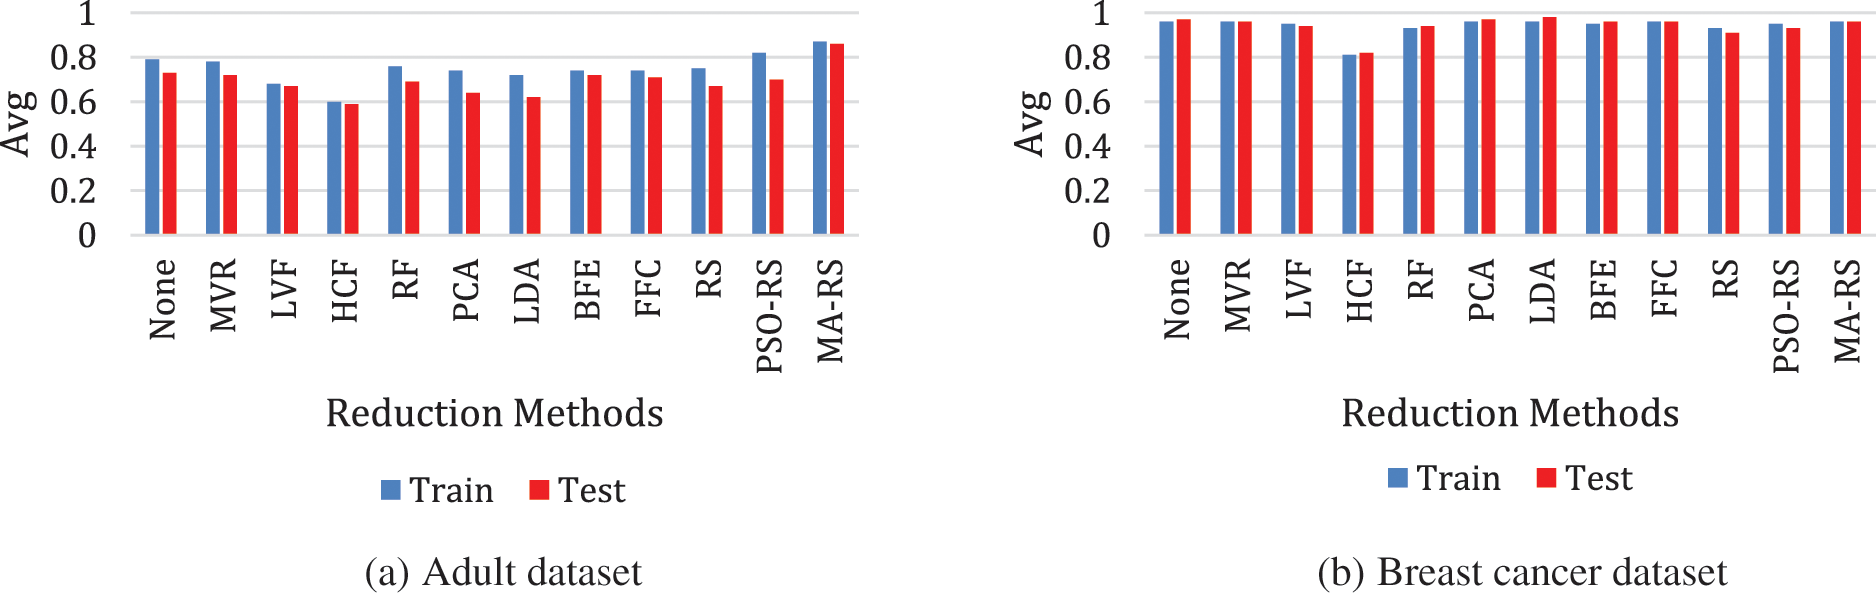
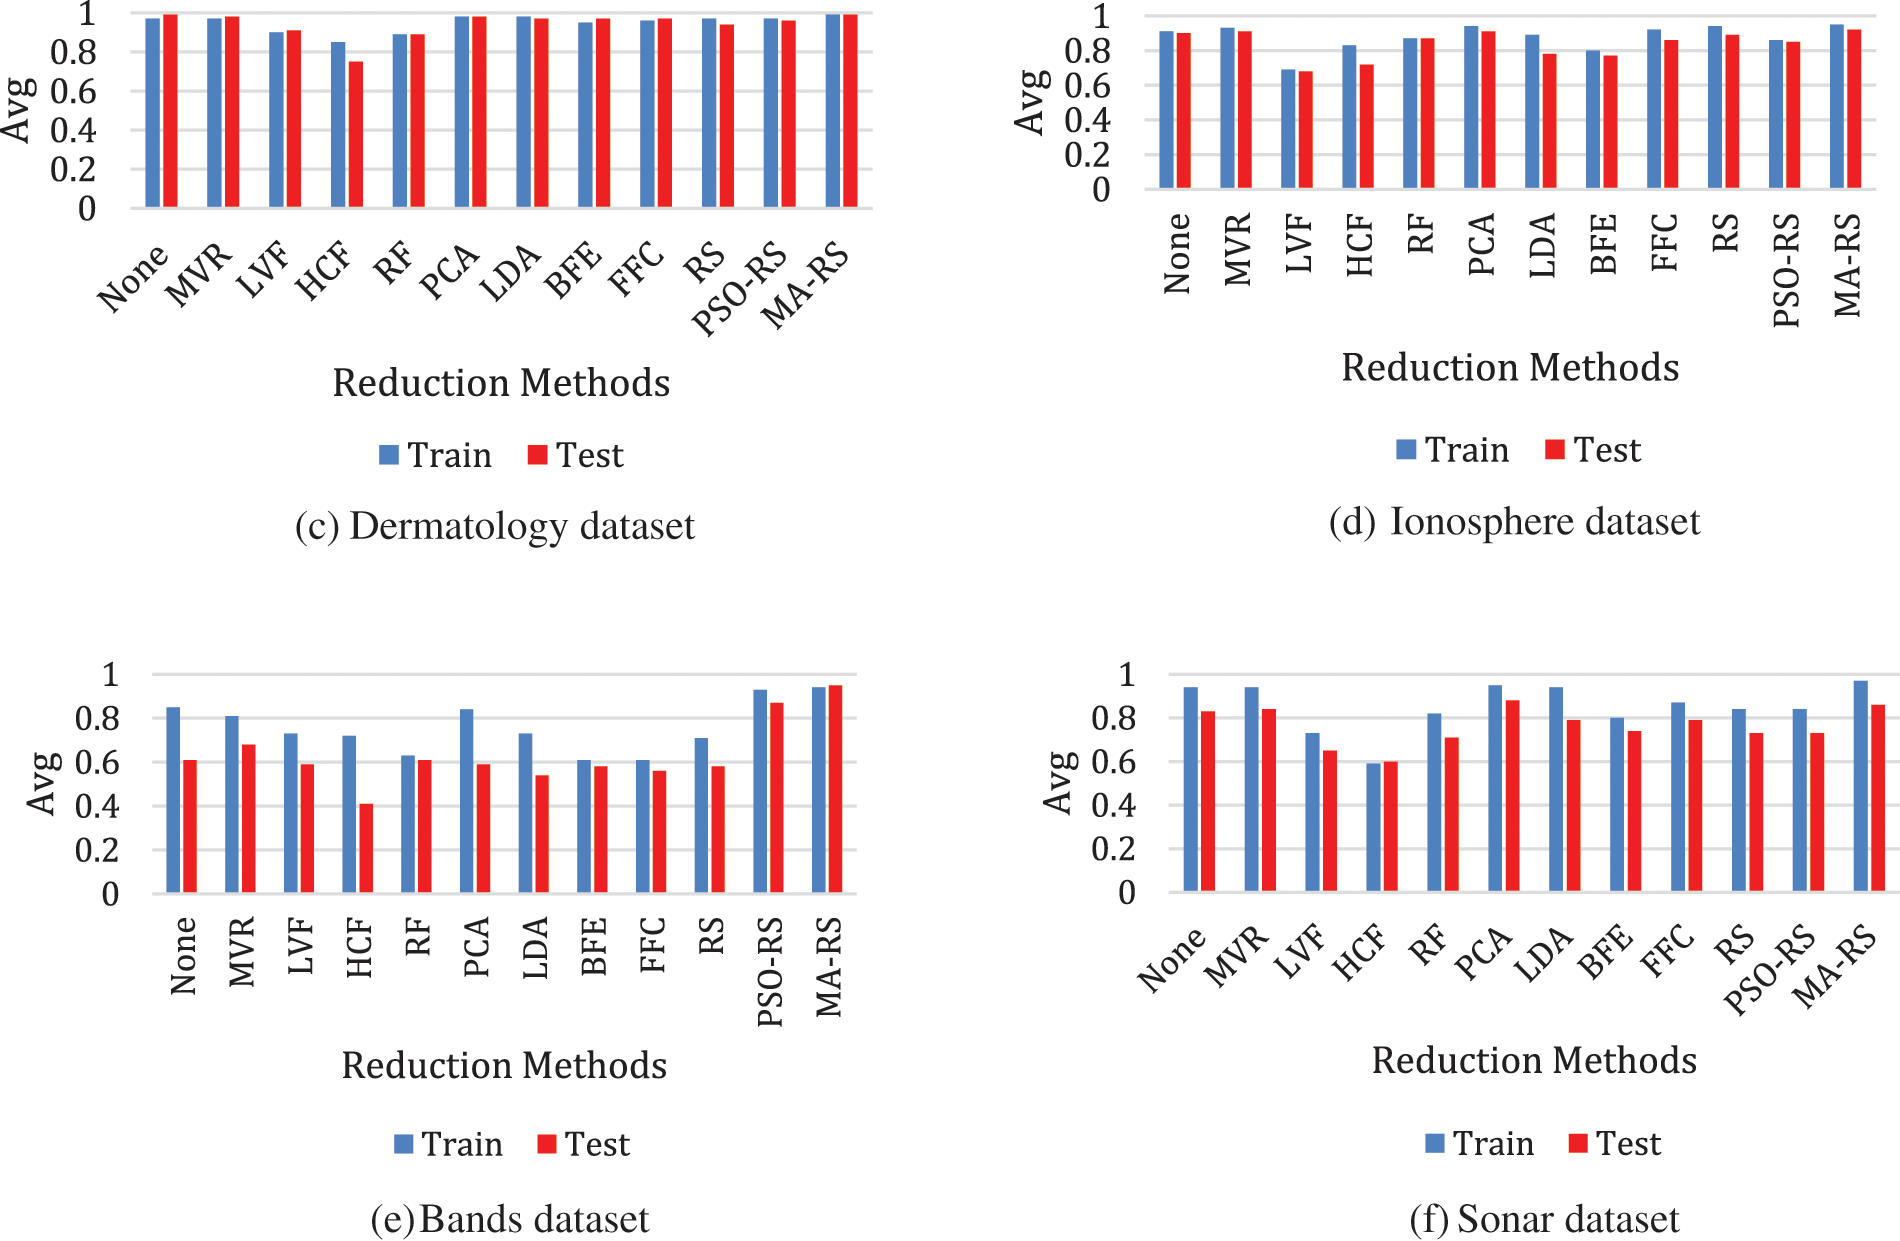
Figure 4: Result of all techniques with average results of (avg) applied on SVM model

Figure 5: Test score for three models for each reduction technique
Six distinct datasets were utilized to assess the overall performance of three different models. The MA-RS and PSO-RS dimensional reduction methods were effective at reducing overfitting and producing the best outcomes. Fig. 6 depicts the number of features picked for all datasets using RS, PSO-RS, and MA-RS. As a feature selection approach, the hybrid algorithm MA-RS surpasses all other algorithms, followed by PSO-RS.

Figure 6: Dataset feature selection
This research developed a hybrid strategy for solving big data problems that combines the benefits of rough set theory (RST) and metaheuristic optimization methods like MA, PSO, GA, etc. Metaheuristic optimization helps to make a speedy decision since it has a comprehensive search capability in the problem space and can locate and delete the fewest number of objects. We also examined some of the most prevalent methods for reducing twelve dimensions and how they affect the overfitting problem such as MVR, LVF, HCF, RF, PCA, LDA, FFC, and RS theory. These methods can help to prevent overfitting and achieve decent results. The tactics employed on six distinct datasets with three different models were compared to how well they worked for both training and testing (ANN, SVM, and RFC). The datasets were reduced in size to around half their original size, making it easier for machine-learning models to operate with them. Another advantage of dimensionality reduction is that it saves space. Experiments show that hybridization tactics increase prediction accuracy for a wide range of datasets. The new concepts are compared to current supervised algorithms that employ rough sets and other tactics to reduce the number of data points. Classification accuracy measures are used to determine how effectively the proposed strategies operate. As a result, the performance of hybridization MA and RST-based strategies outperformed the other methods. It could be used in the future to choose a set of images that share common characteristics. Another use of swarm intelligence that can be used is the Horse Herd Optimization Algorithm, often known as the Rock Hyrax Swarm Optimization.
Acknowledgement: The authors would like to acknowledge the support of Prince Sultan University for paying the Article Processing Charges (APC) of this publication. Special acknowledgement to Automated Systems & Soft Computing Lab (ASSCL), Prince Sultan University, Riyadh, Saudi Arabia.
Funding Statement: The work is funded by Prince Sultan, Riyadh, Saudi Arabia.
Conflicts of Interest: The authors declare that they have no conflicts of interest to report regarding the present study.
1. G. Jothi, H. H. Inbarani, A. T. Azar, K. M. Fouad and S. F. Sabbeh, “Modified dominance-based soft set approach for feature selection,” International Journal of Sociotechnology and Knowledge Development (IJSKD), vol. 14, no. 1, Article 36, pp. 1–20, 2022. [Google Scholar]
2. G. I. Sayed, A. E. Hassanien and A. T. Azar, “Feature selection via a novel chaotic crow search algorithm,” Neural Computing and Applications, vol. 31, no. 1, pp. 171–188, 2019. [Google Scholar]
3. H. H. Inbarani, M. Bagyamathi and A. T. Azar, “A novel hybrid feature selection method based on rough set and improved harmony search,” Neural Computing and Applications, vol. 26, no. 8, pp. 1859–1880, 2015. [Google Scholar]
4. H. H. Inbarani, A. T. Azar and G. Jothi, “Supervised hybrid feature selection based on pso and rough sets for medical diagnosis,” Computer Methods and Programs in Biomedicine, vol. 113, no. 1, pp. 175–185, 2014. [Google Scholar]
5. H. H. Inbarani, P. K. N. Banu and A. T. Azar, “Feature selection using swarm-based relative reduct technique for fetal heart rate,” Neural Computing and Applications, vol. 25, no. 3–4, pp. 793–806, 2014. [Google Scholar]
6. G. Jothi, H. H. Inbarani and A. T. Azar, “Hybrid tolerance-PSO based supervised feature selection for digital mammogram images,” International Journal of Fuzzy System Applications (IJFSA), vol. 3, no. 4, pp. 15–30, 2013. [Google Scholar]
7. Q. Hu, L. Zhang, Y. Zhou and W. Pedrycz, “Large-scale multimodality attribute reduction with multi-kernel fuzzy rough sets,” IEEE Transactions on Fuzzy Systems, vol. 26, no. 1, pp. 226–238, 2017. [Google Scholar]
8. L. Xie, Z. Li, J. Zeng and U. Kruger, “Block adaptive kernel principal component analysis for nonlinear process monitoring,” AIChE Journal, vol. 62, no. 12, pp. 4334–4345, 2016. [Google Scholar]
9. I. Aljarah, A. M. Al-Zoubi, H. Faris, M. A. Hassonah, S. Mirjalili et al., “Simultaneous feature selection and support vector machine optimization using the grasshopper optimization algorithm,” Cognitive Computation, vol. 10, pp. 478–495, 2018. [Google Scholar]
10. H. I. Demir and C. Erden, “Dynamic integrated process planning, scheduling and due-date assignment using ant colony optimization,” Computers & Industrial Engineering, vol. 149, pp. 106799, 2020. [Google Scholar]
11. M. Mafarja and S. Mirjalili, “Whale optimization approaches for wrapper feature selection,” Applied Soft Computing, vol. 62, pp. 441–453, 2018. [Google Scholar]
12. J. Li, K. Cheng, S. Wang, F. Morstatter, R. P. Trevino et al., “Feature selection: A data perspective,” ACM Computing Surveys (CSUR), vol. 50, no. 6, pp. 1–45, 2017. [Google Scholar]
13. A. J. Wootton, S. L. Taylor, C. R. Day and P. W. Haycock, “Optimizing echo state networks for static pattern recognition,” Cognitive Computation, vol. 9, no. 3, pp. 391–399, 2017. [Google Scholar]
14. N. Rana, M. S. A. Latiff and S. M. Abdulhamid et al., “Whale optimization algorithm: A systematic review of contemporary applications, modifications and developments,” Neural Computing and Applications, vol. 32, pp. 16245–16277, 2020. [Google Scholar]
15. A. A. Heidari, S. Mirjalili, H. Faris, I. Aljarah, M. Mafarja et al., “Harris hawks optimization: Algorithm and applications,” Future Generation Computer Systems, vol. 97, pp. 849–872, 2019. [Google Scholar]
16. S. Mirjalili, S. M. Mirjalili and A. Andrew Lewis, “Grey wolf optimizer,” Advances in Engineering Software, vol. 69, pp. 46–61, 2014. [Google Scholar]
17. K. Zervoudakis and S. Tsafarakis, “A mayfly optimization algorithm,” Computers & Industrial Engineering, vol. 145, pp. 106559, 2020. [Google Scholar]
18. R. C. Eberhart, and J. Kennedy, “A new optimizer using particle swarm theory,” in Proc. of the 6th Int. Symposium on Micro Machine and Human Science, (Nagoya, Japanpp. 39–43, 1995. [Google Scholar]
19. K. M. Fouad, M. M. Ismail, A. T. Azar and M. M. Arafa, “Advanced methods for missing values imputation based on similarity learning,” PeerJ Computer Science, vol. 7, pp. e619, 2021. [Google Scholar]
20. A. Zeng, T. Li, D. Liu, J. Zhang and H. Chen, “A fuzzy rough set approach for incremental feature selection on hybrid information systems,” Fuzzy Sets and Systems, vol. 258, pp. 39–60, 2015. [Google Scholar]
21. H. H. Inbarani, S. U. Kumar, A. T. Azar and A. E. Hassanien, “Hybrid rough-bijective soft set classification system,” Neural Computing and Applications, vol. 29, no. 8, pp. 67–78, 2018. [Google Scholar]
22. A. Juvonen, T. Sipola and T. Hämäläinen, “Online anomaly detection using dimensionality reduction techniques for HTTP log analysis,” Computer Networks, vol. 91, pp. 46–56, 2015. [Google Scholar]
23. M. Verleysen and D. François, “The curse of dimensionality in data mining and time series prediction,” In: Int. Work-Conf. on Artificial Neural Networks, Springer, Berlin, Heidelberg, vol 3512, pp. 758–770, 2005. [Google Scholar]
24. K. Pearson, “Liii. on lines and planes of closest fit to systems of points in space,” the London, Edinburgh, and Dublin Philosophical Magazine and Journal of Science, vol. 2, no. 11, pp. 559–572, 1901. [Google Scholar]
25. H. Hotelling. “Analysis of a complex of statistical variables into principal components,” Journal of Educational Psychology, vol. 24, no. 6, pp. 417–441, 1993. [Google Scholar]
26. S. Li., K. Zhang, Q. Chen, S. Wang and S. Zhang, “Feature selection for high dimensional data using weighted K-nearest neighbors and genetic algorithm,” IEEE Access, vol. 8, pp. 139512–139528, 2020. [Google Scholar]
27. F. S. Hosseini, B. Choubin, A. Mosavi, N. Nabipour, S. Shamshirband et al., “Flash-flood hazard assessment using ensembles and Bayesian-based machine learning models: Application of the simulated annealing feature selection method science of the total environment,” Science of The Total Environment, vol. 711, Article 135161, pp. 1–44, 2020. https://doi.org/10.1016/j.scitotenv.2019.135161. [Google Scholar]
28. M. M. Mafarja and S. Mirjalili, “Hybrid whale optimization algorithm with simulated annealing for feature selection,” Neurocomputing, vol. 260, pp. 302–312, 2017. [Google Scholar]
29. M. A. Tawhid and A. M. Ibrahim, “Hybrid binary particle swarm optimization and flower pollination algorithm based on rough set approach for feature selection problem,” In: Yang X. S., He X. S. (eds) Nature-Inspired Computation in Data Mining and Machine Learning. Studies in Computational Intelligence, vol 855, pp. 249–273, 2020, Springer, Cham. [Google Scholar]
30. D. Dua and C. Graff, “UCI machine learning repository,” University of California, Irvine, School of Information and Computer Sciences, 2017, http://archive.ics.uci.edu/ml. [Google Scholar]
31. Too, J., Abdullah, A. R., and Mohd Saad, N., “Hybrid binary particle swarm optimization differential evolution-based feature selection for EMG signals classification,” Axioms, vol. 8, pp. 79, 2019. [Google Scholar]
32. M. Mafarja, I. Aljarah, A. A. Heidari, A. I. Hammouri, H. Faris et al., “Evolutionary population dynamics and grasshopper optimization approaches for feature selection problems,” Knowledge-Based Systems, vol. 145, pp. 25–45, 2018. [Google Scholar]
33. M. Panirim, M. B. Dowlatshahi and H. Nezamabadi-pour, “MLACO: A multi-label feature selection algorithm based on ant colony optimization,” Knowledge-Based Systems, vol. 192, no. 2020, Article 105285, pp. 1–40, 2020. https://doi.org/10.1016/j.knosys.2019.105285. [Google Scholar]
34. F. A. Mohamed, M. A. Nasser, K. Mahmoud and S. Kamel, “Accurate economic dispatch solution using hybrid whale-wolf optimization method,” in 2017 Nineteenth Int. Middle East Power Systems Conf. (MEPCON), Cairo, Egypt, pp. 922–927, 2017. https://doi.org/10.1109/MEPCON.2017.8301290. [Google Scholar]
35. N. Singh and H. Hachimi, “A new hybrid whale optimizer algorithm with mean strategy of grey wolf optimizer for global optimization,” Mathematical and Computational Applications, vol. 23, pp. 1–14, 2018. [Google Scholar]
36. A. N. Jadhav and N. Gomathi, “WGC: Hybridization of exponential grey wolf optimizer with whale optimization for data clustering,” Alexandria Engineering Journal, vol. 57, no. 3, pp. 1569–1584, 2018. [Google Scholar]
37. J. Too and S. Mirjalili, “A hyper learning binary dragonfly algorithm for feature selection: A COVID-19 case study,” Knowledge-Based Systems, vol. 2020, Article 106553, pp. 1–16, 2020. https://doi.org/10.1016/j.knosys.2020.106553. [Google Scholar]
38. J. D. Allan and A. S. Flecker, “The mating biology of a mass-swarming mayfly,” Animal Behaviour, vol. 37, no. 3, pp. 361–371, 1989. [Google Scholar]
39. J. Zhao and Z. M. Gao, “The negative mayfly optimization algorithm,” Journal of Physics: Conference Series, vol. 1693, no. 1, pp. 012098, 2020. IOP Publishing. [Google Scholar]
40. W. Sun, G. Z. Dai, X. R. Zhang, X. Z. He and X. Chen, “TBE-Net: A three-branch embedding network with part-aware ability and feature complementary learning for vehicle re-identification,” IEEE Transactions on Intelligent Transportation Systems, pp. 1–13, 2021. https://doi.org/10.1109/TITS.2021.3130403. [Google Scholar]
41. W. Sun, L. Dai, X. R. Zhang, P. S. Chang and X. Z. He, “RSOD: Real-time small object detection algorithm in UAV-based traffic monitoring,” Applied Intelligence, pp. 1–16, 2021. https://doi.org/10.1007/s10489-021-02893-3. [Google Scholar]
 | This work is licensed under a Creative Commons Attribution 4.0 International License, which permits unrestricted use, distribution, and reproduction in any medium, provided the original work is properly cited. |