DOI:10.32604/cmc.2022.028294
| Computers, Materials & Continua DOI:10.32604/cmc.2022.028294 | |
| Article |
Design and Analysis of Antipodal Vivaldi Antennas for Breast Cancer Detection
Department of Electrical and Computer Engineering, Faculty of Engineering, King Mongkut's University of Technology North Bangkok (KMUTNB), Bangkok, 10800, Thailand
*Corresponding Author: Wanwisa Thaiwirot. Email: wanwisa.t@eng.kmutnb.ac.th
Received: 07 February 2022; Accepted: 23 March 2022
Abstract: This paper presents the design and analysis of antipodal Vivaldi antennas (AVAs) for breast cancer detection. In order to enhance the antenna gain, different techniques such as using the uniform and non-uniform corrugation, expanding the dielectric substrate and adding the parasitic patch are applied to original AVA. The design procedure of two developed AVA structures i.e., AVA with non-uniform corrugation and AVA with parasitic patch are presented. The proposed AVAs are designed on inexpensive FR4 substrate. The AVA with non-uniform corrugation has compact dimension of
Keywords: Ultra-wideband antenna; tapered slot antenna; antipodal vivaldi antenna; high gain antenna; breast cancer detection
Nowadays, wireless communication technology in microwave frequency range has been applied in both commercial and industrial applications. In addition, it has received a great attention in applying to medical applications such as telemedicine and medical imaging [1–3]. The breast cancer has the highest rate of incidence in women and it leads to the cause of death among women around the world [4]. Therefore, early diagnosis of breast cancer can increase the chances of successful treatment. Currently, the clinical methods are often used for diagnosing breast cancer such as X-ray mammography, Ultrasound imaging and magnetic resonance imaging (MRI) [5]. However, X-ray mammography has false negative diagnoses between 4% to 30% and false positive more than 5% [6]. In addition, mammography is often painful from breast compression during examination [7] and it can also generate ionizing radiation causing the cancerous of healthy tissue [8]. Ultrasound imaging is a painless technique compared to X-ray mammography. However, this technique has low accurate to distinguish between normal and malignant tissues [9]. The MRI is a medical imaging technique that has high sensitivity and accuracy. However, the MRI examination is very expensive [10]. To overcome these limitations, breast cancer detection through electromagnetic radiation in microwave frequency range has received attention in recent years. The advantages of microwave-based detection techniques are accurate, low cost, low complexity, nonionizing radiation and comfortable breast detections. These techniques are based on the difference of electrical properties between normal and malignant tissues to detect breast tumors. The electrical properties of malignant tissue are 5 to 10 times larger than those of normal breast tissue [11]. The antenna is one of important elements to use in the microwave breast imaging system. To increase resolution of microwave imaging system, the several antennas are arranged around the breast [12]. However, the detection accuracy may be reduced due to the mutual coupling between antenna elements, which are placed close to each other. To overcome these problems, a single scanning antenna is used for breast cancer detection and microwave imaging system [13]. It is found that the ultra-wideband (UWB) antennas are used because wide range of frequency points are used in microwave imaging algorithm and breast cancer detection. The antipodal Vivaldi antennas (AVAs) are suitable for breast cancer detection system because it can provide ultra-wide bandwidth and good radiation characteristics [14]. The design of AVA to obtain the desired performance, while maintaining the compact size and low manufacturing complexity, is challenging. Various techniques have been reported to improve the performance of AVA such as the use of metamaterial, the dielectric director or dielectric lens, corrugation or slot edge and parasitic patch [15]. The different types of metamaterial unit cells such as negative index metamaterial (NIM) [16], zero index metamaterial (ZIM) [17] and epsilon near zero (ENZ) [18] metamaterial are loaded into the AVA structure to enhance the gain. However, metamaterial unit cells increase complexity in antenna design. Moreover, the dielectric director or dielectric lens as an extension of antenna substrate is introduced in front of the AVA to improve the antenna gain, especially at higher frequencies [19]. The dielectric lens can be produced by using special shape of dielectric substrate [20,21]. Though this technique provides good performance but it leads to increase the antenna size and does not improve the gain at lower frequencies. Therefore, the corrugation on the both edges of the AVA is used to enhance the gain and radiation pattern especially at low frequency range without increasing the antenna size. It is found that cutting the exponential slots on both sides of conducting arms can increase the electrical length of the AVA, leading to extend the lowest edge frequency and improve radiation pattern [22,23]. Moreover, the several uniform corrugations with simple slot shapes are considered [24]. However, it is well known that the slot length and shape of corrugation have a direct impact on the reflection coefficient and radiation characteristics. Therefore, the non-uniform corrugation is focused instead of the uniform corrugation [25,26]. Furthermore, the various shapes of parasitic are added in the flare aperture for enhancing the directivity and gain of AVA [27–30]. It is known that the design of parasitic patch increases complexity because it depends on the shape, size and position of the parasitic patch. However, the electric field distribution of AVA with parasitic patch is focused toward the end-fire direction which is desired for near-field microwave imaging medical applications.
This paper presents the design and analysis of ultra-wideband antipodal Vivaldi antennas for breast cancer detection. Two candidate AVA structures i.e., AVA with non-uniform corrugation and AVA with parasitic patch and corrugation are presented. Then, the design and fabrication procedure of breast phantom by using a gelatine-oil mixture technology are detailed. The prototype of proposed AVAs are simulated, fabricated and measured with breast phantom in order to detect the cancerous cell inside the breast. In addition, the different AVA structures i.e., original AVA, AVA with dielectric lens in [19] and proposed AVAs are compared performance for breast cancer detection. The design of proposed antenna is proven ability of enhancing the directivity and improving the electric field distribution at higher frequencies without design complexity. These properties of antenna are desired for breast cancer detection and microwave imaging applications.
In this section, the design of two AVA structures i.e., AVA with non-uniform corrugation and AVA with parasitic patch and corrugation are proposed. The characteristics of the proposed AVAs were optimized by using CST microwave studio to operate in frequency range from 3–8 GHz for breast cancer detection. The reflection coefficient measurements are performed using a vector network analyzer (Agilent Technologies E5071C ENA Series 9 kHz-8.5 GHz) between 1 and 8.5 GHz. Moreover, a far-field anechoic chamber is used to measured the radiation pattern and gain.
2.1 Antipodal Vivaldi Antenna with Non-Uniform Corrugation
The proposed AVA geometry and parameters are depicted in Fig. 1. The antenna is designed on a double metallic side of FR4 substrate with the relative permittivity of 4.4, the loss tangent of 0.019 and thickness of 1.6 mm. The FR4 substrate is selected for this design because of its low cost and convenient availability. The basic configuration of the AVA consists of two main parts: tapered slot radiator and feeding transition as shown in Fig. 1a. The tapered slot radiator is constructed by two conducting arms which are symmetrically printed on opposite sides of dielectric substrate with respect to the x-axis. The inner curves of conducting arms are main contribution of radiation. It is found that exponentially tapered slot is mostly used because of its least side-lobe level and wide bandwidth [15,31]. The exponential function for the inner curves of conducting arms is given by
where
The
where A1 and A2 can be calculated by using Eqs. (2) and (3). The exponential curve of ground plane has starting point at (0, W/2) and terminus point at (Lf, Wh/2). Parameter P is a curvature rate of the exponential function of the ground plane. It should be note that the antenna can radiate efficiently when W is larger than
In addition, the radiation characteristics within the entire operating frequency can be improved by using corrugation on both edges of conducting arms. It is well known that the slot length and slot shape affect the radiation characteristics such as directivity, gain and F/B ratio. Therefore, the non-uniform cosine corrugation is considered as shown in Fig. 1. The cosine-shaped corrugation is selected in this work because it can provide stable gain in the middle frequency band [24]. The equation of cosine-shaped corrugation is represented by
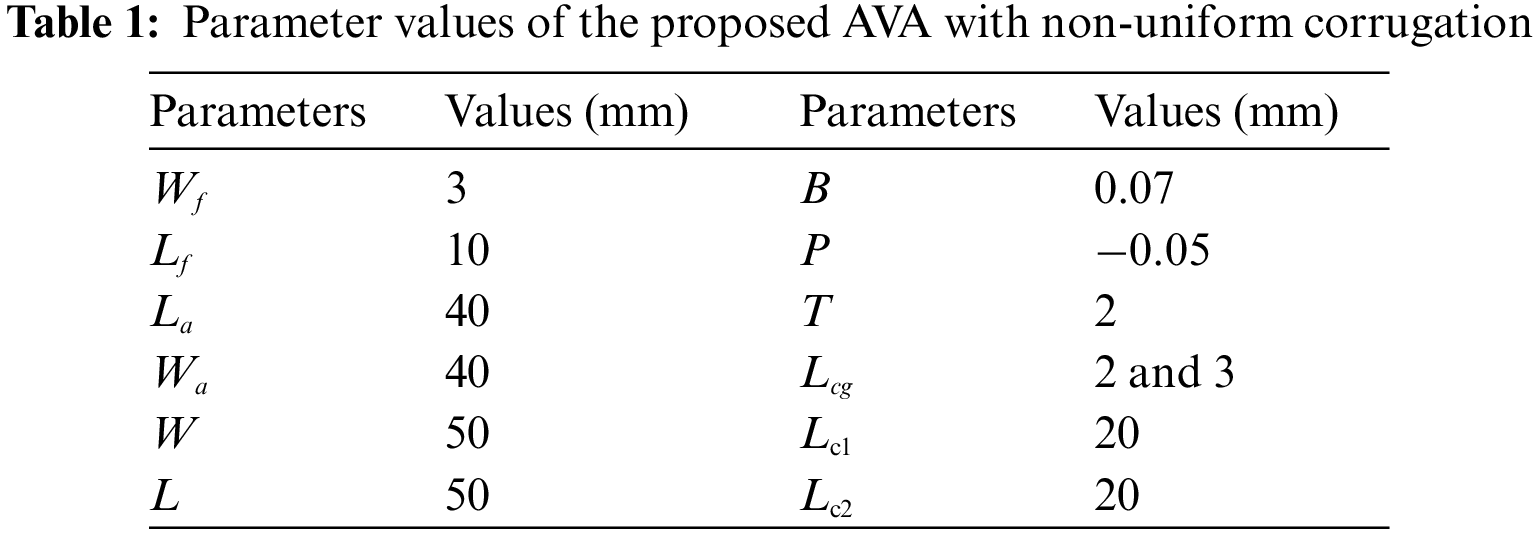
where Ac is amplitude, T is period, Lcg is slot length and Lcg = 2Ac. The overall size of the proposed AVA with non-uniform corrugation is 50 mm × 50 mm and the final dimensions are summarized in Tab. 1.

Figure 1: Geometry of the proposed antenna: (a) original AVA (without corrugation) (b) AVA with non-uniform cosine-shaped corrugation (c) fabricated antenna
The simulated reflection coefficient (S11) and gain of original AVA (without corrugation) and the AVA with corrugation are compared in Fig. 2. It can be observed that the proposed AVA without and with corrugation can operate in the frequency range from 1.63 GHz to over 12 GHz. Although the corrugation causes a poor impedance matching at frequency around 2.5 GHz but the antenna gain is obviously improved as illustrated in Fig. 2b. It can be observed at frequency range from 3 to 7 GHz as the antenna gain increases the slot length increases. However, the longer slot length also causes the long effective length of current path on the corrugated edges, leading to more loss at the higher frequency region. Therefore, the non-uniform corrugation profiles are considered in this paper. It is found that the use of non-uniform corrugation, which is the combination of the slot length as 2 and 3 mm, can enhance the gain of original AVA around 1 dBi at 6 GHz without increasing the antenna size.

Figure 2: Simulated S11 and gain of proposed AVA with different slot length of corrugation (a) S11 (b) gain
Then, the prototype of the proposed AVA with non-uniform corrugation is fabricated as shown in Fig. 1c. The comparison between simulated and measured S11 of the proposed AVA with non-uniform corrugation is shown in Fig. 3a. It is found from the measured result that the proposed antenna can achieve a very wide impedance bandwidth, covering in the frequency range from 1.63 GHz to over 8 GHz. Moreover, the comparison between simulated and measured gain of the proposed antenna is depicted in Fig. 3b. The proposed antenna has a maximum gain of around 9.03 dBi at 7 GHz. Furthermore, the simulated and measured far-field radiation patterns of the proposed antenna in xy-plane and xz-plane at 4, 6 and 8 GHz are depicted in Fig. 4. The radiation patterns of proposed antenna show a good end-fire direction (x-direction). It can be seen that the measured results of AVA with non-uniform cosine-shaped corrugation is quite agreement with the simulated results. The simulated and measured results slightly differ due to fabrication tolerances and tolerance of relative permittivity [32]. The differences between simulated and measured results are also caused by losses from the soldering of the SMA connector, as an ideal connecter is used in simulations. Moreover, the differences between radiation patterns and gain are also caused by misalignment between the transmitting and receiving antennas.

Figure 3: Comparison between simulated and measured S11 and gain of proposed AVA with non-uniform corrugation (a) S11 (b) gain


Figure 4: Comparison between simulated and measured radiation patterns of proposed AVA with non-uniform corrugation in xy-plane and xz-plane (a) 4 GHz (b) 6 GHz (c) 8 GHz
2.2 Antipodal Vivaldi Antenna with Parasitic Patch and Uniform Corrugation
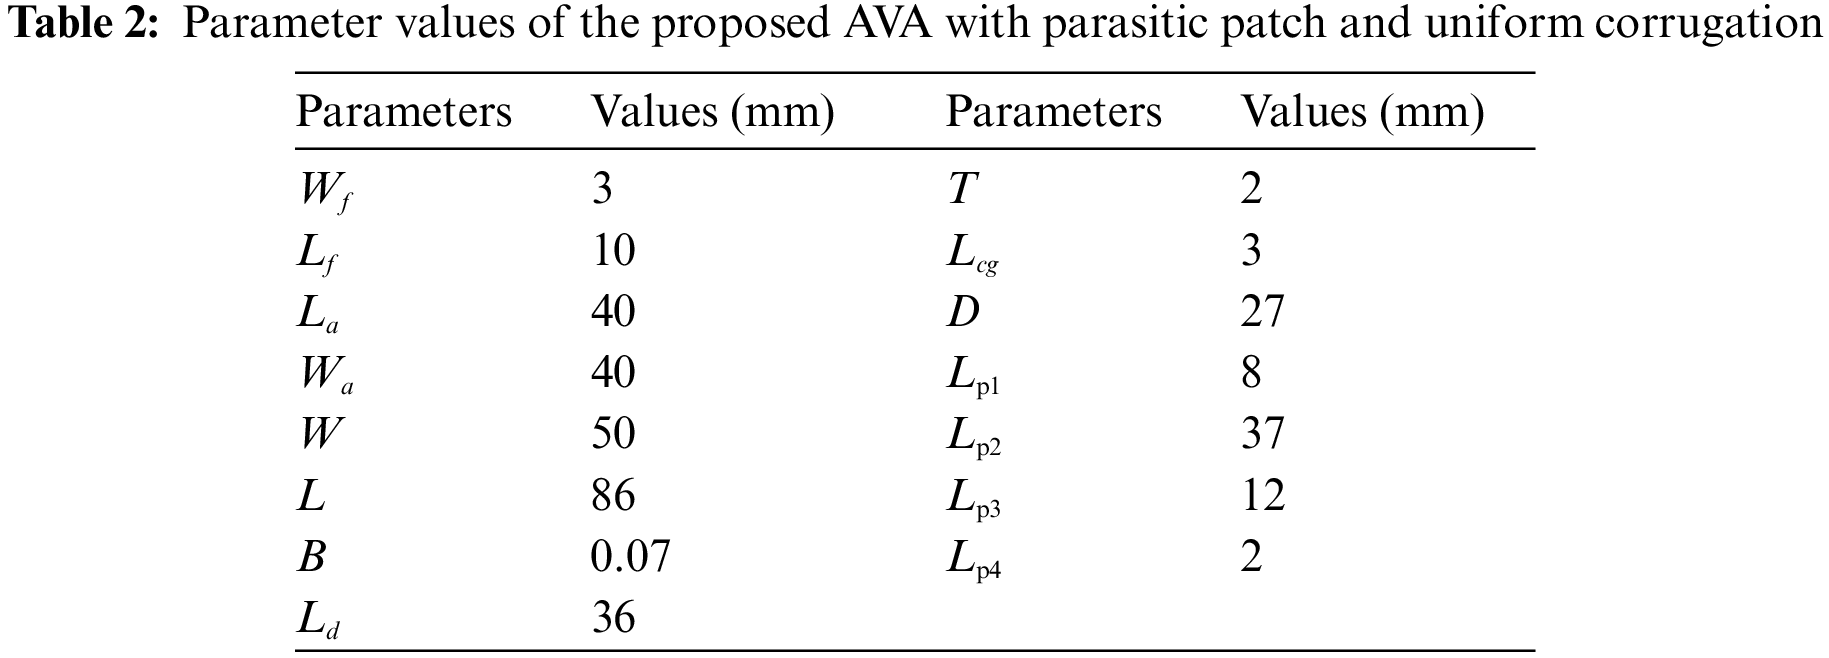
The proposed AVA with parasitic patch and uniform cosine corrugation is illustrated in Fig. 5. The conducting arms are similar to the AVA with non-uniform corrugation mentioned above. The microstrip line with a part of cosine-shaped ground plane is used as feeding transition to obtain good impedance matching over the whole operating frequency. Then, the uniform cosine-shaped corrugation is etched on the both side edges of AVA in order to improve the gain at lower frequencies. In addition, the parasitic patch is placed on both sides of dielectric substrate at distance D away from the center of tapered conducting arms to contribute the radiation in end-fire direction. It is known that the field distribution produced in the AVA aperture depends on shape, size and position of parasitic patch. Therefore, the parameters of parasitic patch i.e., Lp1, Lp2, Lp3, Lp4, Lp5 and D are optimized by a parametric study. The overall size of the antenna is 50 mm × 86 mm. The length of dielectric substrate Ld is extended longer than that of original AVA. The final dimensions of proposed AVA with parasitic patch and uniform cosine-shaped corrugation are detailed in Tab. 2.

Figure 5: The proposed AVA with parasitic patch and corrugation (a) geometric layout (b) front view (c) back view
In order to clearly describe the design guideline of proposed antenna, the antenna evolution is shown in Fig. 6. The simulated S11 and gain of different AVA structures corresponding in Fig. 6 are illustrated in Fig. 7. For design procedure, it starts with designing the original AVA as shown in Fig. 6a. The curvature rate of exponentially tapered slot, microstrip line and cosine curve of ground plane are tuned until desired characteristics are obtained. It can be observed from Fig. 7a that the original AVA can operate in frequency range from 1.55 GHz to beyond 12 GHz. However, the gain of original AVA is relatively low, especially at lower frequencies as depicted in Fig. 7b. Therefore, the uniform cosine corrugation is added on both side edges of original AVA as depicted in Fig. 6b and it is named as Ant. 1. By using the corrugation, the gain is enhanced over the entire operating frequency of interest, except for frequencies close to 8 GHz. The impedance bandwidth of Ant. 1 still covers desired frequency. To improve the gain at higher frequencies, the dielectric substrate of AVA is expanded with rectangular frame and it is named as Ant. 2 (see Fig. 6c). It is clearly seen that the gain of Ant. 2 significantly increases when lengthening the dielectric substrate. For impedance bandwidth, increasing the length of dielectric substrate does not affect the operating frequency of interest. For the final design, the parasitic patch is placed at the tapered slot in order to focus the energy in end-fire direction. The size (Lp1, Lp2, Lp3, Lp4, Lp5) and position in the aperture (D) of parasitic patch are optimized to improve the field coupling between the patch and conducting arms. It is found from parametric study that the length Lp2 has slightly impact on the impedance bandwidth and gain, while length Lp1 can be used to control impedance matching at higher frequencies. The width of parasitic patch (Lp3) is found to have significant effect on the impedance matching and gain over the entire bandwidth. As Lp3 increases, the impedance matching is improved at middle frequency but the gain decreases at higher frequencies. Therefore, the gain of antenna can be controlled by adjusting the width of parasitic patch. In addition, the position of parasitic patch (D) needs to be located within the tapered slot to enhance the field coupling. For the distance D >40 mm, which the parasitic patch is far away from the aperture, the gain starts to reduce at frequency higher than 8 GHz. From simulated results, the proposed antenna can operate at the frequency range from 1.55 GHz to over 12 GHz with good radiation characteristics than other modification.

Figure 6: Geometry of different antennas: (a) original antenna (b) Ant. 1 (c) Ant. 2 (d) Ant. 3 (proposed antenna)

Figure 7: Simulated S11 and gain of different antennas corresponding in Fig. 6 (a) S11 (b) gain
In order to confirm the simulated results, the prototype of proposed AVA with parasitic patch and uniform corrugation is fabricated as illustrated in Fig. 5. The simulated and measured S11 of antenna are shown in Fig. 8a. It can be observed that the −10 dB reflection coefficient bandwidth starts from 1.4 GHz to over 8 GHz. Moreover, the simulated and measured gain against frequency are depicted in Fig. 8b. The minimum and maximum gain over frequency of interest is 5.38 dBi and 11.01 dBi, respectively. The simulated and measured results are in good agreement. The simulated and measured radiation pattern in xy-plane and xz-plane at 4, 6 and 8 GHz are shown in Fig. 9. The proposed antenna has unidirectional radiation pattern and the main lobe are directed in the end-fire direction (x-direction). Again, the simulated and measured results slightly differ due to fabrication tolerances and tolerance of relative permittivity [32]. The differences between simulated and measured results are also caused by losses from the soldering of the SMA connector, as an ideal connecter is used in simulations. Moreover, the differences between radiation patterns and gain are also caused by misalignment between the transmitting and receiving antennas.
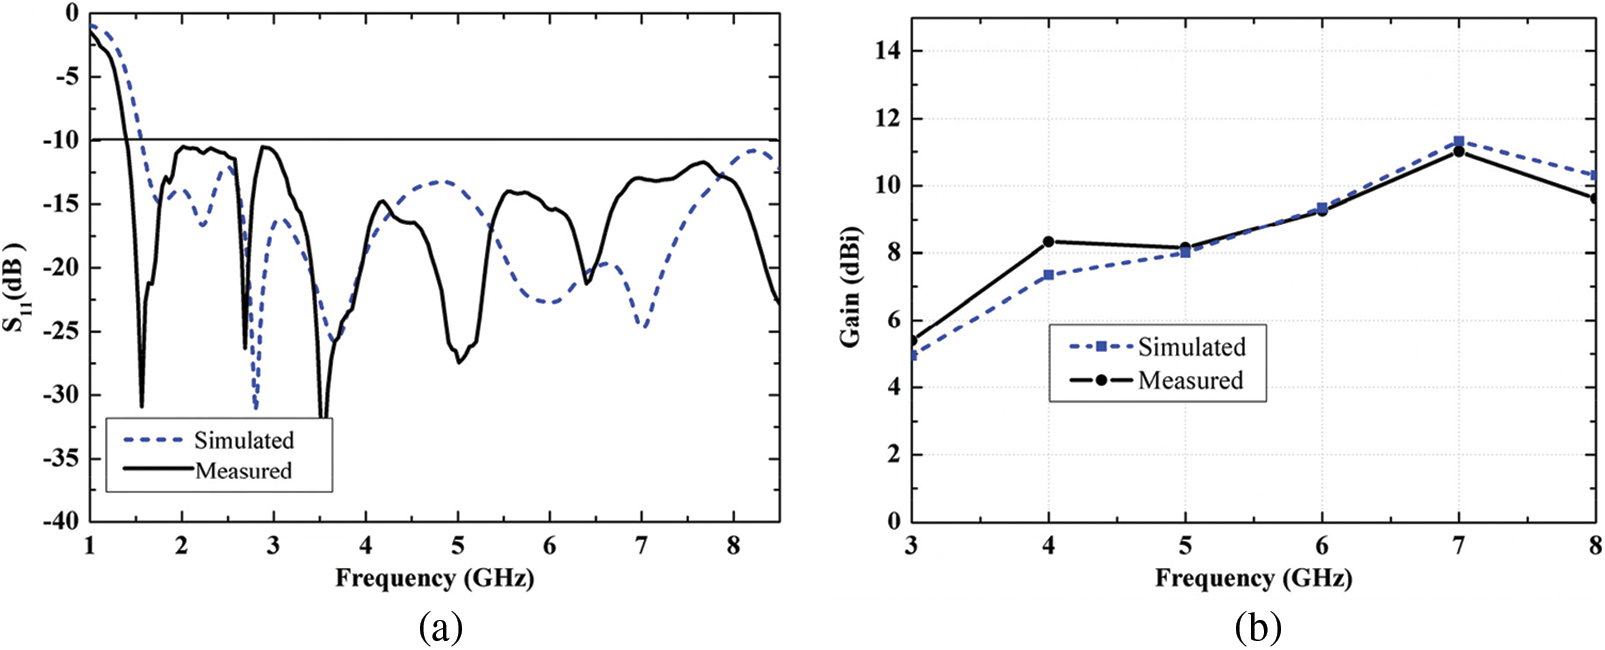
Figure 8: Comparison between simulated and measured S11 and gain of proposed AVA with parasitic patch and corrugation (a) S11 (b) gain


Figure 9: Comparison between simulated and measured radiation patterns of proposed AVA with parasitic patch and corrugation in xy-plane and xz-plane (a) 4 GHz (b) 6 GHz (c) 8 GHz
3 Antenna Performance Comparison
The simulated and measured results for the four AVA structures i.e., original AVA, AVA with non-uniform corrugation, AVA with parasitic patch and corrugation and AVA with dielectric lens presented in [19] in term of S11 and gain are summarized in Tab. 3. It is known that increasing the antenna size, which will increase effective surface of antenna, provides a higher gain. Therefore, AVA with dielectric lens presented in [19] with dimension of 75 mm × 140 mm has the highest gain, follows by, AVA with parasitic patch and corrugation, AVA with non-uniform corrugation and original AVA. As the same antenna dimension, AVA with non-uniform corrugation can enhance the gain of original AVA around 1 dBi at 6 GHz. It is known that breast cancer detection is based on near-field scenario, which the incident wave shape varies with radiation distance and the plane wave can only assumed in the far-field region. Therefore, electric field distributions of antenna in near-field region should be considered. The comparison of simulated electric field distributions in xy-plane of the four AVA structures listed in Tab. 3 at 5, 7 and 9 GHz is shown in Fig. 10. It is clearly obvious that the electric field distribution of AVA with parasitic patch is more focused toward end-fire direction than those of the other AVAs at higher frequencies. At low frequency, for instance, at 4 GHz, AVA with dielectric lens [19] and AVA with parasitic patch produce plane-like wave, while original AVA and AVA with non-uniform corrugation produce spherical-like wave. At high frequencies, for instance, 7 and 9 GHz, all the four AVA structures produce plane-like wave relatively well at 7 GHz but electric field distribution of AVA with dielectric lens [19] becomes weak in the center of antenna due to the off-axis radiation at 9 GHz.
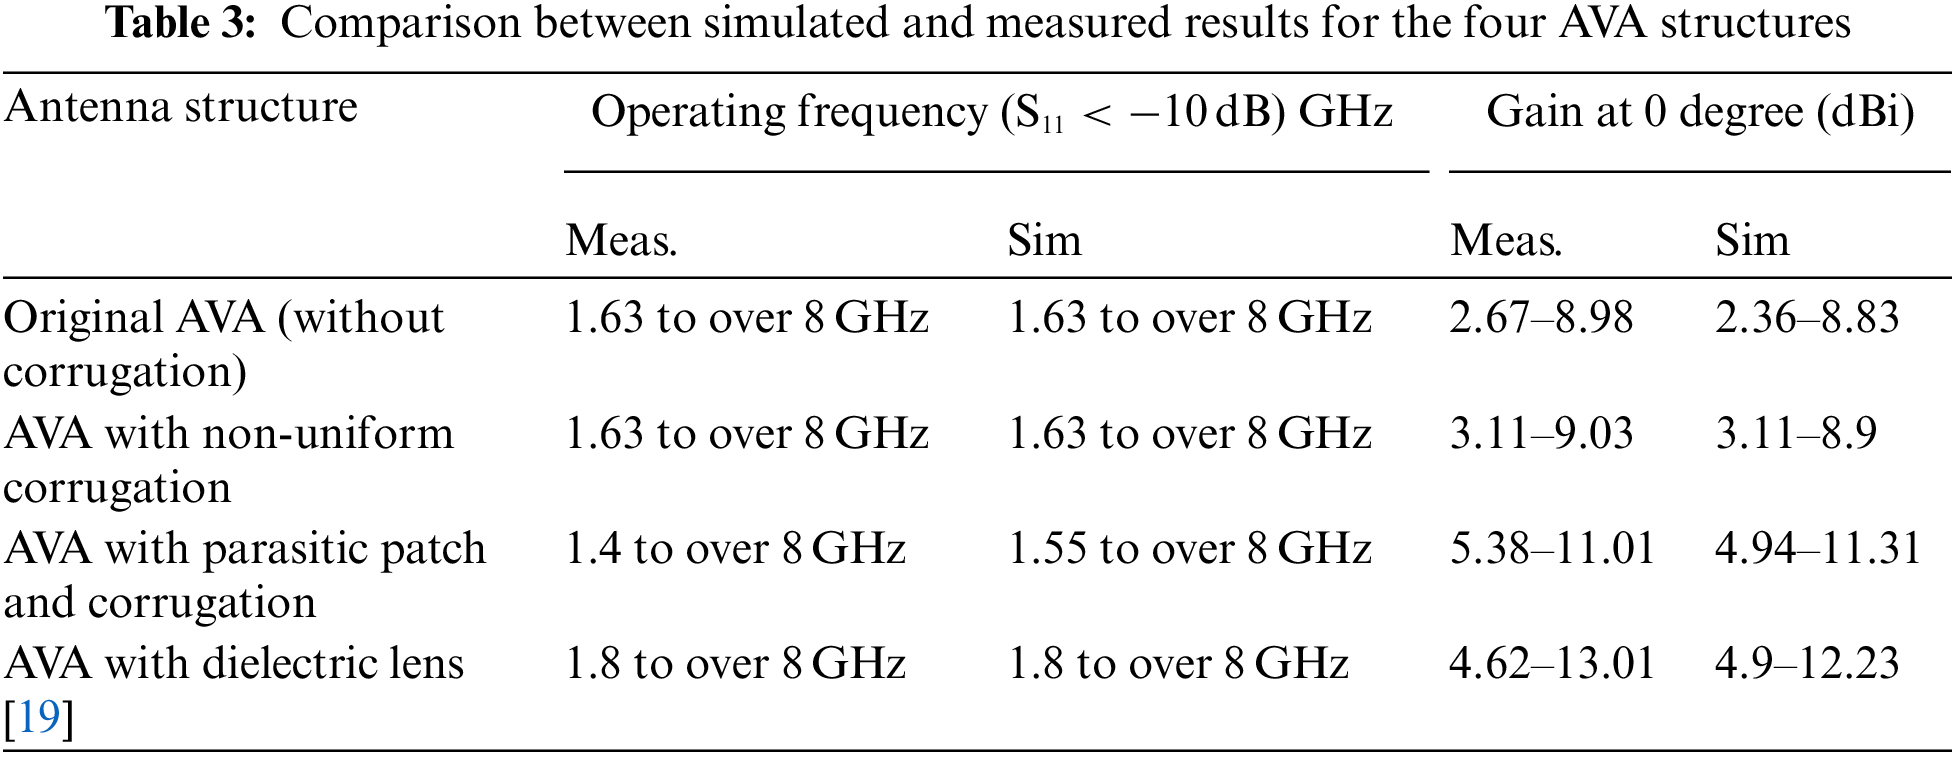

Figure 10: Electric field distributions of the four AVA structures (a) 5 GHz (b) 7 GHz (c) 9 GHz
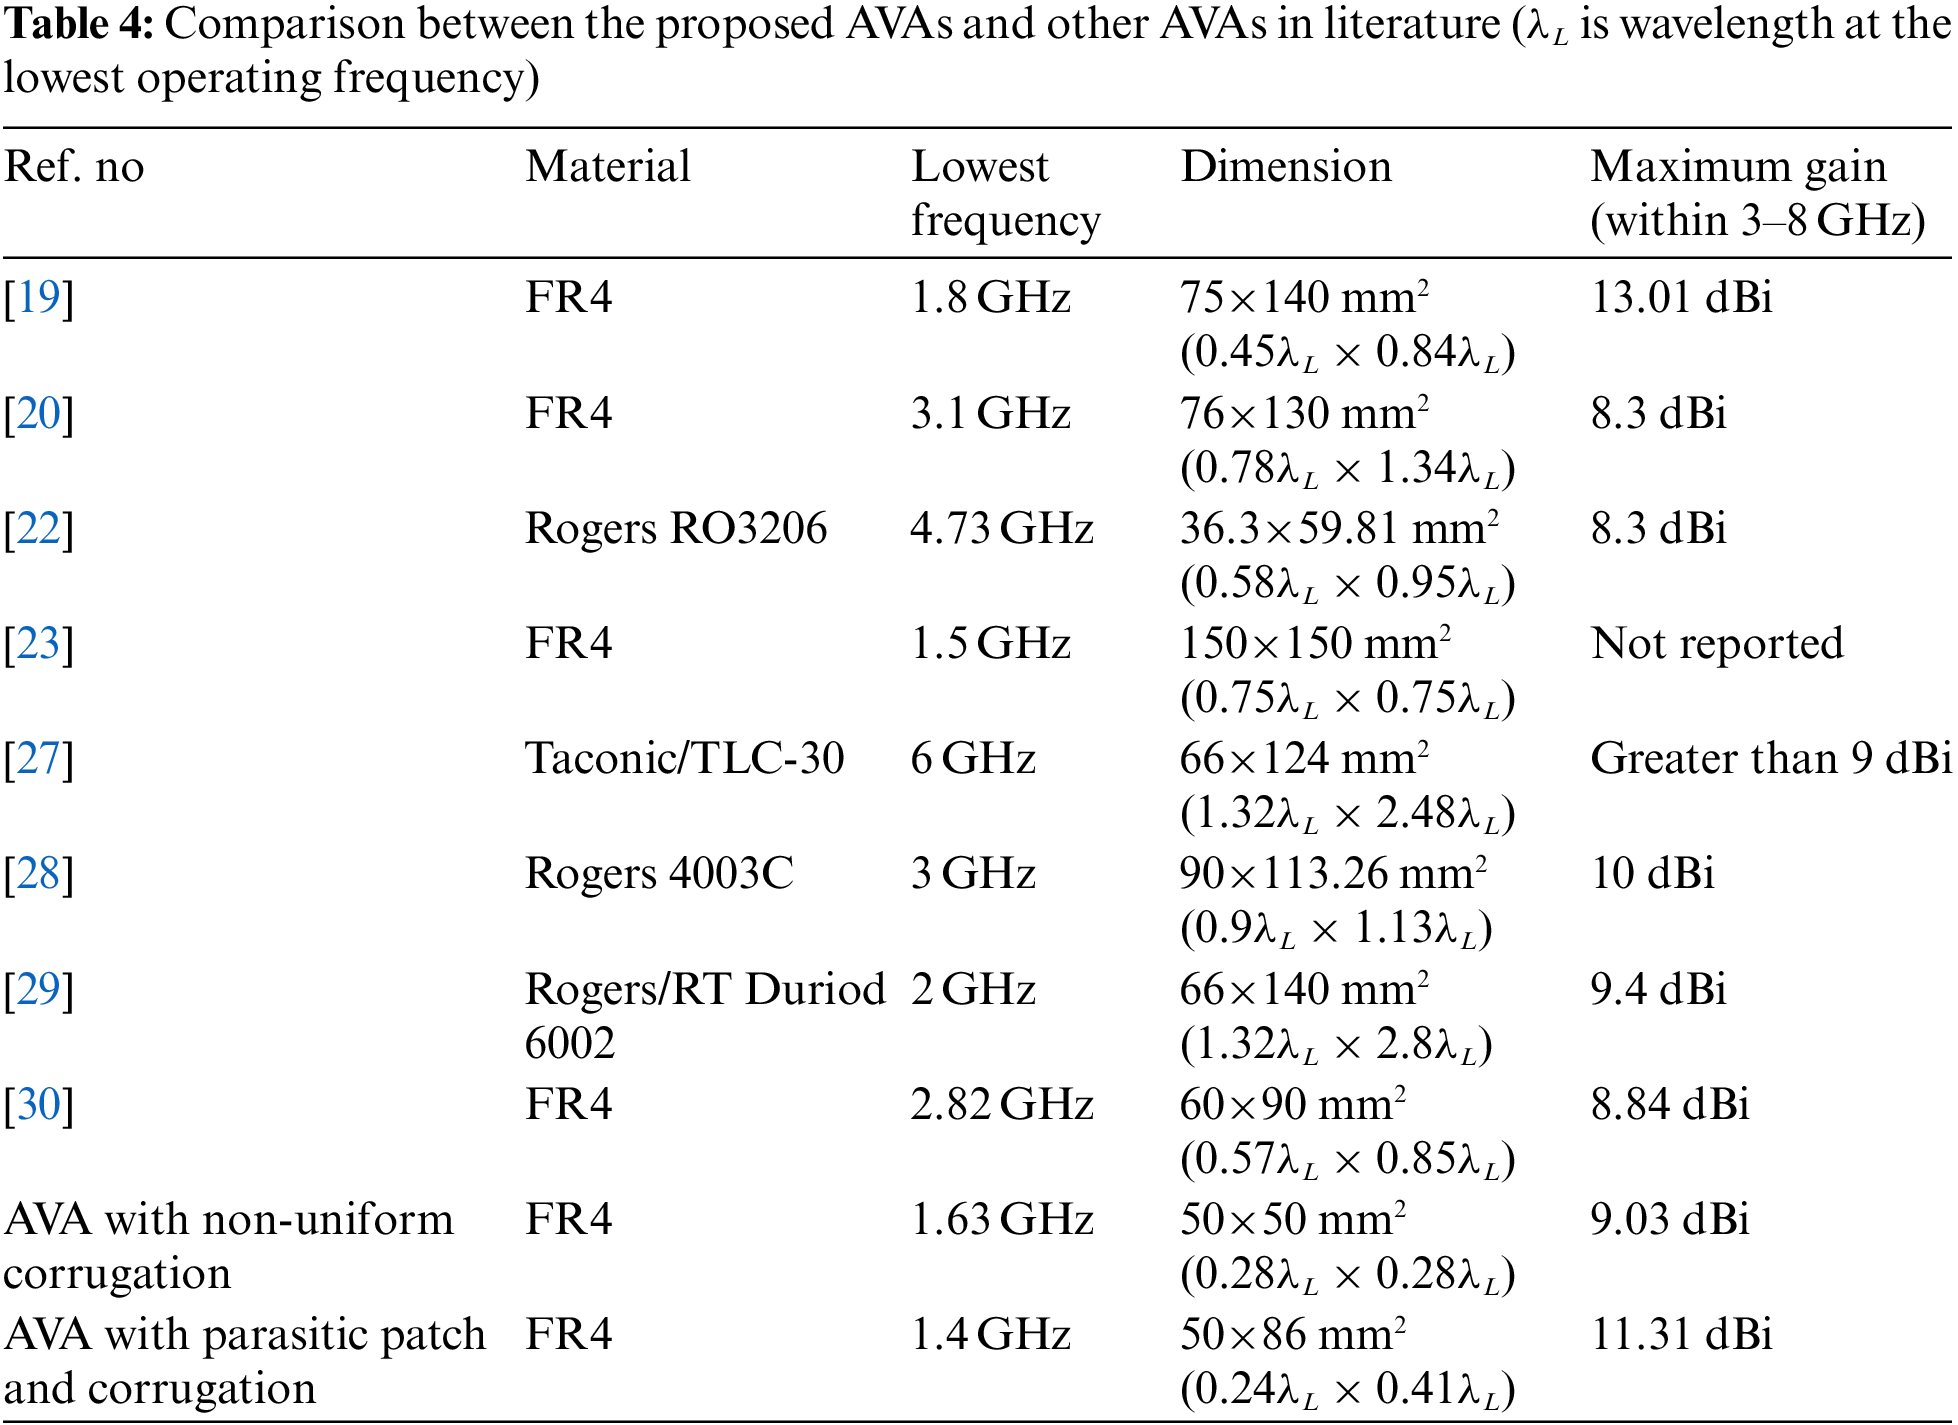
The comparison between the proposed AVAs and other AVAs found from literature is shown in Tab. 4. The proposed AVAs can provide rather high gain while achieving smaller size, simple structure and low complexity in design. Therefore, the proposed AVAs is suitable for breast cancer detection, which requires good radiation properties.
For experimental proposes, the breast phantom is designed and fabricated. The breast model consists of skin and fat layers. The cancerous cell is inserted into the fat layer. It is found from the Cole-Cole model that the electrical properties of human tissue are different and vary with frequency [33]. The dielectric constant of biological tissue based on Cole-Cole model is given by
where
For breast phantom design, there is several tissue mimicking methods found in literature [34–36]. The mimicking method based on gelatine-oil is used in this paper because it has stable mechanical properties, low cost and easy fabrication. The dielectric properties of breast tissues can be obtained by varying the concentration of gelatin-oil mixture. The composition of chemicals for breast phantom based on [36] is shown in Tab. 5.

The hemispherical breast phantom is designed with a radius of 70 mm. The phantom consists of a skin layer with the thickness of 2 mm and fat layer with the thickness of 68 mm as shown in Fig. 11. The spherical cancerous cell with the radius of 5 mm is embedded in the fat layer. This cancerous cell is located on the left side of the breast phantom and it is embedded 40 mm away from bottom surface as shown in Fig. 12. The procedure for prototyping a breast phantom is as follows. The first step, the chemical mixture for skin layer is mixed and poured into a 2 mm gap between two hemispherical containers. The first hemisphere is a base with a radius of 70 mm and the second hemisphere is a cover with a radius of 68 mm, leaving a gap of 2 mm between them. The skin layer mixture should be allowed to rest for at least two days to become solid. The cancerous cell is made using similar procedure as the skin layer and it is cut to sphere with a radius of 5 mm. The next step, the fat layer mixture can be poured into the skin layer. The cancerous cell is embedded in desired position within the fat layer. For the completed breast phantom, the solid skin layer is milky white color and flexible, while the solid fat layer is a pale-yellow color and a slightly soft. The fabricated hemisphere breast phantom is depicted in Fig. 12b.

Figure 11: The configuration of hemisphere breast phantom

Figure 12: (a) 3D breast phantom with cancerous cell (b) fabricated breast phantom
Moreover, the relative permittivity and conductivity of the breast phantom and tumor are measured using dielectric probe and Vector Network Analyzer (VNA). The relative permittivity and conductivity curves of fat and cancer against frequency are illustrated in Fig. 13. It can be observed that the permittivity of cancerous cell is about 5 times larger than breast tissue across frequency range from 1-8 GHz, while conductivity of cancerous cell is 5 times larger than breast tissue at frequency above 6 GHz.
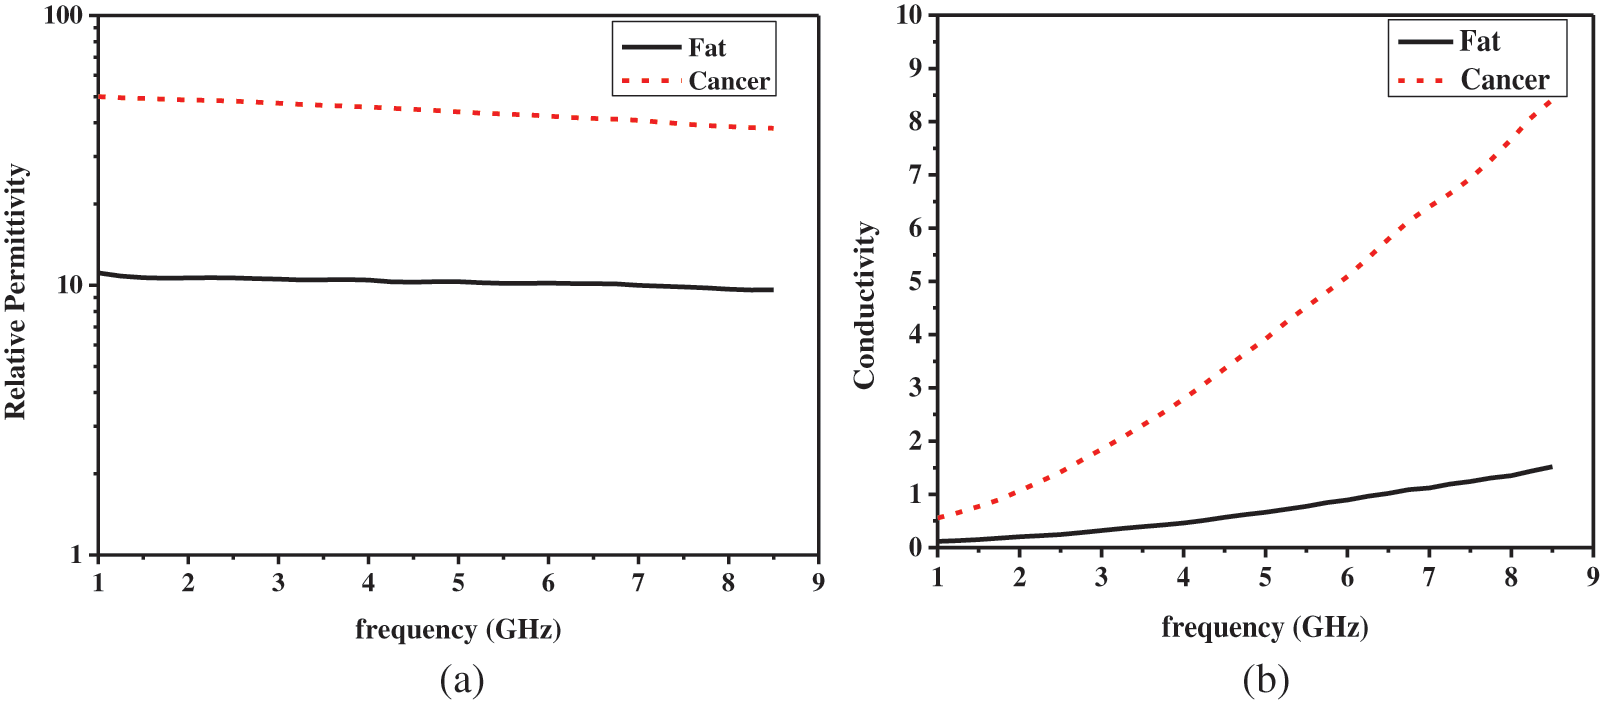
Figure 13: The measured electrical properties of fat and cancerous cell (a) relative permittivity (b) conductivity
5 Measurement Results and Discussions
This section presents the measurement of proposed AVAs with breast phantom for breast cancer detection. The methodology for breast cancer detection based on using a single antenna is proposed. In order to confirm the performance of proposed AVAs for breast cancer detection, the four AVA structures i.e., the original AVA, AVA with non-uniform corrugation, AVA with parasitic patch and corrugation and AVA with dielectric lens in [19] are compared. The experimental setup of breast cancer detection system is shown in Fig. 14. The measurement system mainly consists of a VNA (Agilent Technologies E5071C ENA Series), antenna and cancerous breast phantom. Absorbers are placed underneath and enclosed the breast cancer detection system. The antenna is connected to port 1 of VNA to measure the S11. The cancerous breast phantom is placed on the rotation platform and antenna is placed above the cancerous beast phantom with fixed distance. The breast phantom is rotated for 360 degree relative to the stationary antenna to simulate antenna scanning around the breast phantom. In order to clearly distinguish of S11 between cancerous and non-cancerous positions, four locations of antenna are defined with the notation of A, B, C and D, where point A is position of cancerous cell as shown in Fig. 15. The S11 at all antenna positions are recorded. Next, distance between antenna and skin layer (H) is adjusted until the magnitude of S11 between cancerous and non-cancerous position is obviously differed. Therefore, the distance between antenna and skin layer of each antenna configurations is not fixed as the same distance. The measured S11 corresponding the antenna locations i.e., A, B, C and D, when the four AVA structures are used, are shown in Fig. 16. Considering the same scanning radius, it is found that the magnitude of S11 is relatively similar in the absence of cancerous cell. In addition, the magnitude of S11 at cancerous position is rather different from those of non-cancerous positions. According to the condition that if the antenna meets the cancerous cell, the magnitude of S11 is higher than the healthy tissue due to the high difference of electrical properties between cancerous and healthy tissue. It is found from Fig. 16 that all AVA structures can detect the cancerous cell because the difference of S11 between cancerous and non-cancerous positions can be observed. However, the difference of S11 between cancerous and non-cancerous positions (

Figure 14: (a) The experimental setup of breast cancer detection system (b) The four AVA structures with breast phantom
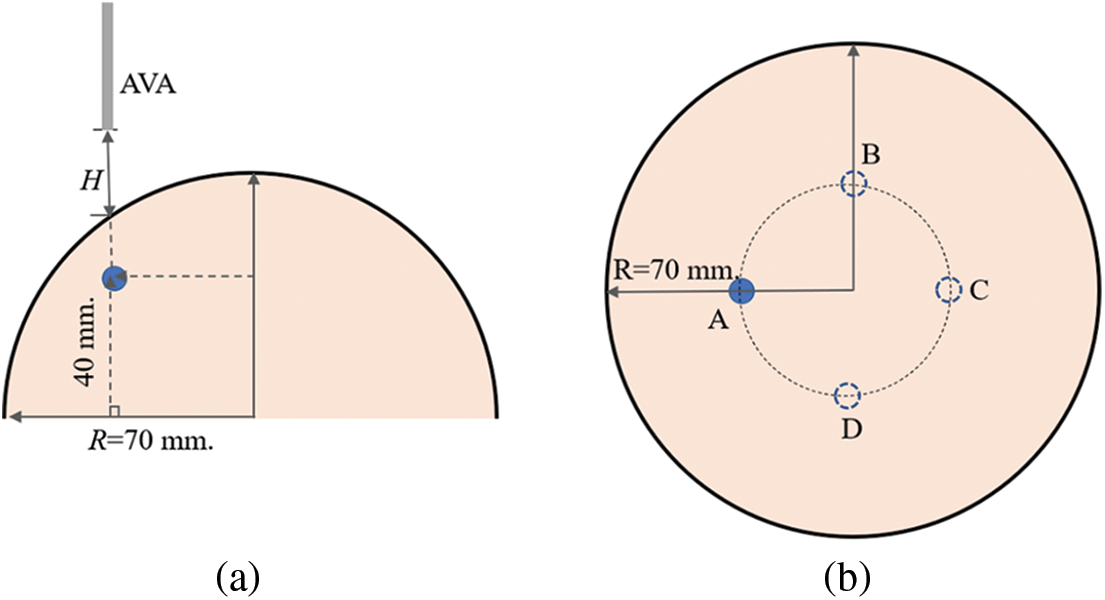
Figure 15: The scanning position on the cancerous breast phantom (a) side view and (b) top view

Figure 16: The measured S11 of the AVA with breast phantom at different antenna positions (a) The original AVA (b) AVA with non-uniform corrugation (c) AVA with parasitic patch and corrugation (d) AVA with dielectric lens [19]

Then, the all S11 at all antenna positions are collected and imported in MATLAB to image processing. The S11 data sets of AVA with parasitic patch is used as an example for microwave imaging. It is known that microwave imaging based on frequency domain signals (i.e., S11) describe the cancerous response at different operating frequencies. Therefore, the S11 data sets are firstly analyzed. According to the phenomenon that the magnitude of the cancerous response becomes stronger when the antenna moves close to the cancerous cell and becomes weak when antenna moves away from cancerous cell. Therefore, the 2D image of the breast phantom can be created using the intensity of preprocessed S11 parameters [13]. The resulting values of S11 data sets at 4.75 GHz is used to create the 2D image of the cancerous breast phantom as shown in Fig. 17. The red region with the high density depicts the presence of the embedded cancerous cell inside the breast. It is clearly seen from image result that the cancerous cell can be detected at the left side of the breast phantom. Therefore, it can be concluded that the proposed AVA can detect the breast cancer while maintaining the compact size, simple structure and low complexity in design.
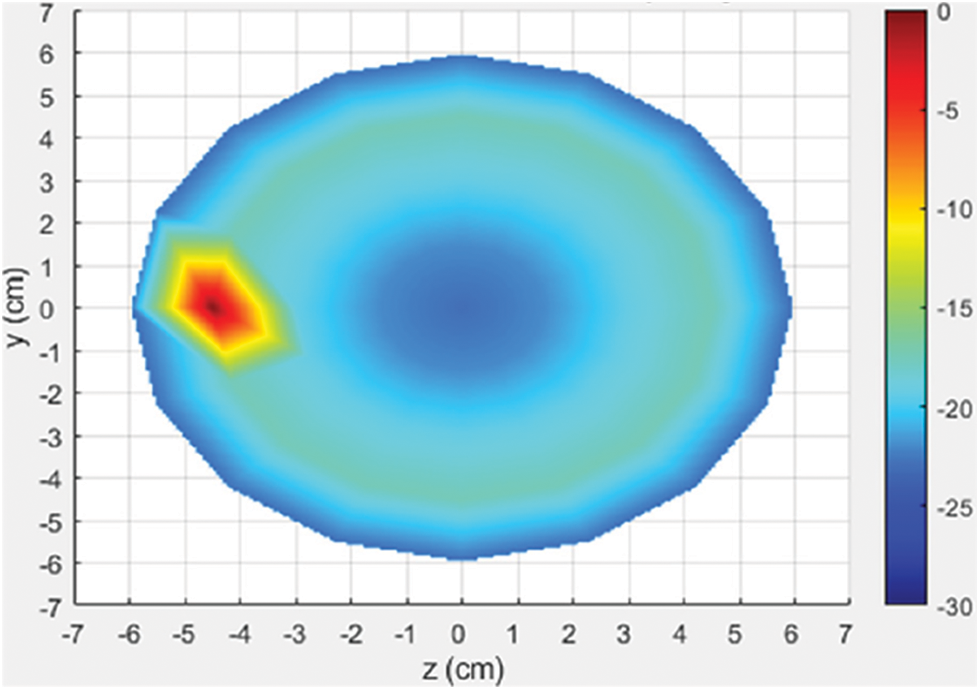
Figure 17: The 2D image of the cancerous breast phantom in yz-plane at 4.75 GHz
Two antipodal Vivaldi antennas (AVAs) i.e., AVA with non-uniform cosine-shaped corrugation and AVA with parasitic patch and corrugation for breast cancer detection was designed and analyzed. By using the non-uniform corrugation technique, the gain of original AVA is improved without increasing the antenna size. The advantage of AVA with non-uniform corrugation is its compact size and simple structure compared to other AVAs in literature. In addition, the parasitic patch placed on AVA aperture is very useful for enhancing the radiation in end-fire direction, which is necessary for breast cancer detection. Finally, the proposed AVAs are tested with breast phantom to detect the cancerous cell inside the breast. The measured results can confirm that the proposed antennas are suitable for breast cancer detection.
Acknowledgement: The authors would like to thank National Science, Research and Innovation Fund (NSRF) and King Mongkut's University of Technology North Bangkok for research funding. Moreover, the authors gratefully acknowledge Department of Electrical and Computer Engineering, Faculty of Engineering, King Mongkut's University of Technology North Bangkok and Department of Telecommunication Engineering, Faculty of Science and Technology, Nakhon Pathom Rajabhat University for equipment and support this research work.
Funding Statement: This research was funded by National Science, Research and Innovation Fund (NSRF), and King Mongkut's University of Technology North Bangkok with Contract no. KMUTNB-FF-65–07.
Conflicts of Interest: The authors declare that they have no conflicts of interest to report regarding the present study.
1. X. R. Zhang, W. F. Zhang, W. Sun, X. M. Sun and S. K. Jha, “A robust 3-D medical watermarking based on wavelet transform for data protection,” Computer Systems Science & Engineering, vol. 41, no. 3, pp. 1043–1056, 2022. [Google Scholar]
2. X. R. Zhang, X. Sun, X. M. Sun, W. Sun and S. K. Jha, “Robust reversible audio watermarking scheme for telemedicine and privacy protection,” Computers, Materials & Continua, vol. 71, no. 2, pp. 3035–3050, 2022. [Google Scholar]
3. N. A. Koma'rudin, Z. Zakaria, A. A. Althuwayb, H. Lago, H. Alsariera et al., “Directional wideband wearable antenna with circular parasitic element for microwave imaging applications,” Computers, Materials & Continua, vol. 72, no. 1, pp. 983–998, 2022. [Google Scholar]
4. Z. Guan, H. Yu, K. Cuk, Y. Zhang and H. Brenner, “Whole-blood DNA methylation markers in early detection of breast cancer: A systematic literature review,” Cancer Epidemiology Biomarkers & Prevention, vol. 28, no. 3, pp. 496–505, 2018. [Google Scholar]
5. L. Wang, “Early diagnosis of breast cancer,” Sensors, vol. 17, no. 7, pp. 1–20, 2017. [Google Scholar]
6. M. Z. Mahmud, M. T. Islam, N. Misran, A. F. Almutairi and M. Cho, “Ultra-wideband (UWB) antenna sensor based microwave breast imaging: A review,” Sensors, vol. 18, no. 9, pp. 1–15, 2018. [Google Scholar]
7. P. J. Kornguth, F. J. Keefe, K. R. Wright and D. M. Delong, “Mammography pain in women treated conservatively for breast cancer,” J. Pain, vol. 1, no. 4, pp. 268–274, 2000. [Google Scholar]
8. N. Nikolova, “Microwave imaging for breast cancer,” IEEE Microwave Magazine, vol. 12, no. 7, pp. 78–94, 2011. [Google Scholar]
9. S. Kwon and S. Lee, “Recent advance in microwave imaging for breast cancer detection,” International Journal of Biomedical Imaging, vol. 48, pp. 1–26, 2016. [Google Scholar]
10. A. A. Abdul Halim, A. M. Andrew, M. N. Mohd Yasin, M. A. Abd Rahman, M. Jusoh et al., “Existing and emerging breast cancer detection technologies and its challenges: A review,” Applied Sciences, vol. 11, no. 22, pp. 1–21, 2021. [Google Scholar]
11. S. Poplack, T. Tosteson, W. Wells, B. Pogue, P. Meaney et al., “Electromagnetic breast imaging: Results of a pilot study in women with abnormal mammograms,” Radiology, vol. 243, pp. 350–359, 2007. [Google Scholar]
12. M. Alibakhshikenari, B. S. Virdee, P. Shukla, N. O. Parchin, L. Azpilicueta et al., “Metamaterial-inspired antenna array for application in microwave breast imaging systems for tumor detection,” IEEE Access, vol. 8, pp. 174667–174678, 2020. [Google Scholar]
13. H. Zhang, “Microwave imaging for breast cancer detection: The discrimination of breast lesion morphology,” IEEE Access, vol. 8, pp. 107103–107111, 2020. [Google Scholar]
14. H. M. El Misilmani, T. Naous, S. K. Al Khatib and K. Y. Kabalan, “A survey on antenna designs for breast cancer detection using microwave imaging,” IEEE Access, vol. 8, pp. 102570–102594, 2020. [Google Scholar]
15. A. S. Dixit and S. Kumar, “A survey of performance enhancement techniques of antipodal vivaldi antenna,” IEEE Access, vol. 8, pp. 45774–45796, 2020. [Google Scholar]
16. A. R. H. Alhawari, A. Ismail, M. A. Mahdi and R. S. A. R. Abdullah, “Antipodal vivaldi antenna performance booster exploiting snug-in negative index metamaterial,” Progress in Electromagnetics Research C, vol. 27, pp. 265–279, 2012. [Google Scholar]
17. S. Bharath, K. Namitha, M. A. Bharadwaj and A. Shaji, “Design of a zero index material unit cell and a study on its role in the gain enhancement of vivaldi antenna,” in 3rd Int. Conf. on Inventive Computation Technologies (ICICT), Coimbatore, India, pp. 608–611, 2018. [Google Scholar]
18. S. E. Nady, H. M. Zamel, M. Hendy, A. A. Zekry and A. Attiya, “Gain enhancement of a millimeter wave antipodal vivaldi antenna by epsilon-near-zero metamaterial,” Progress in Electromagnetics Research C, vol. 85, pp. 105–116, 2018. [Google Scholar]
19. S. Tangwachirapan, W. Thaiwirot and P. Akkaraekthalin, “Design of ultra-wideband antipodal vivaldi antenna with square dielectric lens for microwave imaging application,” in 7th Int. Electrical Engineering Congress (iEECON), Hua Hin, Thailand, pp. 1–4, 2019. [Google Scholar]
20. M. Amiri, F. Tofigh, A. Ghafoorzadeh-Yazdi and M. Abolhasan, “Exponential antipodal vivaldi antenna with exponential dielectric lens,” IEEE Antennas and Wireless Propagation Letters, vol. 16, pp. 1792–1795, 2017. [Google Scholar]
21. J. Wang, W. Cui, Y. Zhou, R. Liu, M. Wang et al., “Design of wideband antenna array with dielectric lens and defected ground structure,” Electronics, vol. 10, no. 17, pp. 1–17, 2021. [Google Scholar]
22. A. M. D. Oliveira, M. B. Perotoni, S. T. Kofuji and J. F. Justo, “A palm tree antipodal vivaldi antenna with exponential slot edge for improved radiation pattern,” IEEE Antennas and Wireless Propagation Letters, vol. 14, pp. 1334–1337, 2015. [Google Scholar]
23. A. M. de Oliveira, A. M. de Oliveira Neto, M. B. Perotoni, N. Nurhayati, H. Baudrand et al., “A fern antipodal vivaldi antenna for near-field microwave imaging medical applications,” IEEE Transactions on Antennas and Propagation, vol. 69, no. 12, pp. 8816–8829, 2021. [Google Scholar]
24. Y. Charoensiri, W. Thaiwirot and P. Akkaraekthalin, “Design of ultra-wideband tapered slot antenna by using binomial transformer with corrugation,” Frequenz Journal, vol. 71, pp. 251–260, 2017. [Google Scholar]
25. O. Manoochehri, F. Farzami, D. Erricolo, P. Y. Chen, A. Darvazehban et al., “Design of a corrugated antipodal vivaldi antenna with stable pattern,” in United States National Committee of URSI National Radio Science Meeting (USNC-URSI NRSM), Boulder, CO, USA, pp. 1–2, 2019. [Google Scholar]
26. S. Tangwachirapan, W. Thaiwirot and P. Akkaraekthalin, “Antipodal vivaldi antenna with non-uniform corrugation for breast cancer detection,” in 16th Int. Conf. on Electrical Engineering/Electronics, Computer, Telecommunications and Information Technology (ECTI-CON), Pattaya, Thailand, pp. 748–751, 2019. [Google Scholar]
27. J. Bang, J. Lee and J. Choi, “Design of a wideband antipodal vivaldi antenna with an asymmetric parasitic patch,” Journal of Electromagnetic Engineering and Science, vol. 18, no. 1, pp. 29–34, 2018. [Google Scholar]
28. C. -F. Liang and C. -H. Cheng, “A miniaturized antipodal vivaldi antenna with flat gain for RF energy harvesting,” in IEEE MTT-S Int. Wireless Symp. (IWS), Nanjing, China, pp. 1–3, 2021. [Google Scholar]
29. I. Nassar and T. M. Weller, “A novel method for improving antipodal vivaldi antenna performance,” IEEE Transactions on Antennas and Propagation, vol. 63, pp. 3321–3324, 2015. [Google Scholar]
30. S. A. Adamu, T. Masri, W. A. W. Zainal Abidin, K. H. Ping and S. A. Babale, “High-gain modified antipodal vivaldi antenna for ultra-wideband applications,” Journal of Telecommunication, Electronic and Computer Engineering, vol. 10, pp. 55–59, 2018. [Google Scholar]
31. D. Schaubert, E. Kollberg, T. Korzeniowski, T. Thungren, J. Johansson et al., “Endfire tapered slot antennas on dielectric substrates,” IEEE Transactions on Antennas and Propagation, vol. 33, no. 12, pp. 1392–1400, 1985. [Google Scholar]
32. K. Y. Yazdandoost and K. Sato, “Fabrication error in resonant frequency of microstrip antenna,” in Proc. Int. Conf. on Micromechatronics and Human Science, Nagoya, Japan, pp. 41–44, 2001. [Google Scholar]
33. K. Kang, X. Chu, R. Dilmaghani and M. Ghavami, “Low-complexity cole-cole expression for modelling human biological tissues in (FD) 2TD method,” Electronics Letters, vol. 43, no. 3, pp. 143–144, 2017. [Google Scholar]
34. E., Porter, J. Fakhoury, R. Opris, M. Coates and M. Popovi, “Improved tissue phantoms for experimental validation of microwave breast cancer detection,” in European Conference on Antennas and Propagation (EuCAP), Barcelona, Spain, pp. 1–5, 2010. [Google Scholar]
35. S. Di Meo, L. Pasotti, M. Pasian and G. Matrone, “Realization of breast tissue-mimicking phantom materials: Dielectric characterization in the 0.5–50 GHz frequency range,” in IEEE Int. Microwave Biomedical Conf. (IMBioC), Philadelphia, PA, USA, pp. 37–39, 2018. [Google Scholar]
36. H. Zhang, T. Arslan and B. Flynm, “A single antenna based microwave system for breast cancer detection: Experimental results,” in Loughborough Antenna & Propagation Conf., Loughborough, UK, pp. 447–481, 2013. [Google Scholar]
 | This work is licensed under a Creative Commons Attribution 4.0 International License, which permits unrestricted use, distribution, and reproduction in any medium, provided the original work is properly cited. |