DOI:10.32604/cmc.2022.028338
| Computers, Materials & Continua DOI:10.32604/cmc.2022.028338 | |
| Article |
Bird Swarm Algorithm with Fuzzy Min-Max Neural Network for Financial Crisis Prediction
1Department of Computing Technologies, Associate Professor, SRM Institute of Science and Technology, Kattankulathur, 603203, India
2Department of Information Technology, Kalasalingam Academy of Research and Education, 626126, India
3Department of Computer Science and Engineering, Sphoorthy Engineering College, Hyderabad, Telangana, 501510, India
4Department of Electrical and Electronics Engineering, J B Institute of Engineering and Technology, Hyderabad, Telangana, 500075, India
5Department of Computer Science and Information System, College of Applied Sciences, AlMaarefa University, Riyadh, 11597, Kingdom of Saudi Arabia
6Department of Entrepreneurship and Logistics, Plekhanov Russian University of Economics, 117997, Moscow, Russia
7Department of Logistics, State University of Management, 109542, Moscow, Russia
*Corresponding Author: Irina V. Pustokhina. Email: ivpustokhina@yandex.ru
Received: 08 February 2022; Accepted: 10 March 2022
Abstract: Financial crisis prediction (FCP) models are used for predicting or forecasting the financial status of a company or financial firm. It is considered a challenging issue in the financial sector. Statistical and machine learning (ML) models can be employed for the design of accurate FCP models. Though numerous works have existed in the literature, it is needed to design effective FCP models adaptable to different datasets. This study designs a new bird swarm algorithm (BSA) with fuzzy min-max neural network (FMM-NN) model, named BSA-FMMNN for FCP. The major intention of the BSA-FMMNN model is to determine the financial status of a firm or company. The presented BSA-FMMNN model primarily undergoes min-max normalization to transform the data into uniformity range. Besides, k-medoid clustering approach is employed for the outlier removal process. Finally, the classification process is carried out using the FMMNN model, and the parameters involved in it are tuned by the use of BSA. The utilization of proficient parameter selection process using BSA demonstrate the novelty of the study. The experimental result analysis of the BSA-FMMNN model is validated using benchmark dataset and the comparative outcomes highlighted the supremacy of the BSA-FMMNN model over the recent approaches.
Keywords: Financial crisis; predictive model; machine learning; outlier removal; clustering; metaheuristics
The financial community, management organizations, and lending organizations are longing to build a theoretical framework or an instrument that would assist in examining the possibility of current avoidance; that is to predict when a business succeeds or fail within a required time [1]. Notwithstanding, avoidance activity works in a stochastic manner, financial data produced is utilized for developing or constructing financial crisis prediction (FCP) system. For instance, it is stated that employing the different variance piece of information methods, discriminative study for classifying bankrupt corporations and funds by working financial data [2]. Financial distress arises because of corrupting responsibility along with insolvent rankings of credit-based assets [3]. Notwithstanding circumvention practice has been employed applied, financial crises guiding the operation FCP method using maximal priority [4]. At the same time, Wang and his co-workers suggested that there are no theories or typical stereotypes that arise for a company’s FCP method. The absence of theories or stereotypes to investigate financial distress for investigative activity for the documentation of extrapolation replicas and discriminative potentials applying error and trial [5]. Researchers and professionals have been attempted to enhance the performance of FCP theoretical stereotypes by the application of distinct quantifiable replicas.
The procedure of FCP is extremely required for demonstrating an early, trustworthy, and accurate prediction method to forecast the important risk of the company's economic condition [6]. Generally, The FCP is taken into account as the binary classification method that is solved in reasonable way. The outcomes of the classification method undertake classification into two types such as failing and non-failing conditions of an organization [7]. Now, various classification methods were introduced by using distinct areas of interest for FCP. machine learning (ML), and Statistics-based methods are widely employed for finding the significant factor of the FCP. In the field of FCP, the ML model is employed in different ways [8]. It is utilized for the structure procedure to validate the methods for the recognition of financial crises. The key assumption is that the financial parameter extracting in the open-accessing financial stamen such as financial ratio includes huge number of information connecting the financial detail and is useful for the FCP method [9]. The FCP is a difficult method for utilizing the connected economic detail and other data regarding the company strategy affordability for active information for constructing a new method. As well as the AI and dataset concept, data mining technique is commonly employed in different fields. In FCP, data mining method is widely accessible in two different ways such as decision-making and early warning systems. It is useful to take appropriate measures for eliminating the financial loss of the organization [10].
This study designs a new bird swarm algorithm (BSA) with fuzzy min-max neural network (FMM-NN) model, named BSA-FMMNN for FCP. The presented BSA-FMMNN model primarily undergoes min-max normalization to transform the data into uniformity range. In addition, k-mediod clustering approach is employed for the outlier removal process. Also, the classification process is carried out using the FMMNN model and the parameters involved in it are tuned by the use of BSA. The experimental result analysis of the BSA-FMMNN model is validated using benchmark dataset.
Junyu [11] employed the information on credit default using an overall sample of 1,000 comprising Germany credit default record and private data. Random forest, XGboost, and Logistic regression have been employed for discovering helpful data behindhand this information. Faris et al. [12] presented a hybrid model which integrates the synthetic minority oversampling method using ensemble models. Furthermore, we applied 5 distinct FS techniques for finding the important characteristics of bankruptcy calculation. The presented method is estimated according to real data gathered from Spanish company. Shetty et al. [13] applied different ML approaches for predicting bankruptcy with simply attainable financial statistics of 3728 Belgian Small and Medium Enterprises (SME) in 2002–2012. With the abovementioned ML approaches, we predicted bankruptcy using a total precision of 82%–83% with three simply attainable financial ratios.
Kim et al. [14] investigated that corporate bankruptcy prediction is enhanced by using the recurrent neural network (RNN) and long short term memory (LSTM) approaches that could process consecutive information. Applying the LSTM and RNN methods enhances bankruptcy predictive efficiency related to other classifier methods including techniques. The authors in [15] developed a DL-based method. This technique integrates Stacked AutoEncoder (SAE) and Borderline Synthetic Minority oversampling approach (BSM) depending upon the Softmax classification. The goal is to propose a reliable and accurate bankruptcy predictive system that involves the feature extraction method. Chen et al. [16] address bankruptcy predictive issue from the perception of learning with label proportion, whereas the unlabelled trained information is given in various bags and gives the bag-level proportion of instance belongs to a certain class. Next, contributed support vector machine (SVM) enabled two predictive systems named Boosted-pSVM and Bagged-pSVM, depending on proportion SVM and ensemble strategy includes boosting and bagging. Muneer et al. [17] introduced a multi-objective squirrel search optimization method using stacked autoencoder (MOSSA-SAE) for FCP in IoT. The aim is to describe the region of nearest neighbors and oversampling rate. Moreover, SAE method is employed as a classifier method for determining the class label of financial information. Simultaneously, the presented approach has been employed for properly selecting the ‘weight’ and ‘bias’ values of the SAE.
This study has developed a new BSA-FMMNN model is to determine the financial status of a firm or company. The presented BSA-FMMNN model involves several subprocesses namely preprocessing, k-medoid clustering based outlier removal, FMMNN based classification, and BSA based parameter optimization. The utilization of proficient parameter selection process using BSA helps to accomplish maximum performance. Fig. 1 illustrates the working process of BSA-FMMNN technique.
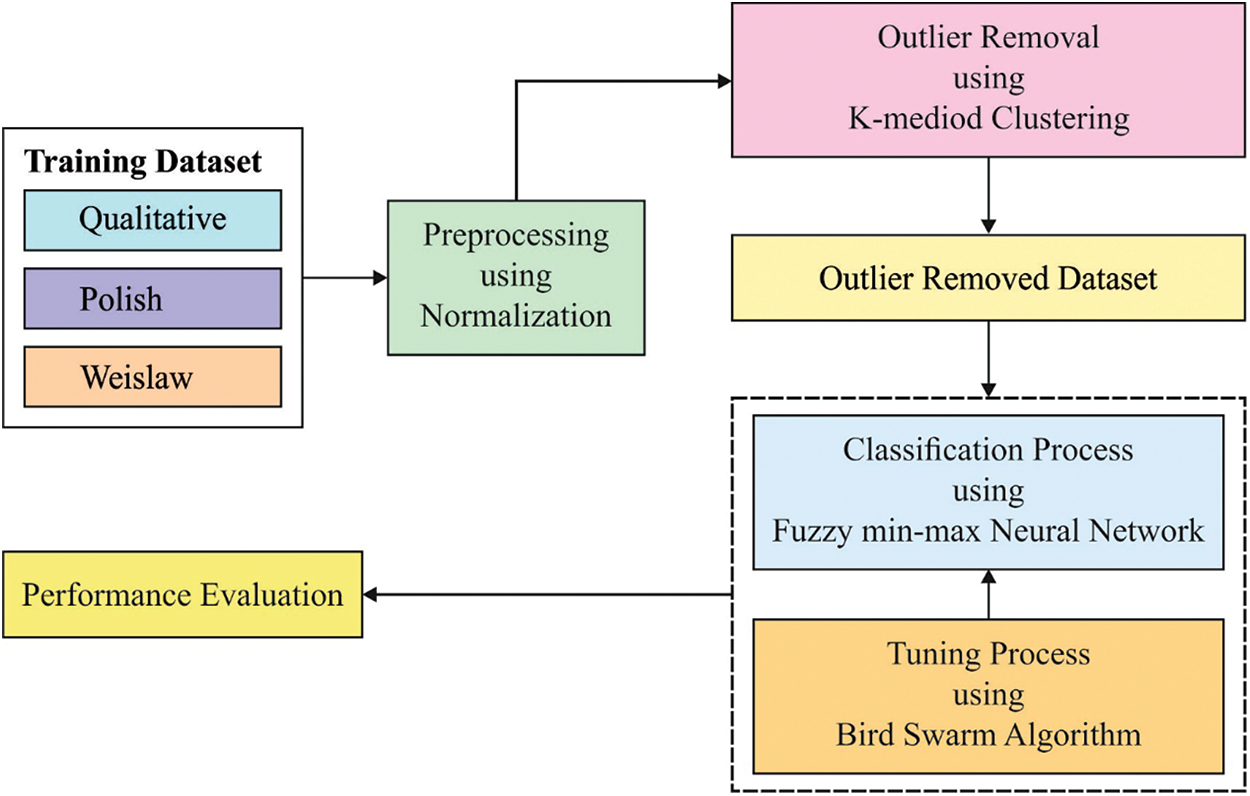
Figure 1: Working of BSA-FMMNN model
To design a proper and effective learning model, it is needed to primarily normalize the input data. In this work, min-max normalization approach is employed as defined in the following.
where
3.2 K-medoid Clustering Based Outlier Removal
The K-medoid clustering is a statistical technique, used for the removal of outliers existing in the financial data [18]. The traditional K-means technique computes and exploits the mean value of the data points in computation, specifically sensible to the existence of outliers in the financial data. For resolving these issues, a concept of medoid is utilized rather than the mean values in the cluster. Though k-Medoid approach exhibits high computation complexity, the k-medoid clusters are insensitive to the existence of clusters. It can be employed on continuous as well as discrete data domains. It reduces the total of the dissimilarity among the objects that exist in the cluster with the reference objects chosen for the clusters. In general, the input provided is the
3.3 Data Classification Using FMMNN Model
For classification process, the FMMNN model can be employed for data classification. The FMM network contains 3 states of nodes such as
where
where the membership function (MF) to
where
where
where
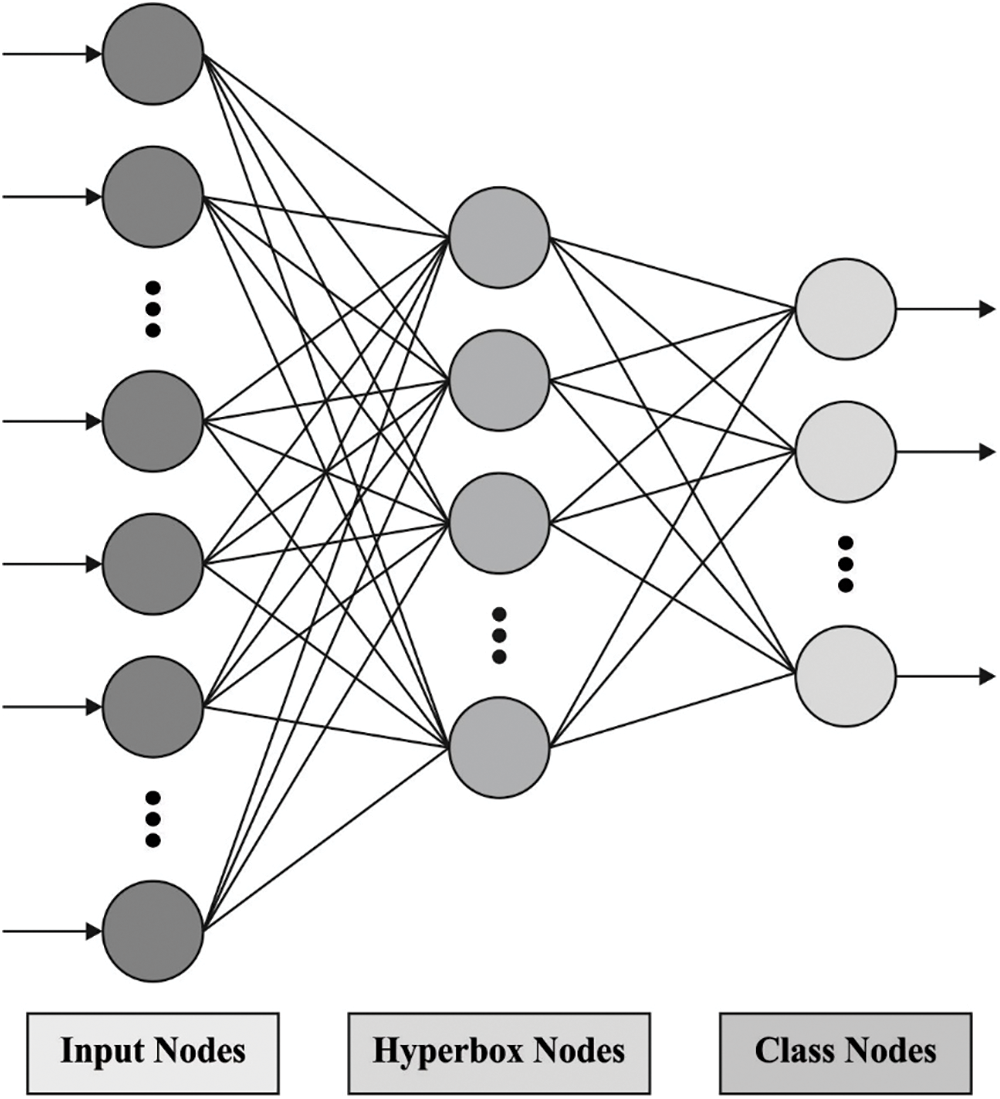
Figure 2: Structure of FMMNN model
3.4 Parameter Tuning Using BSA
In order to tune the parameter values involved in the FMMNN model, the BSA can be employed. The BSA is a biological heuristic technique simulated in bird foraging, vigilance, and flight performance naturally [20].
Foraging behavior: All the birds feed food on the fundamental of personal experiences or group experiences. When the arbitrary number is uniformly distributed amongst zero and one, afterward the bird is foraging for food. Then, the bird is vigilant. As demonstrated by Eq. (7):
where
Vigilance behavior: The birds are attempt for moving to center of groups, and it is inevitably competing with everyone. Their performance is explained by the subsequent equations:
where
Flight behavior: Because of the threat of predators or other reasons, birds are flying to another location for searching for food. In several birds performing as producers, however the other need for getting food from producer. Based on Rule (4), the performance of producers and scroungers are explained in mathematical process that is as follows:
where
This section inspects the performance validation of the proposed model against three benchmark datasets such as qualitative, Polish, and Weislaw datasets (available at https://archive.ics.uci.edu/ml/datasets.php).
Tab. 1 reports the FCP outcomes of the BSA-FMMNN technique with recent techniques on Qualitative Bankruptcy dataset [21]. Fig. 3 depicts the
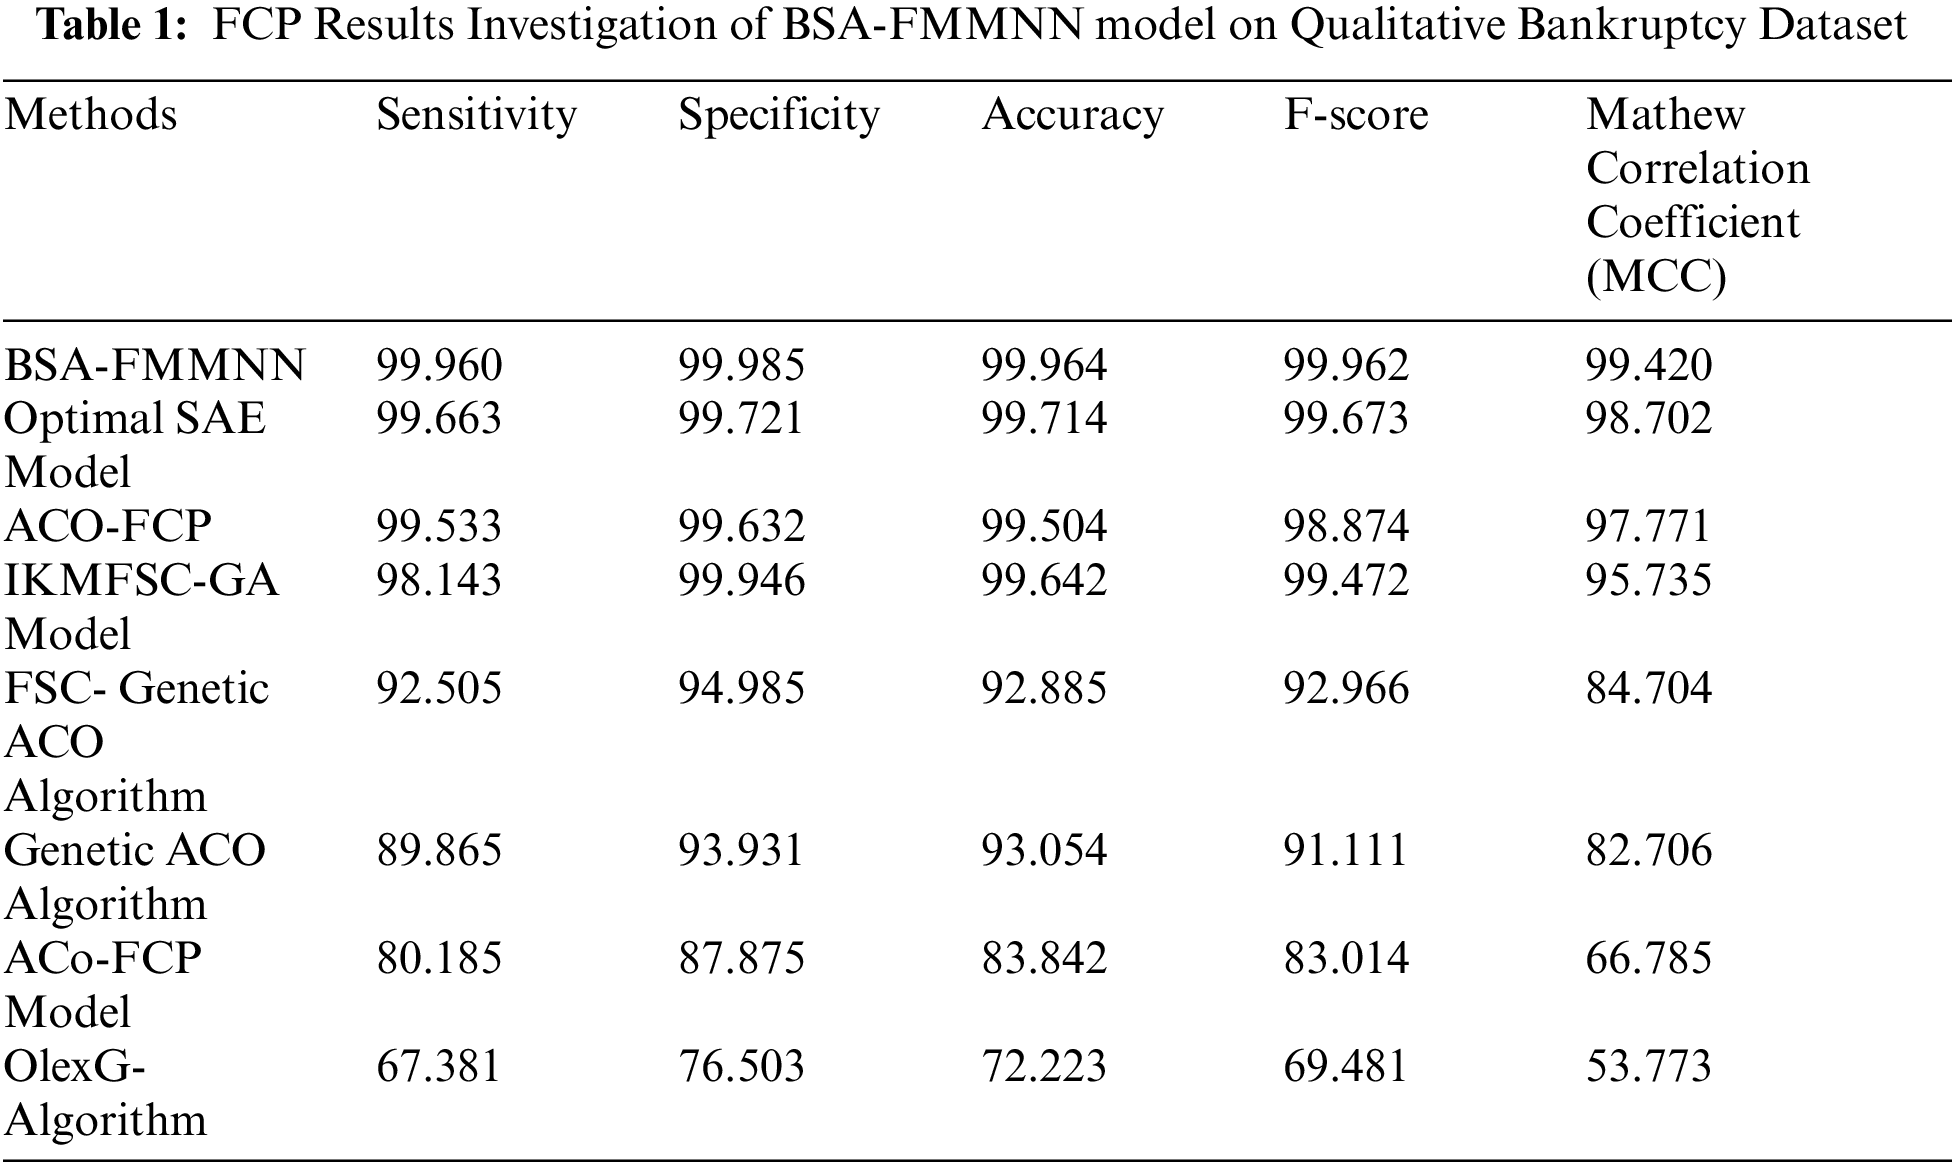
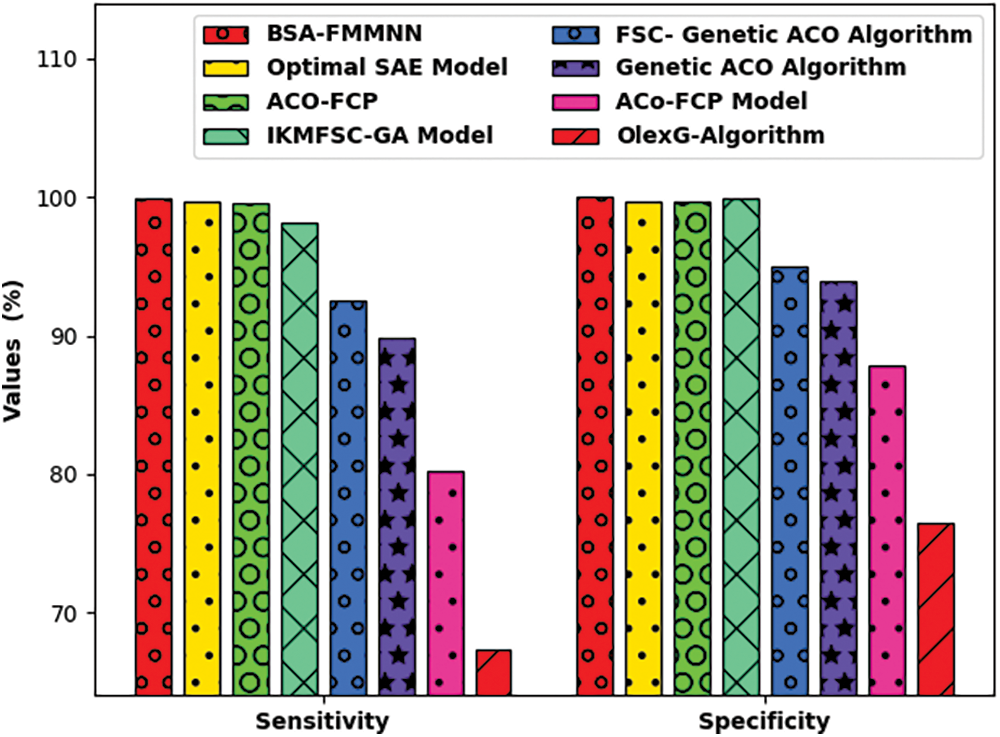
Figure 3: Comparative
Fig. 4 portrays the
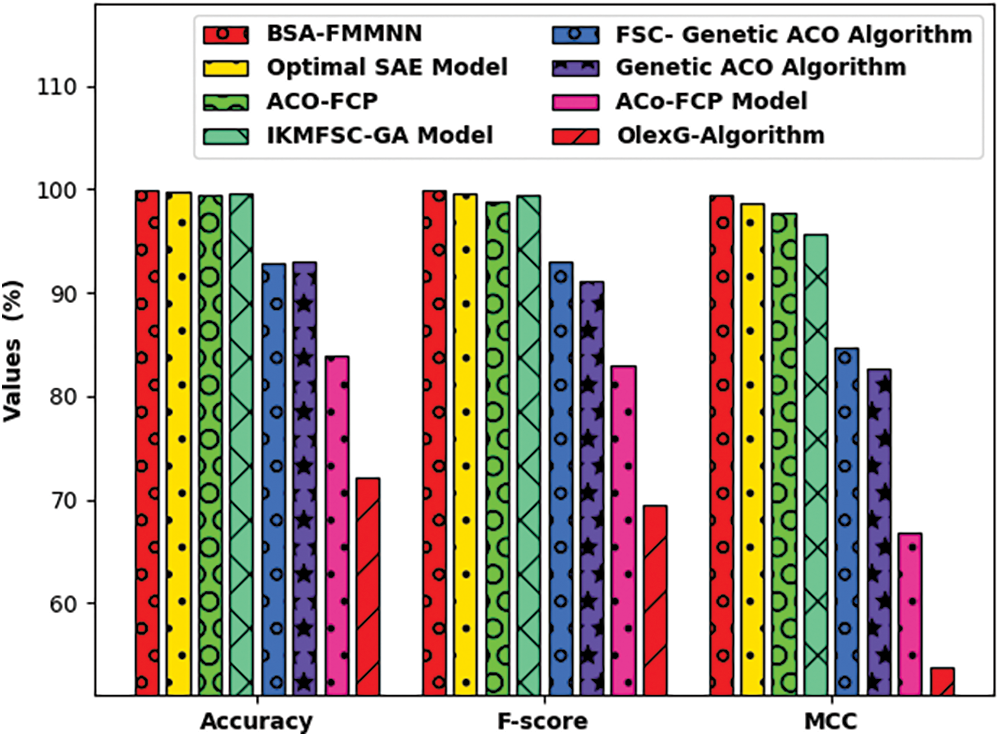
Figure 4: Comparative
Fig. 5 demonstrates the accuracy inspection of the BSA-FMMNN model on the qualitative bankruptcy dataset. The results reported that the BSA-FMMNN model has the ability to obtain improved values of training and validation accuracies. It is observable that the validation accuracy values are slightly higher than training accuracy.
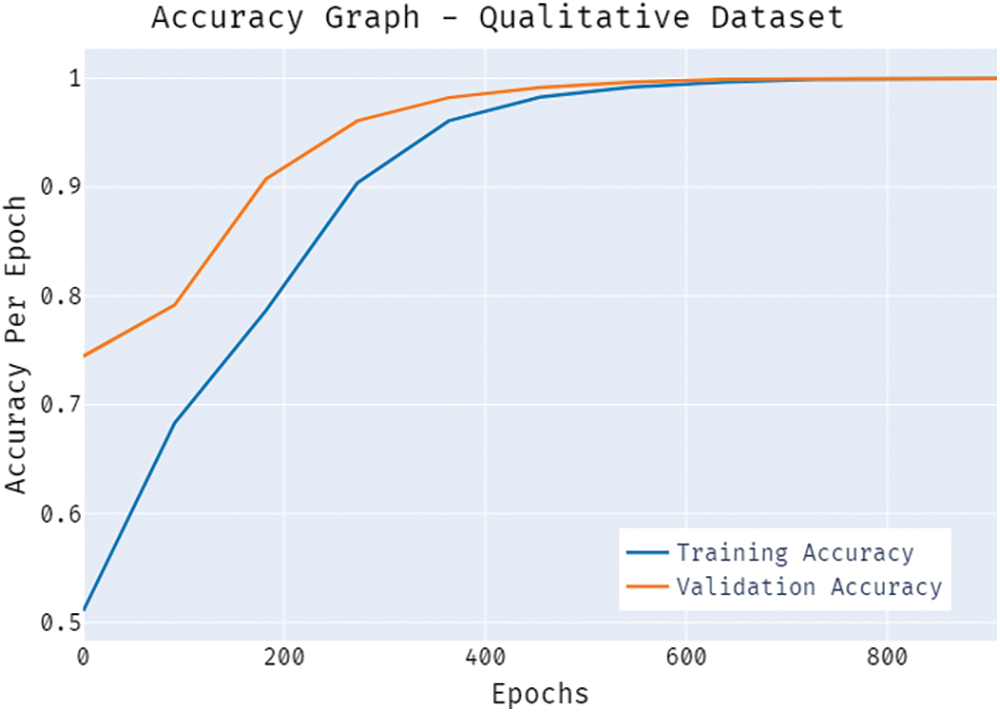
Figure 5: Accuracy graph of BSA-FMMNN model on qualitative dataset
A brief training and validation loss offered by the BSA-FMMNN model are reported in Fig. 6 on the test qualitative dataset. The results portrayed that the BSA-FMMNN model has accomplished least values of training and validation losses on qualitative dataset.
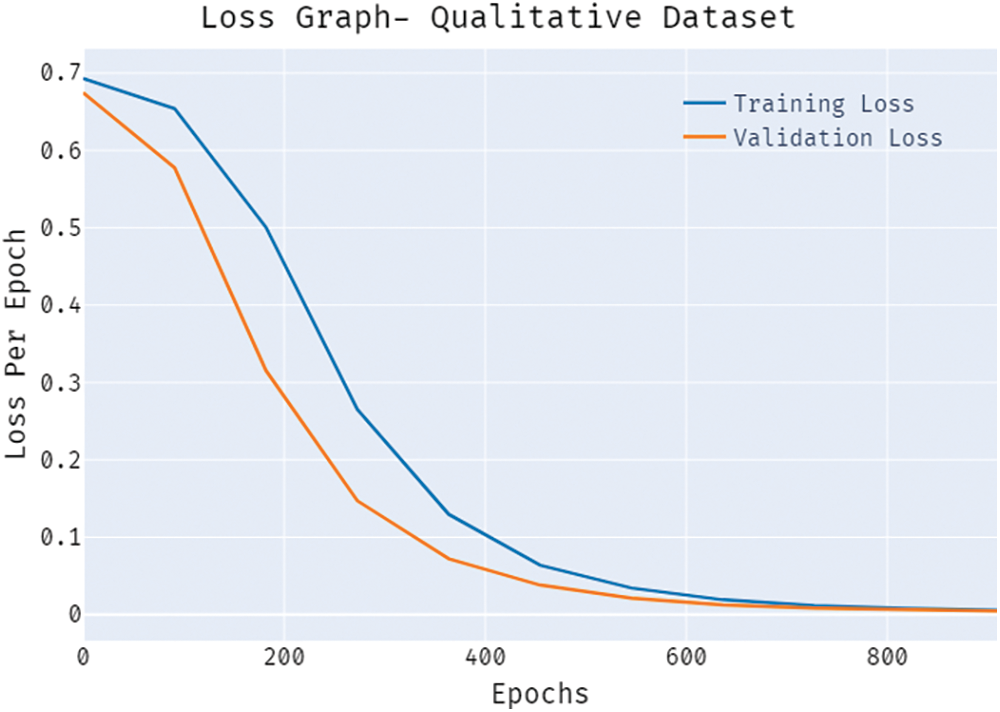
Figure 6: Loss graph of BSA-FMMNN model on qualitative dataset
Tab. 2 highlights the comparative study of the BSA-FMMNN technique on Polish dataset. Fig. 7 depicts the
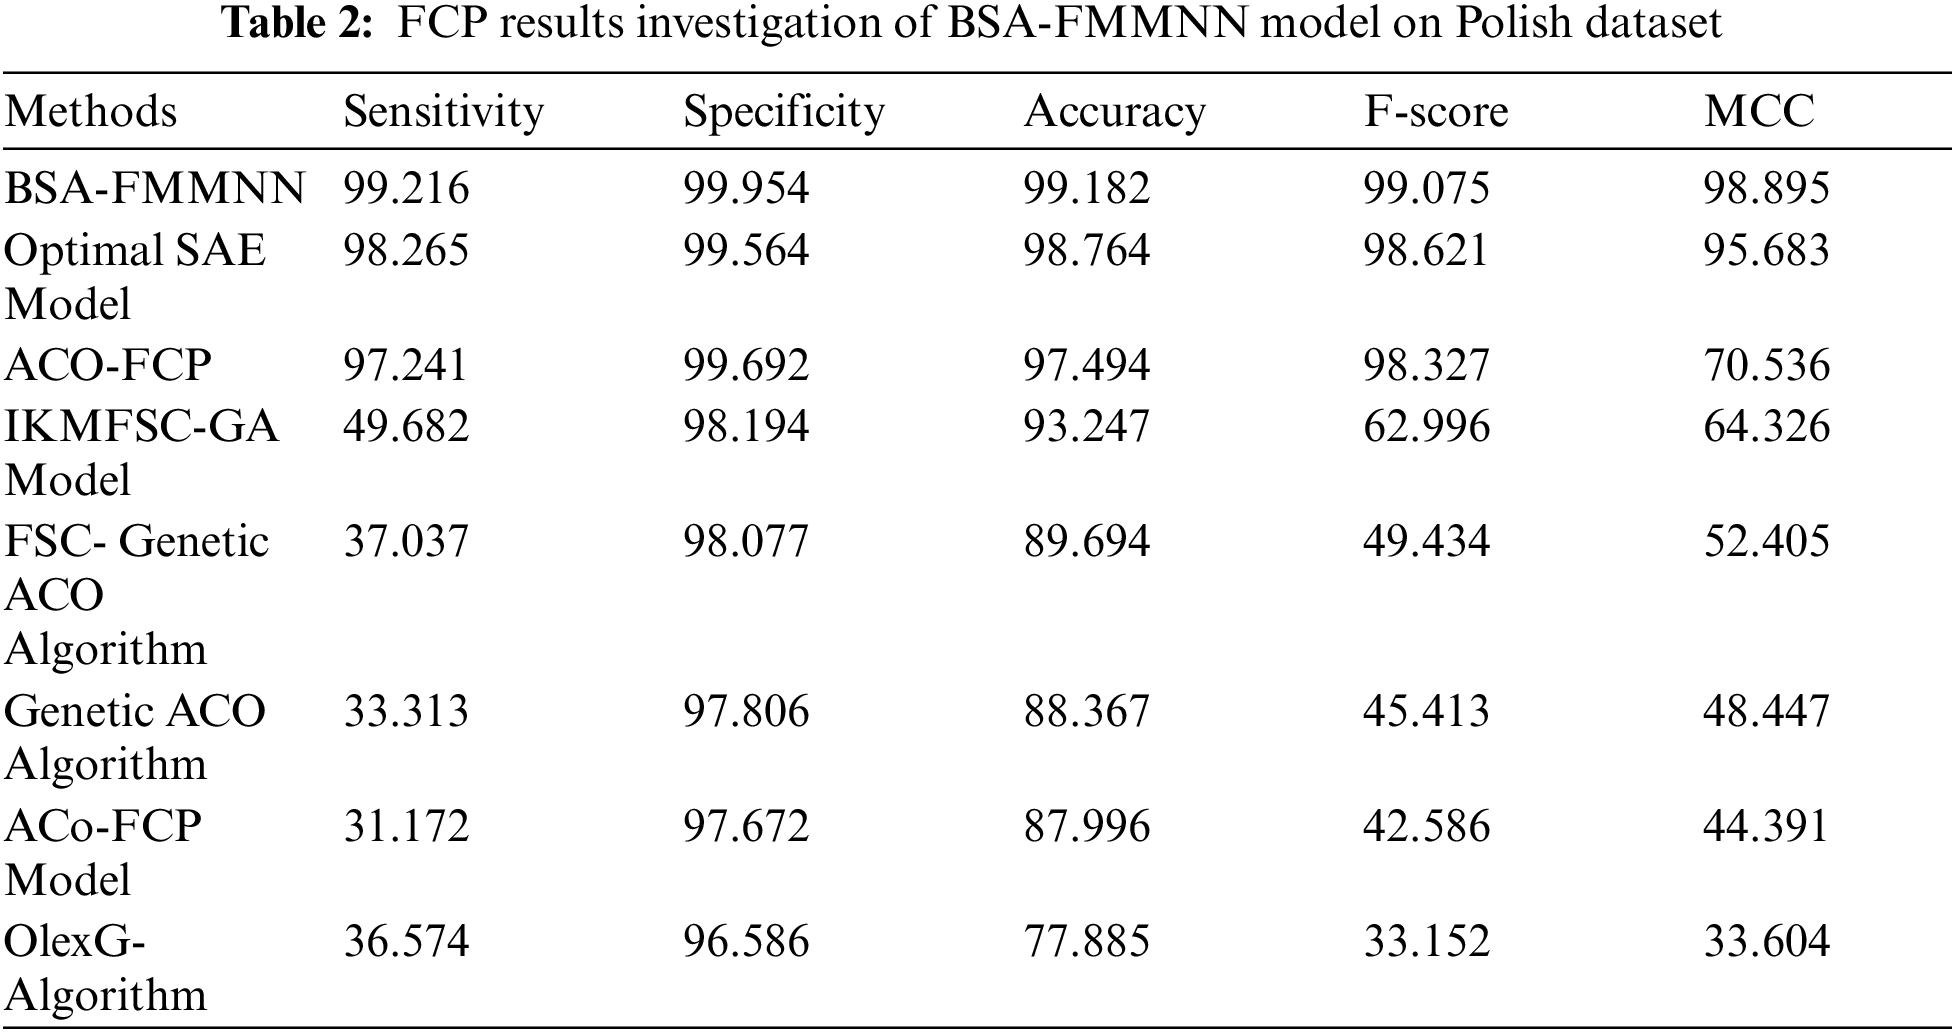
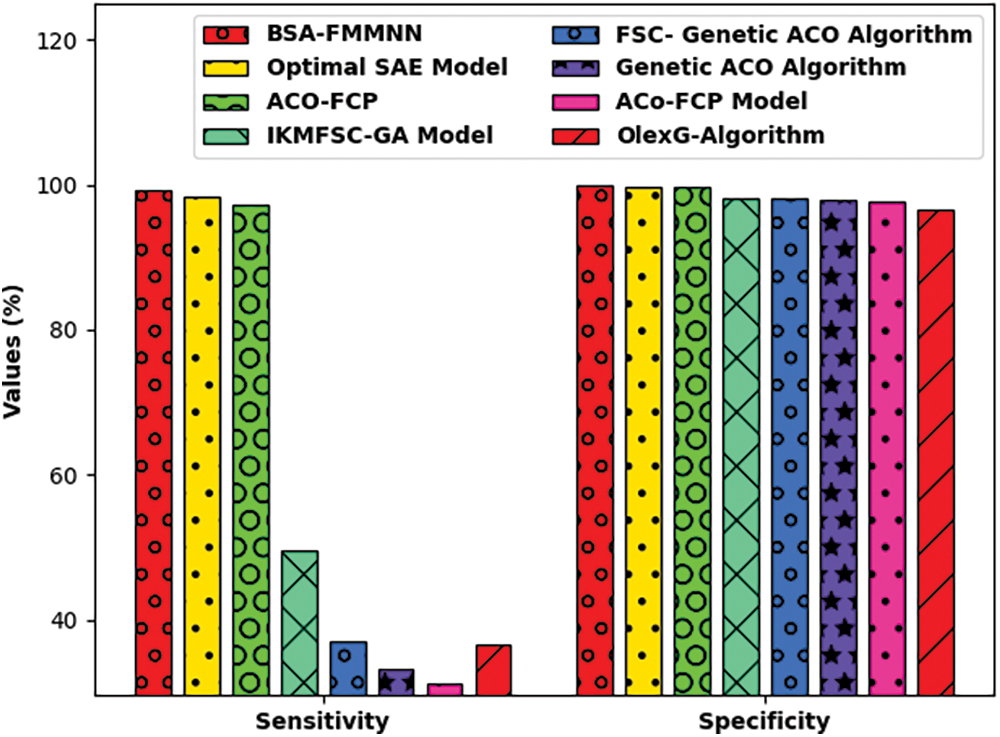
Figure 7: Comparative
Fig. 8 reveals the
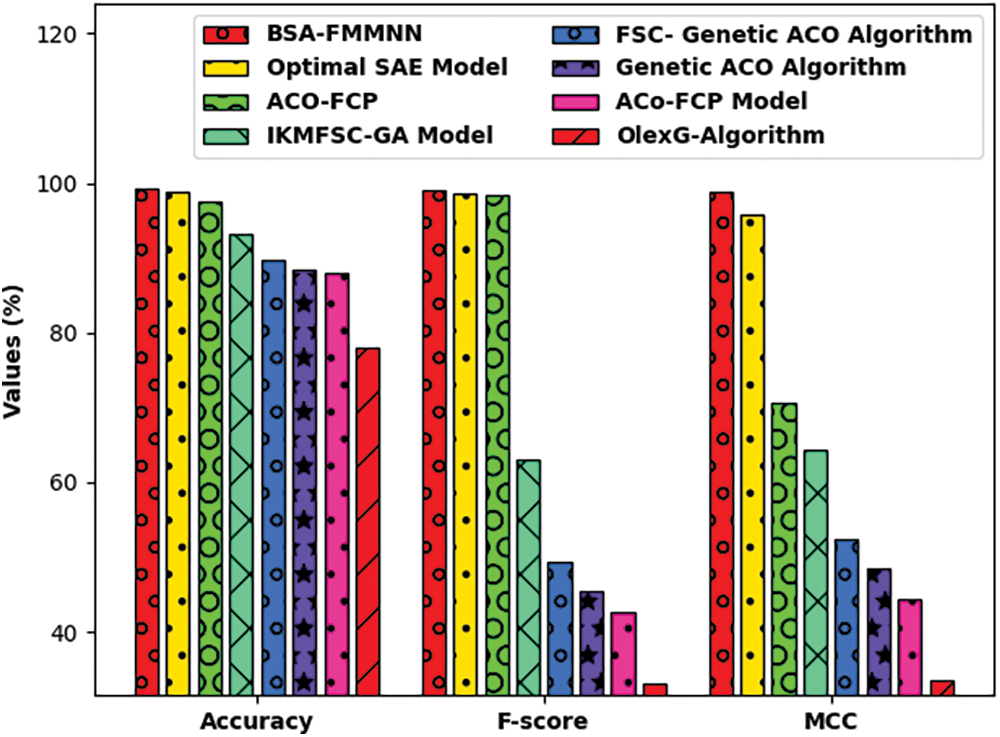
Figure 8: Comparative
Fig. 9 validates the accuracy assessment of the BSA-FMMNN model on the Polish bankruptcy dataset. The results described that the BSA-FMMNN model has the aptitude of gaining improved values of training and validation accuracies. It is visible that the validation accuracy values are slightly higher than training accuracy.
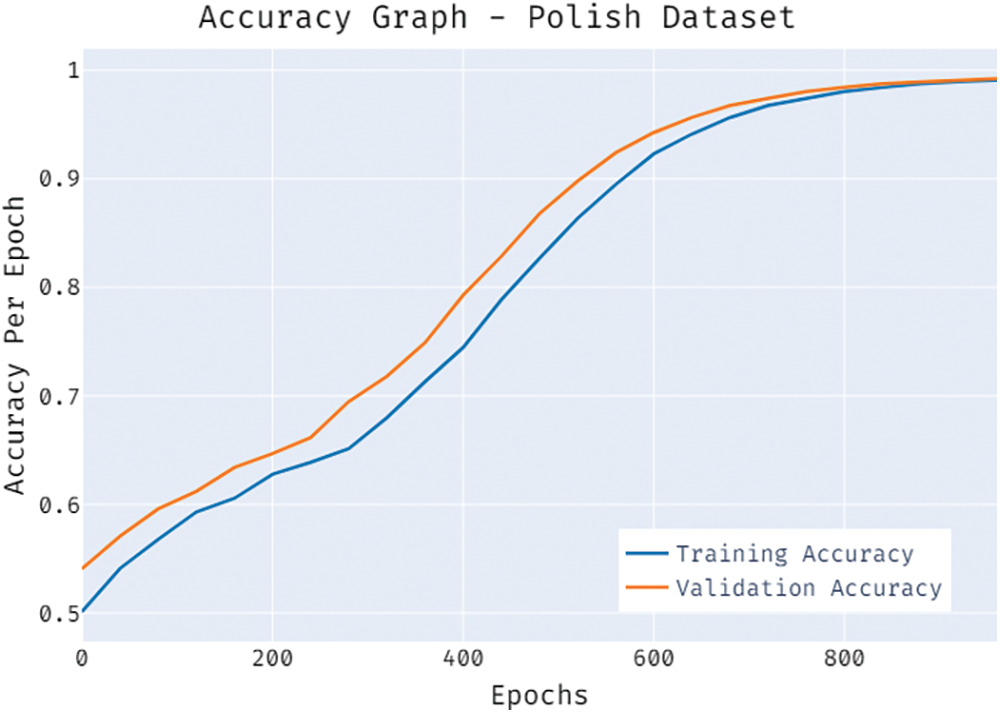
Figure 9: Accuracy graph of BSA-FMMNN model on polish dataset
A brief training and validation loss offered by the BSA-FMMNN model are reported in Fig. 10 on the test Polish dataset. The results revealed that the BSA-FMMNN model has accomplished minimum values of training and validation losses on Polish dataset.
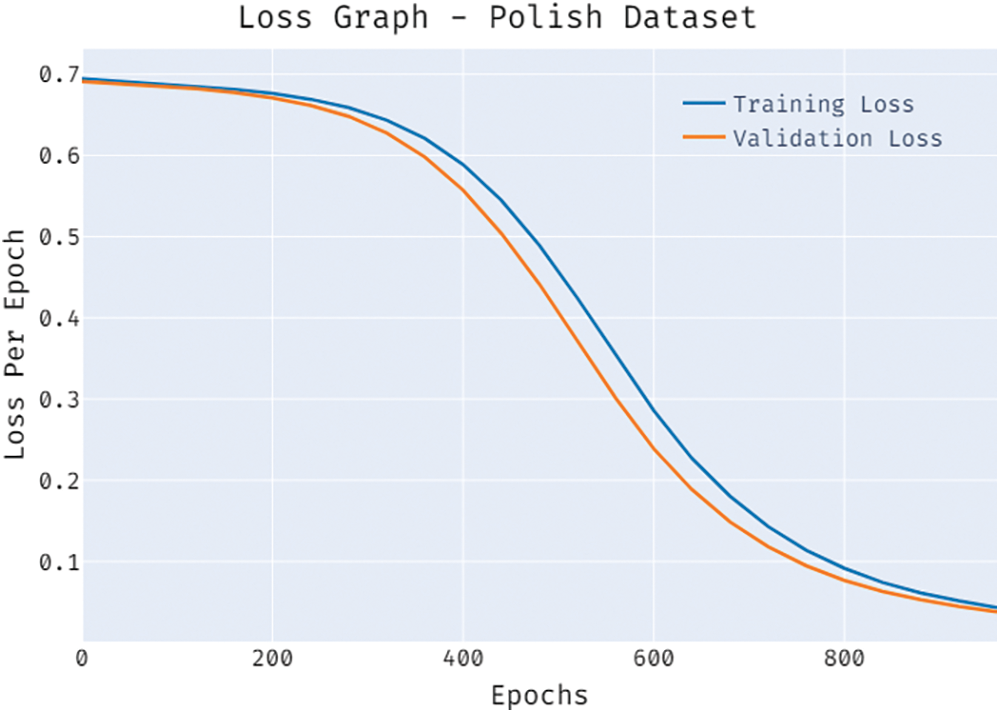
Figure 10: Loss graph of BSA-FMMNN model on polish dataset
Fig. 11 represents the
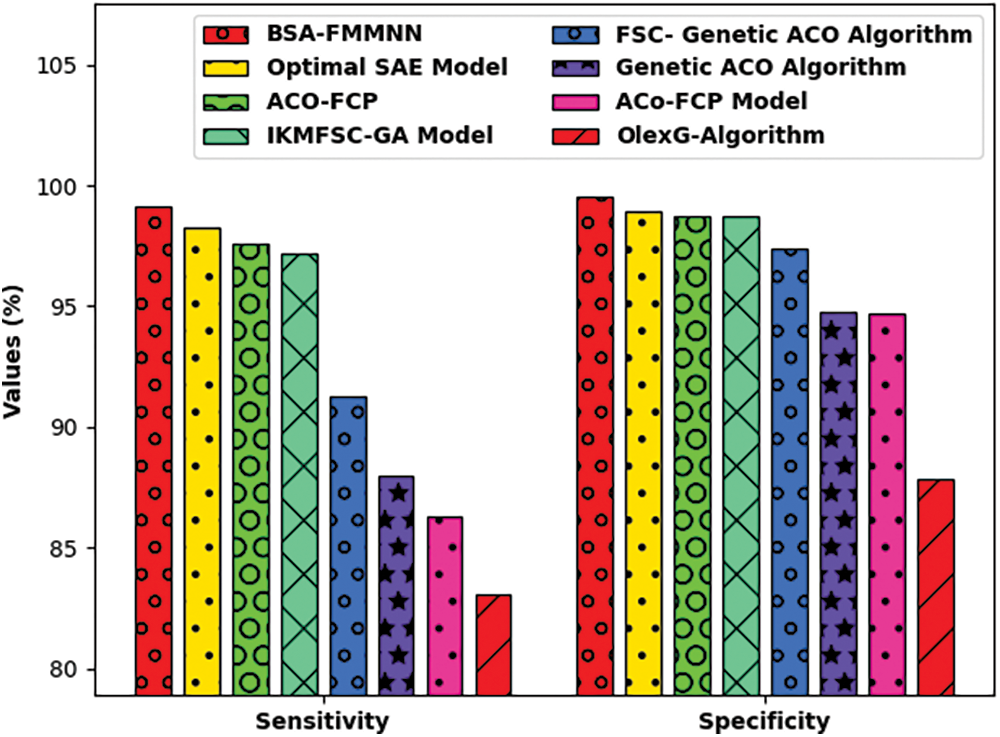
Figure 11: Comparative
Fig. 12 exposes the
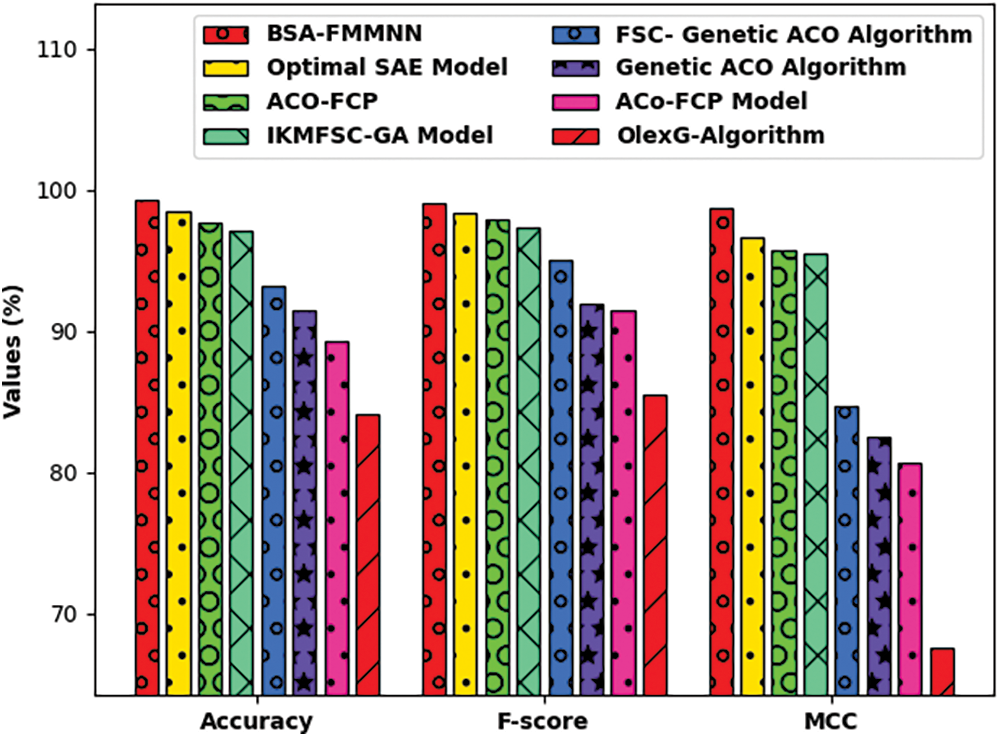
Figure 12: Comparative
Fig. 13 demonstrates the accuracy inspection of the BSA-FMMNN model on the Weislaw dataset. The results reported that the BSA-FMMNN model has the ability to obtain improved values of training and validation accuracies. It is observable that the validation accuracy values are slightly higher than training accuracy.
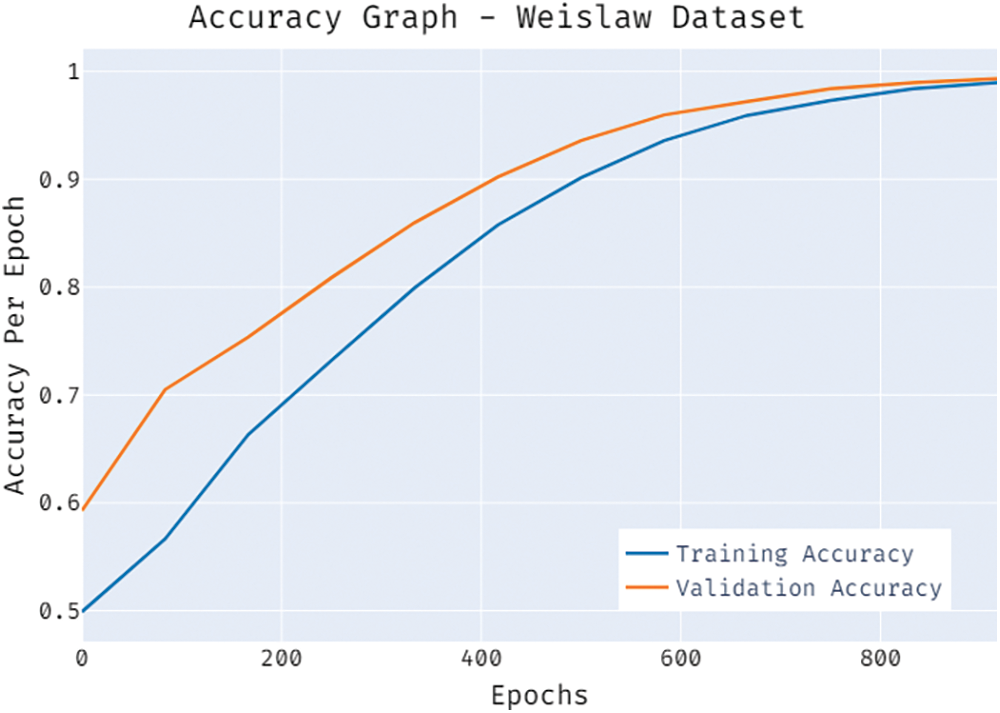
Figure 13: Accuracy graph of BSA-FMMNN model on weislaw dataset
A brief training and validation loss offered by the BSA-FMMNN model are reported in Fig. 14 on the Weislaw dataset. The results portrayed that the BSA-FMMNN model has accomplished least values of training and validation losses on Weislaw dataset. The above mentioned results ensured the supremacy of the BSA-FMMNN model over the recent models.
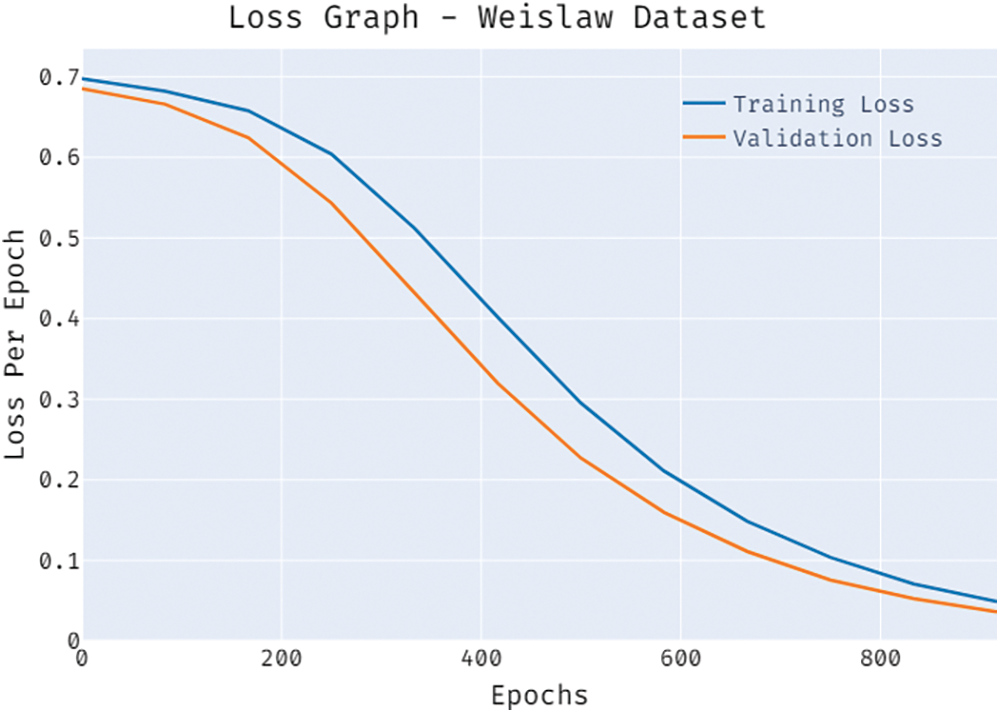
Figure 14: Loss graph of BSA-FMMNN model on weislaw dataset
This study has developed a new BSA-FMMNN model is to determine the financial status of a firm or company. The presented BSA-FMMNN model involves several subprocesses namely preprocessing, k-medoid clustering based outlier removal, FMMNN based classification, and BSA based parameter optimization. The classification process is carried out using the FMMNN model and the parameters involved in it are tuned by the use of BSA. The utilization of proficient parameter selection process using BSA helps to accomplish maximum performance. The experimental result analysis of the BSA-FMMNN model is validated using benchmark dataset and the comparative outcomes highlighted the supremacy of the BSA-FMMNN model over the recent approaches. In future, metaheuristics based feature selection models can be developed for improving the classification performance of the FMMNN model.
Funding Statement: The authors received no specific funding for this study.
Conflicts of Interest: The authors declare that they have no conflicts of interest to report regarding the present study.
1. Xandr and S. Vadlamudi, “The impacts of machine learning in financial crisis prediction,” Asian Business Review, vol. 10, no. 3, pp. 171–176, 2020. [Google Scholar]
2. W. Sun, G. Z. Dai, X. R. Zhang, X. Z. He and X. Chen, “TBE-Net: A three-branch embedding network with part-aware ability and feature complementary learning for vehicle re-identification,” IEEE Transactions on Intelligent Transportation Systems, pp. 1–13, 2021. https://doi.org/10.1109/TITS.2021.3130403 [Google Scholar]
3. W. Sun, L. Dai, X. R. Zhang, P. S. Chang and X. Z. He, “RSOD: Real-time small object detection algorithm in UAV-based traffic monitoring,” Applied Intelligence, pp. 1–16, 2021. https://doi.org/10.1007/s10489-021-02893-3. [Google Scholar]
4. C. Liu and N. Arunkumar, “Risk prediction and evaluation of transnational transmission of financial crisis based on complex network,” Cluster Computing, vol. 22, no. S2, pp. 4307–4313, 2019. [Google Scholar]
5. N. Metawa, P. T. Nguyen, Q. L. H. T. T. Nguyen, M. Elhoseny and K. Shankar, “Internet of things enabled financial crisis prediction in enterprises using optimal feature subset selection-based classification model,” Big Data, vol. 9, no. 5, pp. 331–342, 2021. [Google Scholar]
6. M. Zhou, “Short term prediction method of financial crisis based on artificial intelligence,” in 2020 Int. Conf. on Intelligent Transportation, Big Data & Smart City (ICITBS), Vientiane, Laos, pp. 1026–1029, 2020. [Google Scholar]
7. M. Jiang and X. Wang, “Research on intelligent prediction method of financial crisis of listed enterprises based on random forest algorithm,” Security and Communication Networks, vol. 2021, no. 3, pp. 1–7, 2021. [Google Scholar]
8. S. Ashraf, E. G. S. Félix and Z. Serrasqueiro, “Do traditional financial distress prediction models predict the early warning signs of financial distress?,” Journal of Risk and Financial Management, vol. 12, no. 2, pp. 55, 2019. [Google Scholar]
9. D. F. Arias, M. L. Martín, T. M. Romero, F. M. Estudillo and F. F. Navarro, “Financial soundness prediction using a multi-classification model: Evidence from current financial crisis in OECD banks,” Computational Economics, vol. 52, no. 1, pp. 275–297, 2018. [Google Scholar]
10. D. Rojanah, Sugiyanto and E. Zukhronah, “Financial crisis prediction in Indonesia using combined of volatility and Markov switching models based on real interest rate on deposit and nominal exchange rate indicators,” Journal of Physics: Conference Series, vol. 1563, no. 1, pp. 012002, 2020. [Google Scholar]
11. H. Junyu, “Prediction of financial crisis based on machine learning,” in 2020 The 4th Int. Conf. on Business and Information Management, Rome Italy, pp. 71–75, 2020. [Google Scholar]
12. H. Faris, R. Abukhurma, W. Almanaseer, M. Saadeh, A. M. Mora et al., “Improving financial bankruptcy prediction in a highly imbalanced class distribution using oversampling and ensemble learning: A case from the Spanish market,” Progress in Artificial Intelligence, vol. 9, no. 1, pp. 31–53, 2019. [Google Scholar]
13. S. Shetty, M. Musa and X. Brédart, “Bankruptcy prediction using machine learning techniques,” Journal of Risk and Financial Management, vol. 15, no. 1, pp. 35, 2022. [Google Scholar]
14. H. Kim, H. Cho and D. Ryu, “Corporate bankruptcy prediction using machine learning methodologies with a focus on sequential data,” Computational Economics, vol. 23, no. 4, pp. 589, 2021. [Google Scholar]
15. S. Smiti and M. Soui, “Bankruptcy prediction using deep learning approach based on borderline SMOTE,” Information Systems Frontiers, vol. 22, no. 5, pp. 1067–1083, 2020. [Google Scholar]
16. Z. Chen, W. Chen and Y. Shi, “Ensemble learning with label proportions for bankruptcy prediction,” Expert Systems with Applications, vol. 146, no. 4, pp. 113155, 2020. [Google Scholar]
17. A. Muneer, S. M. Taib, S. M. Fati, A. O. Balogun and I. Abdul Aziz, “Optimized stacked autoencoder for IoT enabled financial crisis prediction model,” Computers Materials & Continua, vol. 71, no. 1, pp. 1079–1094, 2022. [Google Scholar]
18. E. Schubert and P. J. Rousseeuw, “Fast and eager k -medoids clustering: O ( k ) runtime improvement of the PAM, CLARA, and CLARANS algorithms,” Information Systems, vol. 101, pp. 101804, 2021. [Google Scholar]
19. O. N. Al Sayaydeh, M. F. Mohammed and C. P. Lim, “Survey of fuzzy min-max neural network for pattern classification variants and applications,” IEEE Transactions on Fuzzy Systems, vol. 27, no. 4, pp. 635–645, 2019. [Google Scholar]
20. L. Xiang, Z. Deng and A. Hu, “Forecasting short-term wind speed based on IEWT-LSSVM model optimized by bird swarm algorithm,” IEEE Access, vol. 7, pp. 59333–59345, 2019. [Google Scholar]
21. J. Uthayakumar, N. Metawa, K. Shankar and S. Lakshmanaprabu, “Financial crisis prediction model using ant colony optimization,” International Journal of Information Management, vol. 50, no. 5, pp. 538–556, 2020. [Google Scholar]
 | This work is licensed under a Creative Commons Attribution 4.0 International License, which permits unrestricted use, distribution, and reproduction in any medium, provided the original work is properly cited. |