DOI:10.32604/cmc.2022.028411
| Computers, Materials & Continua DOI:10.32604/cmc.2022.028411 | |
| Article |
Air Pollution Prediction Via Graph Attention Network and Gated Recurrent Unit
1Beijing Key Laboratory of Multimedia and Intelligent Software Technology, Beijing Artificial Intelligence Institute, the Faculty of Information Technology, Beijing University of Technology, Beijing, 100124, China
2Beijing Meteorological Observatory, Beijing, 100089, China
3Nanjing University of Information Science & Technology, Nanjing, 210044, China
4China Meteorological Administration Training Centre, Beijing, 100081, China
5Texas Tech University, Lubbock, TX79409, United States
*Corresponding Author: Yong Zhang. Email: zhangyong2010@bjut.edu.cn
Received: 09 February 2022; Accepted: 23 March 2022
Abstract: PM2.5 concentration prediction is of great significance to environmental protection and human health. Achieving accurate prediction of PM2.5 concentration has become an important research task. However, PM2.5 pollutants can spread in the earth’s atmosphere, causing mutual influence between different cities. To effectively capture the air pollution relationship between cities, this paper proposes a novel spatiotemporal model combining graph attention neural network (GAT) and gated recurrent unit (GRU), named GAT-GRU for PM2.5 concentration prediction. Specifically, GAT is used to learn the spatial dependence of PM2.5 concentration data in different cities, and GRU is to extract the temporal dependence of the long-term data series. The proposed model integrates the learned spatio-temporal dependencies to capture long-term complex spatio-temporal features. Considering that air pollution is related to the meteorological conditions of the city, the knowledge acquired from meteorological data is used in the model to enhance PM2.5 prediction performance. The input of the GAT-GRU model consists of PM2.5 concentration data and meteorological data. In order to verify the effectiveness of the proposed GAT-GRU prediction model, this paper designs experiments on real-world datasets compared with other baselines. Experimental results prove that our model achieves excellent performance in PM2.5 concentration prediction.
Keywords: Air pollution prediction; deep learning; spatiotemporal data modeling; graph attention network
With the development of urban economy, air pollution has become more serious in recent years. This situation has received significant public attention. Major air pollutants include SO2, NO2, PM2.5, and PM10. PM2.5 (particulate matter with diameters less than or equal to 2.5
Air pollution data collected from monitoring stations in different cities has complex temporal and spatial characteristics. The monitoring data we obtained is composed of long-term series of PM2.5 concentration in multiple cities. These time series have two temporal characteristics: the tendency to increase or decrease over time and the seasonality in which air pollution becomes severe in certain seasons, such as winter. In addition to temporal characteristics, PM2.5 pollutants spread and influence each other between adjacent cities, so the spatial correlations between cities need to be considered in the prediction process. Existing studies usually do not consider spatial correlation [4–6], or only consider fixed spatial correlation and cannot dynamically learn spatial features [7–9]. On the other hand, air pollutant concentrations are affected by urban meteorological conditions, such as the city’s humidity, temperature, precipitation, and wind speed. These meteorological conditions are underutilized in existing forecasting models. To address the above two limitations, we designed a new PM2.5 concentration prediction model GAT-GRU. The proposed model is able to learn the dynamic spatiotemporal dependence of air pollution data and make good use of the city’s meteorological knowledge.
In order to achieve effective capture of complex spatial features, our paper attempts to use graph attention networks to learn spatial characteristics of PM2.5 concentration data. The graph attention network (GAT) obtains the feature representation of the target node by assigning different importance to different nodes in the neighborhood of the target node [10]. In the PM2.5 concentration prediction process, some neighboring cities have strong correlations with the target city in terms of air pollutants. Therefore, the GAT model can focus on the important cities with strong correlations to obtain a more accurate representation when learning the spatial dependence. In dealing with the complex temporal dependence of PM2.5 data sequences, we use another variant of the recurrent neural network: Gated Recurrent Unit (GRU) [11]. Compared with traditional recurrent neural networks, GRU can overcome the problems of gradient disappearance and gradient explosion when modeling long-range dependence. On the other hand, GRU has the advantage of rapid calculation speed due to fewer calculation parameters. In general, this paper combines GAT and GRU to form a spatiotemporal prediction model of PM2.5 pollutant concentration.
In this paper, we propose a hybrid model called GAT-GRU that integrates GAT module and GRU cell for spatiotemporal modeling and prediction of PM2.5 concentration. In addition, the GAT-GRU prediction model makes an attempt to incorporate meteorological knowledge into the graph structure as node attributes. In summary, GAT-GRU is a prediction model that can effectively capture the spatiotemporal dependence of PM2.5 concentration and use various additional information to enhance prediction.
The three main contributions of this paper are as follows:
(1) We propose a spatiotemporal prediction model called GAT-GRU. Graph Attention Networks are introduced in the model to learn spatial connections between nodes. This model can effectively learn the spatiotemporal dependence of PM2.5 concentration data series.
(2) Meteorological knowledge that reflects the characteristics of the monitoring station itself is utilized in the predictive model. We incorporate meteorological knowledge as part of the input to the graph attention network.
(3) The proposed model has been experimented on real-world datasets. The results validate the good performance of the model in PM2.5 prediction.
2.1 PM2.5 Concentration Prediction
Weather prediction is an important research direction [12–15]. The main tasks include rainfall prediction, temperature prediction, air pollution prediction, etc. Recent research on PM2.5 concentration prediction is generally based on deep learning methods, which convert the PM2.5 concentration prediction problem into a data mining problem. Therefore, it is necessary to introduce the PM2.5 prediction models using deep learning methods. With the rapid growth of air pollution data, deep learning methods have been further applied in PM2.5 prediction and proven effective prediction performance. In order to capture the complex temporal characteristics contained in the air pollutant data series, recurrent neural networks such as Long Short-Term Memory (LSTM) [4] have been widely used in PM2.5 prediction and achieved good performance [5,6]. These studies show that LSTM can achieve better results than traditional machine learning methods when modeling long-term sequence prediction problems. However, these methods only consider the temporal characteristics of PM2.5 concentration series, and lack the utilization of spatial characteristics that reflect the correlation between different monitoring stations.
However, the aforementioned deep learning methods usually only consider temporal characteristics of PM2.5 concentration data. In the real world, the PM2.5 concentration data of different regions are spatially interrelated, and PM2.5 pollutants between areas could be transmitted and diffused to each other. In order to learn the spatial correlation, convolutional neural networks are introduced to extract the spatial characteristics of the time series of PM2.5 pollutants [16,17]. Many research works combine convolutional neural networks (CNN) and LSTM to learn the temporal and spatial dependence of urban PM2.5 concentration [7–9]. Attention ConvLSTM Encoder-Forecaster (AttEF) [18] integrates the attention mechanism into ConvLSTM encoder-forecaster to solve the loss of important spatiotemporal information, which has achieved good performance in precipitation nowcasting. These methods combine CNN and LSTM to form a spatiotemporal prediction model for PM2.5 concentration. But convolutional neural networks can only be used to process data in Euclidean space, and there are still shortcomings in capturing spatial features. In general, deep learning methods have achieved good results in PM2.5 concentration prediction. How to learn the spatial dependence of PM2.5 concentration data between different monitored cities needs further research. In addition, the influence of meteorological factors needs to be considered in the forecasting process.
Recently, graph neural networks have received increasing attention from researchers due to their ability to learn graph structure information, representing complex non-Euclidean spatial information [19]. Considering the non-Euclidean distribution among air monitoring stations in different cities, only using convolutional neural networks is not enough to capture complex spatial information. Therefore, the graph neural network (GNN) model based on the graph structure can better learn the spatial correlation between PM2.5 monitoring concentration data in different cities. PM2.5-GNN integrates domain knowledge into graph-structured data to explicitly model the long-term spatiotemporal dependence in the PM2.5 forecasting process [20]. In addition to GNN, graph convolutional neural networks also play an essential role in air pollutant prediction. In the GLSTM model [21], the graph convolutional network is combined with LSTM to introduce spatiotemporal information into PM2.5 concentration prediction. Hierarchical graph convolutional networks are adopted to model air pollutants’ diffusion process more effectively in air quality prediction [22]. GCLSTM proposes a hybrid model combining graph convolutional network and LSTM to model and predict the continuous changes of PM2.5 concentration [23]. The above methods use graph neural networks to learn node features on a fixed graph, and cannot dynamically learn the weights of edges representing correlations between nodes. Graph convolutional networks or graph neural networks obtain node representations by aggregating the proximity information of target nodes. However, the relationship between different PM2.5 monitoring sites is not just a connection of 0 or 1. The spread of air pollution between cities is also closely related to meteorological conditions. The connection relationship between nodes needs to be more optimized to a more accurate value to obtain a richer expression. Therefore, we use graph attention network to learn the spatial relationship of PM2.5 concentration data in this paper. Compared with other types of graph networks, graph attention networks use the attention mechanism to learn the relative importance of different neighbor nodes. This method can effectively improve the expressive ability of the graph network.
3 Data and Meteorological Knowledge
The dataset used in the paper is a public dataset in the field of air pollution research [20]. The dataset contains PM2.5 concentration and meteorological feature data in 184 cities across multiple provinces in north and south China. The time of the collected dataset is from January 1, 2015 to December 31, 2018, which is recorded every three hours. Following the previous work [20], this public dataset can be divided into two datasets. Dataset 1 uses the pollution situation in the past period to predict the future PM2.5 concentrations. Dataset 2 selects the monitoring data during winter, when the air pollution is more serious, and the pollutants are blown by the monsoon from northern China to southern China. Fig. 1 shows the specific locations of the 184 cities in the dataset, (a) and (b) are the locations of cities with PM2.5 monitoring data in northern China and southern China.
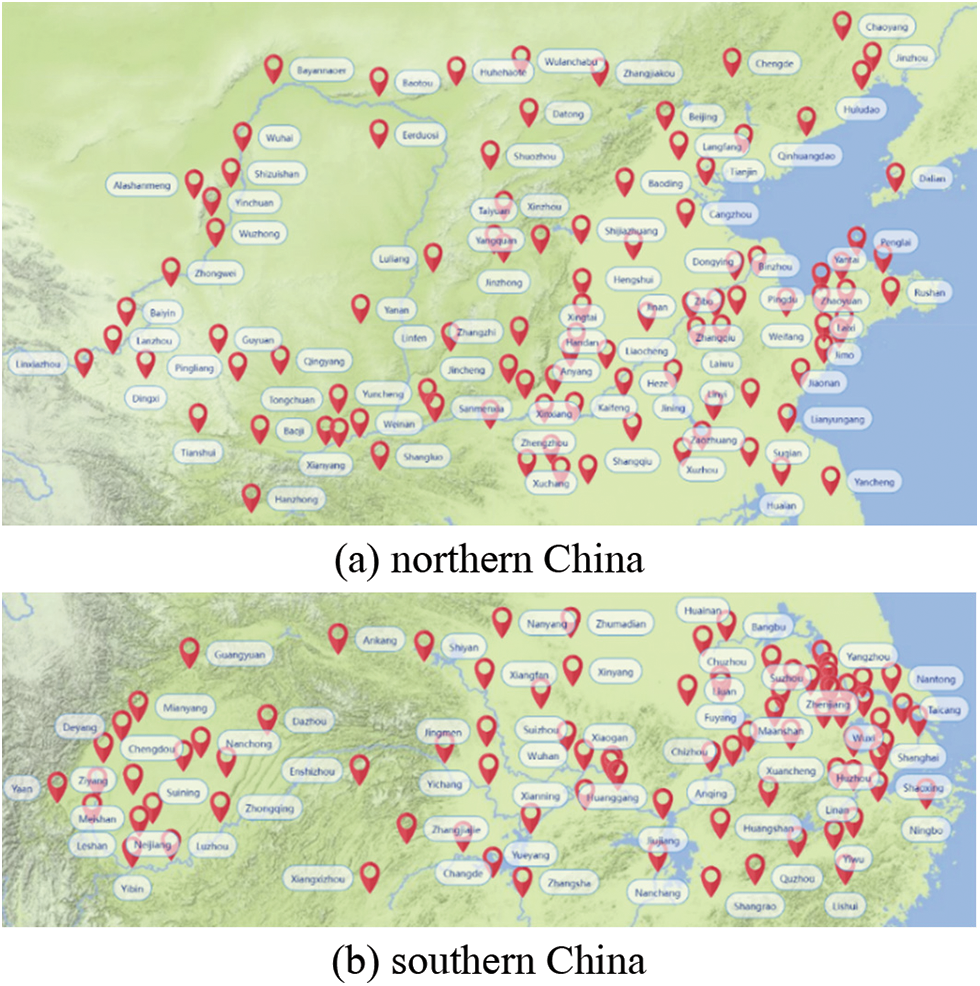
Figure 1: The location of cities with PM2.5 monitoring data on the map
In the spatiotemporal modeling problem of PM2.5 prediction, we define the graph representing the spatial correlation between cities as
where
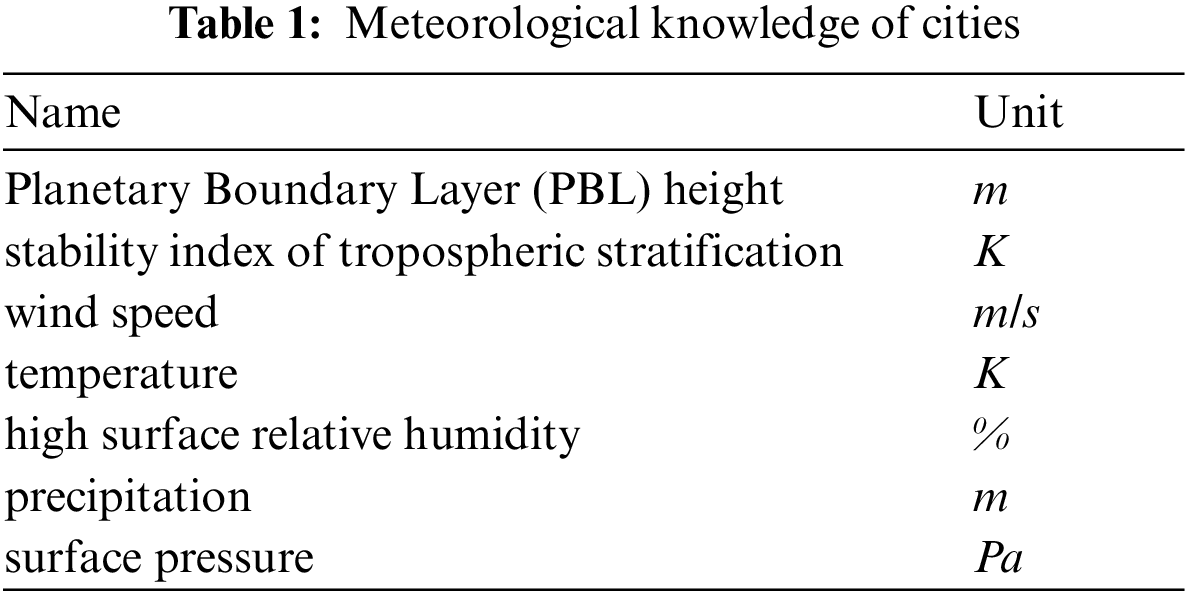
Meteorological Knowledge: The meteorological characteristics and environmental factors of cities largely affect the production or spread of PM2.5 pollutants. SCENT [24] proposes that the precipitation results in precipitation nowcasting are related to non-image features such as wind speed and shape of cloud clusters. The study find that there is a negative correlation between temperature and PM2.5 concentration. As the temperature increases, the particle concentration decreases. Air pressure is positively related to particle concentration. There is a negative correlation between wind speed and PM2.5 concentration within a certain range [25]. Therefore, we also integrate meteorological features as domain knowledge into the process of air pollutant prediction. The domain knowledge of meteorological characteristics related to PM2.5 concentration includes Planetary Boundary Layer (PBL) height, stability index of tropospheric stratification, wind speed, temperature, high surface relative humidity, precipitation and surface pressure. Tab. 1 shows the names and units of seven types of meteorological knowledge. In the GAT-GRU model, meteorological knowledge is utilized as attributes of different city nodes to enhance PM2.5 concentration prediction.
PM2.5 concentration prediction can be regarded as a spatiotemporal modeling problem. This paper uses two deep learning methods to learn the spatiotemporal dependence of PM2.5 concentration data. This paper uses two deep learning methods to construct a GAT-GRU model to learn the temporal and spatial dependence of PM2.5 concentration data. Graph attention network is used for spatial feature modeling, and the gated recurrent unit is used for temporal feature modeling.
For the air pollutant prediction problem, it is vital to learn the spatial characteristics and dependencies contained in the original data. From a spatial perspective, neighboring cities generally have similar air pollution conditions, and air pollutants could spread and affect each other between neighboring cities. The current research work either ignores the mutual influence between different city nodes or introduces prior knowledge to establish node correlations. In GAT-GRU prediction model, the graph attention network is used to capture the spatial dependence of PM2.5 concentration monitoring data. Compared with graph convolutional network, GAT can assign different weights to the neighbor nodes of the target node according to their importance.
Unlike the general GAT-based forecasting model, the input h of the GAT layer in the GAT-GRU model is obtained by combining two parts: PM2.5 concentration data x for a period of time, and the domain knowledge s reflecting the city’s meteorological conditions during this period. Meteorological conditions are closely related to the generation and spread of air pollutions. Therefore, these factors need to be fully considered in the PM2.5 concentration prediction process.
The GAT layer in the prediction model is mainly composed of two parts: (1) calculate the attention coefficient. (2) aggregate features of neighbor nodes to get node representation. Fig. 3 shows the calculation process of the graph attention mechanism. First of all, the attention coefficient represents the importance of neighboring nodes to the target node. The following formula can calculate the attention coefficient:
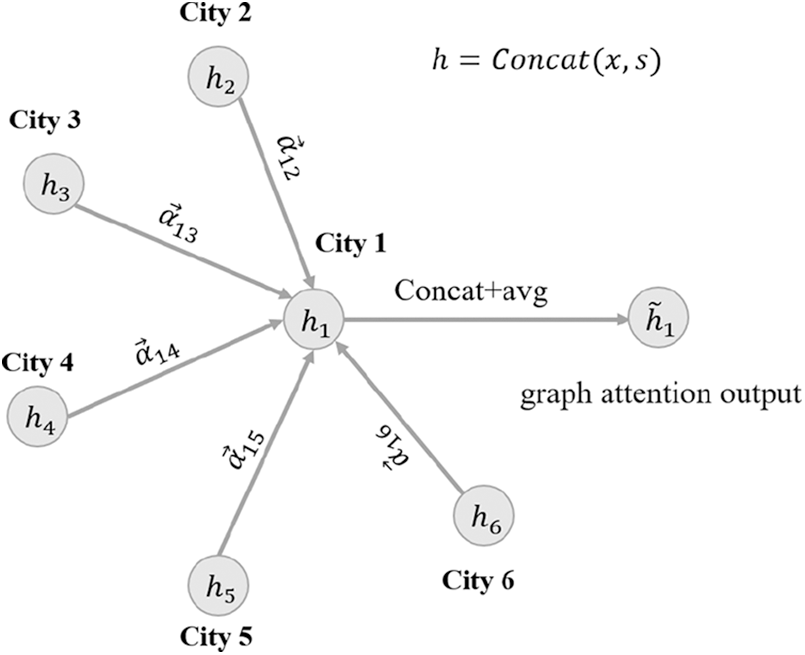
Figure 2: Graph attention mechanism
The calculation formula of the final result of the attention coefficient is shown in formula (4). The specific attention operation in GAT is to splicing the feature vectors of two nodes together, and then doing an inner product with the weight vector
where
where
In order to enhance the stability of the results, the multi-head attention mechanism is used in the GAT layer. As shown in formula (6), the results of K independent attention operations are aggregated to obtain the final feature representation.
The PM2.5 concentration data recorded by the air pollution monitoring stations is stored in the form of time series. The time series of PM2.5 concentrations have remarkable features such as periodicity, proximity and trend. Periodicity means that the PM2.5 concentration fluctuates cyclically over a longer period of time. Proximity means that the PM2.5 concentration values are closer when the time period is similar. Trend means that the change of PM2.5 concentration has a trend of increase or decrease in a period of time. Therefore, it is very important to model the temporal dependence of PM2.5 concentration data. With the development of deep learning, the recurrent neural network has become an effective method in time series modeling. Many PM2.5 prediction methods use LSTM as the basic model for learning temporal dependencies [7–9]. This paper uses a variant of the recurrent neural network called gated recurrent unit (GRU) to process air pollution data. Fig. 3 shows the overall structure of the gated recurrent unit.
Gated recurrent unit contains two gates: reset gate
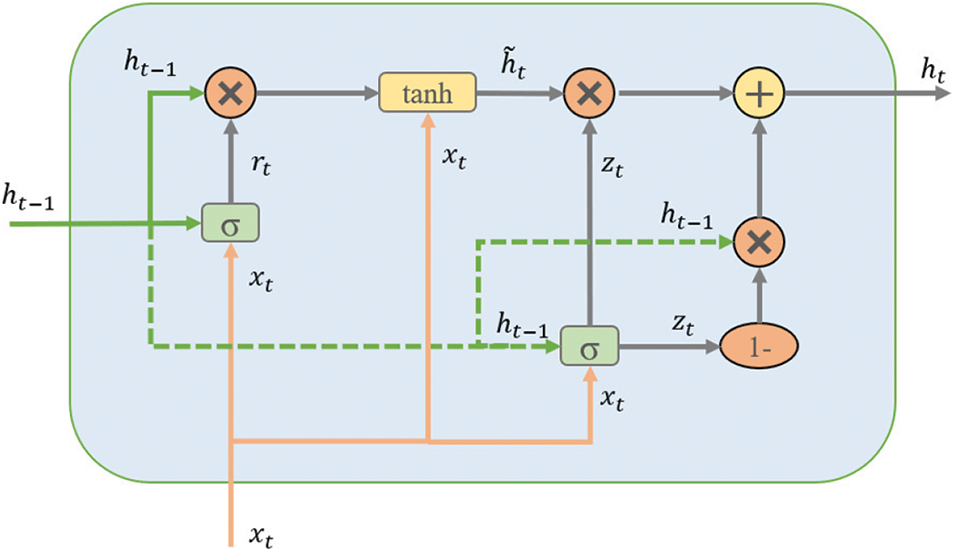
Figure 3: The overall structure of the gated recurrent unit
In order to model the spatiotemporal dependence of PM2.5 concentration sequence, this paper proposes the GAT-GRU model composed of graph attention mechanism and gated recurrent unit. The input of the GAT-GRU model includes the node features matrix
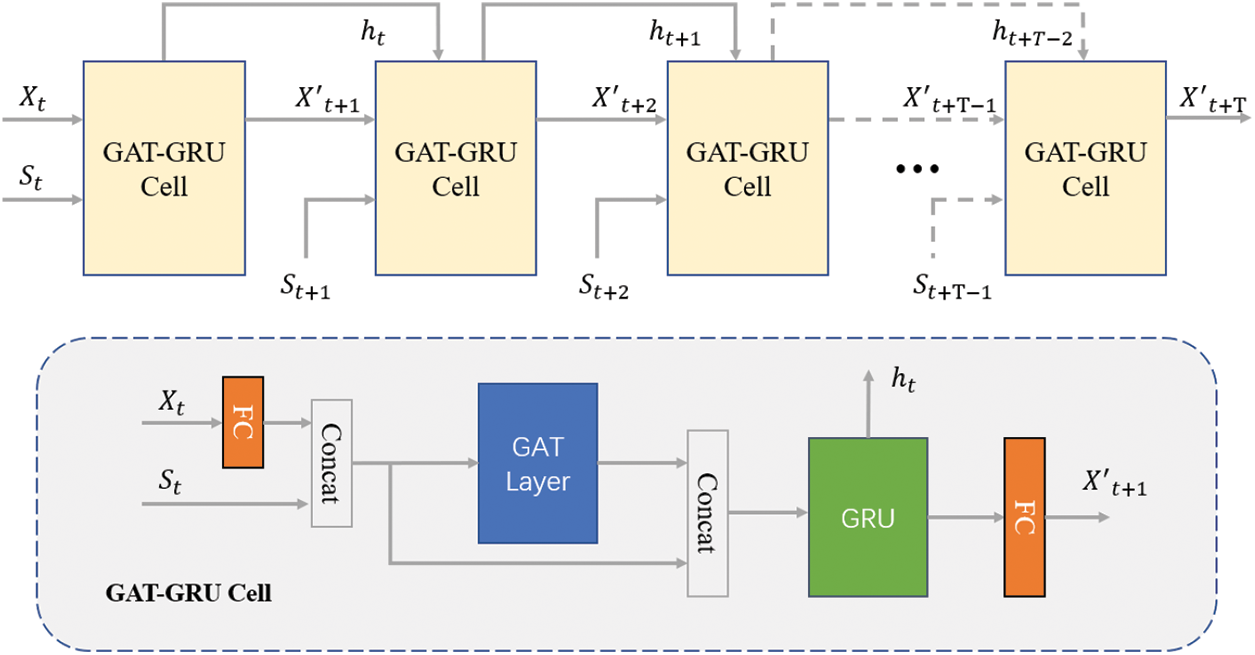
Figure 4: Spatial-temporal modeling using GAT-GRU cell
In this paper, the PM2.5 concentration data
where
the above four formulas are the calculation formulas of GRU.
where
We summarize the learning process of the GAT-GRU prediction model in Algorithm 1 below.
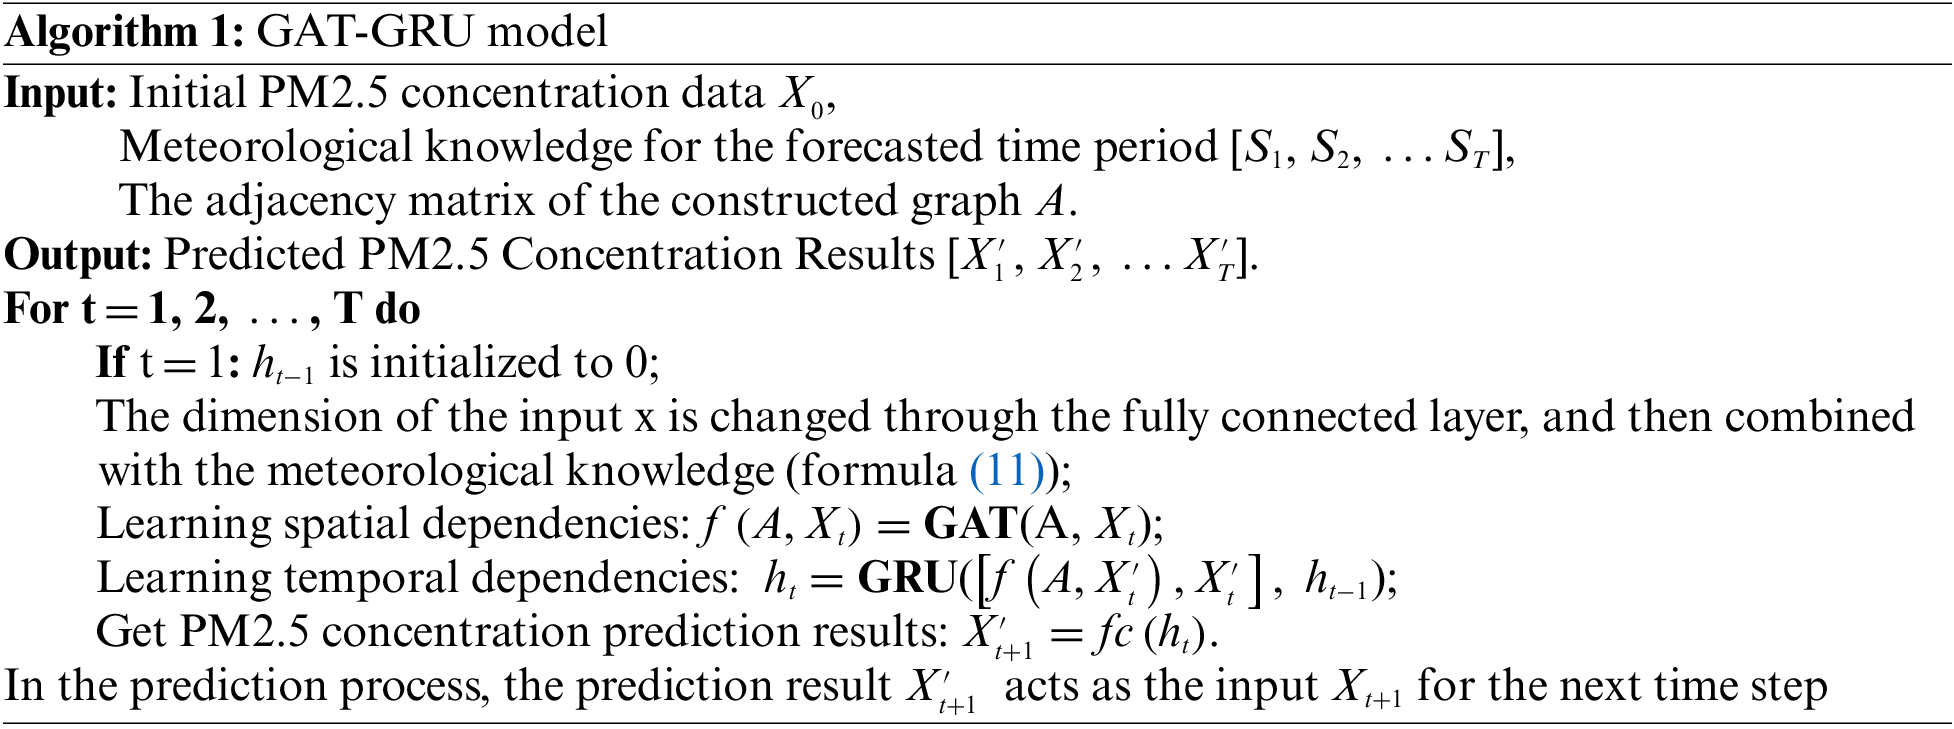
We conduct experiments on a GPU server with a single 2080ti which has 11G video memory. We use PyTorch as the deep learning running framework of the server. The initial hidden state
A total of 5 evaluation indicators are used in the experiment to evaluate the predictive performance of the GAT-GRU model. These indicators can be divided into two categories. The commonly used indicators to measure prediction accuracy in prediction models are mean absolute error (MAE) and root mean square error (RMSE). The other is the commonly used accuracy evaluation indicators in meteorology: critical success index (CSI), false alarm rate (FAR) and probability of detection (POD).
Specifically, the calculation methods of MAE and RMSE are as follows:
where
Following PM2.5-GNN, the calculation methods of three meteorological evaluation indicators are as follows:
where
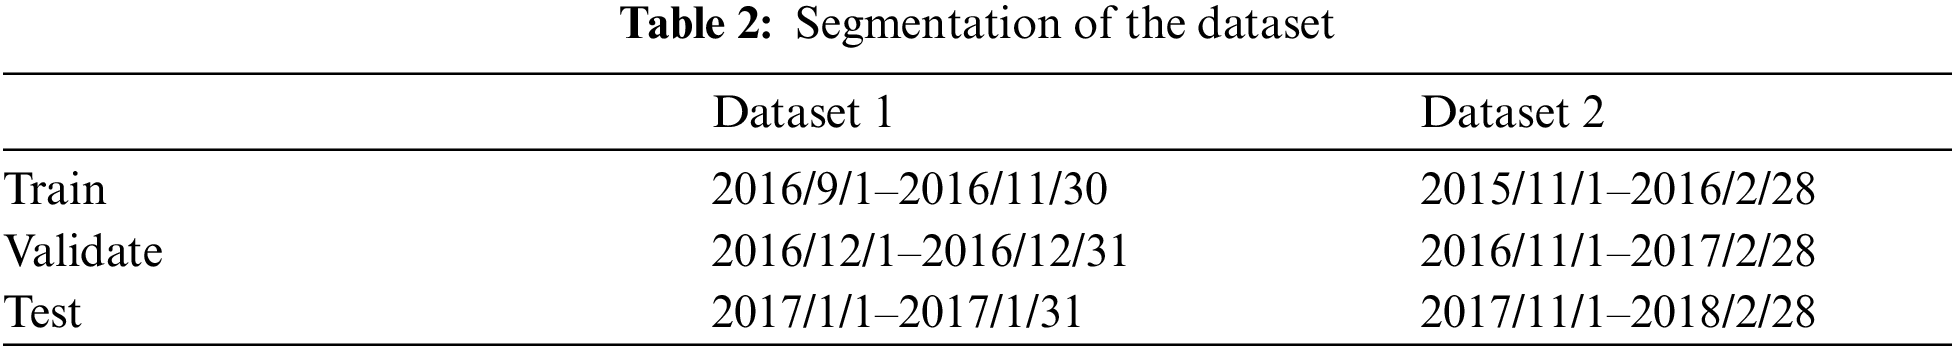
As shown in Section 3, the dataset we used in the experiment is KnowAir, which contains the PM2.5 concentration data and meteorological attribute data of 184 cities in China collected from the real world from January 1, 2015 to December 31, 2018. From this dataset, we obtain two datasets (Dataset 1 and Dataset 2) for experiments. Dataset 1 represents the air pollution prediction under normal circumstances, and Dataset 2 selects the PM2.5 data in winter with severe air pollution for prediction. Tab. 2 shows the segmentation method of the two datasets in the experiment.
In the PM2.5 concentration prediction experiment, the following models are used as baselines compared with the proposed GAT-GRU model. For the fairness of the comparison of experimental results, we add meteorological knowledge as part of the model input when conducting experiments on all baselines.
(1) MLP [26]: MLP is a classic multi-layer neural network model, which generally consists of an input layer, a hidden layer and an output layer. The representation of the node is used as the input of the multi-layer perceptron to obtain the prediction result finally.
(2) LSTM [4]: LSTM is an improved variant of recurrent neural network that can capture the time series characteristics of air pollution data.
(3) GRU [11]: GRU is another variant of the recurrent neural network. Similar to LSTM, GRU is also used to model the temporal characteristics of PM2.5 concentration data. The difference between GRU and the proposed model lies in the use of spatial feature modeling methods. Using GRU as a baseline can demonstrate the effectiveness of spatial modeling.
(4) GC-LSTM [23]: GC-LSTM is a spatiotemporal representation model with superior performance in the current research direction of PM2.5 prediction. This model combines GCN and LSTM to model the spatiotemporal characteristics of PM2.5 concentration data.
(5) PM2.5-GNN [20]: PM2.5-GNN is currently the state-of-the-art model for PM2.5 prediction performance. This model considers the use of the domain knowledge of city nodes to enhance the prediction effect and considers the attributes of the edges between cities, such as the transport effect brought by the wind.
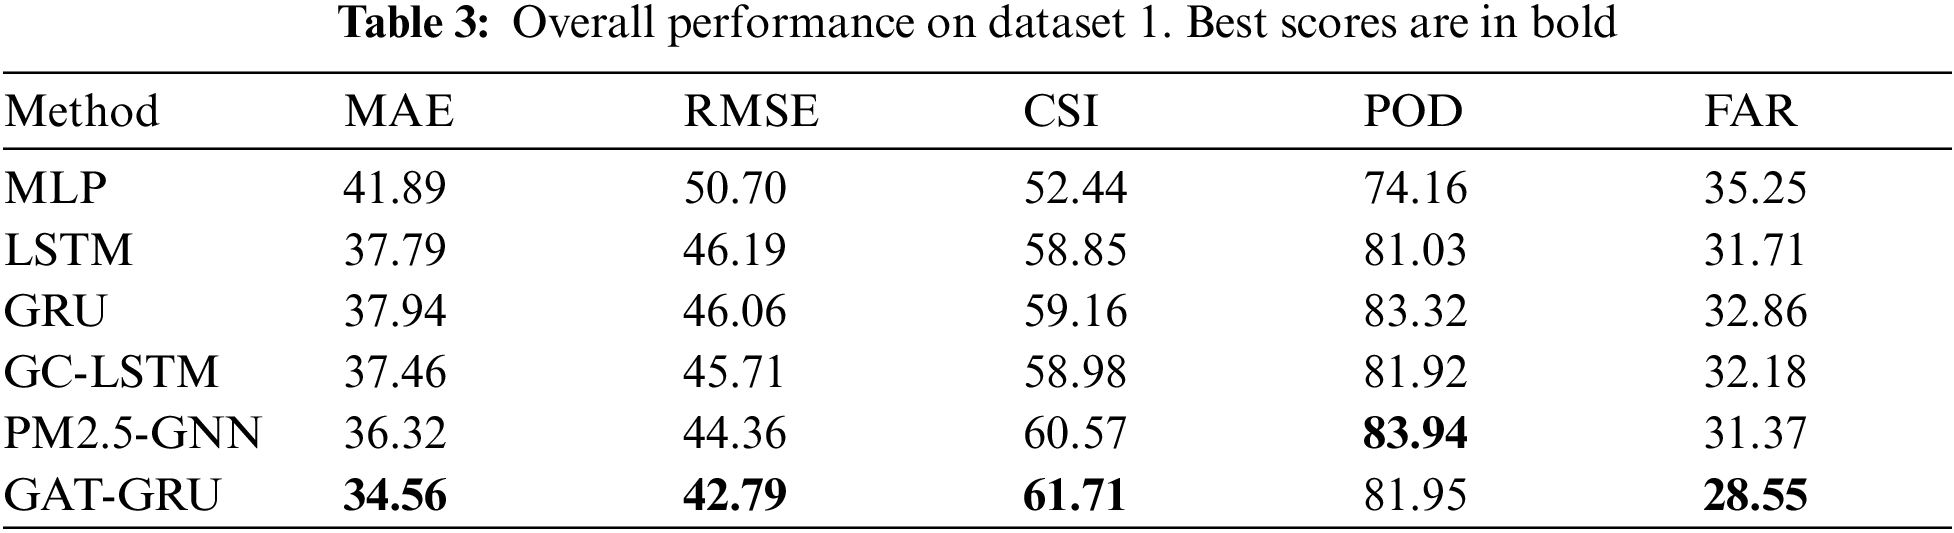
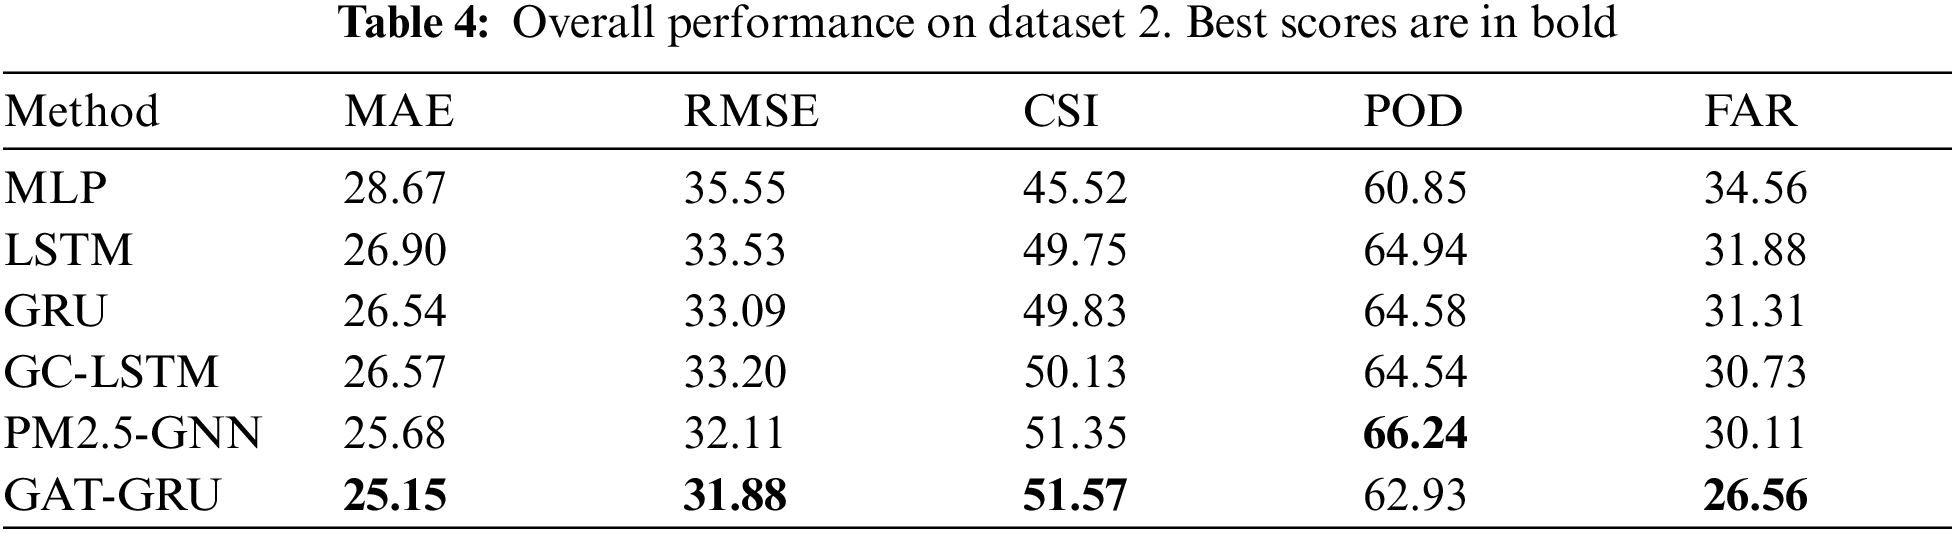
Experiment 1: comparison with baselines. Tabs. 3 and 4 show the PM2.5 concentration prediction performance of our proposed method and other methods used as baselines. As mentioned above, we conduct experiments on two real-world datasets. Experimental results include MAE, RMSE, CSI, POD and FAR. All the best experimental results are highlighted in bold. From the results in the table, we can see that the prediction performance of the methods that use the recurrent neural network to model the time characteristics is better than the MLP model. Furthermore, the predictive models that use graph structure to model spatial dependence have better performance, such as GC-LSTM, PM2.5-GNN and the proposed GAT-GRU model. These results mean that it is vital to model spatiotemporal dependence for PM2.5 prediction problem. Both GAT-GRU and PM2.5-GNN introduce new information and knowledge, such as meteorological attributes of cities and edge attributes obtained from wind speed and direction between city nodes. The experimental results prove that the introduction of meteorological knowledge can effectively improve the accuracy of prediction. In the experimental results of Dataset 1, the MAE and RMSE of the GAT-GRU model are 34.56 and 42.79, which are better than the results of other models. In the experimental results of Dataset 2, the results of GAT-GRU are also basically stronger than other models. Compared with the graph neural network in GC-LSTM and PM2.5-GNN, the graph attention network can effectively model the dynamic connection between monitoring nodes, especially under the condition of the integration of meteorological knowledge. In the experiments of the two datasets, the POD (Probability of Detection) indicator of PM2.5-GNN is better than the GAT-GRU model. Since PM2.5-GNN utilizes edge attributes composed of wind speed and wind direction between city nodes, more accurate PM2.5 propagation information can effectively enhance the probability of detection. In general, compared with other methods, the proposed GAT-GRU model achieves better prediction performance.
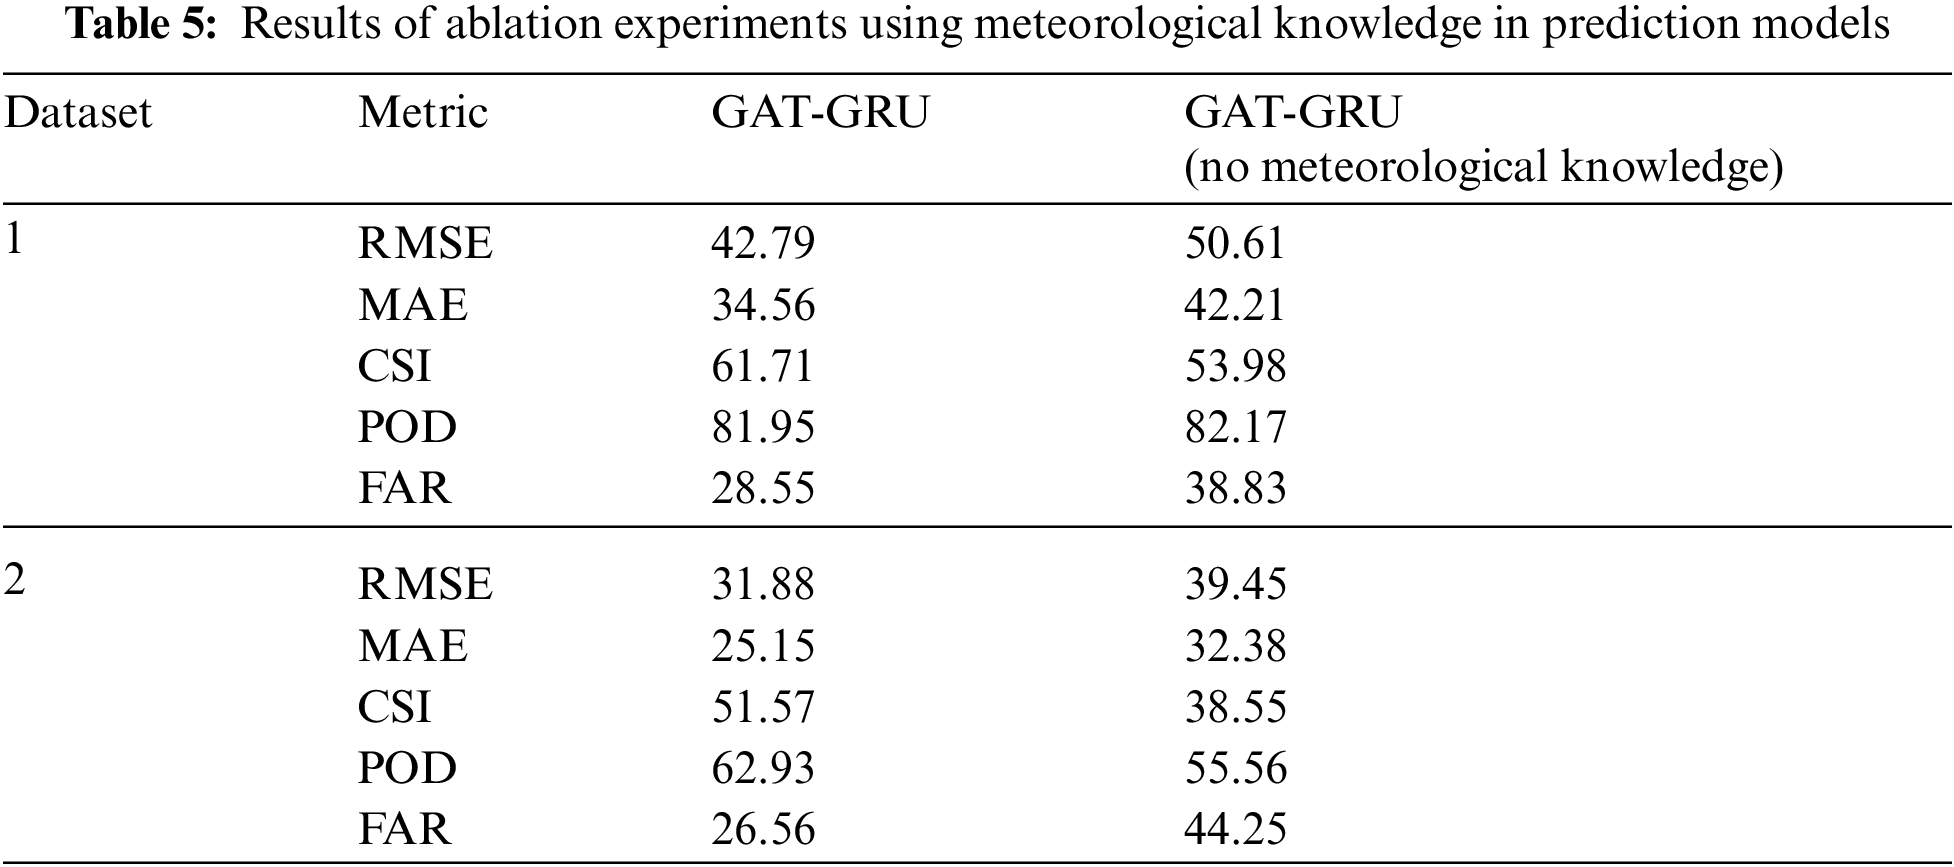
Experiment 2: The influence of meteorological knowledge. Tab. 5 shows the results of ablation experiments on whether meteorological knowledge is incorporated in the GAT-GRU model. Taking the experimental results on Dataset 1 as an example, the predicted MAE and RMSE of the GAT-GRU model (without meteorological knowledge) are 42.21 and 50.61. With the use of meteorological knowledge, MAE and RMSE are reduced by 7.65 and 7.82 respectively. The experimental results show that the use of meteorological knowledge effectively improves the results of PM2.5 concentration prediction. In addition, the MAE and RMSE of the ablation experiment on Dataset 2 have a more significant decrease, which proves that the result of the use of meteorological knowledge on Dataset 2 is better than that of Dataset 1.
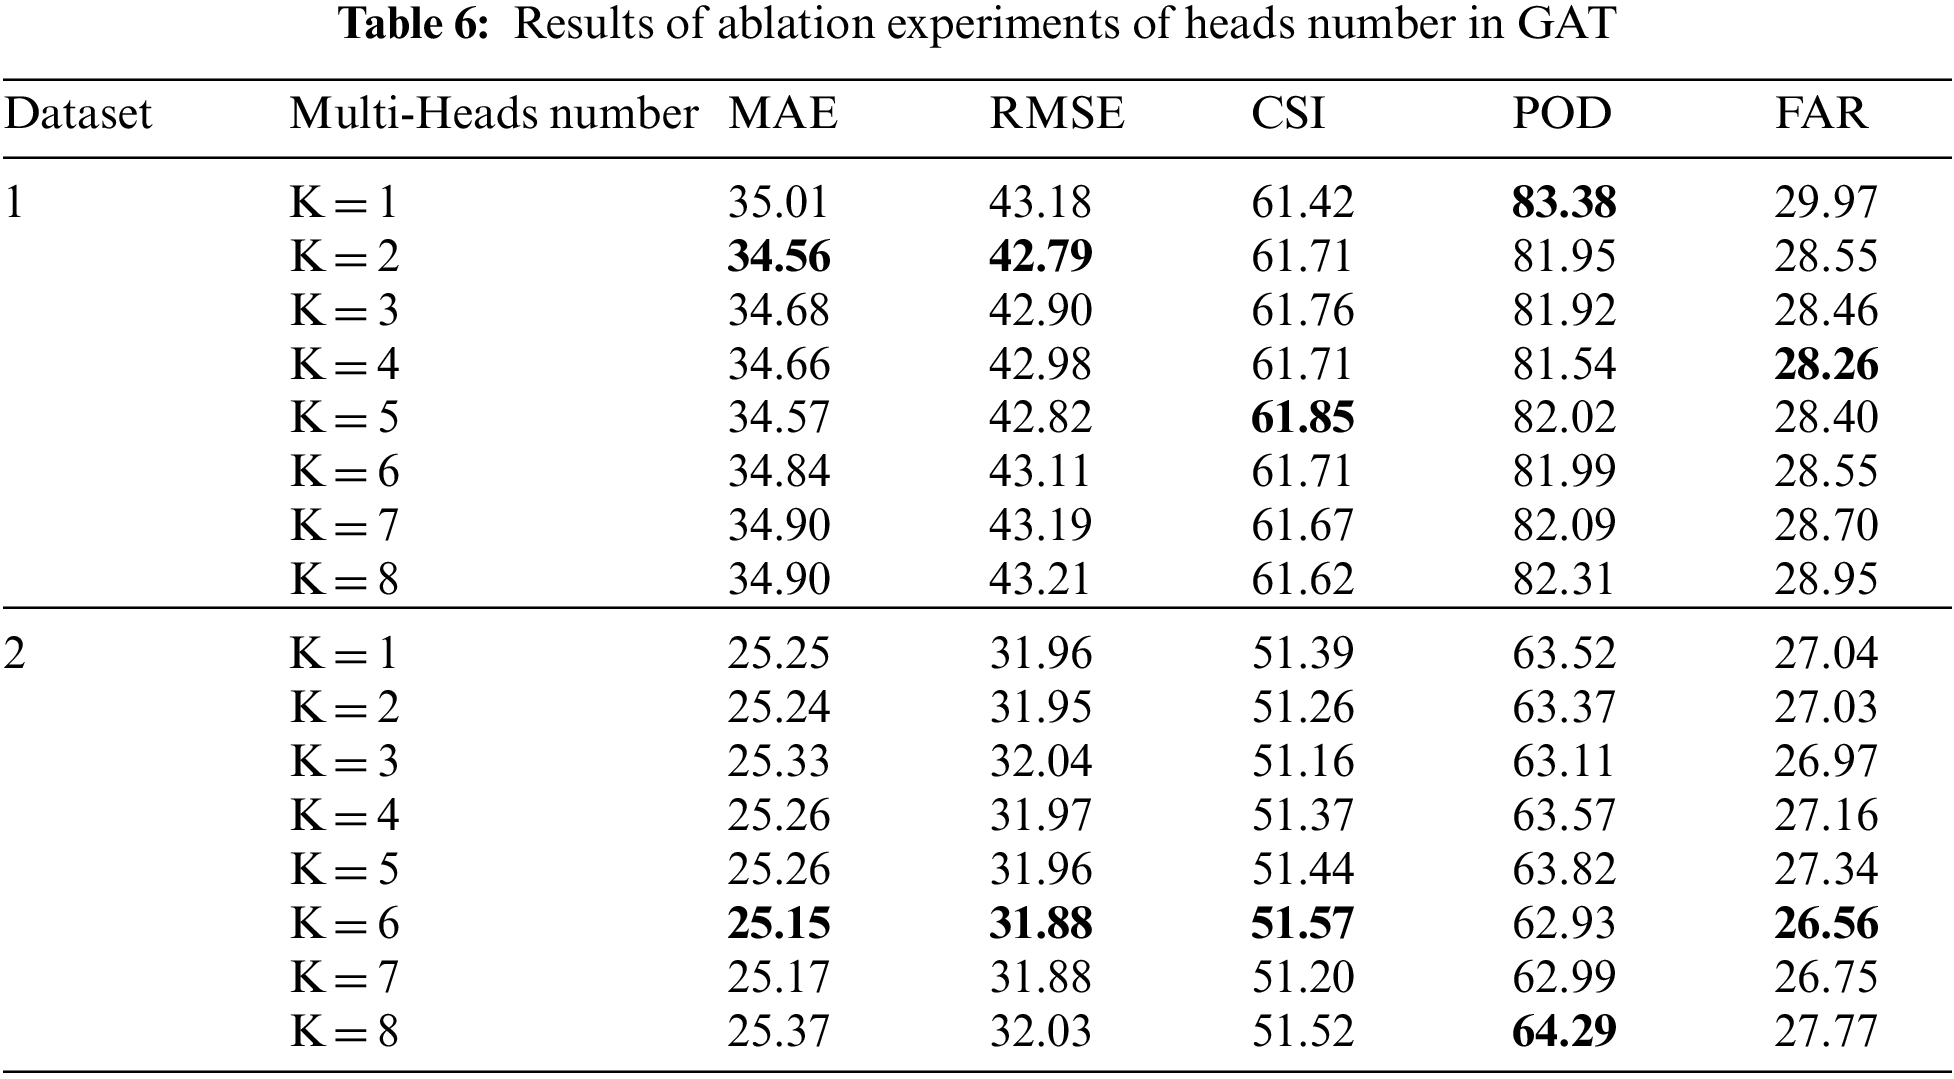
Experiment 3: multi-head attention mechanism. Tab. 6 shows the experimental results of ablation for the multi-head attention mechanism. In the spatiotemporal prediction problem, we mainly consider two indicators, MAE and RMSE. As can be seen from the table, the best prediction results on Dataset 1 and Dataset 2 can be obtained when the numbers of multi-head attention mechanisms are 2 and 6. The results of Experiment 3 demonstrate the effectiveness of the multi-head attention mechanism.
This article proposes a new spatiotemporal modeling method GAT-GRU to achieve PM2.5 concentration prediction. GAT-GRU model integrates two deep learning methods: graph attention network and the gated recurrent unit, which can accurately and effectively model the temporal and spatial dependence of air pollution monitoring data in different cities. In addition, we also consider the influence of meteorological knowledge on PM2.5 concentration when building the model. Our model learns the temporal and spatial dependence of different cities and incorporates the meteorological attributes of different cities. The results on real-world datasets prove that the GAT-GRU model has excellent predictive performance. The method we propose can be used to predict urban air pollutants to help solve the problems caused by air pollution. In this paper, different types of meteorological features are used as a whole for the input of prediction model. There is no specific analysis for effect of different types of meteorological features on PM2.5 prediction. In the future, we will use the grpah neural network to study the effects of different types of meteorological features on PM2.5 concentration prediction to help achieve more accurate prediction results.
Funding Statement: Authors The research project is partially supported by National Natural Science Foundation of China under Grant No. 62072015, U19B2039, U1811463. National Key R&D Program of China 2018YFB1600903.
Conflicts of Interest: The authors declare that they have no conflicts of interest to report regarding the present study.
1. S. A. Weber, T. Z. Insaf, E. S. Hall, T. O. Talbot and A. K. Huff, “Assessing the impact of fine particulate matter (PM2.5) on respiratorycardiovascular chronic diseases in the New York city metropolitan area using hierarchical Bayesian model estimates,” Environmental Research, vol. 151, pp. 399–409, 2016. [Google Scholar]
2. C. A. Pope and D. W. Dockery, “Air pollution and life expectancy in China and beyond,” in Proceedings of the National Academy of Sciences, vol. 110, no. 32, pp. 12861–12862, 2013. [Google Scholar]
3. D. Younan, X. H. Wang, R. Casanova, R. Barnard, S. A. Gaussoin et al., “PM2.5 associated with gray matter atrophy reflecting increased Alzheimer risk in older women,” Neurology, vol. 96, no. 8, pp. e1190–e1201, 2021. [Google Scholar]
4. S. Hochreiter and J. Schmidhuber, “Long short-term memory,” Neural Computation, vol. 9, no. 8, pp. 1735–1780, 1997. [Google Scholar]
5. X. D. Liu, Q. Liu, Y. Y. Zou and G. Z. Wang, “A Self-organizing lstm-based approach to PM2.5 forecast,” in Int. Conf. on Cloud Computing and Security, Springer, Cham, pp. 683–693, 2018. [Google Scholar]
6. Y. T. Tsai, Y. R. Zeng and Y. S. Chang, “Air pollution forecasting using rnn with lstm,” in IEEE 16th Intl Conf on Dependable, Autonomic and Secure Computing, 16th Intl Conf on Pervasive Intelligence and Computing, 4th Intl Conf on Big Data Intelligence and Computing and Cyber Science and Technology Congress (DASC/PiCom/DataCom/CyberSciTech), Athens, Greece, pp. 1074–1079, 2018. [Google Scholar]
7. T. Li, M. Hua and X. Wu, “A hybrid cnn-lstm model for forecasting particulate matter (PM2.5),” IEEE Access, vol. 8, pp. 26933–26940, 2020. [Google Scholar]
8. C. J. Huang and P. H. Kuo, “A deep cnn-lstm model for particulate matter (PM2.5) forecasting in smart cities,” Sensors, vol. 7, pp. 2220, 2018. [Google Scholar]
9. S. Z. Li, G. Xie, J. C. Ren, L. Guo, Y. Y. Yang et al., “Urban PM2.5 concentration prediction via attention-based cnn–lstm,” Applied Sciences, vol. 10, no. 6, pp. 1953, 2020. [Google Scholar]
10. P. Veličković, G. Cucurull, A. Casanova, A. Romero, P. Liò et al., “Graph attention networks,” in Int. Conf. on Learning Representations(ICLR), Vancouver, Canada, 2018. [Google Scholar]
11. R. Dey and F. M. Salem, “Gate-variants of gated recurrent unit (GRU) neural networks,” in IEEE 60th Int. Midwest Symp. on Circuits and Systems (MWSCAS), Boston, USA, pp. 1597–1600, 2017. [Google Scholar]
12. X. R. Shao and C. S. Kim, “Accurate multi-site daily-ahead multi-step pm2.5 concentrations forecasting using space-shared cnn-lstm,” Computers, Materials & Continua, vol. 70, no. 3, pp. 5143–5160, 2022. [Google Scholar]
13. W. Fang, F. H. Zhang, V. S. Sheng and Y. W. Ding, “A method for improving cnn-based image recognition using DCGAN,” Computers, Materials & Continua, vol. 57, no. 1, pp. 167–178, 2018. [Google Scholar]
14. X. R. Zhang, W. F. Zhang, W. Sun, X. M. Sun and S. K. Jha, “A robust 3-D medical watermarking based on wavelet transform for data protection,” Computer Systems Science & Engineering, vol. 41, no. 3, pp. 1043–1056, 2022. [Google Scholar]
15. X. R. Zhang, X. Sun, X. M. Sun, W. Sun and S. K. Jha, “Robust reversible audio watermarking scheme for telemedicine and privacy protection,” Computers, Materials & Continua, vol. 71, no. 2, pp. 3035–3050, 2022. [Google Scholar]
16. D. Qin, J. Yu, G. Zou, R. Yong, Q. Zhao et al., “A novel combined prediction scheme based on cnn and lstm for urban PM2.5 concentration,” IEEE Access, vol. 7, pp. 20050–20059, 2019. [Google Scholar]
17. U. Pak, J. Ma, U. Ryu, K. Ryom, U. Juhyok et al., “Deep learning-based PM2.5 prediction considering the spatiotemporal correlations: A case study of Beijing, China,” Science of the Total Environment, vol. 699, pp. 133561, 2020. [Google Scholar]
18. W. Fang, L. Pang, W. Yi and V. S. Sheng, “AttEF: Convolutional lstm encoder-forecaster with attention module for precipitation nowcasting,” Intelligent Automation & Soft Computing, vol. 30, no. 2, pp. 453–466, 2021. [Google Scholar]
19. Z. Wu, S. Pan, F. Chen, G. Long, C. Zhang et al., “A comprehensive survey on graph neural networks,” IEEE Transactions on Neural Networks and Learning Systems, vol. 32, no. 1, pp. 4–24, 2021. [Google Scholar]
20. S. Wang, Y. R. Li, J. Zhang, Q. Y. Meng, L. W. Meng et al., “PM2.5-GNN: A domain knowledge enhanced graph neural network for PM2.5 forecasting,” in Proc. of the 28th Int. Conf. on Advances in Geographic Information Systems, Seattle, USA, pp. 163–166, 2020. [Google Scholar]
21. X. Gao and W. D. Li, “A Graph-based lstm model for PM2.5 forecasting,” Atmospheric Pollution Research, vol. 12, no. 9, pp. 101150, 2021. [Google Scholar]
22. J. H. Xu, L. Chen, M. Q. Lv, C. Q. Zhan, S. J. Chen et al., “HighAir: A hierarchical graph neural network-based air quality forecasting method,” arXiv preprint arXiv: 2101.04264, 2021. [Google Scholar]
23. Y. L. Qi, Q. Li, H. Karimian and D. Liu, “A hybrid model for spatiotemporal forecasting of PM2.5 based on graph convolutional neural network and long short-term memory,” Science of the Total Environment, vol. 664, pp. 1–10, 2019. [Google Scholar]
24. W. Fang, F. H. Zhang, V. S. Sheng and Y. W. Ding, “SCENT: A new precipitation nowcasting method based on sparse correspondence and deep neural network,” Neurocomputing, vol. 448, pp. 10–20, 2021. [Google Scholar]
25. S. B. Huang, B. X. Li and W. Q. Wang, “A preliminary study on the correlation between PM2. 5 concentration and meteorological conditions in jinan,” Journal of Marine Meteorology, vol. 40, pp. 90–97, 2020. [Google Scholar]
26. C. Zhang, X. Pan, H. Li, A. Gardiner, I. Sargent, J. Hare et al., “A hybrid mlp-cnn classifier for very fine resolution remotely sensed image classification,” Isprs Journal of Photogrammetry & Remote Sensing, vol. 140, pp. 133–144, 2018. [Google Scholar]
 | This work is licensed under a Creative Commons Attribution 4.0 International License, which permits unrestricted use, distribution, and reproduction in any medium, provided the original work is properly cited. |