DOI:10.32604/cmc.2022.028504
| Computers, Materials & Continua DOI:10.32604/cmc.2022.028504 | |
| Article |
Rice Disease Diagnosis System (RDDS)
1Maturi Venkata Subba Rao (MVSR) Engineering College, Hyderabad, Telangana, India
2College of Computer and Information Sciences, Majmaah University, KSA
3Indian Institute of Technology, Indian School of Mines (ISM), Dhanbad, Jharkhand, India
*Corresponding Author: Shirina Samreen. Email: s.samreen@mu.edu.sa
Received: 11 February 2022; Accepted: 07 April 2022
Abstract: Hitherto, Rice (Oryza Sativa) has been one of the most demanding food crops in the world, cultivated in larger quantities, but loss in both quality and quantity of yield due to abiotic and biotic stresses has become a major concern. During cultivation, the crops are most prone to biotic stresses such as bacterial, viral, fungal diseases and pests. These stresses can drastically damage the crop. Lately and erroneously recognized crop diseases can increase fertilizers costs and major yield loss which results in high financial loss and adverse impact on nation’s economy. The proven methods of molecular biology can provide accurate detection of pathogenic factors, but these methods are not accessible to the majority of the farmers, needs high costs or resources, and require domain knowledge to implement. Expert’s field inspection report provides precise crop diagnosis but continuous field inspection over the remotely placed agriculture fields is not feasible. Therefore, cost effective approach for early detection of diseases can help farmers to take necessary steps in time to boost up the crop production. Precision agriculture makes use of decision support systems built using Machine Learning (ML) or Deep Learning (DL) approaches to cut down heavy costs. Timely crop diagnosis process can be automated with the involvement of Computer Vision, Image Processing and Deep Learning (DL) based methods for more precise prediction in less cost and time. Latest research shows that more accurate image classification can be implemented using Deep Learning based Convolutional Neural Network (CNN) model. In this paper, we have proposed an automated Rice Disease Diagnosis System (RDDS) for timely, more accurate and detailed crop disease diagnosis, which consisting of two modules, they are Leaf Disease Identification (LDI) module for disease detection and Infection Intensity Estimation (IIE) module for disease severity analysis. The LDI module is based on the proposed novel RDD_CNN model that classified the eight most harmful and commonly occurring diseases, it has obtained the best test accuracy of 98.47% when compared to its first three versions. And the IIE module is designed for estimating identified disease’s intensity in terms of extent and stage of infection providing detailed and overall diagnosis report specially designed for Brown Spot disease.
Keywords: Rice; disease detection; CNN; Machine Learning; Deep Learning; image processing
For the past few decades, rice has become a significant requirement being the basic food item consumed by majority people all over the world [1]. The countries like India, Pakistan, Thailand, United States etc., are well known for exporting the rice worldwide. Further production efficiency is the most essential factor of cultivation process. The crop period of rice cultivation on an average basis is 105 to150 days right from the stage of seeds till the harvesting of the crop, during this time crops are susceptible to several diseases due to seasonal changes and other environmental effects which affect the quality and quantity of the yield. Rice diseases such as Tungro, Bacterial Blight, Neck Blast, Hispa, Brown Spot, Blast, False Smut and Stemborer are potentially harmful and commonly occurring diseases which can cause severe loss to the yield of the rice crop [2,3]. Manual diagnosis of rapidly spreading leaf diseases is toughest task for the rice cultivation done over vast extent of land covering several acres within the short span of time. The similar appearance of some diseases with minute variations can lead to confusion while diagnosing them manually without expert analysis. Further, if wrongly treated by mistake using some other pesticide can lead to a huge loss as the infected disease spreads which cannot be restricted by the pesticide applied and the wrong treatment done inadvertence can lead to wastage of manpower and cost invested in pesticides for a farmer. Therefore, early and accurate disease identification can help to provide timely treatment to avoid unexpected yield loss of the crop and famines [4]. To secure food production in future, there is a demand for perfect detection mechanism of the disease to evaluate the intensity or the severity of the effected disease providing more comprehensive report which is helpful to treat the crop accordingly in time and to arrest further spread of contagious infection. Thus, such preventive measures adopted, and timely appropriate action taken can save farmers and their hopes which in turn result with substantial growth in productivity [5–7]. There are various pathogens of rice which give rise to bacterial, fungal and viral diseases. These can potentially harm various parts of the plant. Fair detection of diseases based on accurate recognition of symptoms promptly has become a demanding task [3]. There are several pests/diseases with which rice crops are infected. We have considered the eight most notorious and harmful diseases in this paper, which are depicted in Fig. 1. Among the considered eight rice diseases, Brown spot (BS), Blast (BL), False Smut (FS), Neck Blast (NB) fall under fungal disease category of rice, whereas Stemborer (SB) and Hispa (HP) are caused due to pest attack. BS infects leaves with numerous large-sized spots that can eventually kill the entire leaf. When its infection spreads to seeds as a result unfilled grains are formed. NB Lesions are formed on neck that appears grayish brown. It makes the neck and panicle to fall and if occurs prior to milky phase then grains are not formed otherwise if it occurs at later stage then grains formed are of deprived quality. FS causes reduction of grain weight and seed germination. It transforms grain into an accumulation of orange spore balls at the start and later developed into a mass that is greenish black. SBs can attack and damage rice plants at any phase of the plant starting from its seedling phase to its maturity phase. They exist in six different species causing yield loss up to 20% in early-planted crops and can cause complete damage up to 100% when it is severe. Rice HP is a pest that scratches the top layer of the leaves till they are left out with only inner epidermis. It then tunnels all the way through leaf tissues. When it reaches severe stage, plants turn out to be less energetic and can result in around 20% yield loss. Thus, to make sure about HP damage one must inspect for its presence and check for long clear feeding scratches that appears as white streaks. Tungro (TG) is caused by a virus which is spread by green leaf hopper. It affects the plant with impaired growth with reduced tillers and appears from yellow to orange discoloration in leaves. Bacterial Blight (BB) disease is due to bacterial ooze on the leaves, which initially starts at leaf tips, next it spreads to margin and then infects major area of the leaf appearing as light grayish lesions resulting in entire seedlings to dried out and die [8]. The main contributions of our research work are as follows:
• The proposed system incorporates two important tasks of rice crop improvement i.e., disease detection and its intensity estimation.
• Proposed RDD_CNN model has classified 8 most common harmful diseases with 98.47% test accuracy.
• Image processing filters are designed to estimate total infection extent.
• Disease pixels related to initial and final stages are segmented and calculated.
• Infection Intensity Stage is determined based on the percentage of total infection extent and stage specific disease pixels.
• For each identified disease leaf, a comprehensive diagnosis report is generated.
• Further farmer can decide which and how much fertilizers or pesticides are to be given based on the precise information of disease i.e., type of disease and its stage or severity level, provided by the proposed RDDS.
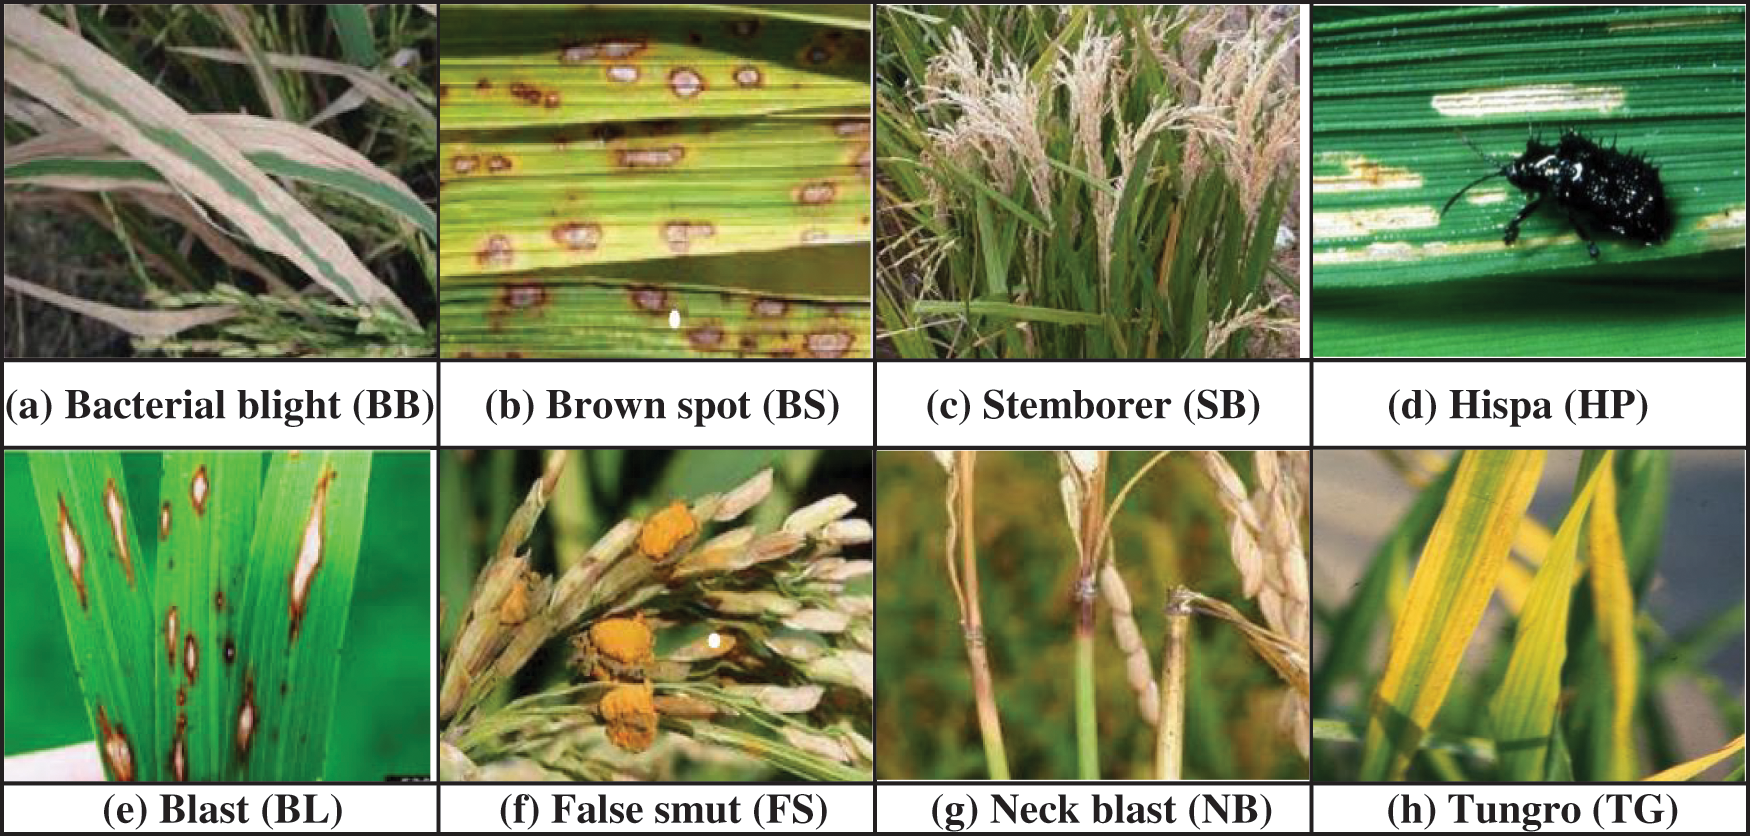
Figure 1: Some of the harmful rice pathogen
Continuously every aspect of the growing crop can be closely monitored by capturing and processing the images of plants to figure out any abnormal changes in the crop from time to time along with some other sensing data [9–11]. Researchers worked in various methods typically on rice diseases to diagnose automatically based on the captured crop images such as the technique based on pattern recognition [12], Support Vector Machine (SVM) approaches [13,14], solutions based on image processing [15–18] and computer vision [19] for improving the diagnosis accuracy in a reduced time eliminating tedious manual rice field inspection. Automated deep transfer learning based on the Shuffle Net and SVM classification model is designed especially for Panicle Blast by the authors in the paper [20]. Developing an automated mechanism to identify accurately the infected leaf disease from the rice plant images is toughest task due to difficulty in segmentation of symptoms related leaf area, varied capturing conditions and similarity in symptoms of different diseases. Faster R-CNN based deep learning model is implemented for classifying 3 classes of disease such as blast, hispa and brown spot [21]. In the paper [22], 5932 images that are captured from the field are considered for a pre-trained CNN model which is a combination of ResNet 50 and SVM to classify four different classes of diseases. The authors of paper [23] collected images from the fields, but the size of dataset is too small so, they have employed Visual Geometry Group-16 (VGG-16) transfer learning model to classify three classes of diseased leaf images of rice plant, which resulted in 92.4% of test accuracy. The captured images from the rice field may contain blurred edges, noise or background area may be larger, due to these problems accuracy may fall. To address these issues, (Fuzzy C-means with K-means) FCM-KM combined with Faster R-CNN formulated model is developed, which classified three classes of diseases with an overall accuracy of 97% [24]. Another Faster R-CNN based model is designed specifically for false smut grain disease, which comprises of generation of regional proposal and object identification. But this detector mechanism has shown with little ineffectual detection and reasons behind them are: more number of proposals made for an object location, mismatch between anchor and proposal shape and finally, availability of multiple anchors per object location [25]. Authors in paper [26], created their own dataset by capturing real images from rice fields, which are pre-processed to eliminate background from the whole leaf image. Next, disease and normal regions were clustered and proposed a novel Jaya algorithm based on optimized Deep NN, which is used to classify four classes of diseases with an average accuracy of 94%. Classifying eight classes of diseases and pests, CNN model achieved 94.3% mean accuracy, on training in two stages. The same dataset was classified using a fine-tuned VGG-16 model resulting in 97.1% mean accuracy [2]. Decision Tree approach after applying ten-fold cross-validation achieved 97% accuracy on test dataset among the other ML approaches to classify the three common classes of diseases but the dataset considered is too small [27]. 3 classes of disease infected images were segmented with Otsu’s method. After segmentation, different kinds of features were extracted using Histogram of Oriented Gradients (HOG) and further classified using SVM and obtained 94.6% accuracy when polynomial function considered as a kernel [28]. An automatic disease identification system is designed based on computer vision for two classes of diseases, which involves extraction of color moments, leaf area and textual descriptors from both non-diseased leaf and diseased leaf images to come up with a 21-Dimensional vector. Consequently, genetic algorithm is employed to reduce complexity and producing a feature vector with compact dimensions i.e., 14-Dimensional vector and then classified applying SVM & ANN separately. SVM model has exhibited 92.5% accuracy whereas ANN has exhibited 87.5% accuracy [29]. About 200 diseased panicle images including a healthy class were classified in two-stages, primary stage was segmenting rice panicles from input images using Faster R-CNN and then in secondary stage, classification was done by 3 pretrained models among which the VGG-16 model has shown highest validation accuracy percentage that is 88.11 [30]. An application developed based on CNN model, trained on preprocessed images has shown 90.9% detection accuracy on training set [31]. Twelve classes of disease infected images and a healthy class were captured from various rice fields in Bangladesh. The dataset including 16770 images was constructed by preprocessing and augmenting the collected images, employed depth-wise-separable convolutional methodology for classification which has shown 96.3% test accuracy [32]. Recent studies on image classification have shown that, Deep Learning based CNN provides enhanced accuracy even when the given leaf image contains blurred leaf boundaries, noise and large or disease lesions colored background area whereas conventional image processing and ML methods needs more complex pre-processing to reduce the noise of the inputted noisy field images and, they work better only for small datasets. We have analyzed various solutions proposed by authors from [20] to [32], it is observed that accuracy of disease prediction is highly varied based on the factors such as, which and how many classes of diseases are considered, image capturing conditions, size of dataset, and ML/DL method employed for designing prediction model. Majority of the papers have not covered most of the catastrophic diseases for classification. Eleven and eight different classes of diseases are considered by [32] and [2] respectively but Tungro is missed out by both the papers, which is a most destructive and damaging rice disease commonly found in southeast and south Asia. In worst case, when it is infected at the early growing stage, there can be total 100% loss in the crop yield [8]. All the authors from [20] to [32], have reported the disease(s) identified from the images of rice plant but merely, disease identification does not give a clear picture of the current stage of the disease which is essential to the farmer to take up stage specific measures for disease control [33,34]. Hence there is a need for a system that provides classification with an improved test accuracy while covering the most harmful and commonly infectious diseases and provides with more detailed report of disease diagnosis such as its infected extent and infection stage so, that the farmer is available with more accurate and appropriate information to take further necessary actions to boost up the crop production.
3 Proposed Rice Disease Diagnosis System (RDDS)
An automated system called RDDS is designed to provide an effective crop disease analysis which is the most challenging and primary task of the farmer. The proposed RDD System detects the infections that are spread over the rice field. It also provides a detailed report of the disease identified which is necessary for the farmer to understand the precise stage of the disease infection. This rapid critical disease analysis in absence of expert’s advice over vast remote fields forms an important basis for the farmer to decide upon the suitable control measures to put into action to counteract spread of disease in the field. The proposed RDDS incorporates two modules, the first module is Leaf Disease Identification (LDI). It employs the proposed novel RDD_CNN model for identification of disease over leaf images that are captured from the rice fields. This module annotates the leaf images with identified disease which is then fed to next module i.e., Infection Intensity Estimation (IIE). IIE module calculates the extent and analyzes the stage of the infection and gives a detailed leaf disease diagnosis report to the farmer. The overall RDDS process is depicted in the Fig. 2.
3.1 Leaf Disease Identification (LDI) Module
The LDI module involves three steps as shown in the Fig. 2, out of these three steps third step forms the core part of the module. Initial step includes periodic capturing of leaf images over the field. The second step involves image data preprocessing, which is performed by applying resizing and rescaling techniques. Last step employs the RDD_CNN model designed for detection of the following considered eight diseases: BB, BL, BS, TG, NB, SB, FS and HP. Then each leaf image is labelled with the detected disease.
Dataset Construction
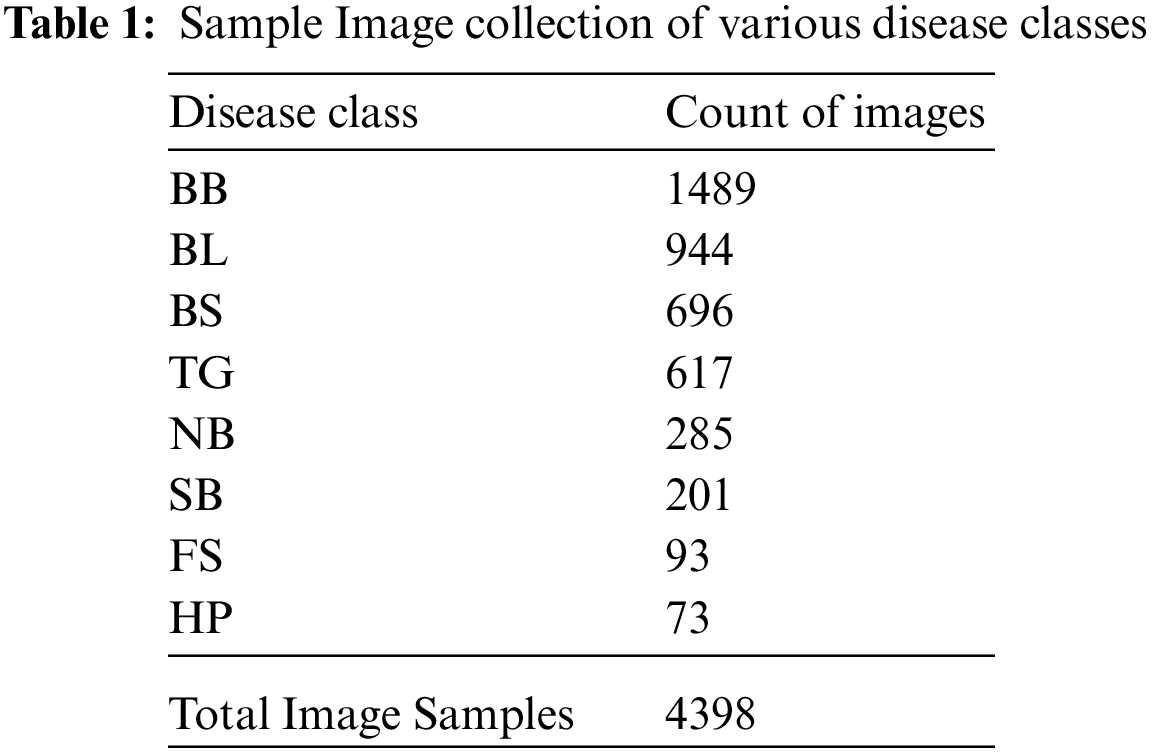
Rice crops are exposed to a variety of environmental conditions like rainfall, soil nutrition, humidity and other seasonal effects. The images of our dataset are captured directly in the rice fields in different weather conditions, seasons and lighting. We have prepared a dataset by clumping dataset from [21] for BB, BS, TG, BL classes of diseases, other dataset from [2] for SB, HP, FS, NB classes of diseases and added more images captured from the rice fields. The count of samples taken per each disease category and total count of image samples are given in Tab. 1.
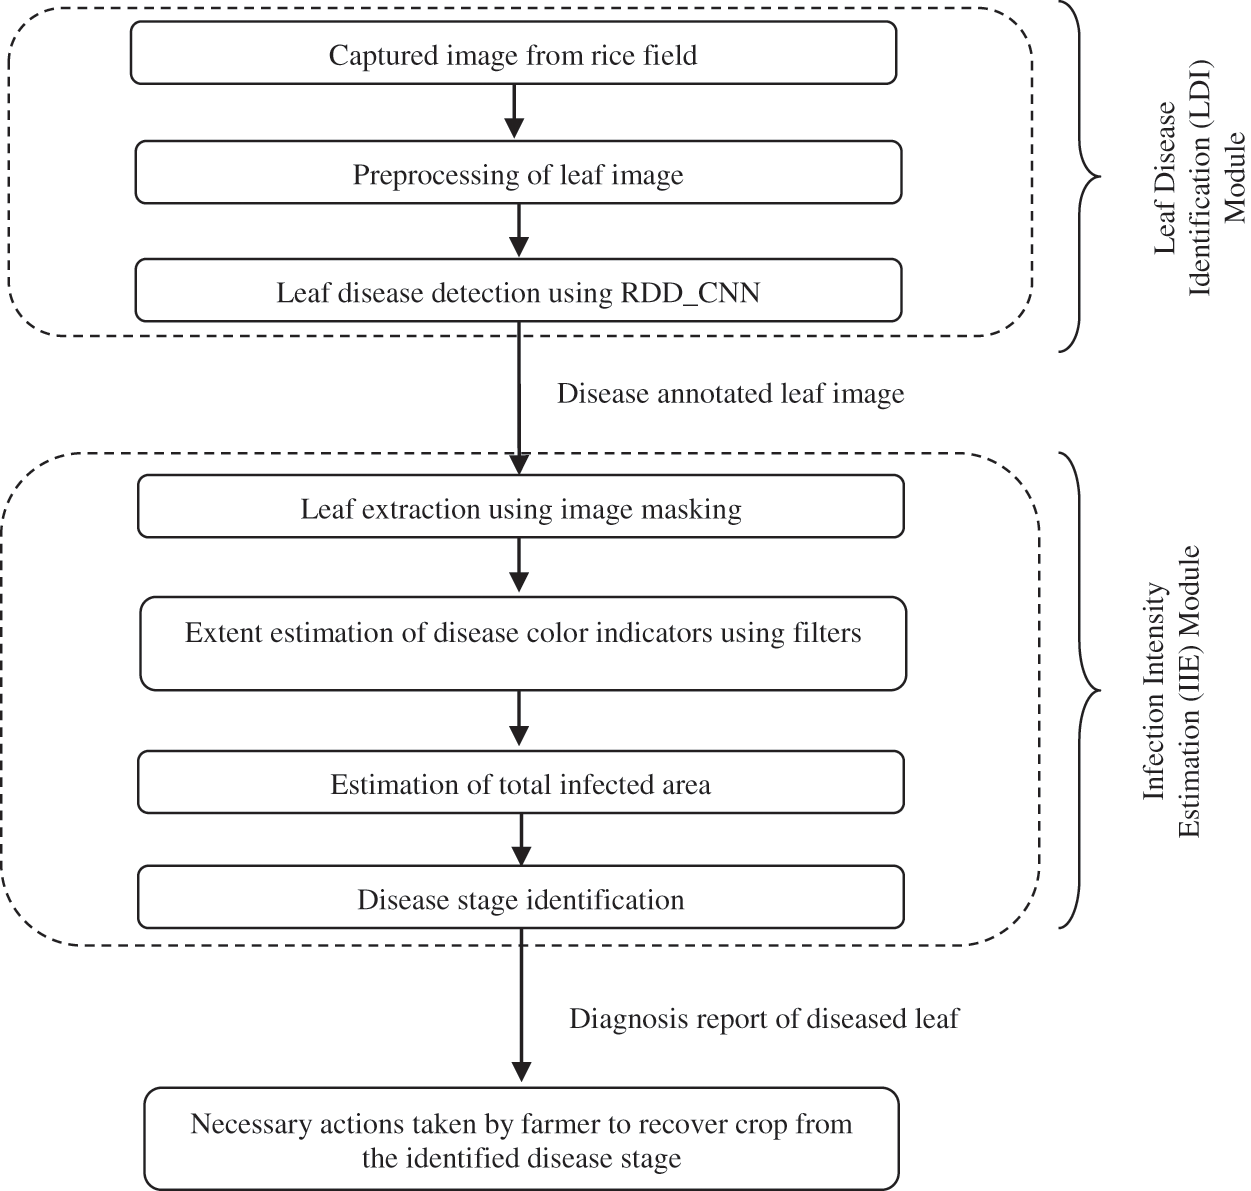
Figure 2: Modules of proposed rice disease diagnosis system
The model is designed to include 5 convolution layers and 4 max pooling layers. In the first version i.e., CNN_V1, size of each max pooling layer was set to (3, 3) which is resulted in a validation accuracy of 0.2426 and was observed that it is not being improved in further epochs. Same results were observed with (2, 2) size also. When the first 2 max pooling layers were set to size (3, 3) and next 2 layers with size (2, 2) then gradual increment in accuracy was observed during epochs. It has been observed from most of the prominent models that non-trainable parameters are made to 0. Removal of batch normalization (BN) in our model has fulfilled the requirement of 0 non-trainable parameters. We made the number of nodes for the very next dense layer after flattening equal to that of the number of output channels of the last convolution layer. Finally padding was set to “same” for all layers instead of alternating its value between same and valid. This version of our model i.e., version 2 (CNN_V2) has obtained 88% test accuracy, 85% training accuracy with 8 split stratified shuffle split under 100 epochs without BN. For this version, test and validation partitions were 0.1, 0.09 respectively. Rest of the samples were allocated for training purpose. First version of our model included both BN and drop out whereas, version 2 included only drop out without BN. It is observed that version 2 accuracy is not up to the mark and there is a need to still improve it so, we went for version 3 (CNN_V3). In version 3, it has been learnt that BN speeds up training by reducing generalization error and improves regularization and there is no additional requirement of dropout when BN is already in use but determining the correct position for BN and how many times it must be incorporated for better improvement of accuracy is a difficult task. Using BN with high learning rates (lr = 1e − 3) is preferable. When BN incorporated before soft max gave us better results. Next, we have observed that BN between convolution and max pooling layers is beneficial for our model. When BN was incorporated 5 times after every convolution layer, validation accuracy did not improve from 0.18 in epochs. Then, we have reduced the frequency of BN to 3 times. BN were applied after 1st, 3rd, and 5th conv layers.
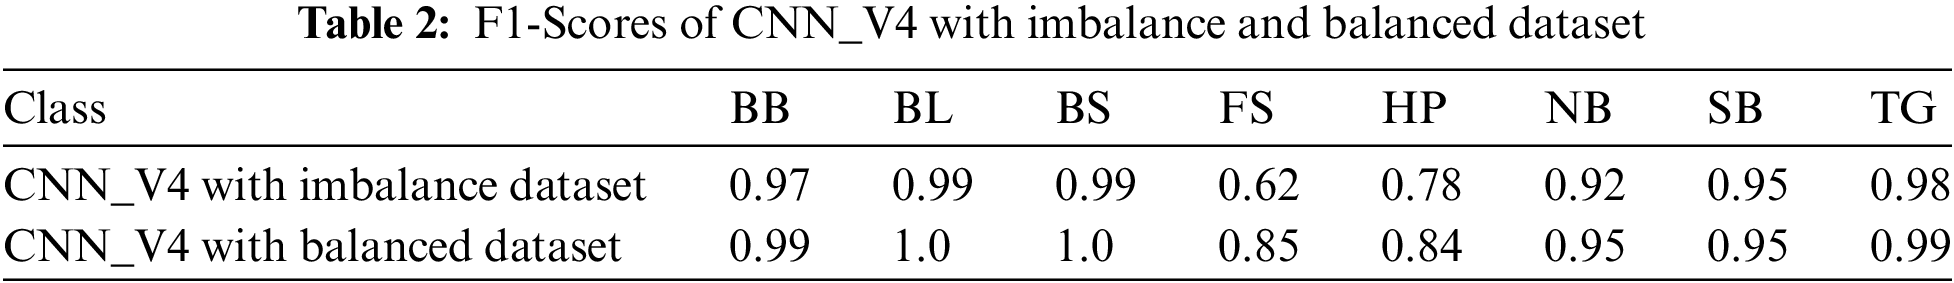
The training accuracy of the model improved to 97.3% and test accuracy reported was 95.09%. Version 3 results were achieved with 3295 images under 30 epochs with (lr = 1e − 3). In version 4, by inference of classification report of version 3 model, the dataset size was increased to 4398 images for better training of certain classes like BB, BL (probably because of similarity in features of disease pairs BB, TG and BS, BL). For classes like FS, and HP had fewer images, hence this resulted in poor F1-score. So, to handle this imbalance in the data we have applied weight balancing mechanism with following weights BB: 0.08, BL: 0.09, BS: 0.1, TG: 0.1, NB: 0.13, SB: 0.14, FS: 0.18, HP: 0.18 and noticed improvement in the F1-scores of individual classes after applying the appropriate class weights, which is shown in the Tab. 2. The test folder split was increased from 10% to 15%, then the model achieved remarkable test accuracy of 98.47%. It is observed that beyond 30 epochs there is no significant raise in the accuracy. After several attempts to fine tune the model for considered dataset, the version 4 has presented outstanding performance while the model executed over fewer epochs i.e., 30. Hence version 4 is our final version of the model named as RDD_CNN.
Data splitting procedure
The dataset folder is loaded using the drive mounting method. Image files are converted into NumPy arrays and loaded in a list. Corresponding image labels are converted to binary form by Label binarizer and loaded in a separate list. Around 15 percent of total image data were loaded into a separate test folder by permutation of total samples with random seed is set to 42. The Remaining 85% percent of data is again split into train and validation folders using stratified shuffle split where n_splits = 10 with validation split receiving 13 percent of it and remaining is left out for training data.
Data Augmentation
The performance of the model is usually dependent on the quantity of the data used. The intention behind expanding the training dataset is to have possible variations of considered images that are most likely appear to the model. Image augmentation techniques such as zoom range and rotation, width shift, height shift ranges, shear range, vertical flip and horizontal flip were applied to increase the number of samples under each disease category to enhance the performance of model training process.
Model Description
RDD_CNN Model architecture as shown in Fig. 3, is built with 5 convolution (conv) layers with 32, 64, 64*, 128, 128* filters each with Relu activation function. Four max pooling layers were inserted after each conv2D layer except between 128, 128* conv2D layers. Out of 4 layers for the first 2, pool sizes are adjusted to (3, 3) and (2, 2) for the next two pooling layers. The dimension of the last convolution layer was found to be (7, 7, 128) in the model summary. Hence, the very next dense layer with 128 nodes is introduced after flattening. The last dense layer has eight nodes which is equal to the number of classes (i.e., 8) with SoftMax activation as a final layer. BN is added after 32, 64*, 128* layers and between the last dense layer and soft max layer. Model summary displayed 1,082,200 trainable parameters and 464 non-trainable parameters. Model is compiled with Adam optimizer with decay rate equal to that of learning rate/25, learning rate equal to 1e–3 with binary cross entropy loss function. Dropout has been eliminated in our model as BN has already been used for the same purpose.
5 Calculations and Results Discussion
Validation steps and steps per epoch were calculated as follows:
We have considered the batch size of training and validation as the same i.e., batch_size = 32.
Training_total_samples = 3256, Validation_total_samples = 487.
Therefore, Steps_per_epoch = 3256/32 = 01.75~101, Validation_steps = 487/32 = 15.21~15.
Initially, the model is executed with 100 epochs without using above Eqs. (1) and (2) to calculate values for Steps_per_epoch and Validation_steps that are passed in the model.fit_generator function, both accuracies were unstable and not improved. So, when Eqs.(1) and (2) computed values are incorporated for the execution of the model using an early stopping method then both training and validation accuracies found to be improved early enough i.e., under 30 epochs. The first version i.e., CNN_V1 model is shown the worst validation accuracy of 0.24 and there is no progress noticed in the subsequent epochs. The succeeding model versions, CNN_V2, CNN_V3 and RDD_CNN have shown improvement in test accuracy when it is tuned, results of them are expressed in the Tab. 3.
The RDD_CNN has attained highest training and test accuracies of 98% and 98.47% respectively among the other model versions in a short number of epochs of 30. The training and validation accuracy and loss graphs of RDD_CNN are as shown in Figs. 4 and 5 respectively.
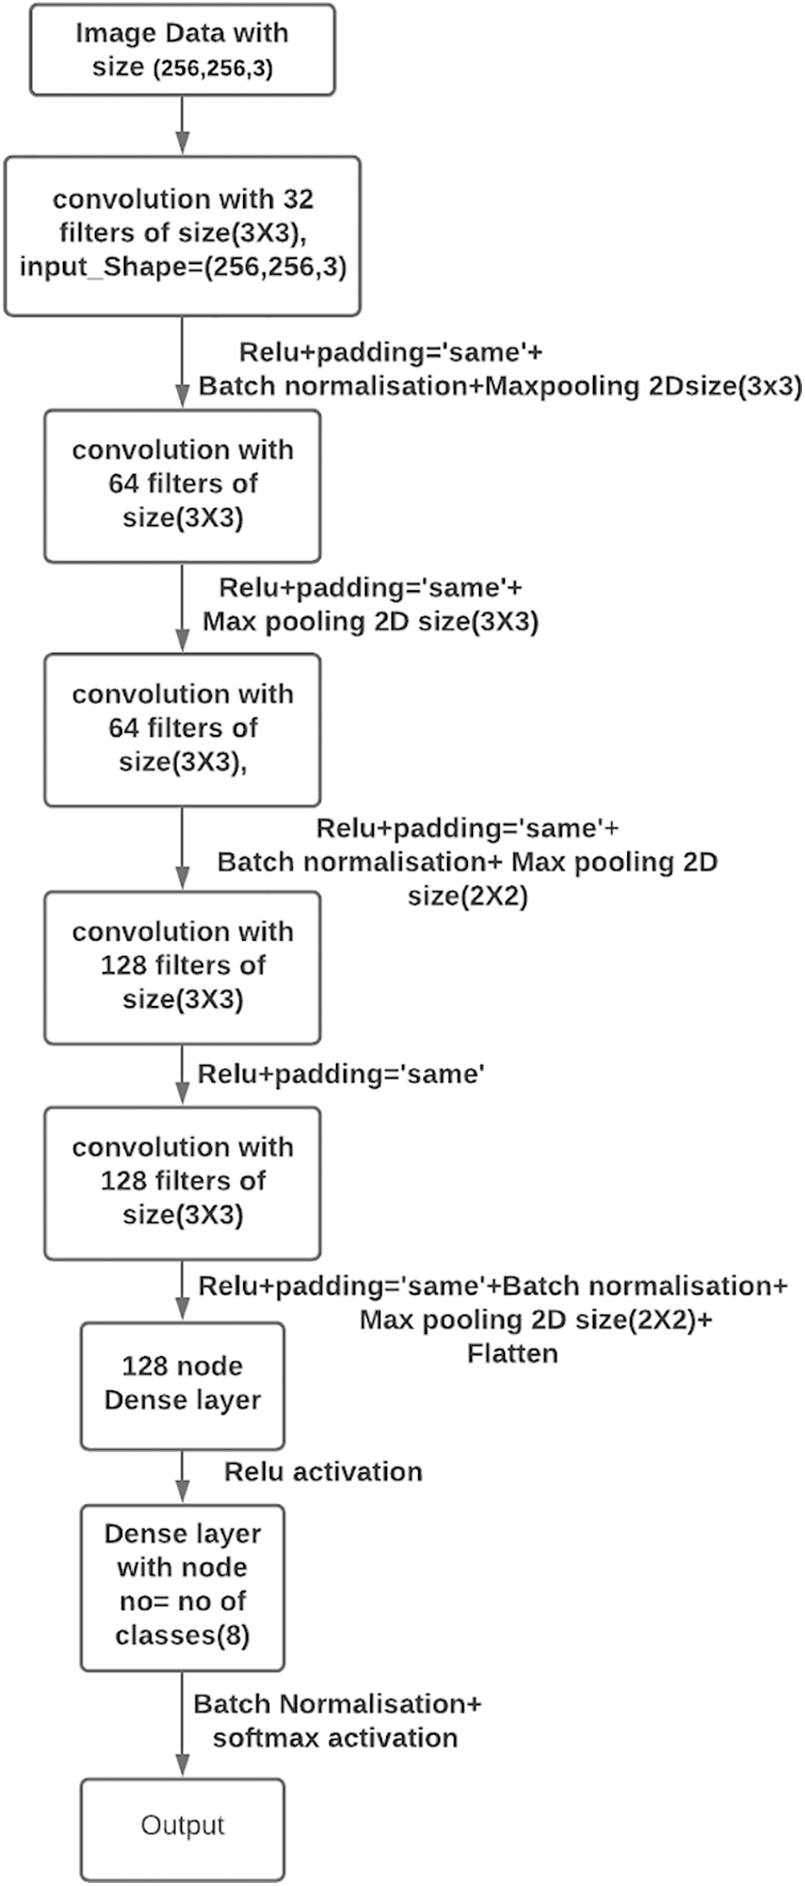
Figure 3: Proposed RDD_CNN model architecture
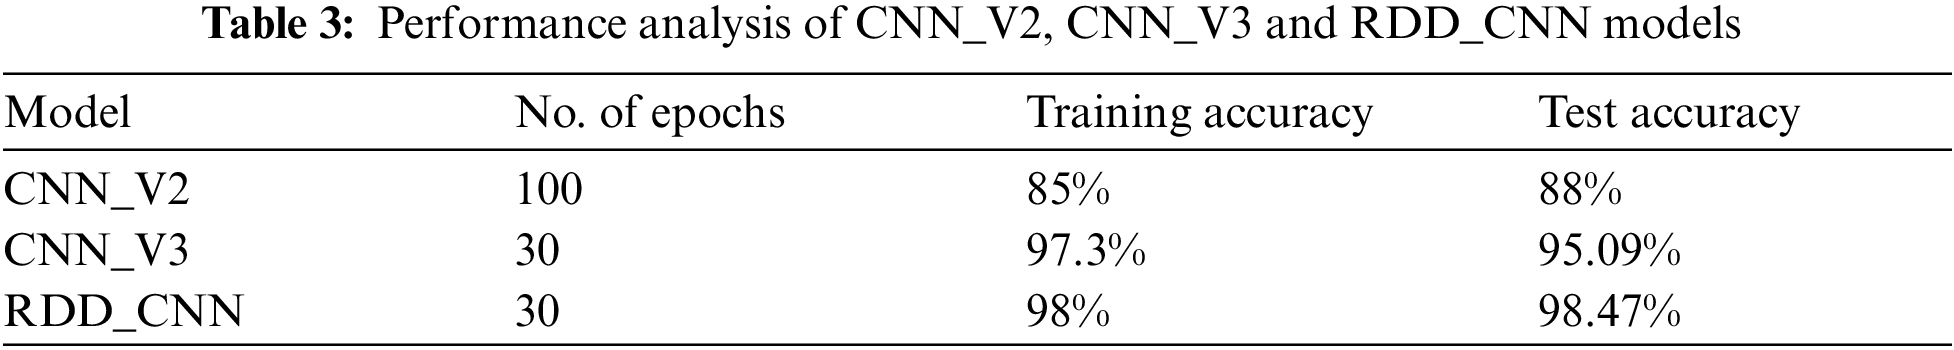
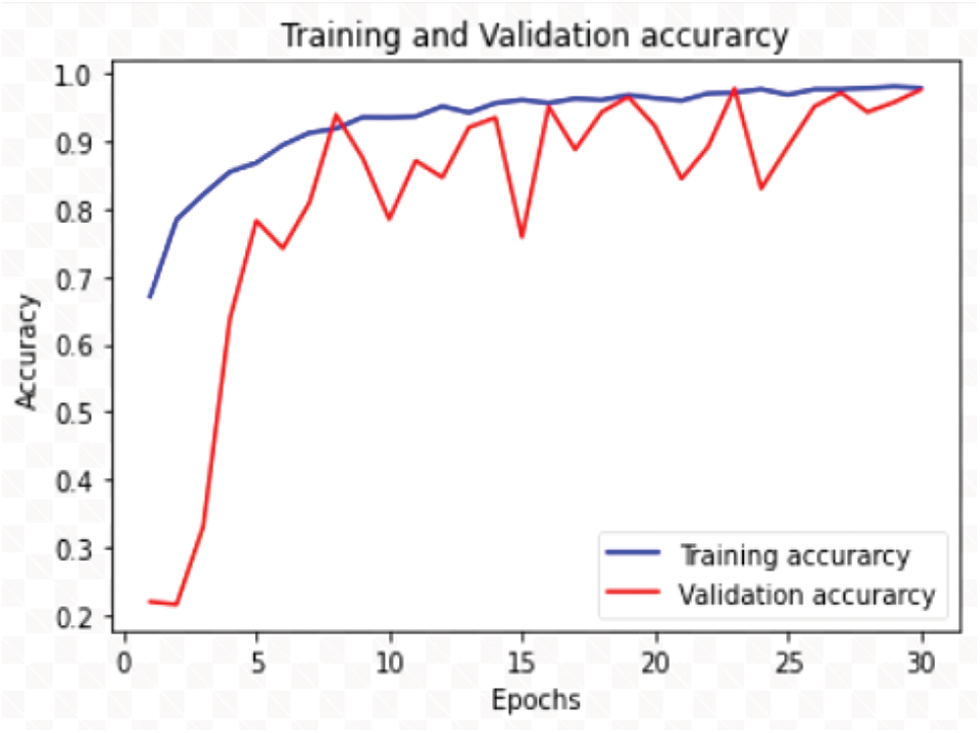
Figure 4: Training and validation accuracy graph
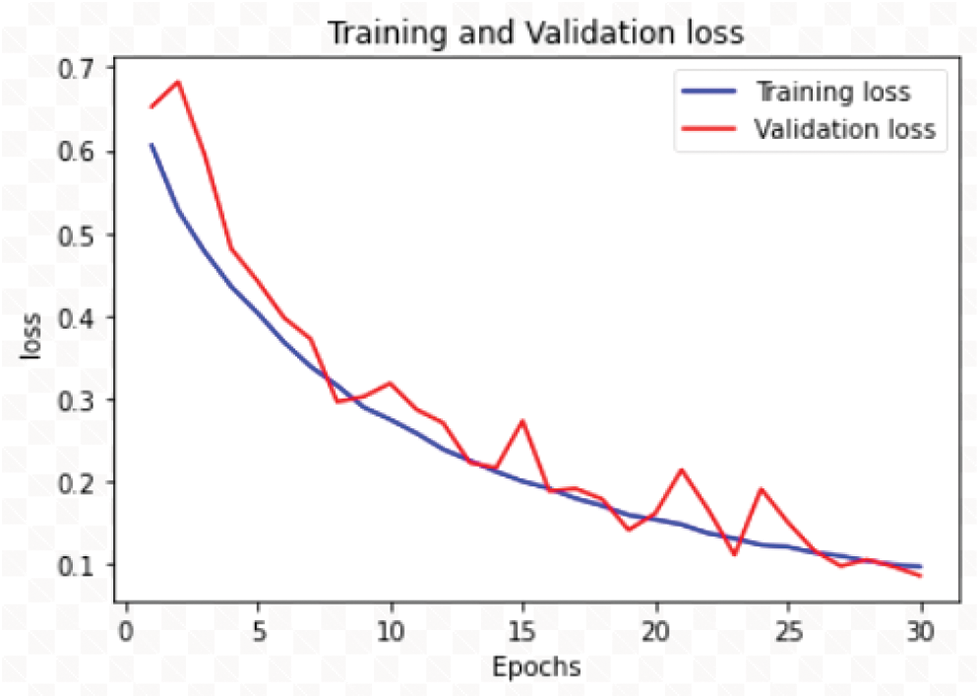
Figure 5: Training and validation loss graph
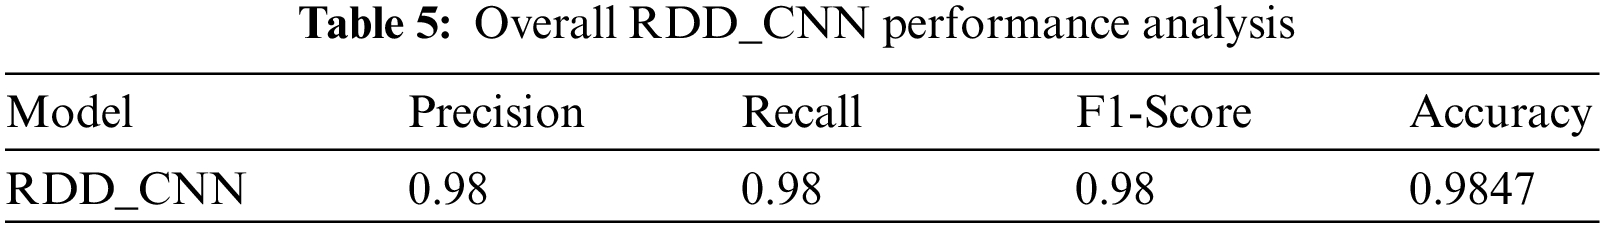
Our model accurately predicts the true disease class labels that can be observed from the test confusion matrix depicted in the Fig. 6. Tab. 4 shows performance of the proposed RDD_CNN model for the considered eight disease classes in terms of Precision, Recall, F1-Score, Sensitivity and Specificity. It is observed that, RDD_CNN outperformed as a disease classifier as Precision ranges from 0.85 to 1.00, Recall ranges from 0.80 to 1.00, F1-Score ranges from 0.84 to 1.00. Sensitivity ranges from 0.80 to 1.00 and Specificity is constantly high that is 0.99 across all the diseases classes that are depicted in Fig. 7 and 8 respectively. False Smut and Hispa results have shown substantial performance whereas other classes’ results are extraordinary. BB, BL, BS, and TG classes performance is near to 100% with respect to various metrics. The overall performance of RDD_CNN model in terms various performance metrics such as Precision, Recall, F1-Score and Test Accuracy is expressed in the Tab. 5, which shows that RDD_CNN is equally outperforming with respect to other metrics apart from accuracy. These results express the potential of RDD_CNN as rice disease classifier.
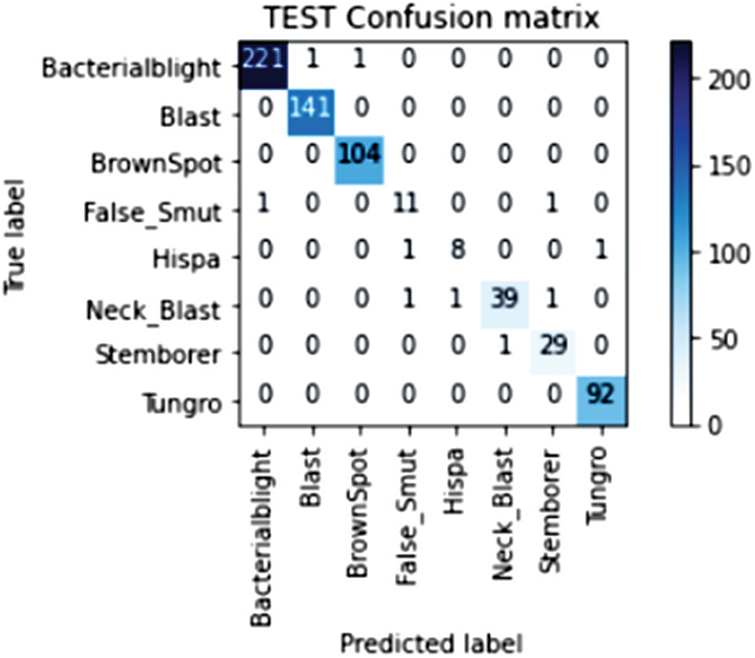
Figure 6: Confusion matrix of the test data
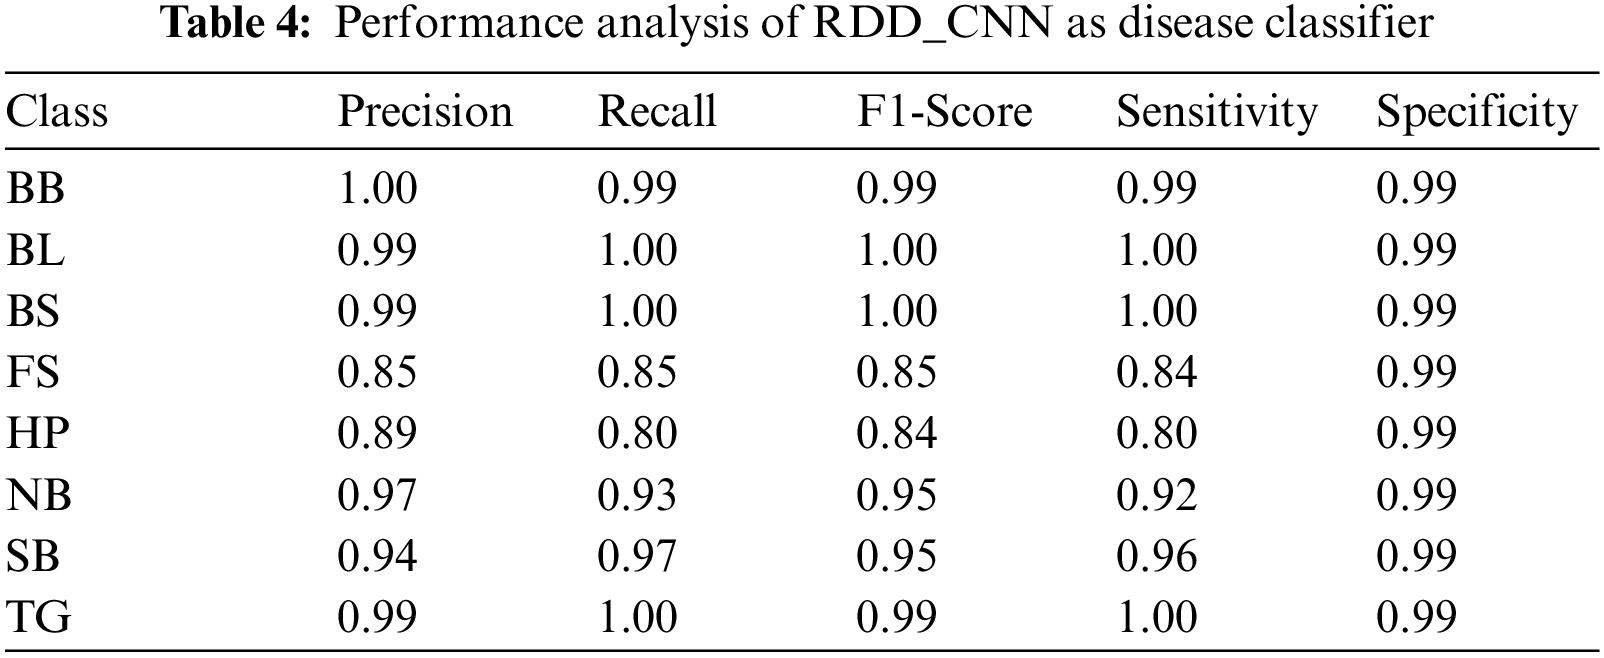
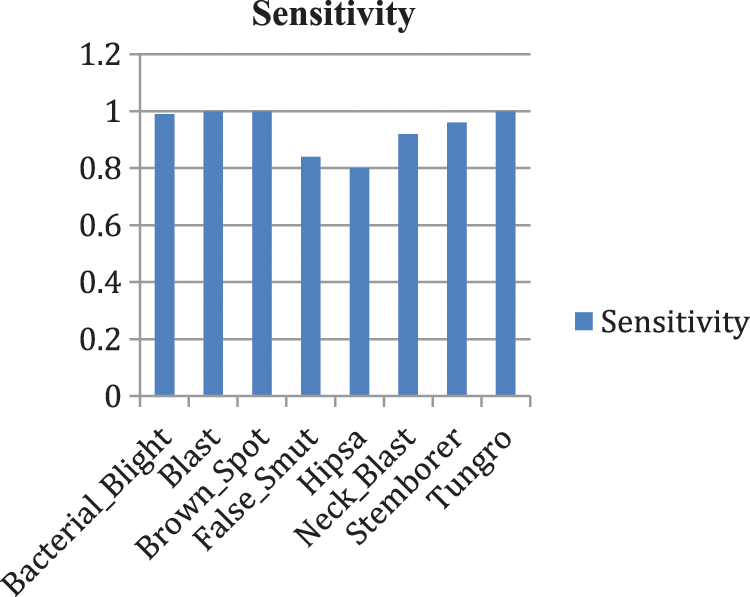
Figure 7: Sensitivity analysis of RDD_CNN
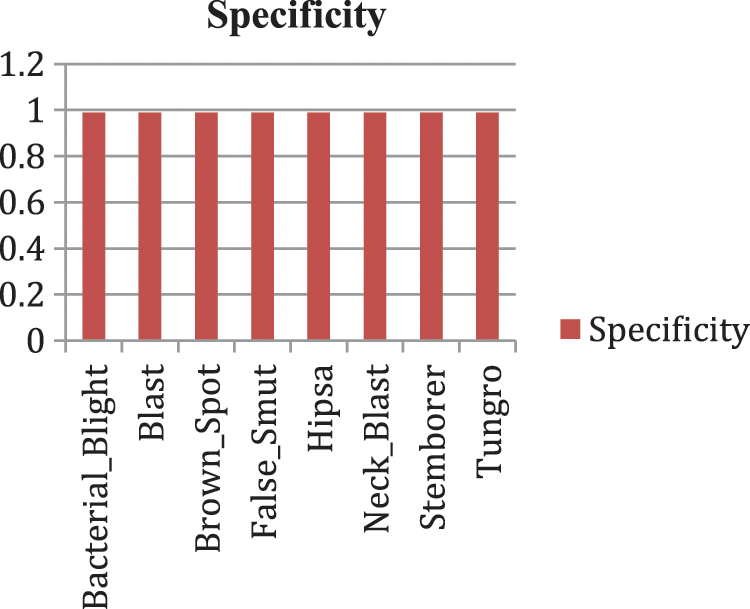
Figure 8: Specificity analysis of RDD_CNN
Disease class prediction
The Proposed RDD_CNN model is saved as the best model since it has shown the outstanding performance. Further, this saved model is used as a rice disease classifier when the user inputs images of infected rice plants captured over the field. Sample images from the test dataset are fed as input one at a time to this model. The predict_disease procedure is implemented which in turn uses predict_classes function of keras API for predicting the class label of given leaf image instance. Fig. 9 shows the predicted class as Brown spot for the input sample image.
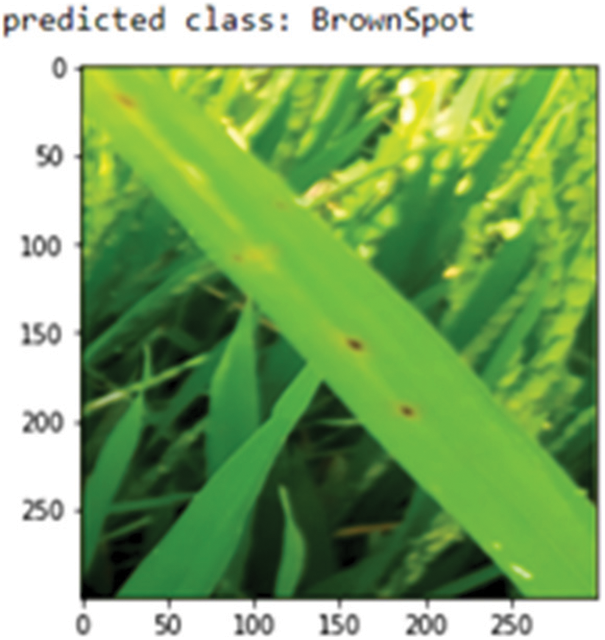
Figure 9: Class prediction of sample leaf image
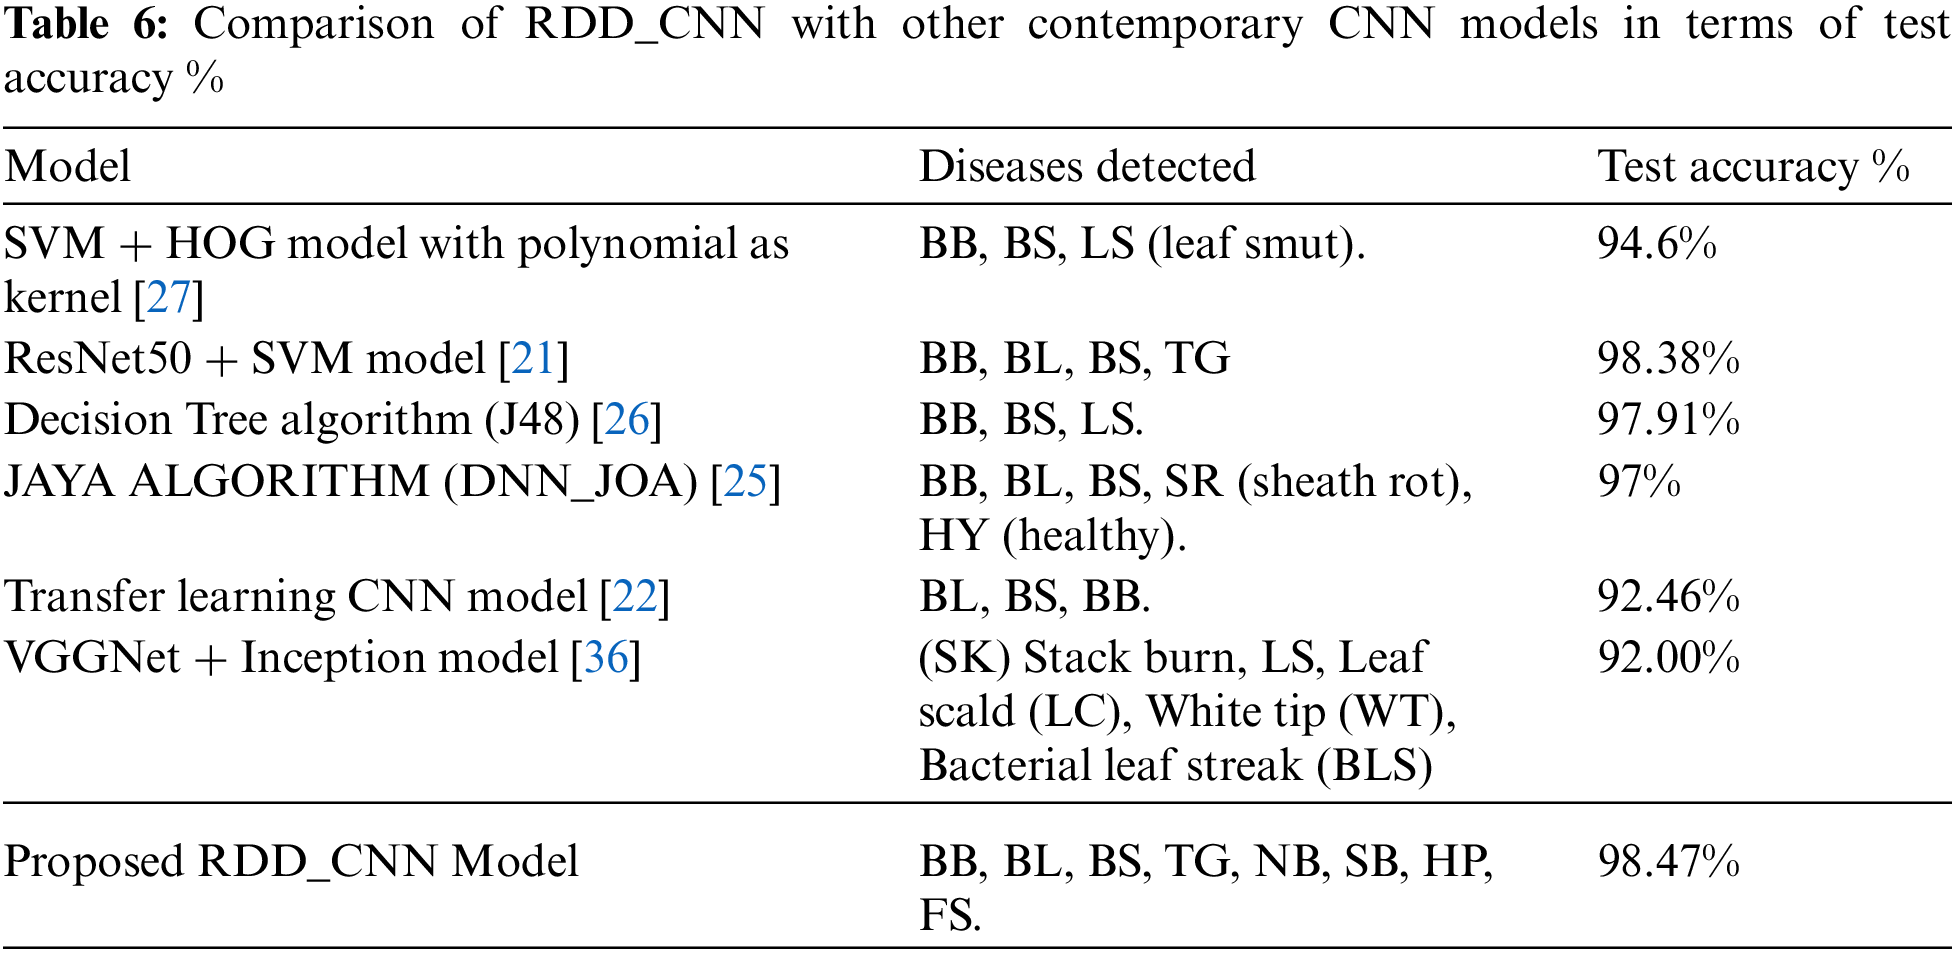
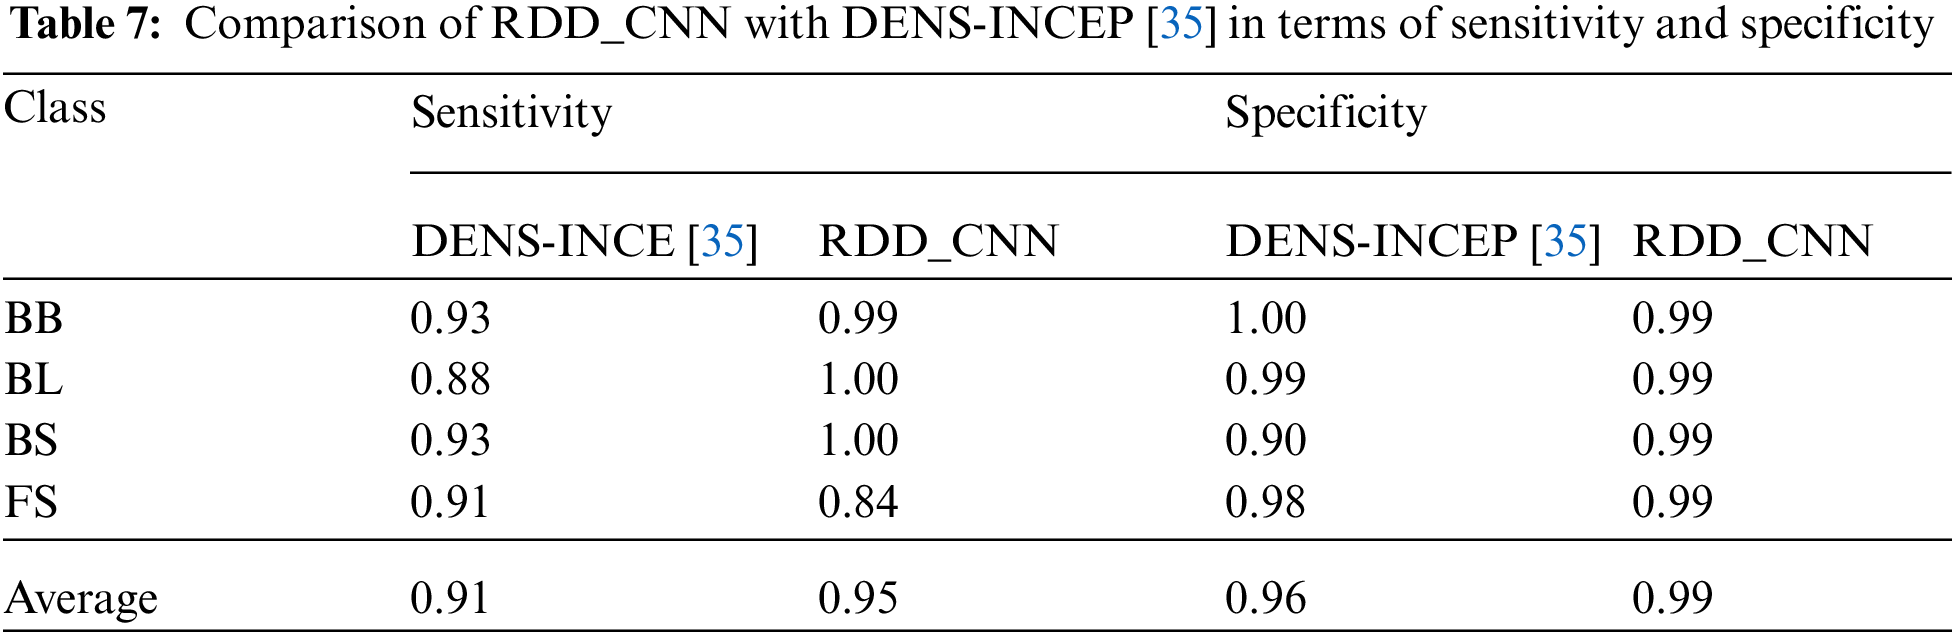
The performance evaluation of proposed RDD_CNN is performed by comparing with some of the top contemporary CNN models for the sake of reference only. Since the contemporary solutions varied with different factors such as capturing environment conditions, region of cultivation and certain specific diseases considered. Tab. 6 includes RDD_CNN with other models, disease classes detected and accuracy corresponding to each model. It is observed that proposed RDD_CNN has outperformed among other top models while detecting a greater number of harmful diseases with an improved test accuracy of 98.47%. The proposed RDD_CNN is compared with DenseNet pre-trained on ImageNet and Inception module (DENS-INCEP) [35] in terms of sensitivity and specificity that is expressed in Tab. 7, it reveals that our proposed model performs better even with other performance metrics. Moreover, our model is being trained to achieve the best performance by continuous fine tuning it over multiple versions for the rice leaf disease dataset.
6.1 Infection Intensity Estimation (IIE) Module
The proposed disease classifier for critical disease analysis is not sufficient for young farmers to come up with a clear picture of crop infection severity. Thus, the proposed RDD System provides another module called Infection Intensity Estimation (IIE), which deals with estimation of infection intensity for the inputted disease annotated leaf image. IIE module has four important steps in it as depicted in Fig. 2. The first step includes extraction of leaf area from the entire leaf image by suppressing its background area using image masking technique. The disease related color indicators are taken into consideration while estimating infected area. Next, the extent covering these color indicators is estimated by applying specially designed image filters. And then overall infected area is calculated. The last step deals with identification of disease stage based on previous two steps results producing a comprehensive diagnosis report. It estimates the infection intensity in terms of extent of infection and stage of infection. Predicted stage falls into one of the 2 important classes: initial stage and final stage. This module is especially designed for BS leaf disease as it can spread starting from the leaf to all the remaining parts of the plant, also from one plant to another causing a severe damage to the rice crop leaving farmer in a helpless situation. This module can be extended for other harmful diseases in the similar way.
6.1.1 Brown Spot (BS) Characteristics
Cochliobolus miyabeanus (or BS) is a most harmful and common fungi rice disease which has an ability to attack various parts of rice plants at any stage of its growth. Once infected, it can transmit through air and continue to remain for a few years. Hence rapid detection of BS and early treatment of diseased crops is compulsory for healthy and quality yield. BS disease symptoms first appear on leaves of rice plant and then to spread to its panicles and grains. Fungi attack influences photosynthesis and hence decreases nutrition absorption capability [37]. This disease reaches to its peek at tillering stage, in this stage it can lead to loss in health of the yield. Hence the primary requirement is to isolate severely affected leaves from leaves that are at initial disease stages. In this module, BS disease intensity stage and infection extent are estimated considering its effect on leaves. Initially symptoms on leaves appear as dark shaded brown tiny circular lesions. As infection progresses, the lesions become larger and observed in either circle or oval shapes having a reddish-brown boundary. Due to toxin developed by the fungus, the centre of lesions is found in light shades of brown and grey [32].
6.1.2 Implementation of BS Filters for IIE
Initially, leaf region is extracted from the image by suppressing the background. The infection intensity estimation process involves computing the extent of disease pixels related to each stage separately, total infected area and stage of the diseased leaf. Appropriate filters are designed related to these four steps. We have considered BS diseased leaf images from our prepared dataset and from dataset [38] and implemented this module for multiple leaf images. The IIE process more elaborately starting from filter designing for background removal to generation of detailed diagnosis report related to both the cases i.e., BS initial and final disease stages is explained below. The sample leaf image taken related to first case i.e., initial stage of BS disease is image21 and related to second case i.e., final stage is image123 as depicted in Figs. 10a and 10i. In the first step for image21, image filters to extract the leaf from varied colored backgrounds are designed and applied as shown from Figs. 10a to 10c. Here background color is turned to black rather than white irrespective of the colors of input leaf images taken because we have observed error in calculation when converted to white background as it is slightly overlapping with ash-colored lesions of diseased leaf. Leaf area is computed by subtracting pixels of black background from whole image as expressed in Eqs. (3).
In the second step, the extracted leaf image is again masked for extracting disease’s stage-specific colored pixels by specifying appropriate shade ranges for the mask. For BS, the primary stage is identified by brownish shades and the secondary stage by brown and ash shades of the leaf. Hence brown and ash shaded masks are designed and applied separately to estimate their respective area. These stage-specific masks are applied to find out the brown shade pixels as shown from Figs. 10d to 10e. Similarly, ash disease pixels as shown in Figs. 10d and 10g. In this step, all the pixels are turned to black except stage-specific pixels. In the third step, other than disease pixels are counted by applying its corresponding mask since brown and ash colored pixel shades may span over a wide range and some disease pixel color shades may be close to the black background color resulting in counting error. Next the masked image of specified disease color is converted to gray scale as shown from Figs. 10e to 10f for brown disease pixels; Figs. 10g to 10h for ash disease pixels.
Finally, from masked gray scale image, the number of black pixels (i.e., background pixels + leaf pixels other than disease) are counted and these are subtracted from the total image area for obtaining count of brown shaded pixels using Eq. (4) as shown in Fig. 10f and in the same way count of ash shaded pixels is obtained using Eq. (5) as shown in Fig. 10h. Next the percentages of brown and ash disease pixels are calculated using Eqs. (6) and (7) respectively. For computing total infected area, all the disease-specific pixel percentages are summed up as expressed in Eq. (8). Similar process is repeated for image123 as shown in the Fig. 10 from Figs. 10i to 10n.
6.1.3 Calculations and Results Discussion
Initially, the area of whole image (i.e., leaf area and background area) is computed from image shape in case of image21 it is 278 × 898 and in case of image123 it is 897 × 3081. After applying mask for background elimination, black background pixels are counted in either case, which are subtracted from whole image to extract leaf area. Calculation steps related to leaf area extraction for image21 and image123 are expressed below:
Leaf Area Extraction of image21 Leaf Area Extraction of image123
Image shape of image21: (278,898) Image Shape of image123: (897,3081)
Number of Black Background Pixels: 62492 Number of Black Background Pixels: 1520011
Number of Leaf Pixels: 187152 Number of Leaf Pixels: 1243646
Next count and percentage of disease’s stage-specific pixel shades are computed. First, black pixels are counted after applying the appropriate stage-specific mask. These values are then subtracted from whole image to obtain disease pixels count. Consequently, its percentage is calculated with respect to leaf area. Calculations related to Brown and Ash shade pixels of image21 and image123 are expressed below:
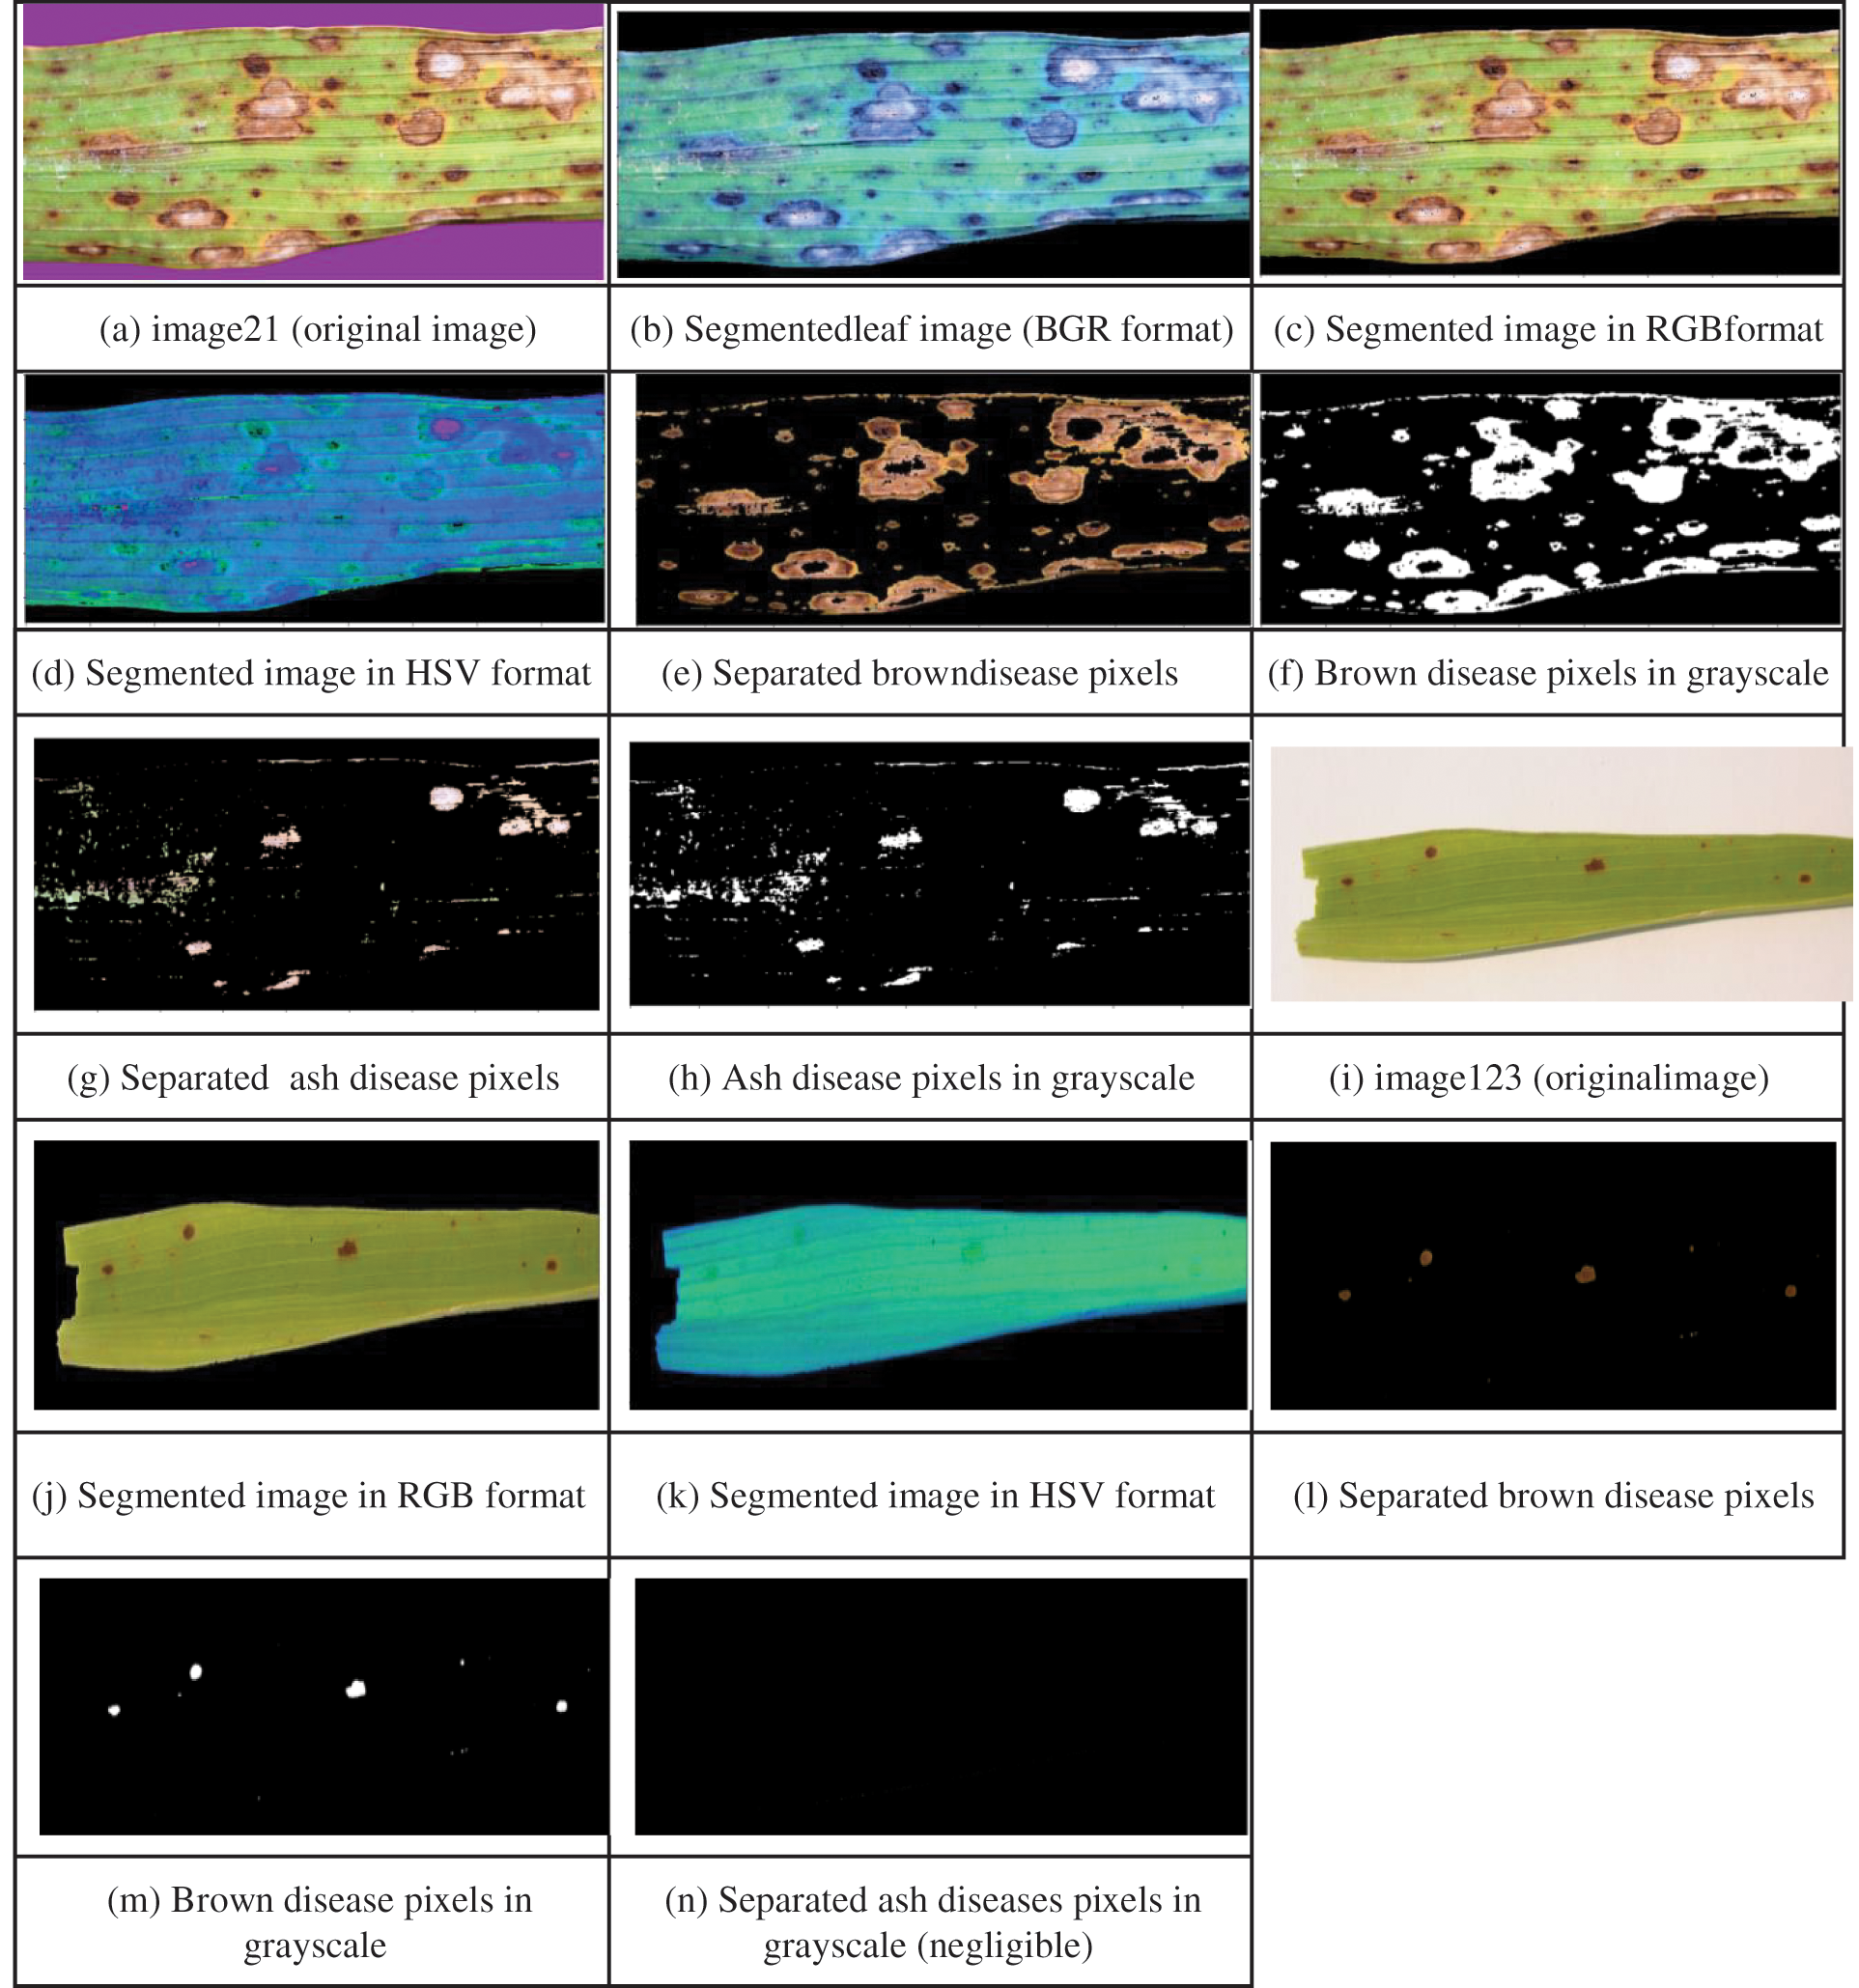
Figure 10: Identification of disease pixels
Brown Disease Pixels Analysis of image21 Brown Disease Pixels Analysis of image123
Number of Black Pixels for Brown-Mask: 194805 Number of Black Pixels for Brown-Mash:
2755416
Number of Brown Pixels: 54839 Number of Brown Pixels: 8241
Percentage of Brown Disease Pixels: 29.30185 Percentage of Brown Disease Pixels: 0.662648
Ash Disease Pixels Analysis of image21 Ash Disease Pixels Analysis of image123
Number of Black Pixels for Ash-Mask: 237185 Number of Black Pixels for Ash-Mash: 2763566
Number of Ash Pixels: 12459 Number of Ash Pixels: 91
Percentage of Ash Disease Pixels: 6.6571557 Percentage of Ash Disease Pixels: 0.0073172
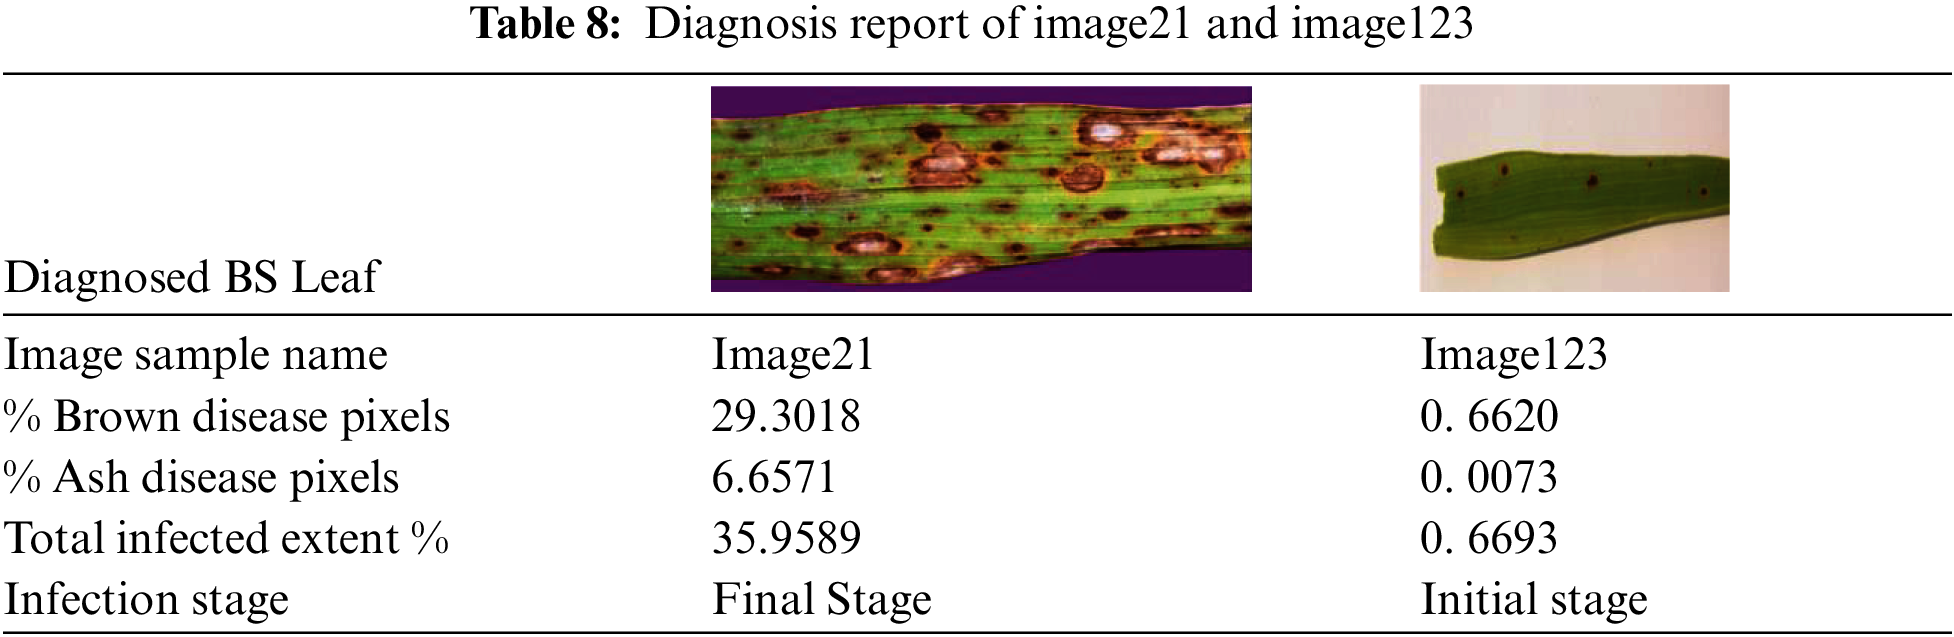
Next, percentage of total infected area or extent is calculated by summing up both brown and ash disease pixel percentage. Finally, the stage of the disease is determined. In initial stage, BS lesions appears to be tiny brown shaded spots whereas in final stage, lesions are expanded containing grey spots surrounded by brown lining. Hence the two main factors that decide the stage of the BS disease are: (1) percentage of the total infection extent and (2) percentage of ash disease pixels. We have taken threshold values for these 2 parameters as 5 and 1 respectively after thorough examination of various diseased leaf images related to both the stages of BS disease. In case of image21, it is identified as the final stage since its percentage of ash disease pixels is greater than 1 and its extent % of total infection is more than 5. Coming to image123, it is determined as the initial stage because of its low or negligible % of ash disease pixels and even total infection extent % is less than the threshold value. The diagnosis report of image21 and image123 is detailed in Tab. 8. To evaluate the efficiency of the disease stage prediction, we have labelled the BS leaf images with one of the two stages based on the characteristics given in [32] and picked one hundred images randomly to test prediction accuracy. It is found that designed filters could correctly predict its disease stage for all the considered 100 BS leaves. We have also analyzed that applying image filters over using any ML/DL technique saves time.
Rice is being one of the major staple foods across the world, its yield is drastically affected due to various biotic stresses. To meet the ever-increasing population needs various crop improvement strategies are in practice but the major challenge is the early and accurate diagnose of the diseases with less cost and time. We have presented an efficient automated system called RDDS to address this challenge. The novel RDD_CNN model designed as a part of LDI module has shown a most promising performance with outstanding test accuracy of 98.47 percent as a disease classifier for the eight most harmful rice diseases. It has equally outperformed when evaluated using other metrics such as F1-score, Sensitivity and Specificity. The proposed model also addressed data imbalance issue using weight balancing method. As a part of the IIE module, various appropriate filters designed have resulted in providing a detailed diagnosis report of BS infected leaves. This module provided disease severity analysis in terms of infection extent and stage of the disease. Disease stage prediction has exhibited 100% accuracy proving the efficacy of designed filters. Hence this system facilitates farmers with early, accurate and in-depth analysis of infected disease to take appropriate measures promptly to protect the crop from severe damage and produce a better yield. As future work, IIE process can be extended for other seven diseases that adversely affect rice crop yield. Further, this RDD System can be extended to consider a leaf infected with multiple diseases.
Acknowledgement: The author would like to thank Deanship of Scientific Research at Majmaah University for supporting this work under Project Number R-2022-124.
Funding Statement: The author received funding for this research from Deanship of Scientific Research at Majmaah University for supporting this work under Project Number R-2022-124.
Conflicts of Interest: The authors declare that they have no conflicts of interest to report regarding the present study.
1. K. S. Archana and A. Sahayadhas, “Automatic rice leaf disease segmentation using image processing techniques,” International Journal of Engineering & Technology, vol. 27, no. 3, pp. 182–185, 2018. [Google Scholar]
2. C. R. Rahman, P. S. Arko, M. E. Ali, M. A. I. Khan, S. H. Apon et al., “Identification and recognition of rice diseases and pests using convolutional neural networks,” Biosystems Engineering, vol. 194, no. 1, pp. 112–120, 2020. [Google Scholar]
3. M. E. Pothen and M. L. Pai, “Detection of rice leaf diseases using image processing,” in 2020 Fourth Int. Conf. on Computing Methodologies and Communication (ICCMC), Erode, India, pp. 424–430, 2020. [Google Scholar]
4. B. S. Ghyar and G. K. Birajdar, “Computer vision based approach to detect rice leaf diseases using texture and color descriptors,” in 2017 Int. Conf. on Inventive Computing and Informatics, Coimbatore, India, pp. 1074–1078, 2017. [Google Scholar]
5. A. A. Joshi and B. Jadhav, “Monitoring and controlling rice diseases using image processing techniques,” in 2016 Int. Conf. on Computing, Analytics and Security Trends (CAST), Pune, India, pp. 471–476, 2016. [Google Scholar]
6. C. Shuo, K. Zhang, Y. Zhao, Y. Sun, W. Ban et al., “An approach for rice bacterial leaf streak disease segmentation and disease severity estimation,” Agriculture, vol. 11, no. 5, pp. 420, 2021. [Google Scholar]
7. S. Verma, A. Chug and A. P. Singh, “Application of convolutional neural networks for evaluation of disease severity in tomato plant,” Journal of Discrete Mathematical Sciences and Cryptography, vol. 23, no. 1, pp. 273–282, 2020. [Google Scholar]
8. http://www.knowledgebank.irri.org/. [Google Scholar]
9. J. Mendes, T. M. Pinho, F. N. D. Santos, J. J. Sousa, E. Peres et al., “Smartphone applications targeting precision agriculture practices—A systematic review,” Agronomy, vol. 10, no. 6, pp. 855, 2020. [Google Scholar]
10. B. T. W. Putra, P. Soni, B. Marhaenanto, Pujiyanto, S. S. Harsono and S. Fountas, “Using information from images for plantation monitoring: A review of solutions for smallholders,” Information Processing in Agriculture, vol. 7, no. 1, pp. 109–119, 2020. [Google Scholar]
11. C. Zeidler, P. Zabel, V. Vrakking, M. Dorn, M. Bamsey et al., “The plant health monitoring system of the EDEN ISS space greenhouse in antarctica during the 2018 experiment phase,” Frontiers in Plant Science, vol. 10, pp. 1457, 2019. [Google Scholar]
12. S. Phadikar and J. Sil, “Rice disease identification using pattern recognition techniques,” in Proc. of 11th Int. Conf. on Computer and Information Technology, ICCIT, Khulna, Bangladesh, pp. 420–423, 2008. [Google Scholar]
13. S. Phadikar, J. Sil and A. K. Das, “Classification of rice leaf diseases based onmorphological changes,” International Journal of Information and Electronics Engineering, vol. 2, no. 3, pp. 460–463, 2012. [Google Scholar]
14. H. B. Prajapati, J. P. Shah and V. K. Dabhi, “Detection and classification of rice plant diseases,” Intelligent Decision Technologies, vol. 11, no. 3, pp. 357–373, 2017. [Google Scholar]
15. J. G. A. Barbedo, “Digital image processing techniques for detecting, quantifying and classifying plant diseases,” SpringerPlus, vol. 2, no. 1, pp. 1–12, 2013. [Google Scholar]
16. Z. Zhou, Y. Zang, Y. Li, Y. Zhang, P. Wang et al., “Rice plant-hopper infestation detection and classification algorithms based on fractal dimension values and fuzzy C-means,” Mathematical and Computer Modelling, vol. 58, no. 3-4, pp. 701–709, 2013. [Google Scholar]
17. P. Sanyal, U. Bhattacharya, S. K. Parui, S. K. Bandyopadhyay and S. Patel, “Color texture analysis of rice leaves diagnosing deficiency in the balance of mineral levels towards improvement of crop productivity,” in 10th Int. Conf. on Information Technology (ICIT 2007), Rourkela, India, pp. 85–90, 2008. [Google Scholar]
18. P. Sanyal and S. C. Patel, “Pattern recognition method to detect two diseases in rice plants,” ImagingScience Journal, vol. 56, no. 6, pp. 319–325, 2008. [Google Scholar]
19. A. Asfarian, Y. Herdiyeni, A. Rauf and K. H. Mutaqin, “A computer vision for rice disease identification to support integrated pest management,” Crop Protection, vol. 61, pp. 103–104, 2014. [Google Scholar]
20. P. K. Sethy, N. K. Barpanda, A. K. Rath and S. C. Rajpoot, “Rice (Oryza Sativa) panicle blast grading using support vector machine based on deep features of small CNN,” Archives of Phytopathology and Plant Protection, vol. 54, no. 15-16, pp. 1001–1013, 2020. [Google Scholar]
21. B. S. Bari, M. N. Islam, M. Rashid, M. J. Hasan, M. A. M. Razman et al., “A real-time approach of diagnosing rice leaf disease using deep learning-based faster R-CNN framework,” PeerJ Computer Science, vol. 7, no. 1, pp. 432–459, 2021. [Google Scholar]
22. P. K. Sethy, N. K. Barpanda, A. K. Rath and S. K. Behera, “Deep feature based rice leaf disease identification using support vector machine,” Computers and Electronics in Agriculture, vol. 175, no. 1, pp. 1–9, 2020. [Google Scholar]
23. S. Ghosal and K. Sarkar, “Rice leaf diseases classification using CNN with transfer learning,” in 2020 IEEE Calcutta Conf. (CALCON), Kolkata, India, pp. 230–236, 2020. [Google Scholar]
24. G. Zhou, W. Zhang, A. Chen, M. He and X. Ma, “Rapid detection of rice disease based on FCM-KM and faster R-CNN fusion,” IEEE Access, vol. 7, pp. 143190–143206, 2019. [Google Scholar]
25. P. K. Sethy, N. K. Barpanda, A. K. Rath and S. K. Behera, “Rice false smut detection based on faster R-CNN,” Indonesian Journal of Electrical Engineering and Computer Science, vol. 19, pp. 1590–1595, 2020. [Google Scholar]
26. S. Ramesh and D. Vydeki, “Recognition and classification of paddy leaf diseases using optimized deep neural network with jaya algorithm,” Information Processing in Agriculture, vol. 7, no. 2, pp. 249–260, 2020. [Google Scholar]
27. K. Ahmed, T. R. Shahidi, S. M. Irfanul Alam and S. Momen, “Rice leaf disease detection using machine learning techniques,” in 2019 Int. Conf. on Sustainable Technologies for Industry 4.0 (STI), Dhaka, Bangladesh, pp. 1–5, 2019. [Google Scholar]
28. M. E. Pothen and M. L. Pai, “Detection of rice leaf diseases using image processing,” in 2020 Fourth Int. Conf. on Computing Methodologies and Communication (ICCMC), Erode, India, pp. 424–430, 2020. [Google Scholar]
29. B. S. Ghyar and G. K. Birajdar, “Computer vision based approach to detect rice leaf diseases using texture and color descriptors,” in 2017 Int. Conf. on Inventive Computing and Informatics (ICICI), Coimbatore, India, pp. 1074–1078, 2017. [Google Scholar]
30. T. Ahmed, C. R. Rahman and M. F. Abid, “Rice grain disease identification using dual phase convolutional neural network-based system aimed at small dataset,” 2020. [Online]. Available: https://arxiv.org/abs/2004.09870. [Google Scholar]
31. E. L. Miquem and T. D. Palaoag, “Rice pest and disease detection using convolutional neural network,” in Proc. of the 2018 Int. Conf. on Information Science and System, Jeju Republic of Korea, pp. 147–151, 2018. [Google Scholar]
32. M. S. I. Prottasha, A. B. M. K. Hossain, M. Z. Rahman, S. M. S. Reza and D. A. Hossain, “Identification of various rice plant diseases using optimized convolutional neural network,” International Journal of Computing and Digital Systems, vol. 1, pp. 1–12, 2021. [Google Scholar]
33. https://www2.ipm.ucanr.edu/agriculture/rice/. [Google Scholar]
34. https://agritech.tnau.ac.in/crop_protection/crop_prot_crop%20diseases_cereals_paddy.html. [Google Scholar]
35. J. Chen, D. Zhang, Y. A. Nanehkaran and D. Li, “Detection of rice plant diseases based on deep transfer learning,” Journal of the Science of Food and Agriculture, vol. 100, no. 7, pp. 3246–3256, 2020. [Google Scholar]
36. J. Chen, J. Chen, D. Zhang, Y. Sun and Y. A. Nanehkaran, “Using deep transfer learning for image-based plant disease identification,” Computers and Electronics in Agriculture, vol. 173, no. 2, pp. 105393, 2020. [Google Scholar]
37. Z. Y. Liu, J. F. Huang and R. X. Tao, “Characterizing and estimating fungal disease severity of rice brown spot with hyperspectral reflectance data,” Rice Science, vol. 15, no. 3, pp. 232–242, 2008. [Google Scholar]
38. https://www.kaggle.com/vbookshelf/rice-leaf-diseases. [Google Scholar]
 | This work is licensed under a Creative Commons Attribution 4.0 International License, which permits unrestricted use, distribution, and reproduction in any medium, provided the original work is properly cited. |