DOI:10.32604/cmc.2022.029265
| Computers, Materials & Continua DOI:10.32604/cmc.2022.029265 | |
| Article |
Computer Vision with Machine Learning Enabled Skin Lesion Classification Model
1Department of Mathematics, Faculty of Science, New Valley University, El-Kharga, 72511, Egypt
2Department of Computer Science, College of Computer and Information Sciences, Majmaah University, Al-Majmaah, 11952, Saudi Arabia
3Department of Electrical Engineering, College of Engineering, Jouf University, Sakaka, 72388, Saudi Arabia
*Corresponding Author: Romany F. Mansour. Email: romanyf@sci.nvu.edu.eg
Received: 28 February 2022; Accepted: 06 April 2022
Abstract: Recently, computer vision (CV) based disease diagnosis models have been utilized in various areas of healthcare. At the same time, deep learning (DL) and machine learning (ML) models play a vital role in the healthcare sector for the effectual recognition of diseases using medical imaging tools. This study develops a novel computer vision with optimal machine learning enabled skin lesion detection and classification (CVOML-SLDC) model. The goal of the CVOML-SLDC model is to determine the appropriate class labels for the test dermoscopic images. Primarily, the CVOML-SLDC model derives a gaussian filtering (GF) approach to pre-process the input images and graph cut segmentation is applied. Besides, firefly algorithm (FFA) with EfficientNet based feature extraction module is applied for effectual derivation of feature vectors. Moreover, naïve bayes (NB) classifier is utilized for the skin lesion detection and classification model. The application of FFA helps to effectually adjust the hyperparameter values of the EfficientNet model. The experimental analysis of the CVOML-SLDC model is performed using benchmark skin lesion dataset. The detailed comparative study of the CVOML-SLDC model reported the improved outcomes over the recent approaches with maximum accuracy of 94.83%.
Keywords: Skin lesion detection; dermoscopic images; machine learning; deep learning; graph cut segmentation; EfficientNet
Melanoma is one of the most dangerous types of cancer which is incurable. In many of the turnover of the cases is mortality. Occasionally, melanoma growth begins from cancer with variations containing its itchiness, color, and size [1]. Earlier lesion diagnosis increases the survival rate to 100%, whereas late detection turns into 59% survival rate and deep melanoma is bigger when compared to three millimeters [2]. Generally, non-melanoma is a common light type of cancer when compared to melanoma, however, melanoma is the major cause of skin lesion death. Initially, detection of malignant melanoma might significantly reduce morbidity and mortality [3]. During the early stages, detection of malignant melanoma might save millions rather than treatment procedure of that deadliest disease. In contrast with other types of cancer, the ratio of melanoma increases rapidly, viz. a rise of 6% per annum. Skin lesion localization and detection in the image are essential to estimate image features for lesion diagnoses [4]. It is important to precisely determined the cancer boundary thus measurement of boundary irregularity, maximal diameter, and features of color might be precisely computed. In detecting skin lesions, initially, boundary of the cancer is marked by the image segmentation method. The texture discriminated and distributions of color against the texture color images. By using the classification method, skin lesions can be detected at earlier stage [5].
Due to the difference in skin texture and injury, detection of skin cancer is a complicated process. Consequently, dermatologist employs a non-invasive method called dermoscopy for detecting skin lesion at an earlier stage [6]. The initial phase in dermoscopy is to employ the ointment to the diseased region. Next, a magnified image can be attained by utilizing a magnifying tool. The magnified image offers the best visualization to inspect the shape of the cancer region. The recognition performance is based on expert knowledge [7]. Manual detection of skin lesions through dermoscopy, alternatively, is a laborious process with a higher risk of error, even for skilled dermatologists. Thus, researcher presents distinct computer-aided diagnostic (CAD) methods on the basis of deep learning (DL) and machine learning (ML) characteristics [8]. The dermatologist uses CAD system for identifying skin lesions more accurately and quickly. A CAD scheme’s important step is skin image dataset attainment, classification, feature selection, and extraction. The usage of deep features for skin cancer classification and detection showed massive significance over the past decades than the conventional feature extraction technique [9]. The deep feature is extracted from the FC layer of CNN method that is applied for the classification. Deep feature, contrasted with conventional techniques, namely shape, texture, and color, includes global and local data regarding an image [10]. Fig. 1 shows the different aspects of computer vision (CV) in healthcare sector.
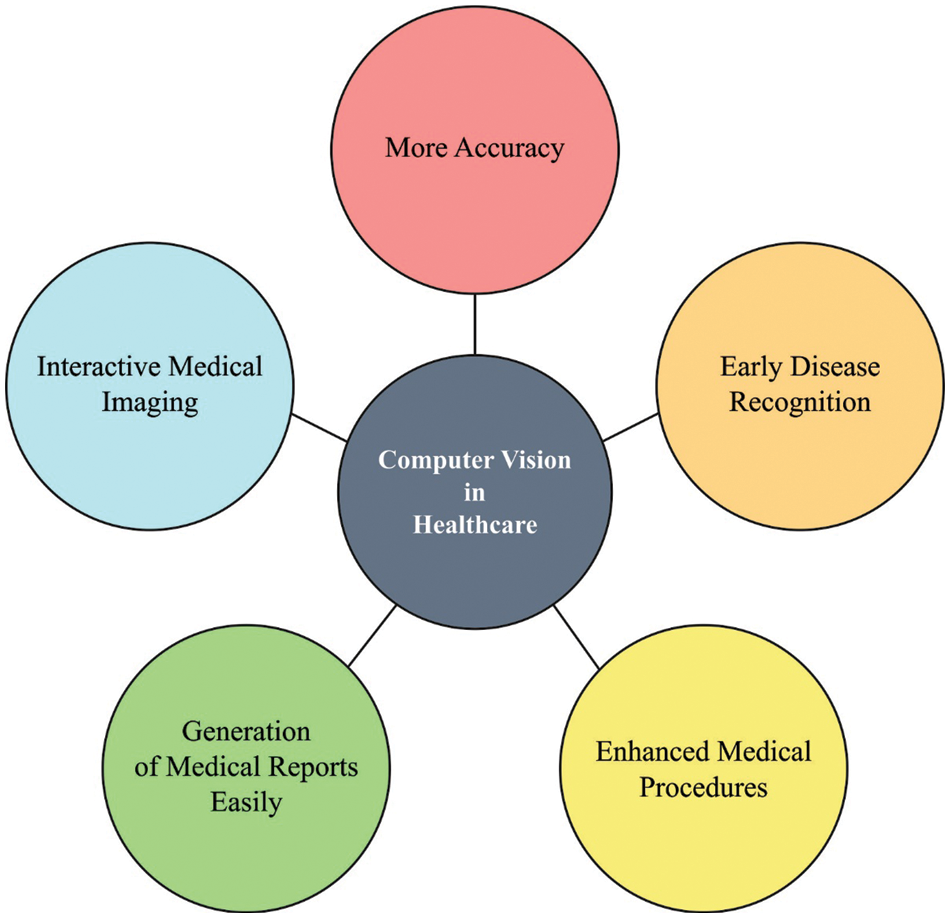
Figure 1: Different aspects of CV in healthcare
This study develops a novel computer vision with optimal machine learning enabled skin lesion detection and classification (CVOML-SLDC) model. The goal of the CVOML-SLDC model is to determine the appropriate class labels for the test dermoscopic images. Primarily, the CVOML-SLDC model derives a Gaussian filtering (GF) approach to pre-process the input images and graph cut segmentation is applied. Besides, firefly algorithm (FFA) with EfficientNet based feature extraction module is applied for effectual derivation of feature vectors. Moreover, naïve bayes (NB) classifier is utilized for the skin lesion detection and classification model. The experimental analysis of the CVOML-SLDC model is performed using benchmark skin lesion dataset.
In [11], a novel approach to multiclass skin lesion classifier utilizing DL feature fusion and an ELM was presented. The presented technique contains 5 main phases: image acquisition and contrast enhancement; DL feature extracting utilizing transfer learning (TL); optimum feature selection (FS) utilizing hybrid whale optimized and entropymutual information (EMI) technique; fusion of selective features utilizing a modified canonical correlation based technique; and, at last, ELM based classifier. Nasir et al. [12] presented a technique to classifier of benign and melanoma skin lesions. This technique combines pre-processing, lesion segmentation, features extracting, FS, and classifier. The pre-processing was implemented from the context of hair removal by DullRazor, but lesion texture and color data are employed for enhancing the lesion contrast. In lesion segmentation, a hybrid approach was executed and outcomes are fused utilizing additive law of probability.
In [13], a new DL infrastructure was presented for lesion classification and segmentation. The presented method integrates 2 main phases. In order to lesion segmentation, Mask recurrent convolution neural network (Mask R-CNN) based structure was executed. During this method, Resnet50 together with feature pyramid network (FPN) was employed as backbone. Then, fully connected (FC) layer based features were mapped to the last mask generation. Reis et al. [14] presented InSiNet, a DL based CNN for detecting benign and malignant lesions. A comparative analysis is implemented amongst the presented technique and other ML approaches (DenseNet-201, RF, ResNet152V2, GoogleNet, LR, RBF-SVM, and EfficientNetB0). Benyahia et al. [15] examined the efficacy of utilizing 17 usually pre-trained CNN infrastructures as feature extracting and 24 ML techniques for evaluating the classifier of skin lesion in 2 distinct data sets such as ISIC 2019 and PH2.
In this study, a new CVOML-SLDC technique has been developed to determine the appropriate class labels for the test dermoscopic images. Fig. 2 offers a brief overall workflow of CVOML-SLDC model. The proposed CVOML-SLDC technique involves different levels of operations such as GF based pre-processing, graph cut segmentation, EfficientNet feature extraction, FFA based hyperparameter tuning, and NB classification.
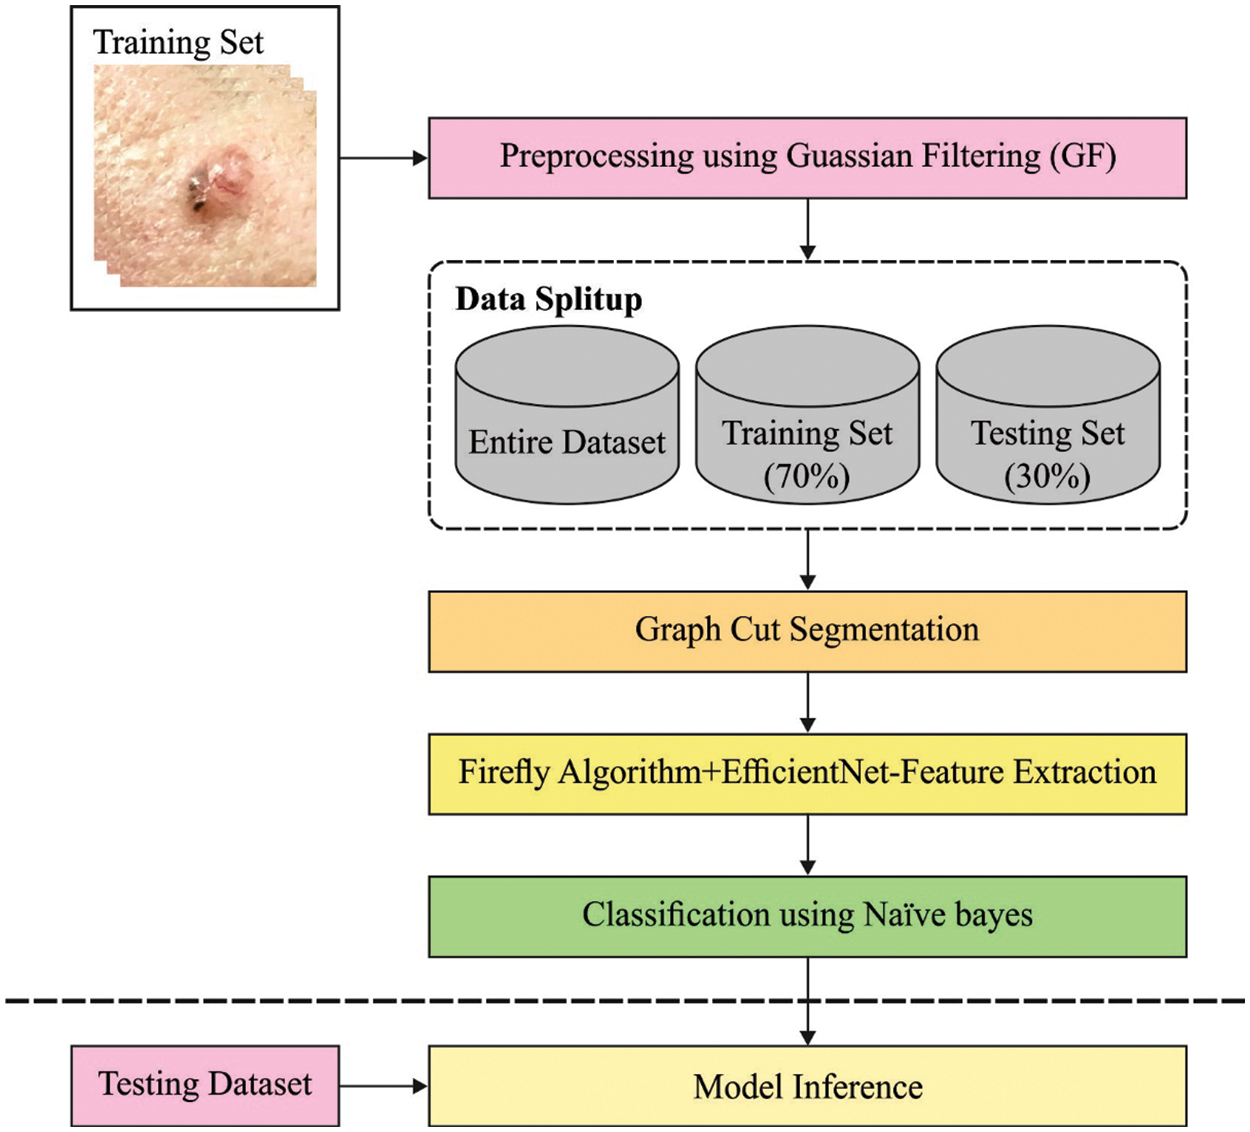
Figure 2: Workflow of CVOML-SLDC model
3.1 Image Pre-processing: GF Technique
Firstly, GF technique is applied for the removal of noise exist in the dermoscopic images. Initially, the GF method is employed for image pre-processing to eliminate the noise and increase the quality of the images. The 2D GF was widely utilized for noise smoothing and elimination. It needs massive processing resources and the effectiveness in implementing is a motivating study. The convolution operator is defined by the Gaussian operator, and proposal of Gaussian smoothing can be attained by a convolution. The Gaussian operator is in one dimensional is shown in the following:
The optimum smoothing filter for image undergoes localization in the frequency and spatial domain, where the ambiguity relation is satisfied as follows:
The Gaussian operator in two dimensional is given by
In which
3.2 Image Segmentation: Graphcut Technique
At the time of image segmentation, the graphcut technique is utilized to determine the affected skin lesion regions. The resolve of graph cuts (GCs) segmentation is for extracting the tumor in the ROI accurately with increased data. The GCs method was generally utilized for medical image segmentation because of its benefits from global optima solution calculation. In GCs, segmentation has been expressed as the subsequent energy function minimized problem [16]:
whereas
whereas
In which,
3.3 Feature Extraction: Optimal EfficientNet Model
During feature extraction process, the EfficienNet model is applied [17]. DL approach has been learned important feature in the input image at a dissimilar convolution level like human brain purpose. The DL was resolving complicated challenges generally with lower error rate and high classifier accuracy. The DL method contains distinct models (activation function, fully connected (FC), convolution, and pooling layers). The DL model has the ability to attain optimum presentation through the ML methods with higher computation difficulty. Unlike other present DL methods, the EfficientNet architecture was a compound scaling method which applies the compound coefficient for scaling network resolution, width, and depth uniformly. An EfficientNet contains 8 distinct models from B0 to B7. The presented method applies inverted bottleneck convolutions that are mainly recognized from the MobileNetV2 method viz. a layer that mostly increases the channel and compresses the network. The architecture reduces computation with the factor of 2 than standard convolution, in which f denotes the filter size. It is portrayed that EfficientNetB0 was the simplest of 8 methods and also uses minimal parameters. Hence, it is directly applied EfficientNetB0 for evaluating the efficiency.
To fine tune the hyperparameters of the EfficientNet model, the FFA is utilized. Levy walk (LW) is a random walk that step size differs based on the Lévy likelihood distribution. It is helpful for the simulated environment in which target is dispersed randomly and sparsely Lévy distribution for step size is evaluated in the following.
Whereas
• FF is unisex thus one FF would be attracted to another FFs nevertheless of their sex.
• The attraction is proportionate to the brightness. Furthermore, it is lesser while the distance improves. Consequently, assumed two flashing FFs, lesser brightness moves toward bright one. A FF randomly moves until a bright FF is positioned.
• The landscape of objective function defined the FF brightness
• Since a FF attraction is proportionate to the light intensity observed by the neighboring FFs, the distinction of attractiveness
• The FF movement
• whereas
• Automated partitioning of the population into subclasses thus every subclass could swarm near the local mode. Therefore, FFA could handle multi-modeling optimization;
• The attraction method of the FFA accelerates the convergence. It is non-linear and, therefore, it might be richer interms of dynamic features;
• FFA effectively handles a variegated range of optimization problems while it includes SA, PSO, and DE with certain cases.
3.4 Image Classification: NB Classifier
At the final stage, the NB classifier is employed for the proper identification of skin lesion classification process [19]. It is an extremely practical Bayesian learning approach. This classification generates utilization of Bayes principle that considers independence amongst predictors. In other words, NB classifier postulate which the presence of attributes from the class is not connected to occurrence of some other attribute. The Bayes principle computes conditional probability. The mathematically stated, this is revealed in Eq. (11). The variables in Eqs. (11)–(13) are determined as:
•
•
•
•
By utilizing this approach, every feature is supposed independent based on Bayes theorem that represents there is no dependency amongst the element value on provided class and another attribute [12]. The Bayes theorem allows us for expressing the posterior probability with respect to the prior probability
In Eq. (12), all the attributes set
In Eq. (13),
The experimental validation of the CVOML-SLDC model is validated using benchmark skin lesion dataset that comprises images under 6 classes [20]. Totally, 730 images exist under Actinic Keratosis (ACK) class, 845 images under Basal Cell Carcinoma of skin (BCC), 52 images under Malignant Melanoma (MEL), 244 images under Melanocytic Nevus of Skin (NEV), 192 images under Squamous Cell Carcinoma (SCC), and 235 images under Seborrheic Keratosis (SEK). Fig. 3 illustrates some sample test images.
Fig. 4 illustrates a confusion matrix generated by the CVOML-SLDC model on the whole skin lesion dataset. The figure indicated that the CVOML-SLDC model has identified 666 images into ACK, 814 images into BCC, 16 images under MEL, 183 images under NEV, 142 images under SCC, and 138 images under SEK classes.
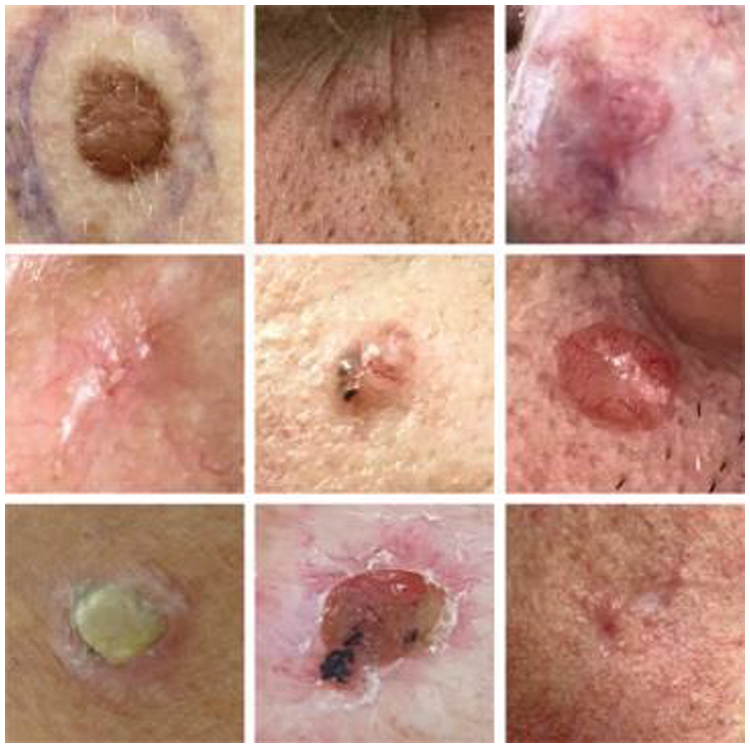
Figure 3: Sample images
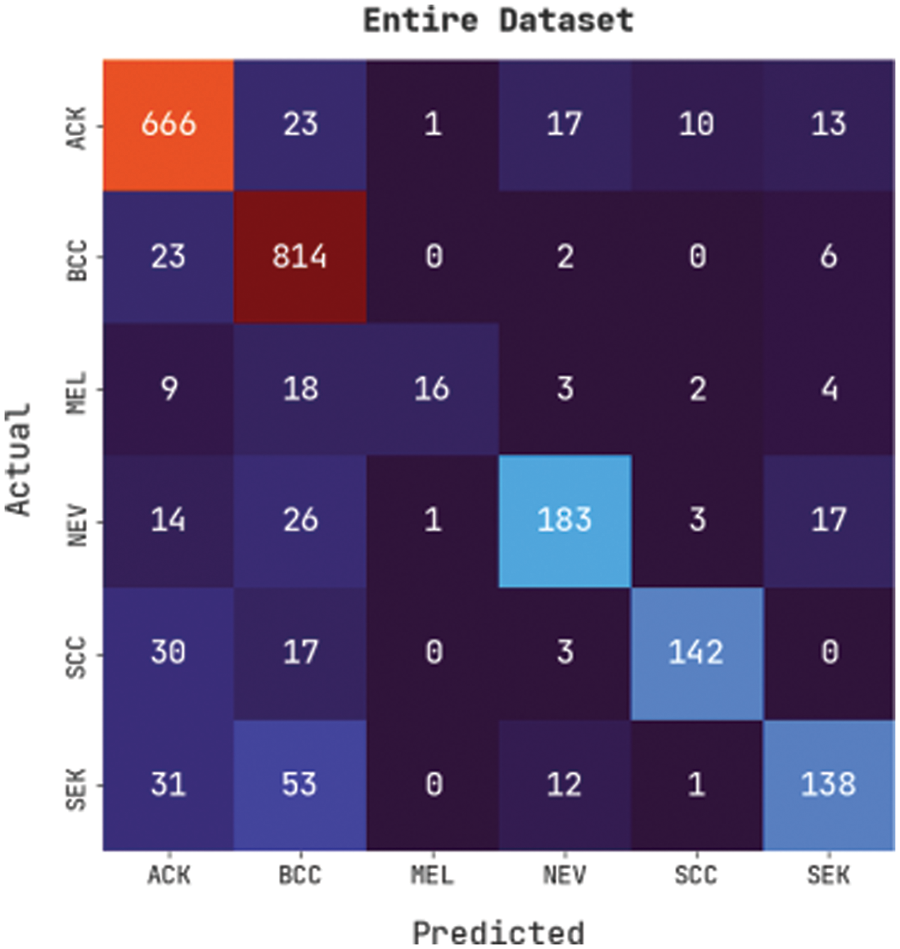
Figure 4: Confusion matrix of CVOML-SLDC model on entire dataset
Fig. 5 demonstrates an overall precision-recall examination of the CVOML-SLDC model on the entire test dataset. The figure reported that the CVOML-SLDC model has accomplished effectual performance on the classification of distinct class labels.
Fig. 6 portrays a clear ROC investigation of the CVOML-SLDC model on the entire test dataset. The figure portrayed that the CVOML-SLDC model has resulted in proficient results with maximum ROC values under distinct class labels.
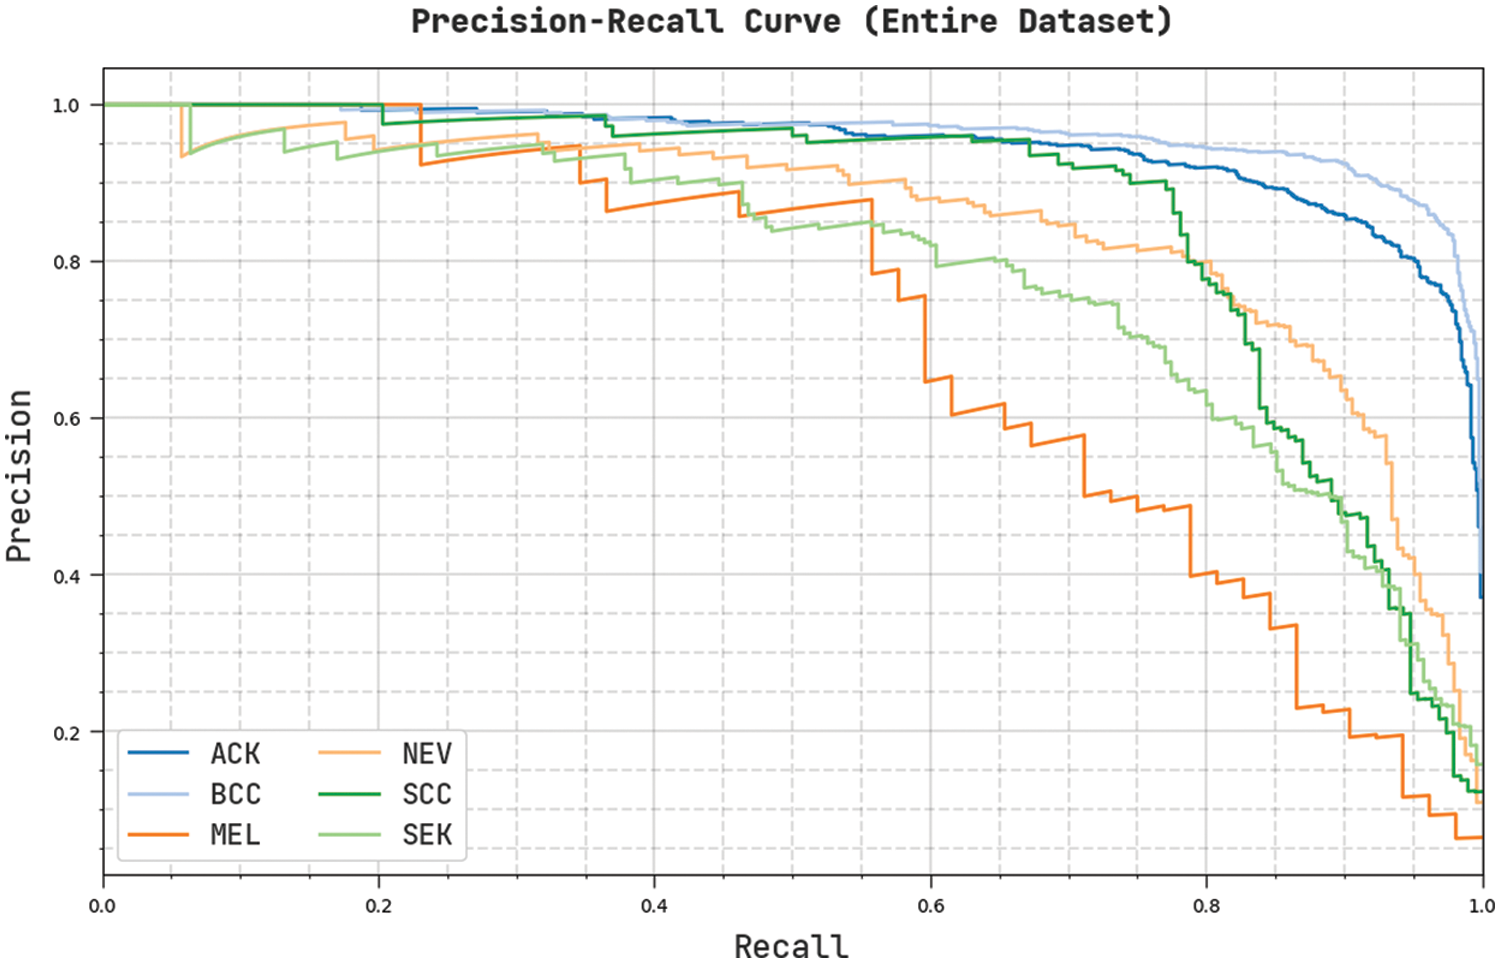
Figure 5: Precision-Recall of CVOML-SLDC model on entire dataset
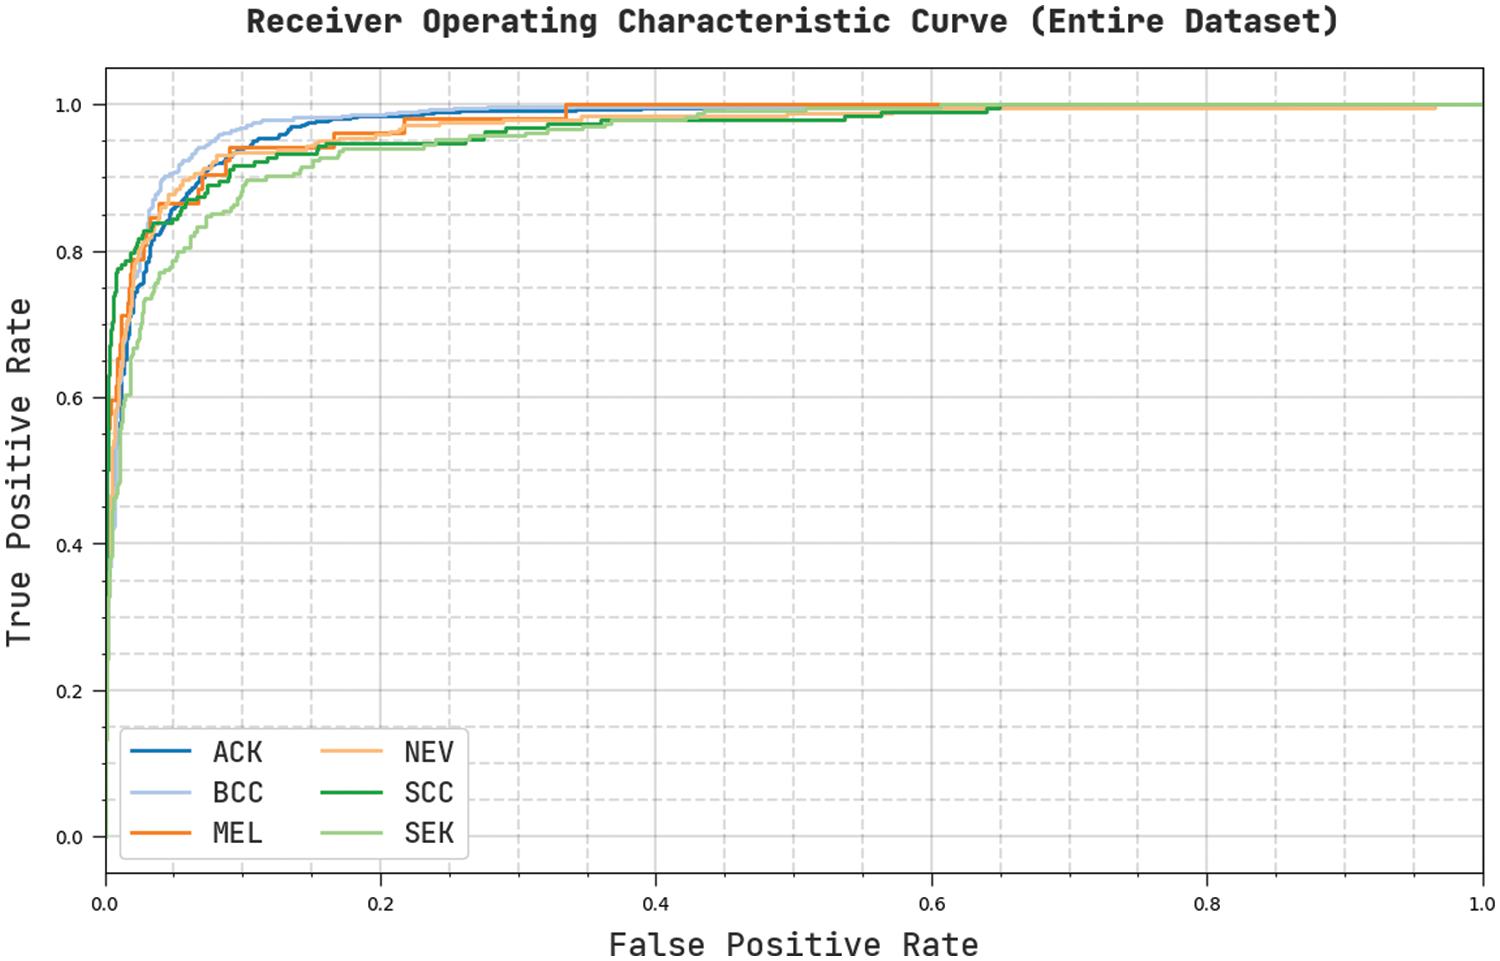
Figure 6: ROC of CVOML-SLDC model on entire dataset
Fig. 7 demonstrates a confusion matrix produced by the CVOML-SLDC model on 70% of training skin lesion dataset. The figure specified that the CVOML-SLDC model has recognized 468 images into ACK, 589 images into BCC, 11 images under MEL, 125 images under NEV, 90 images under SCC, and 93 images under SEK classes.
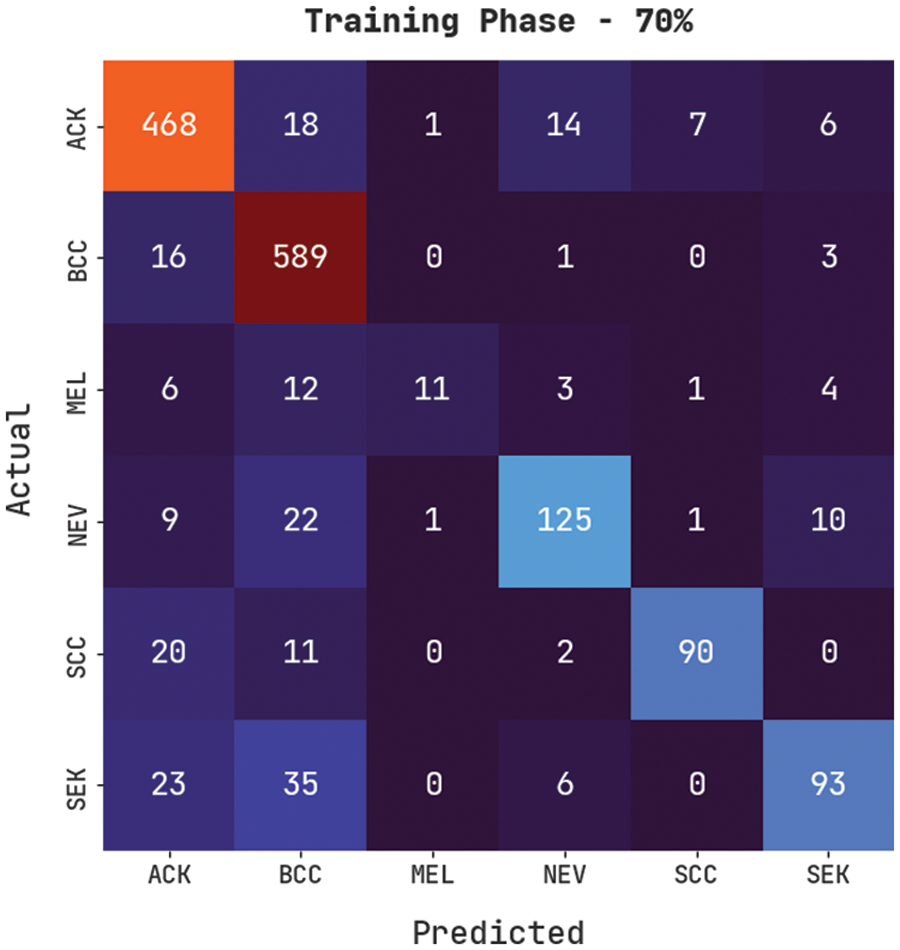
Figure 7: Confusion matrix of CVOML-SLDC model on 70% of training data
Fig. 8 validates a complete precision-recall examination of the CVOML-SLDC model on 70% of training dataset. The figure stated that the CVOML-SLDC model has gained proficient outcomes on the classification of distinct class labels.
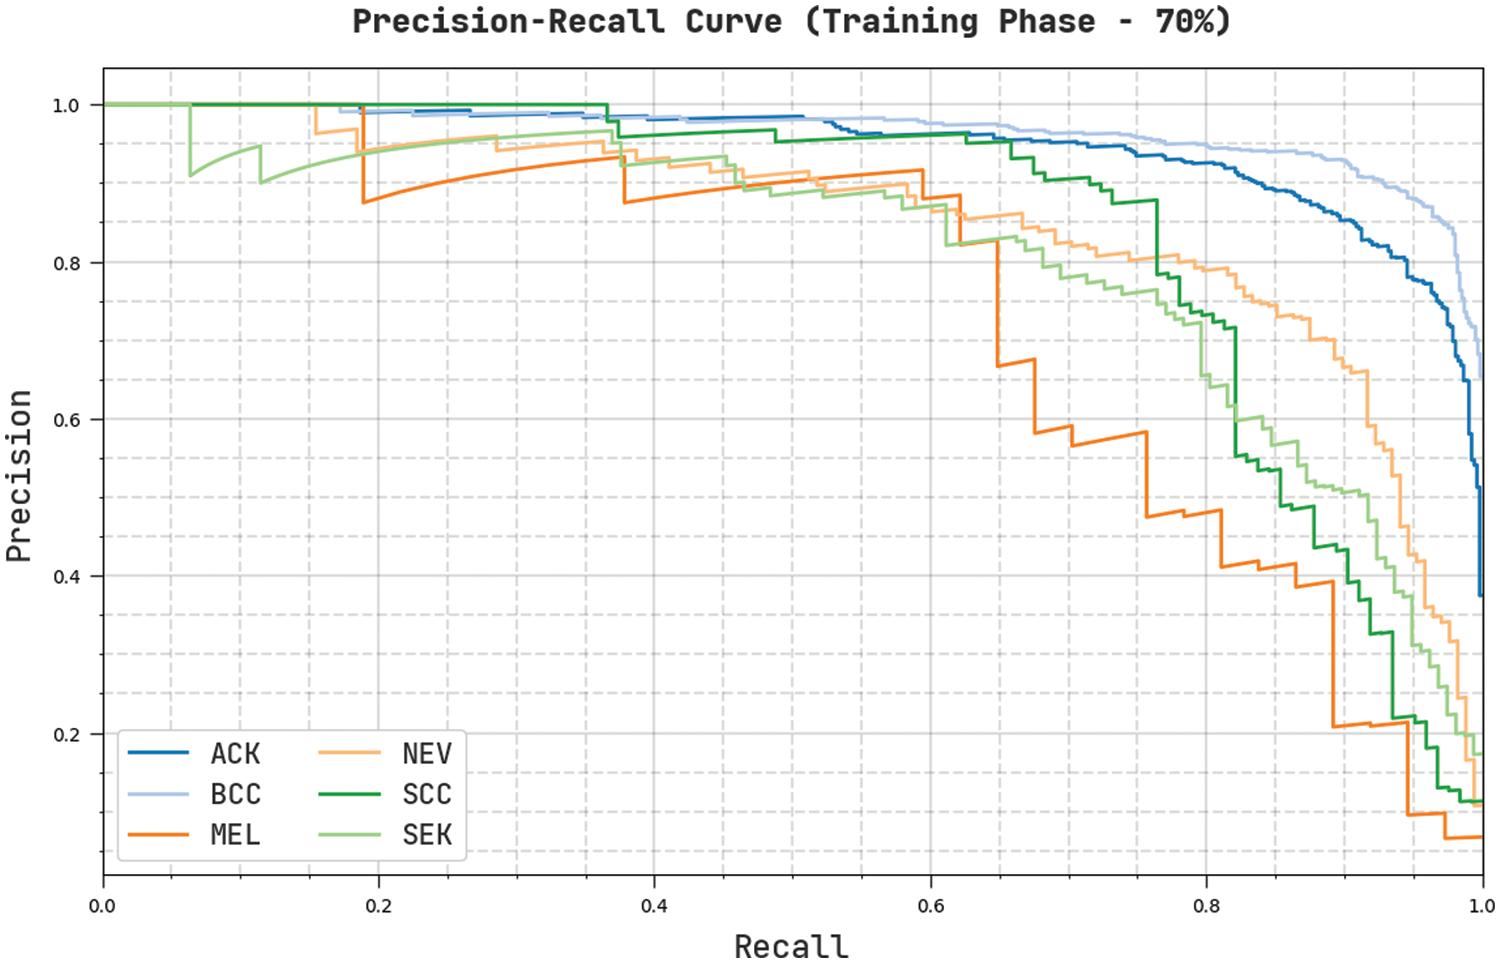
Figure 8: Precision-Recall of CVOML-SLDC model on 70% of training dataset
Fig. 9 reveals a clear ROC examination of the CVOML-SLDC model on 70% of training dataset. The figure exposed that the CVOML-SLDC model has resulted in proficient results with supreme ROC values under different class labels.
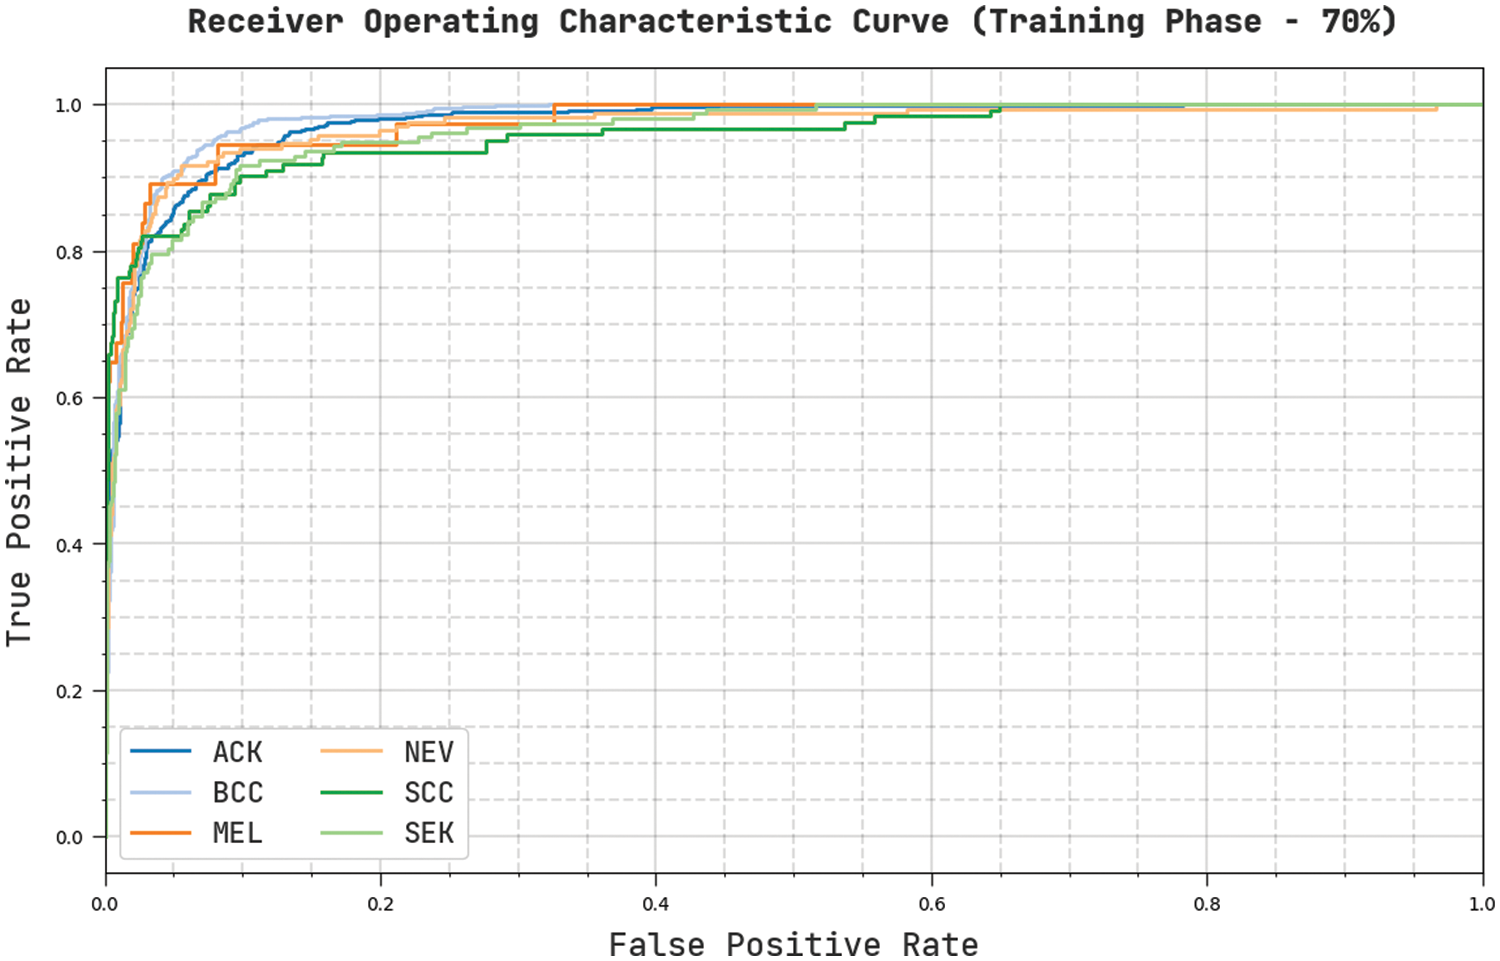
Figure 9: ROC of CVOML-SLDC model on 70% of training dataset
Fig. 10 exemplifies a confusion matrix created by the CVOML-SLDC model on the 30% testing skin lesion dataset. The figure specified that the CVOML-SLDC model has acknowledged 198 images into ACK, 225 images into BCC, 5 images under MEL, 58 images under NEV, 52 images under SCC, and 45 images under SEK classes.
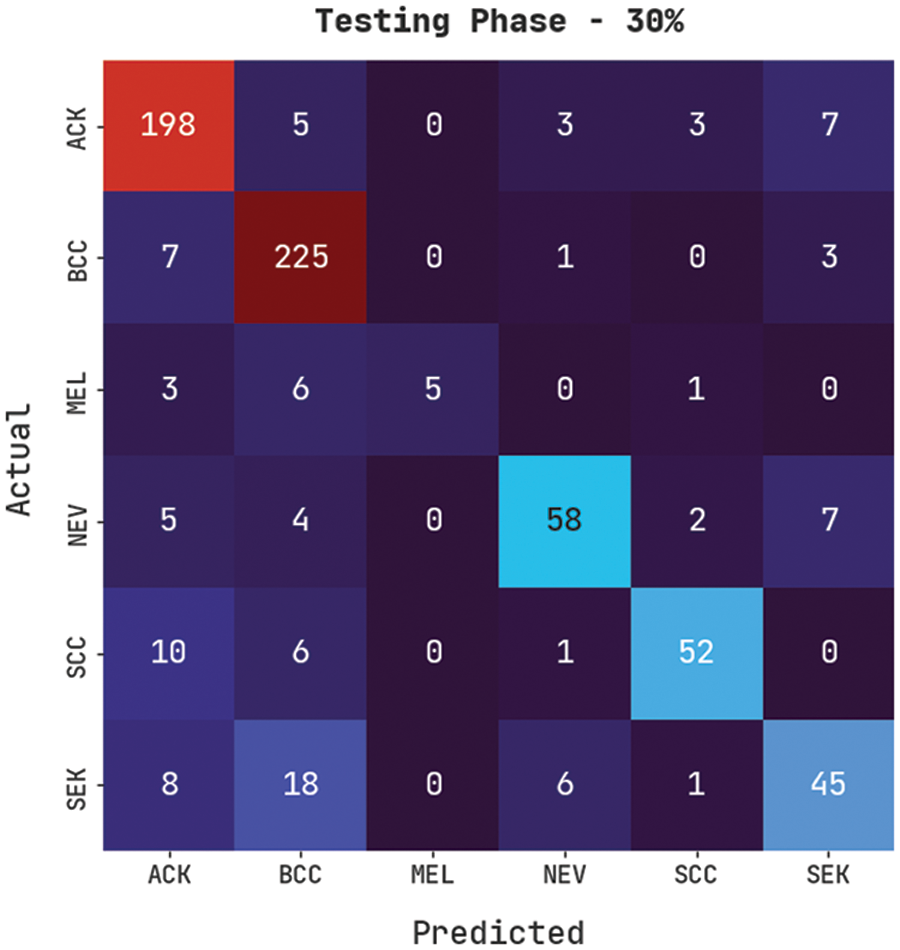
Figure 10: Confusion matrix of CVOML-SLDC model on 30% of testing dataset
Fig. 11 establishes an overall precision-recall examination of the CVOML-SLDC model on 30% of testing dataset. The figure reported that the CVOML-SLDC model has accomplished effectual performance on the classification of distinct class labels.
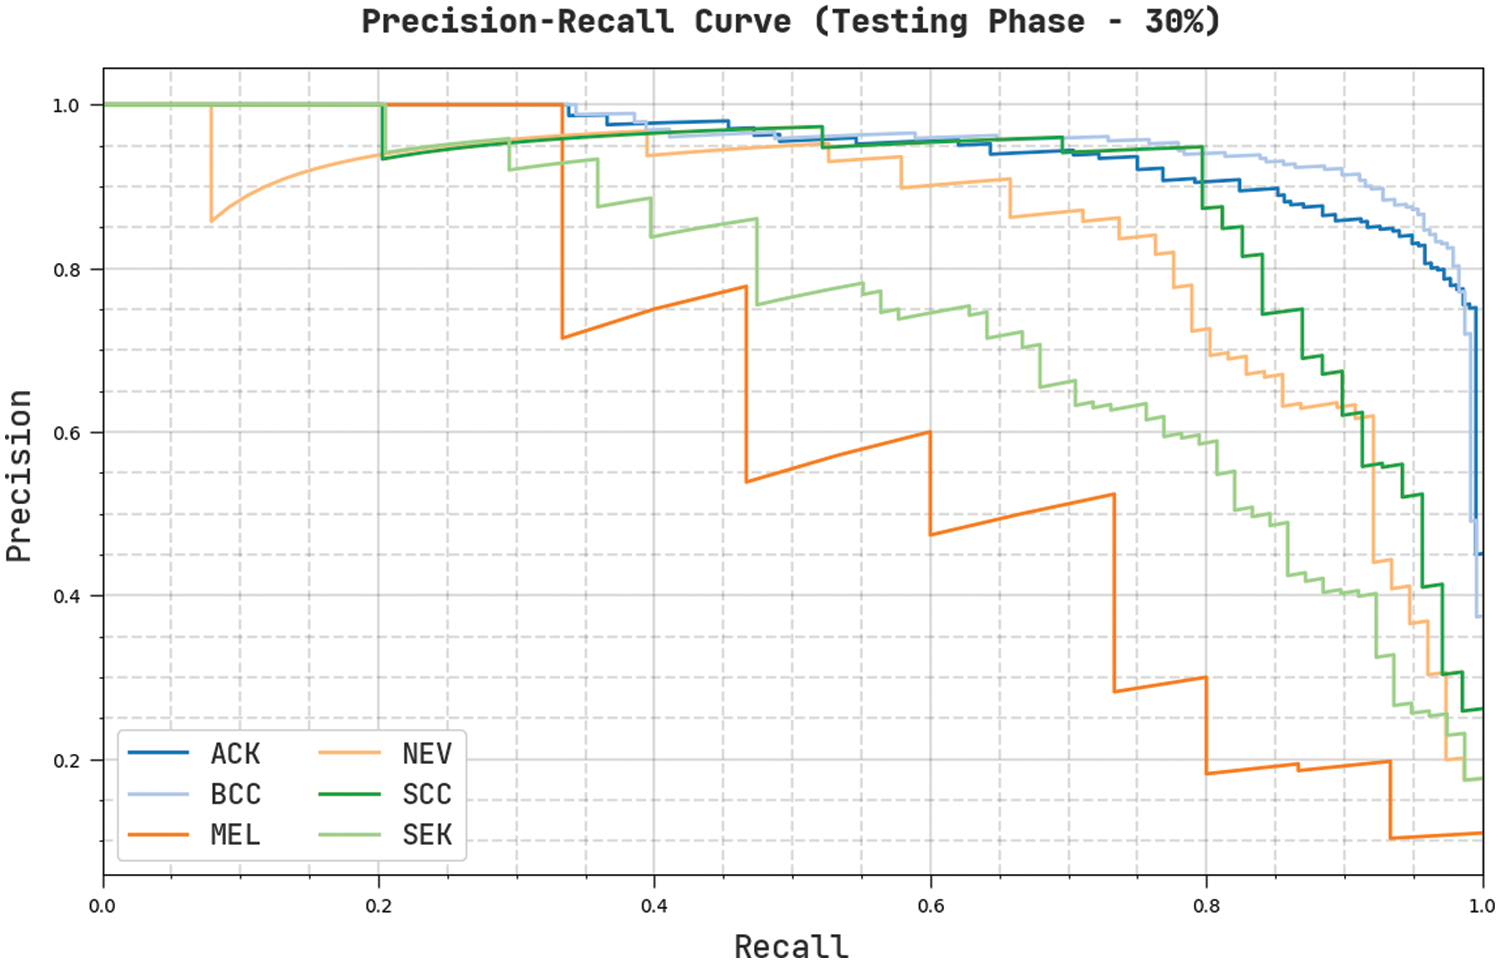
Figure 11: Precision-Recall of CVOML-SLDC model on 30% of testing dataset
Fig. 12 describes a clear ROC investigation of the CVOML-SLDC model on 30% of testing dataset. The figure represented that the CVOML-SLDC model has resulted in capable results with maximum ROC values under distinct class labels.
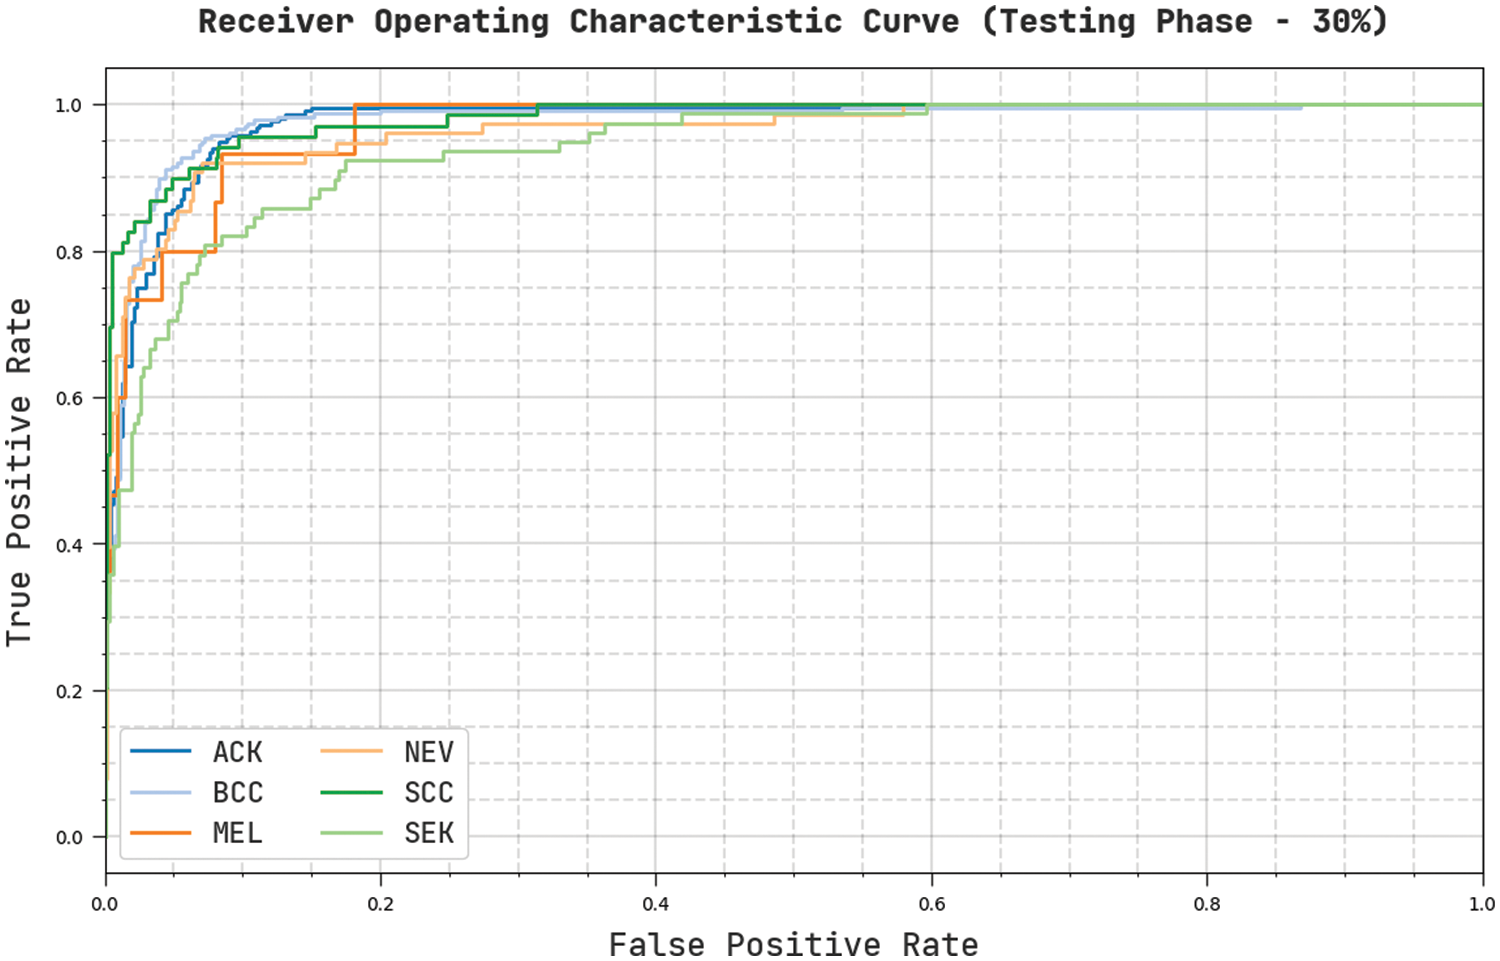
Figure 12: ROC of CVOML-SLDC model on 30% of testing dataset
Tab. 1 and Fig. 13 reported the overall skin lesion classification results of the CVOML-SLDC model under distinct measures and aspects. The experimental results stated that the CVOML-SLDC model has gained effectual outcomes on all datasets. For instance, with entire dataset, the CVOML-SLDC model has resulted in an overall
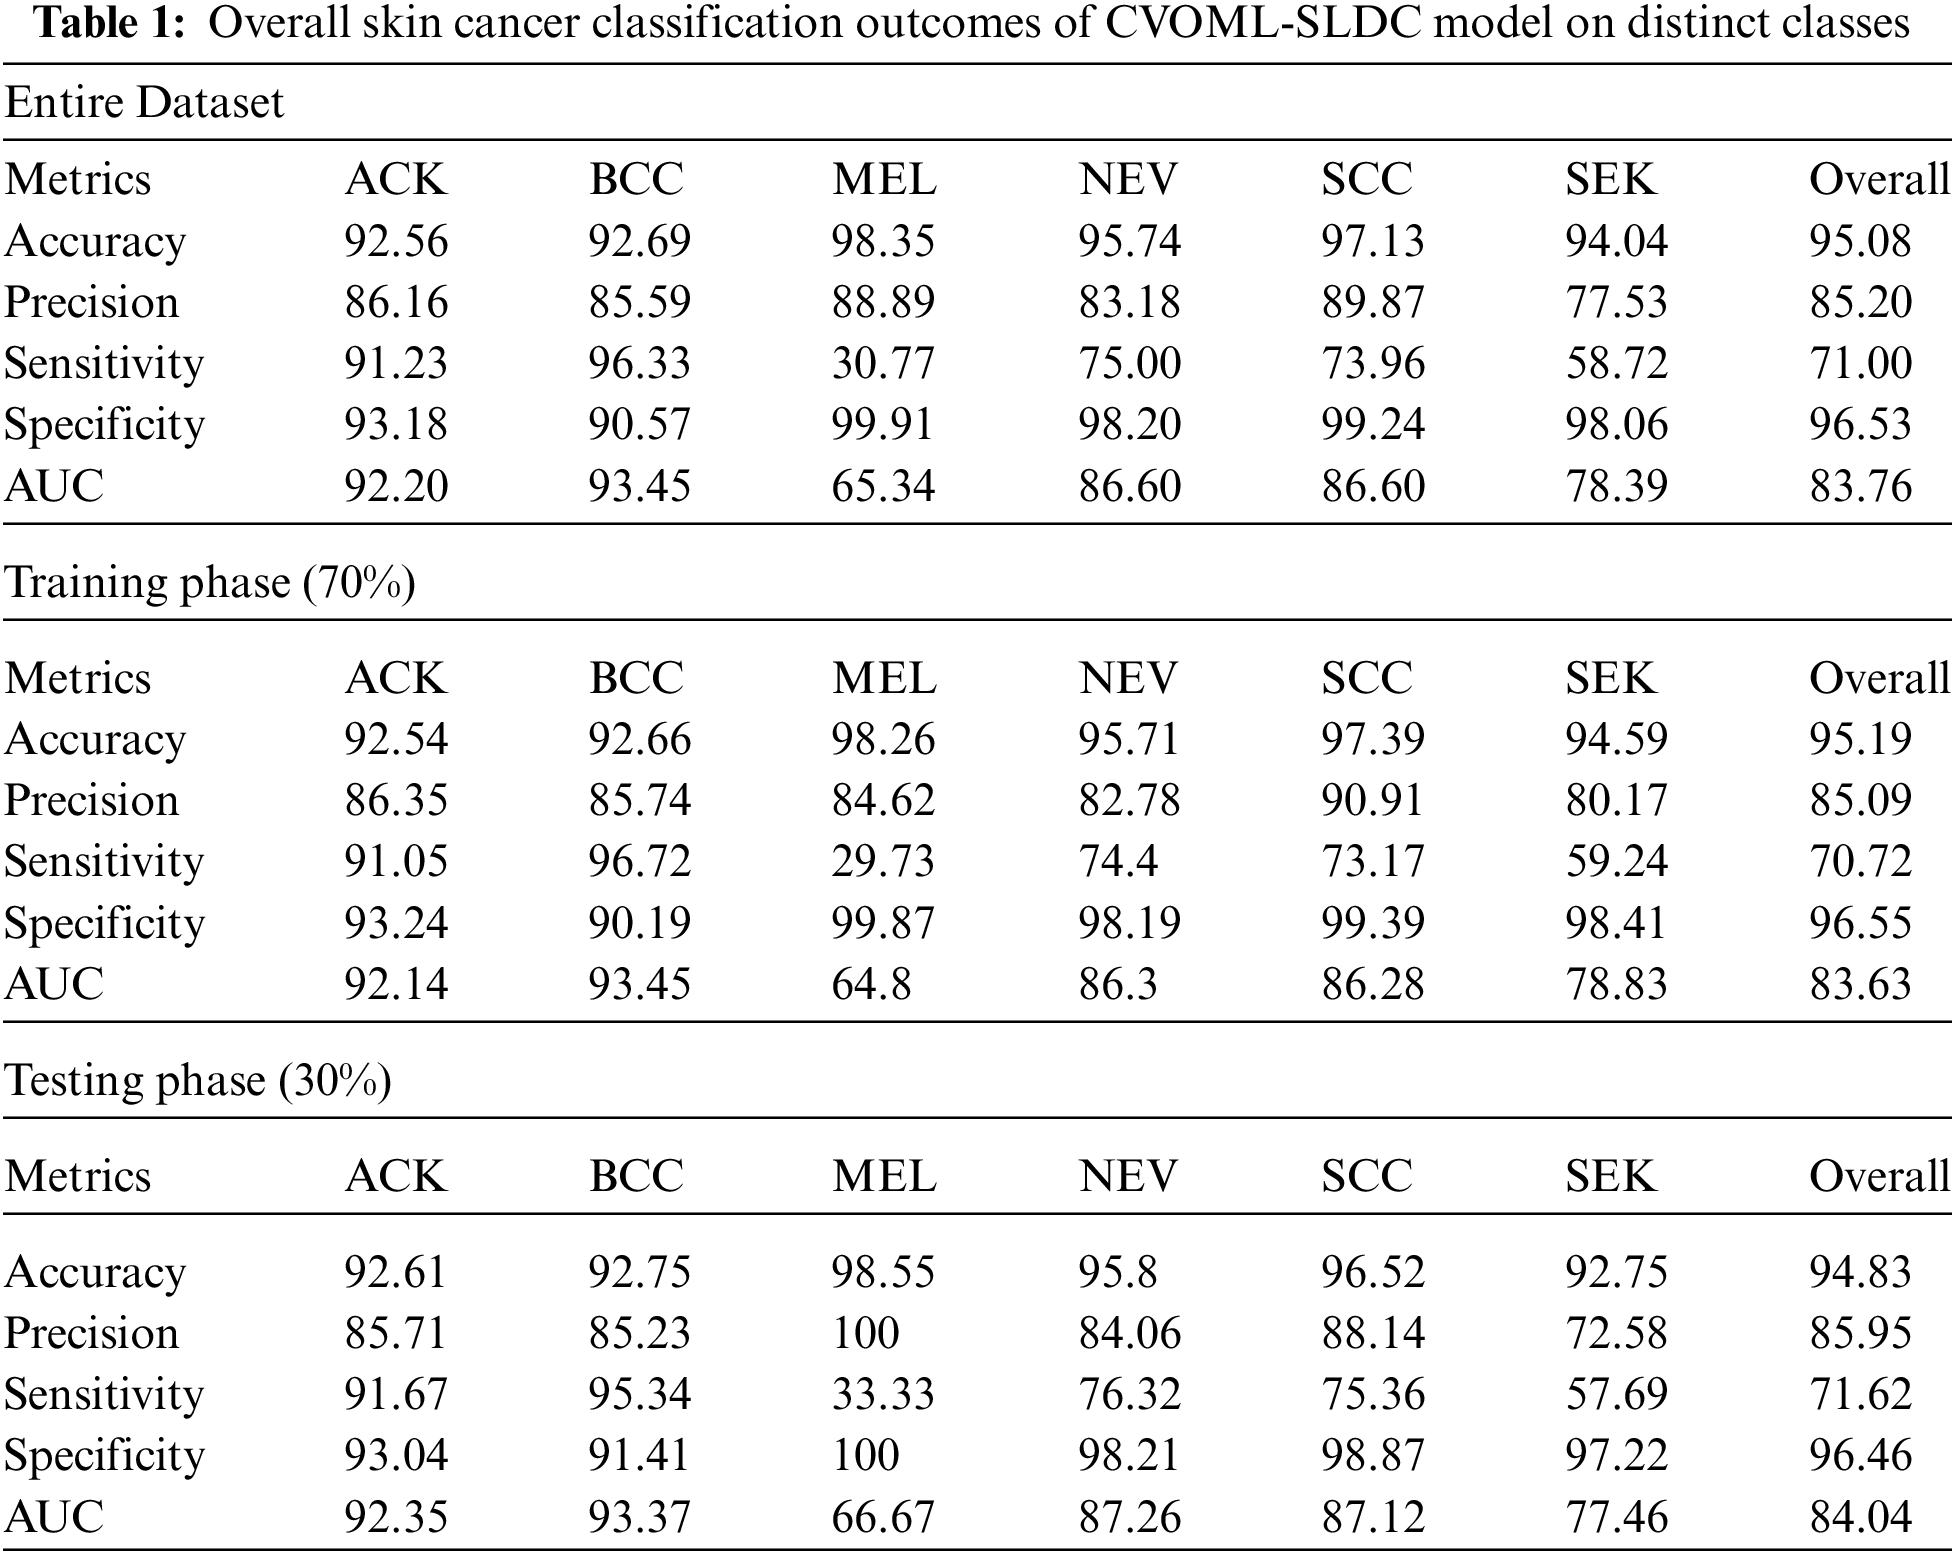
Figure 13: Comparison study of CVOML-SLDC model on benchmark dataset
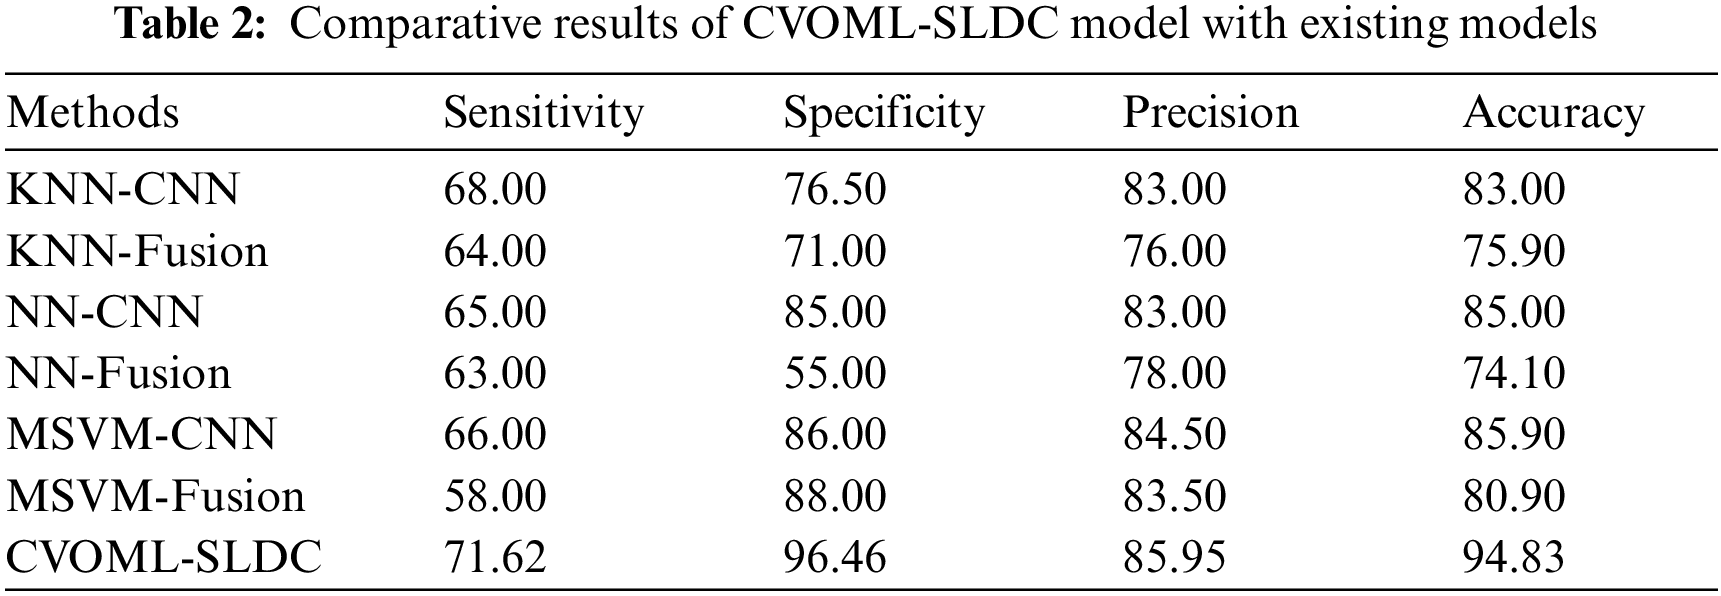
Finally, a detailed comparative study of the CVOML-SLDC model with recent models is made in Tab. 2 [21,22]. The experimental results indicated that the k-nearest neighbour (KNN)-Fusion and neural network (NN)-Fusion models have reached worse performance over the other methods. At the same time, the KNN-CNN and multi-class support vector machine (MSVM)-Fusion models have reached slightly enhanced outcomes. Followed by, the NN-CNN and MSVM-CNN models have accomplished moderately improved outcomes. However, the CVOML-SLDC model has reached maximum performance with
After observing the above mentioned tables and figures, it is demonstrated that the CVOML-SLDC model has resulted in maximum performance on the test datasets.
In this study, a new CVOML-SLDC technique has been developed to determine the appropriate class labels for the test dermoscopic images. The proposed CVOML-SLDC technique involves different levels of operations such as GF based pre-processing, graph cut segmentation, EfficientNet feature extraction, FFA based hyperparameter tuning, and NB classification. The application of FFA helps to effectually adjust the hyperparameter values of the EfficientNet model. The experimental analysis of the CVOML-SLDC model is performed using benchmark skin lesion dataset. The detailed comparative study of the CVOML-SLDC model reported the improved outcomes over the recent approaches interms of different evaluation metrics. Therefore, the CVOML-SLDC technique can be utilized as an effectual tool for skin lesion classification. In future, deep instance segmentation techniques can be derived to improve the detection outcomes of the CVOML-SLDC technique.
Funding Statement: The authors received no specific funding for this study.
Conflicts of Interest: The authors declare that they have no conflicts of interest to report regarding the present study.
1. A. Khamparia, P. Singh, P. Rani, D. Samanta, A. Khanna et al., “An internet of health things-driven deep learning framework for detection and classification of skin cancer using transfer learning,” Transactions on Emerging Telecommunications Technologies, vol. 32, no. 7, pp. e3963, 2021. [Google Scholar]
2. S. R. S. Jianu, L. Ichim, D. Popescu and O. Chenaru, “Advanced processing techniques for detection and classification of skin lesions,” in 2018 22nd Int. Conf. on System Theory, Control and Computing (ICSTCC), Sinaia, Romania, pp. 498–503, 2018. [Google Scholar]
3. E. Vocaturo, E. Zumpano and P. Veltri, “Image pre-processing in computer vision systems for melanoma detection,” in 2018 IEEE Int. Conf. on Bioinformatics and Biomedicine (BIBM), Madrid, Spain, pp. 2117–2124, 2018. [Google Scholar]
4. F. Bi, X. Ma, W. Chen, W. Fang, H. Chen et al., “Review on video object tracking based on deep learning,” Journal of New Media, vol. 1, no. 2, pp. 63–74, 2019. [Google Scholar]
5. X. R. Zhang, X. Sun, W. Sun, T. Xu and P. P. Wang, “Deformation expression of soft tissue based on BP neural network,” Intelligent Automation & Soft Computing, vol. 32, no. 2, pp. 1041–1053, 2022. [Google Scholar]
6. R. Garg, S. Maheshwari and A. Shukla, “Decision support system for detection and classification of skin cancer using CNN,” in Innovations in Computational Intelligence and Computer Vision, Advances in Intelligent Systems and Computing Book Series. Vol. 1189. Singapore: Springer, pp. 578–586, 2021. [Google Scholar]
7. M. A. Kassem, K. M. Hosny, R. Damaševičius and M. M. Eltoukhy, “Machine learning and deep learning methods for skin lesion classification and diagnosis: a systematic review,” Diagnostics, vol. 11, no. 8, pp. 1390, 2021. [Google Scholar]
8. A. Bhardwaj and P. P. Rege, “Skin lesion classification using deep learning,” in Advances in Signal and Data Processing, Lecture Notes in Electrical Engineering Book Series. Vol. 703. Singapore: Springer, pp. 575–589, 2021. [Google Scholar]
9. V. S. Saxena, P. Johri and A. Kumar, “AI-enabled support system for melanoma detection and classification,” International Journal of Reliable and Quality E-Healthcare, vol. 10, no. 4, pp. 58–75, 2021. [Google Scholar]
10. B. W. Y. Hsu and V. S. Tseng, “Hierarchy-aware contrastive learning with late fusion for skin lesion classification,” Computer Methods and Programs in Biomedicine, vol. 216, pp. 106666, 2022. [Google Scholar]
11. F. Afza, M. Sharif, M. A. Khan, U. Tariq, H. S. Yong et al., “Multiclass skin lesion classification using hybrid deep features selection and extreme learning machine,” Sensors, vol. 22, no. 3, pp. 799, 2022. [Google Scholar]
12. M. Nasir, M. A. Khan, M. Sharif, I. U. Lali, T. Saba et al., “An improved strategy for skin lesion detection and classification using uniform segmentation and feature selection based approach,” Microscopy Research and Technique, vol. 81, no. 6, pp. 528–543, 2018. [Google Scholar]
13. M. A. Khan, Y. D. Zhang, M. Sharif and T. Akram, “Pixels to classes: Intelligent learning framework for multiclass skin lesion localization and classification,” Computers & Electrical Engineering, vol. 90, pp. 106956, 2021. [Google Scholar]
14. H. C. Reis, V. Turk, K. Khoshelham and S. Kaya, “InSiNet: A deep convolutional approach to skin cancer detection and segmentation,” Medical & Biological Engineering & Computing, vol. 60, no. 3, pp. 643–662, 2022. [Google Scholar]
15. S. Benyahia, B. Meftah and O. Lézoray, “Multi-features extraction based on deep learning for skin lesion classification,” Tissue and Cell, vol. 74, no. 22, pp. 101701, 2022. [Google Scholar]
16. Z. Yang, Y. Zhao, M. Liao, S. Di and Y. Zeng, “Semi-automatic liver tumor segmentation with adaptive region growing and graph cuts,” Biomedical Signal Processing and Control, vol. 68, no. 6, pp. 102670, 2021. [Google Scholar]
17. G. Marques, D. Agarwal and I. de la Torre Díez, “Automated medical diagnosis of COVID-19 through EfficientNet convolutional neural network,” Applied Soft Computing, vol. 96, pp. 106691, 2020. [Google Scholar]
18. X. S. Yang, Firefly algorithm, levy flights and global optimization. In: Research and Development in Intelligent Systems XXVI. London: Springer, pp. 209–218, 2010. [Google Scholar]
19. D. A. Omondiagbe, S. Veeramani and A. S. Sidhu, “Machine learning classification techniques for breast cancer diagnosis,” IOP Conference Series: Materials Science and Engineering, vol. 495, pp. 012033, 2019. [Google Scholar]
20. A. G. C. Pacheco, G. R. Lima, A. S. Salomão, B. Krohling, I. P. Biral et al., “PAD-UFES-20: A skin lesion dataset composed of patient data and clinical images collected from smartphones,” Data in Brief, vol. 32, no. 2, pp. 106221, 2020. [Google Scholar]
21. M. A. Khan, M. I. Sharif, M. Raza, A. Anjum, T. Saba et al., “Skin lesion segmentation and classification: A unified framework of deep neural network features fusion and selection,” Expert Systems, pp. e12497, 2019. https://doi.org/10.1111/exsy.12497. [Google Scholar]
22. C. S. S. Anupama, L. Natrayan, E. L. Lydia, A. R. W. Sait and J. E. Gutierrez, “Deep learning with backtracking search optimization based skin lesion diagnosis model,” Computers Materials & Continua, vol. 70, no. 1, pp. 1297–1313, 2022. [Google Scholar]
 | This work is licensed under a Creative Commons Attribution 4.0 International License, which permits unrestricted use, distribution, and reproduction in any medium, provided the original work is properly cited. |