DOI:10.32604/cmc.2022.029605
| Computers, Materials & Continua DOI:10.32604/cmc.2022.029605 | |
| Article |
Meta-heuristics for Feature Selection and Classification in Diagnostic Breast Cancer
1Department of Computer Sciences, College of Computer and Information Sciences, Princess Nourah Bint Abdulrahman University, Riyadh, 11671, Saudi Arabia
2Department of Communications and Electronics, Delta Higher Institute of Engineering and Technology, Mansoura, 35111, Egypt
3Faculty of Artificial Intelligence, Delta University for Science and Technology, Mansoura, 35712, Egypt
4Communications and Computers Engineering Department, Faculty of Engineering, Delta University for Science and Technology, International Coastal Road, Gamasa City, Dakhliya, Egypt
5Faculty of Applied Health Science Technology, Delta University for Science and Technology, Mansoura, 35712, Egypt
6Faculty of Medicine, Head of Internal Medicine Department, Delta University for Science and Technology, Mansoura, Egypt
7Computer Engineering and Control Systems Department, Faculty of Engineering, Mansoura University, 35516, Mansoura, Egypt
8Department of Computer Science, Faculty of Computer and Information Sciences, Ain Shams University, 11566, Cairo, Egypt
9Department of Computer Science, College of Computing and Information Technology, Shaqra University, 11961, Saudi Arabia
*Corresponding Author: Amel Ali Alhussan. Email: aaalhussan@pnu.edu.sa
Received: 07 March 2022; Accepted: 07 April 2022
Abstract: One of the most common kinds of cancer is breast cancer. The early detection of it may help lower its overall rates of mortality. In this paper, we robustly propose a novel approach for detecting and classifying breast cancer regions in thermal images. The proposed approach starts with data preprocessing the input images and segmenting the significant regions of interest. In addition, to properly train the machine learning models, data augmentation is applied to increase the number of segmented regions using various scaling ratios. On the other hand, to extract the relevant features from the breast cancer cases, a set of deep neural networks (VGGNet, ResNet-50, AlexNet, and GoogLeNet) are employed. The resulting set of features is processed using the binary dipper throated algorithm to select the most effective features that can realize high classification accuracy. The selected features are used to train a neural network to finally classify the thermal images of breast cancer. To achieve accurate classification, the parameters of the employed neural network are optimized using the continuous dipper throated optimization algorithm. Experimental results show the effectiveness of the proposed approach in classifying the breast cancer cases when compared to other recent approaches in the literature. Moreover, several experiments were conducted to compare the performance of the proposed approach with the other approaches. The results of these experiments emphasized the superiority of the proposed approach.
Keywords: Breast cancer; image segmentation; dipper throated optimization; feature selection; meta-heuristics
Breast cancer is one of the most frequent malignancies in both genders, and it may lead to death in certain situations. It was estimated in 2019 that 334,200 cases of breast cancer had been detected among both females and males; 41,760 women and 500 men died from breast cancer. A variety of imaging modalities, including mammography, computed tomography (CT), ultrasound, Magnetic Resonance Imaging (MRI), and thermography are offered to women at high risk of breast cancer. Combining the benefits and drawbacks of several screening procedures might improve the quality of the results. Mammograms, a kind of X-ray that may identify even the tiniest of breast cancers, are recommended for women between the ages of 50 and 70 [1]. Because ultrasonography may identify more cancer cells than mammography, it may be utilized in place of a mammogram when the results are unfavorable. Over other screening procedures, it has the benefit of cheap cost and minimal ionizing radiation. Because they give more information, MRIs are more precise than X-rays in their diagnoses. Women with breast cancer might utilize it as a clinical diagnostic tool starting in the late 1980 s. When it comes to breast cancer prevention, it is vital for women over 30 with a high chance of developing the disease [2–4].
CT imaging delivers more detailed pictures of breast tissue compared to other modalities. For this reason, along with another screening technology that does not impose radiation on the screened people, CT is not adequate to correctly discover unhealthy breast cancer instances. To identify tumors in their earliest stages, thermal screening is an appropriate procedure. It is straightforward, safe, and inexpensive. Young women’s health may considerably benefit from this screening procedure. When utilizing thermal imaging, it is feasible to capture the patterns of the human body without releasing any radiation by using a functional picture rather than a structural image. Increased surface temperatures may be used to detect whether or not the breast cells are functioning properly. The Mastology Study using Infrared Image Dataset is the most widely used dataset in scientific research. Using a thermal picture, this article attempts to solve the difficulty of identifying breast cancer cells [5–9].
It is feasible to detect breast cancer cells using several methodologies based on asymmetry analysis, color analysis, feature extraction, feature selection, image segmentation, and neural networks [10]. In order to acquire the most accurate findings, thermal image analysis may be employed in a variety of ways. Despite the fact that thermal image analysis, preprocessing, and segmentation stages may assist in identifying breast cancer in its early stages, this approach is typically considered as the gold standard for identifying breast cancer cases. Preprocessing may be used to remove unwanted parts (such as arms and neck) of a thermal breast image in order to focus on the area of interest. This can be done by applying image segmentation to the image after converting it to grayscale [11]. In addition, the preprocessing stage may be used in the detection, augmentation, and normalization of a thermal image matrix [12]. Authors in [13] could enhance the thermal image regions by converting them from RGB (Red, Green, Blue) to HSV (Hue, Saturation, and Value). Other authors in [14] could enhance the thermal images by converting them from RGB to HIS (Hue, Intensity, and Saturation).
Image segmentation is critical to the identification of breast cancer. Segmentation results might have a negative impact on classification. The segmentation techniques can be automatic, semi- automatic, and manual [15]. Both post-segmentation and pre-segmentation approaches were applied by authors in [16]. The pre-segmentation approach may be used to eliminate and reduce the existing noise in the thermal images. Consequently, the final thermal picture seems to be completely uniform and homogenous. F-Optimized Fast Fuzzy c-mean (F-FCM) and Neutrosophic sets are two of the common techniques used in image segmentation. It has been noted that more data can be preserved with the FFCM approach than hard segmentation. Therefore automatic segmentation in most cases is better than manual segmentation. Two grayscale levels were created using the thresholding approach and the mathematical morphological operator in [17] for segmenting thermal pictures. The gray wolf optimizer along with quick-shift segmentation were used by authors in [18] to develop accurate thermal image classification.
In an optimization problem, the largest or smallest objective function value may be obtained from a set of inputs by solving the task in hand. From the field of machine learning, artificial neural networks (ANNs) are usually employed. Optimization methods that have been used for decades are now accessible to everyone. In addition, the currently available scientific code libraries provide researchers with dozens of technologies that assist them in achieving significant contributions in almost all research fields. Making a decision on which methodologies to utilize might be challenging due to the inherent problems of optimization. Maximizing the number of input parameters or arguments for a given function is the purpose of optimization. Optimization of continuous functions is prevalent in machine learning, where the input parameters of the tasks, such as floating-point values, may be numerical. It uses real-world data to assess the function. [19,20].
The challenges, known as combined optimization problems, may be distinguished by continuous function optimization [21]. Various methods may be used to organize, solve, and call problems with continuous functions. The methods of optimization categorization determine how much information about the objective function is used and exploited during the optimization process [22]. A thorough understanding of the target function is essential to maximizing efficiency while optimizing. When it comes to finding the target function in a single region, optimization procedures might differ significantly. To select a suitable solution, it suggests that the first derivative of the features may be used (route or gradient) [23–25].
It is the employment of metaheuristic methodologies in the optimization process that constitutes metaheuristic optimization. There’s a little bit of everything in here, from engineering to holiday planning to online travel. When it comes to everyday life, multimodal, non-linear, and limited communication is the norm. The objective functions of the task may collide. Therefore, a single goal may not always provide the most significant potential response. In most circumstances, it is hard to come up with a perfect or accurate solution. Anthrax optimization, swarm intelligence, and particle swarm optimization are examples of meta-heuristic algorithms [26–28]. There are two opposing goals in feature selection: to choose the fewest possible features and to get the highest possible classification accuracy. This problem may be seen as a multi-objective optimization problem. The best solution is the one that has the most distinguishing traits and the most significant degree of classification accuracy [29,30]. In the context of feature selection, metaheuristic algorithms are vital since they take into account the dimensions of the data set to forecast. Due to dimensionality creep in large datasets, classification techniques’ accuracy declines. High-dimensional data sets have a variety of limitations, including extended model construction periods and duplicate information, that make data analysis challenging. Resolving this problem will need feature selection. By eliminating ambiguous, noisy, and unnecessary information from the data set, we may both lower the size of the data set and improve the quality of the classification or clustering model.
In this paper, we propose a novel approach for diagnosing the breast cancer regions accurately, based on applying meta-heuristics for feature selection. The proposed approach starts with thermal image preprocessing, then image segmentation and feature extraction. The selection of the relevant features is performed in terms of the binary dipper throated optimization algorithm. The selected features are used to train and test an optimized neural network. The optimization of the neural network is performed through the continuous version of the dipper throated optimization algorithm.
The organization of this paper comes as follows. Section 2 presents a review of the previous studies in the literature that address breast cancer. The proposed methodology is then discussed in Section 3, followed by a detailed explanation of the achieved experimental results in Section 3. Finally, the conclusions and future perspectives of this research come in Section 4.
Segmentation of Region of Interest (ROI) must be defined in order to construct a Computer-Aided Diagnosis (CAD) system for early breast cancer detection. The breast ROI segmentation is meant to distinguish the breast from the rest of the body. Breast cancer categorization based on thermography was suggested in [31] by the authors. Thermal imaging of the breast is classified into three categories: normal, benign, and cancerous. Multi-class support vector machine (SVM) classification is performed after preprocessing and segmentation (SVM) [32]. Curvature and gradient vector flow is used to segment images. Breast cancer data were classified using a convolutional neural network (CNN). Extracting features was accomplished using binary masking, clustering using k-means, and a signature boundary technique. Authors in [33] employed MLP and Extreme Learning Machines (ELM) for breast cancer classification. Automated segmentation of breast pictures into the right and left breasts was developed by the authors of [34] via the use of preprocessing, segmentation, and separation. It was just the segmentation ROI that was utilized to extract features. SVMs and artificial neural networks (ANNs) were then used to gather the correct data.
These researchers demonstrated their approach for differentiating the right and left breasts by detecting the top, left, lower and right boundaries [35]. Upper and lower boundaries were detected using a horizontal projection profile (HPP) and a vertical projection profile (VPP). The authors in that research were able to separate the right and left breasts using an asymmetry analysis approach after discovering the site of intersection after applying HPP. Colors were classified for Lab mode using k-means clustering, and a segmentation approach termed hot area segmentation method once the RGB mode conversion was complete using the k-means clustering methodology [36]. By evaluating three thermal photos of a patient, which were either healthy or malignant, this system was able to diagnose breast cancer by using machine learning methods [37]. Various feature extraction methods were applied once the ROI was partitioned. To categorize data, they employed ANN and SVM algorithms.
In the identification of breast cancer cells, thermal image segmentation is a crucial step. It is possible that a mistake in segmenting the region of interest (ROI) would impair classification accuracy at a later stage. In order to extract the ROI from pictures of breast cancer, many segmentation approaches have been established in the literature so far. This work attempts to make it simpler to extract the ROI (breast area) from thermal pictures, which can subsequently be used to assess if the breasts are symmetrical or not, as well as their size. The feature selection methods and model optimization approaches such as Particle swarm optimization (PSO), Grey Wolf Optimization (GWO) algorithm, Firefly Algorithm (FA), Butterfly Optimization Algorithm (BOA), Differential Evolution (DE), Genetic Algorithm (GA), are usually utilized recently by many researchers in the literature [38,39].
In this section, the steps of the proposed methodology are presented and discussed. The full process of the proposed approach is depicted in Fig. 1. Based on the figure, the section starts with introducing the dataset of breast cancer thermal images, followed by the steps of the proposed approach including thermal image preprocessing, data augmentation, thermal image segmentation, feature extraction, feature selection, and neural network optimization.
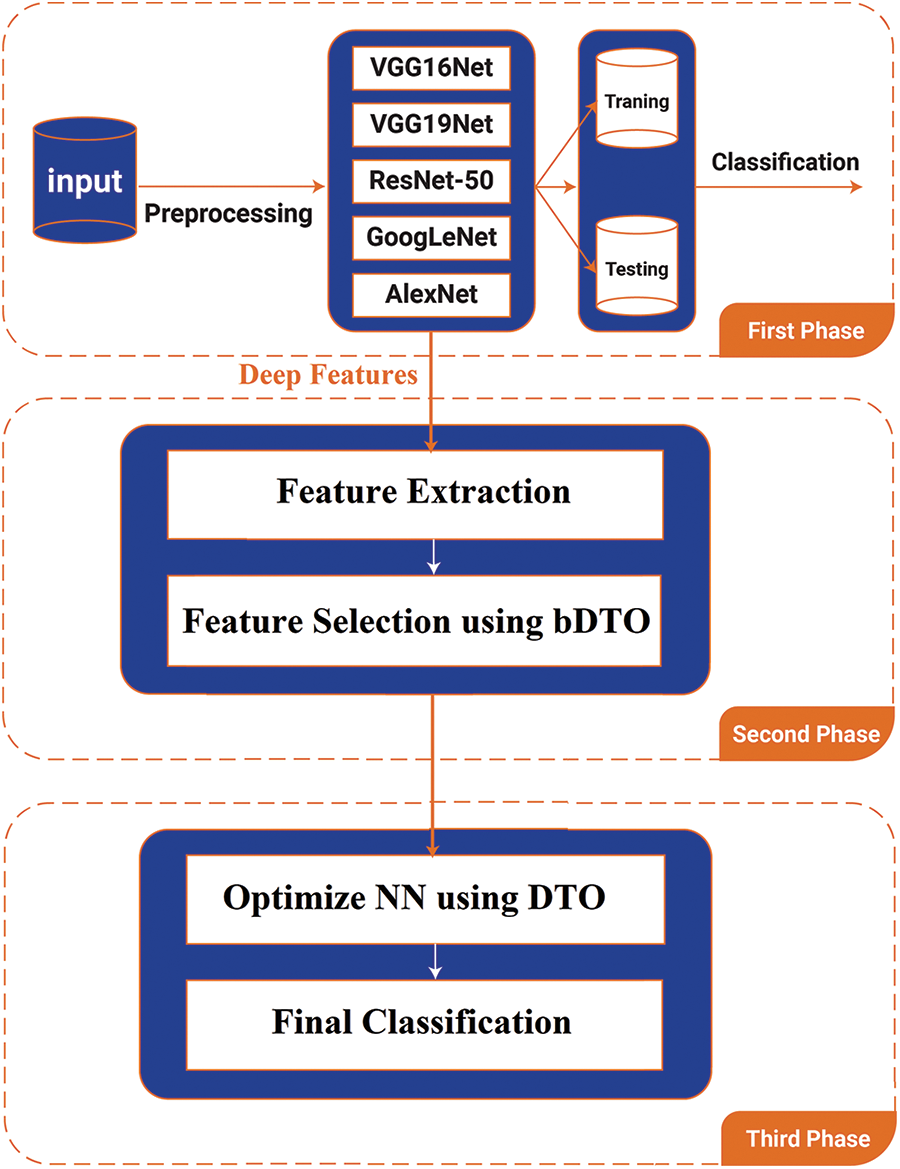
Figure 1: The process of the proposed breast cancer diagnosis approach
The dataset employed in this research is freely available online [40]. The dataset consists of 2650 images of various cases of women. Frontal thermal images of healthy and unhealthy women can be observed in Fig. 2, as depicted. While collecting this dataset, it is required to deal with a few issues, including patient instructions, examination room conditions, and capture positions when obtaining a thermal image for cancer diagnosis. To prevent the body’s physiology from changing in an uncontrolled setting, a regulated environment must be employed. Cosmetics, deodorants, lotions, exercises, booze, caffeine, and sun exposure should all be avoided by the patient as a result of the uncontrolled zone. To get a thermal image, the temperature of the room must be between 18 and 22 degrees Celsius. The amount of light and heat in the space should be maintained to a minimum. For the finest ROI (return on investment) image of her breasts and underarms, she stands in front of the camera with her hands on her head [0.8 to 1.2 m], depending on her size.
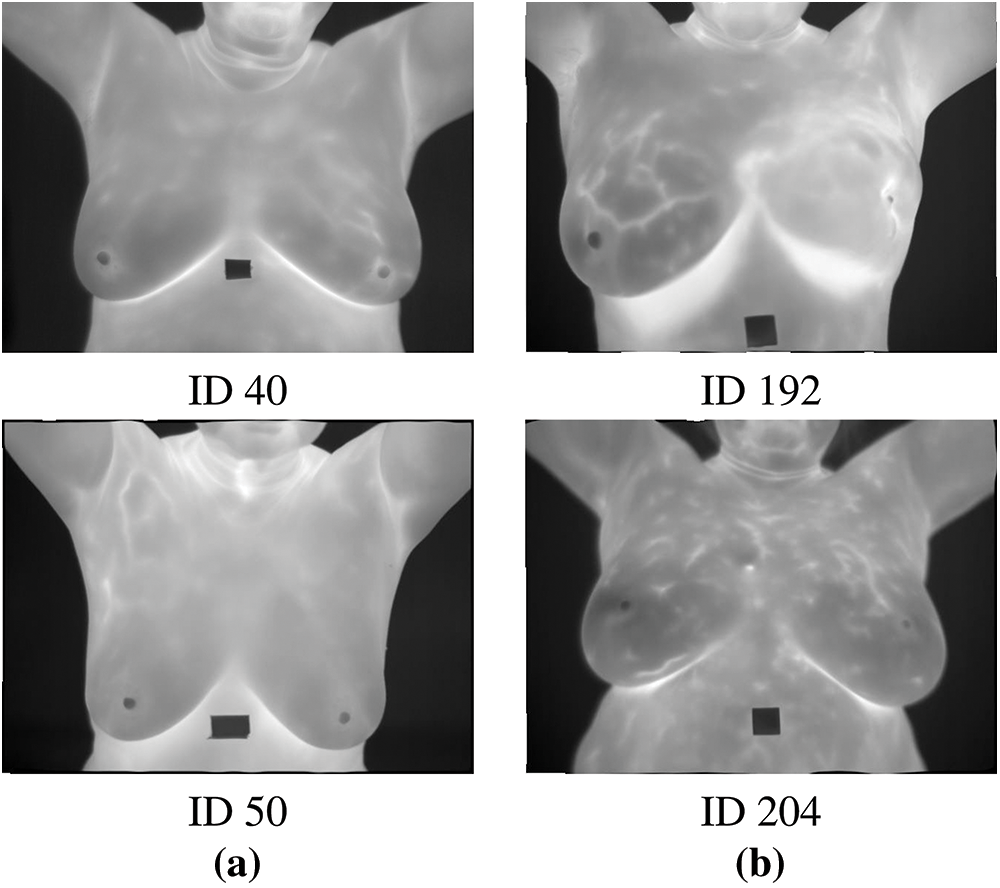
Figure 2: Sample thermal images (healthy and unhealthy) from the dataset
One of the important steps of thermal image preprocessing is scaling the input images to fit the models used in feature extraction, such as AlexNet and GoogleNet. These models require images of specific sizes to work properly. In this work, the input images of the given dataset are scaled to match the required sizes. The images are scaled to 227 × 228 for AlexNet and 220 × 220 for AlexNet. Despite the fact that all detected patches are grayscale, both AlexNet and GoogleNet need RGB input photographs since they were trained on colored images. The single channel of each image is copied to make a three-channel RGB image, which is then turned into RGB images.
To train deep learning models, a big database is needed, and this is a problem with the medical picture datasets that are currently available [24]. In order to meet this problem, data augmentation is employed to expand the size of the mammography datasets used during training. There are several benefits to data augmentation, including solving overfitting issues and increasing the DCNN model’s scalability. Rotating each detected patch with angles (0°, 90°, 180°, and 270°), then flipping these four pictures from left to right to obtain eight images for each patch as illustrated in Fig. 3, was used in this study.
The segmentation technique presented in [1] is used to extract breast cancer from thermal pictures in both healthy and unhealthy situations. It is shown in Algorithm 1 how a breast cancer thermal image is segmented using the segmentation algorithm. It starts with a quickshift-based chaotic salp swarm optimizer to create superpixel images. Thermal pictures are segmented into groups of superpixels by using a quick-shift algorithm that employs a set of optimal parameters. Finally, Otsu’s approach is used to apply a threshold to the binary picture. The binary picture is used to extract the breast pixels from the ROI image [1].
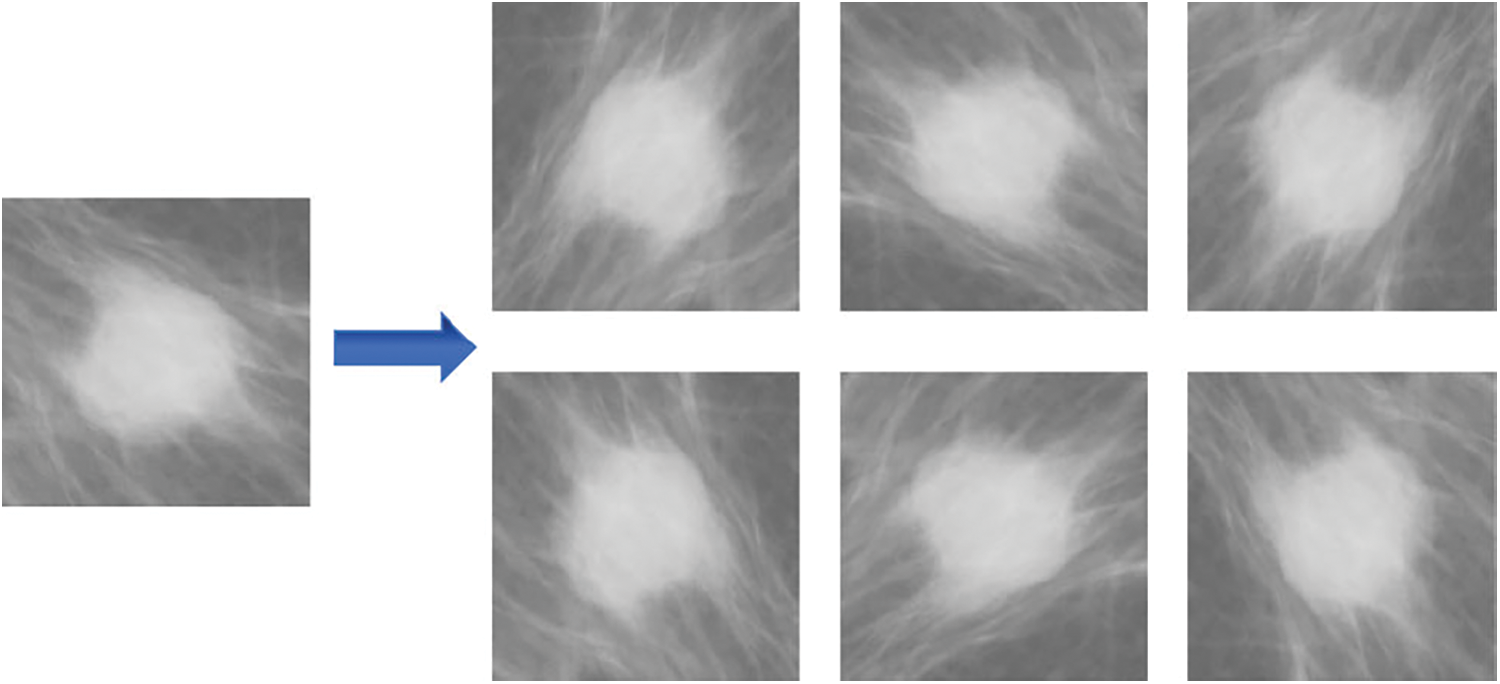
Figure 3: The process of data augmentation. The first row represents the rotation of the left image by angles (90°, 180°, and 270°), and the flipping of images in the first row as shown in the second row

To extract a set of deep features from the segmented thermal images, these images are fed to four types of deep networks to be trained and tested by means of transfer learning. These deep networks are VGG16Net, VGG19Net, ResNet-50, GoogLeNet, and AlexNet. The target features are extracted from the last pooling layer of the model that achieves the best performance. Fig. 3 depicts the process of feature extraction. On the other hand, the extracted feature set might contain features that might negatively affect the classification performance due to their high correlation. In this case, these features are considered redundant and should be ignored. In order to eliminate these redundant features, the feature selection process is applied to keep only the most relevant features that significantly affect the classification results. For the dataset set employed in this research, the best performance was recorded by the GoogLeNet deep network model, and thus, this model is used for feature extraction.
There are a lot of duplicate features in the feature set calculated using the pre-trained deep neural network, and this might significantly impact the classification performance. In other words, the effective training of classification models begins with the selection of important features. Training time may be reduced, the classification model becomes simpler, and overfitting can be avoided by using feature selection. To perform feature selection, the output solution should be modified from a continuous solution to a binary solution utilizing the numbers 0 or 1. The following function is usually used to convert the continuous solution of an optimizer to a binary solution in optimization problems.
Fitness functions can be used to determine the quality of an optimizer’s output. Classification and regression errors and the features selected for the input images are the key factors of the fitness function. Choose a solution with the lowest possible categorization error rate rather than one based on a long list of specific qualities. In order to assess the quality of the selected features, the following equation is employed. Algorithm 2 presents the detailed steps of the feature selection method implemented in this research [41].

3.7 Dipper Throated Optimization Algorithm
As its name suggests, the Cinclidsae family of birds contains the Dipper Throated bird, known for its bobbing or dipping movements when perched. A bird’s capacity to dive, swim, and hunt underwater distinguishes it from other passerines. Small and flexible wings enable it to fly straight and fast with no pauses or glides. Fast bowing movements and a white breast give the Dipper Throated bird a particular hunting approach. No matter how turbulent or fast-flowing the water is, it dives headlong into it to get its prey. Aquatic invertebrates, aquatic insects, and small fish suffer as it sinks and takes up rocks and stones. The dipper walks on the ocean floor using its hands. You may find prey by bending your body at an angle and walking down the bottom of the water with your head lowered. As well, it can dive into the water and deliberately immerse itself, utilizing its wings to drive itself through the water and letting it to stay underwater for an extended amount of time. Mathematically speaking, the Dipper-Throated Optimization (DTO) approach posits that a group of birds is swimming and flying in search of food supplies. The birds locations (BL) and speeds (BS) of the birds may be represented using the matrices below. The binary DTO is adopted for feature selection. In contrast, the continuous DTO is used to optimize the parameters of the neural network used in the classification process [41–43].
where the
where each bird’s quest for food is reflected in its fitness score. Mother bird is the ideal value. Sorting is done by ascending the values.
where n is the iteration number in which
The number of iterations
Normal birds’ new location
In this case,
where R is a random number between 0 and 1, and
The conducted experiments are presented and discussed in this section. As the first step after preprocessing the dataset is to segment the regions of interest to be considered for further processing, Fig. 4 shows the results of the segmentation process. As shown in the figure, the output of each step in the segmentation process is presented in the figure. Although the result is shown in Fig. 4d, we applied image filtering to get more enhanced images to achieve accurate classification results; thus, the final result of the image segmentation process is shown in Fig. 4e. This image is fed to the feature extraction and feature selection to select the most significant features for further processing and classification.
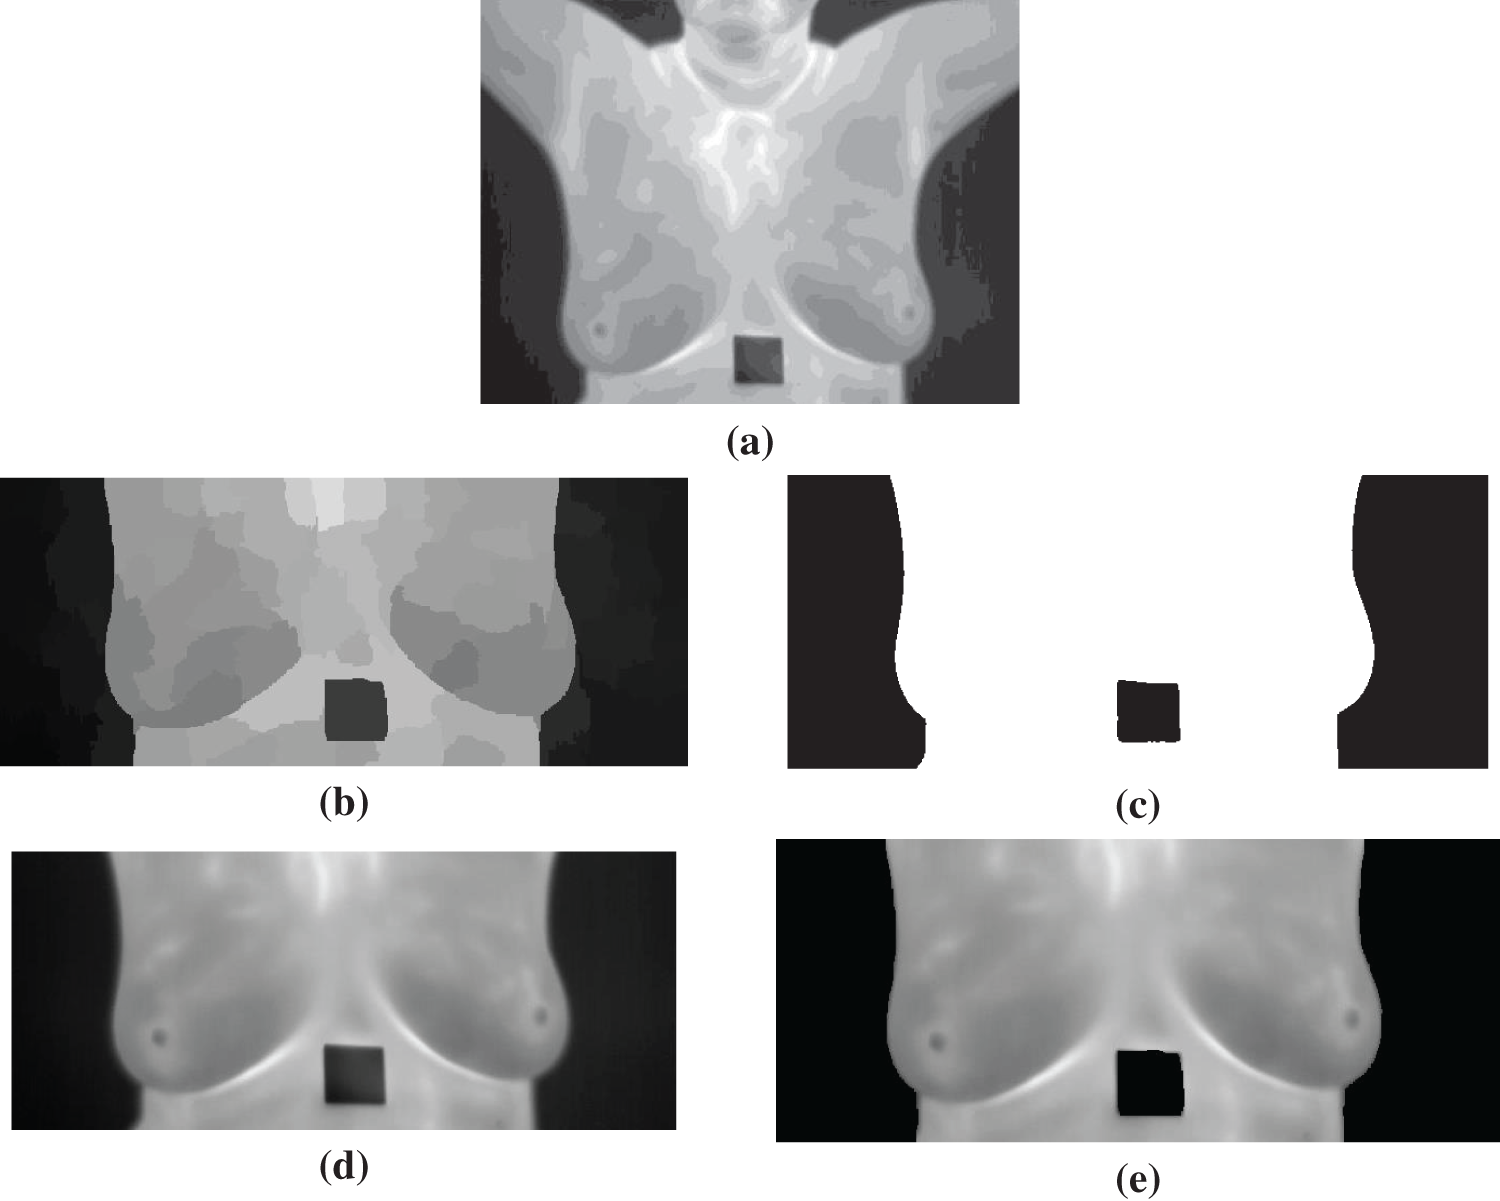
Figure 4: Segmentation results for the thermal image from the dataset (a) Original image, (b) Quick-Shift superpixels, (c) Otsu’ thresholding result, (d) Final segmented image, (e) Filtered final image
Once the regions of interest are extracted from the dataset, the dataset is split into training and testing sets to train a group of deep learning models. These models are already trained on a vast dataset, and the dataset in hands is used for transfer learning. The results from the classification using the four deep networks are presented in Tab. 1. The primary purpose of this experiment is to determine which model is the best for feature extraction. As shown in the table, the best result is achieved by the GoogLeNet deep network. Therefore, we adopted this network for feature extraction.

To select the significant features, a set of experiments was conducted based on ten different approaches. However, to evaluate the results of these approaches, the evaluation criteria presented in Tab. 2 are employed.

The results from the ten feature selection approaches are presented in Tab. 3. As shown in the table, the best results are achieved by the binary DTO, where the average error is (0.3165), which is the lowest value among the other approaches. In addition, the best fitness is achieved by the binary DTO. Therefore, we adopted this approach for selecting the compelling features resulting from the feature extraction process.

On the other hand, another set of experiments is conducted to determine the best classifier that can be used for classifying breast cancer cases based on the selected features. The classifiers employed in these experiments are K-nearest neighbors (KNN), support vectors machine (SVM), random forests, and neural networks (NN). The recorded classification results using these traditional classifiers are presented in Tab. 4. As shown in the table, the best classification results are achieved by NN classifier. Therefore, we selected this classifier for optimization to improve its performance and achieve better results.

The parameters of the adopted NN classifier are optimized through a set of experiments in which five optimizers (whale optimization algorithm (WOA), gray wolf optimizer (GWO), genetic algorithm (GA), particle swarm optimizer (PSO), and DTO) were employed. Tab. 5 presents the evaluation results of each of these five optimizers. As shown in the table, the best results are achieved by the proposed approach based on the optimization of NN using DTO.

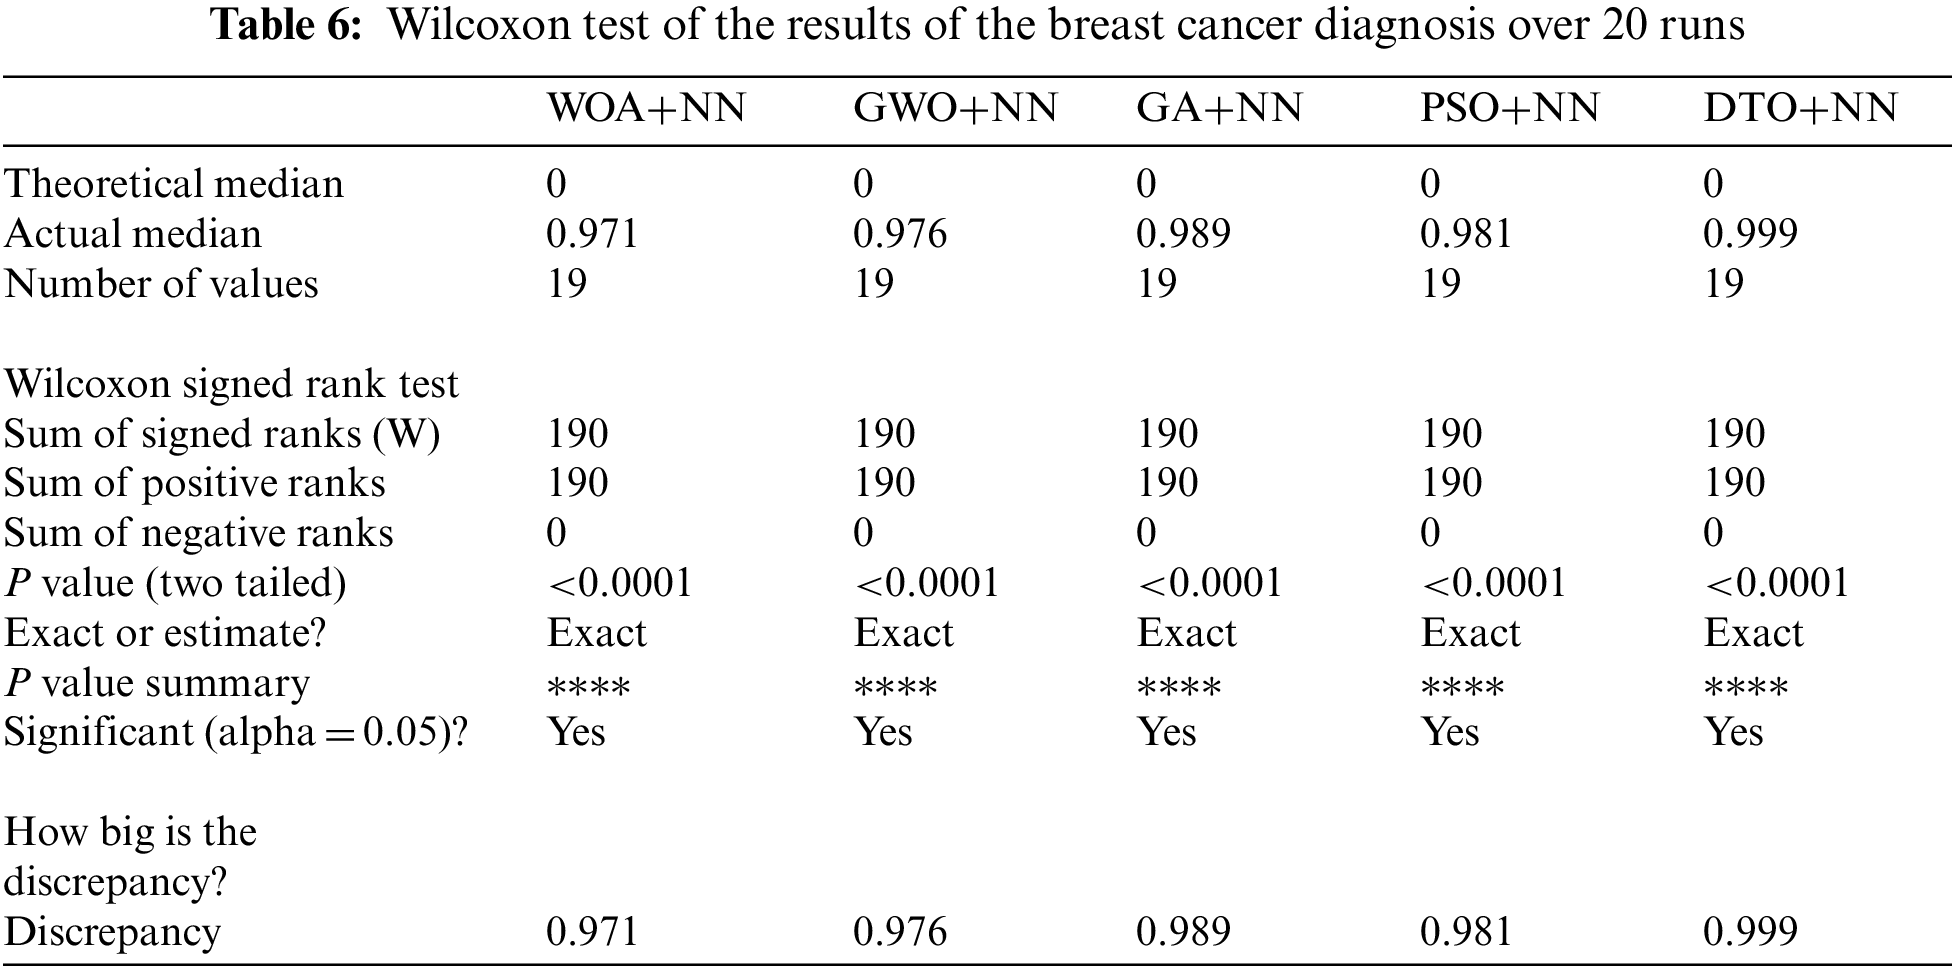
On the other hand, the Wilcoxon signed-rank test of the achieved results using the proposed DTO+NN along with the other optimization approaches is presented in Tab. 6. These results show that the proposed approach achieves the lowest discrepancy values when compared with the other approaches.
Moreover, The ANOVA test results using the classified breast cancer cases are presented in Tab. 7. These results prove the superiority of the proposed approach and its effectiveness for the task of breast cancer diagnosis.

The overall accuracy of the proposed approach with comparison to the other approaches is presented in Fig. 5. As shown in the figure, the proposed approach could achieve significant accuracy with different test cases. However, the accuracy of the other approaches ranges from low accuracy to high accuracy, depending on the test case. These results prove the stability of the proposed approach in accurately classifying breast cancer cases.
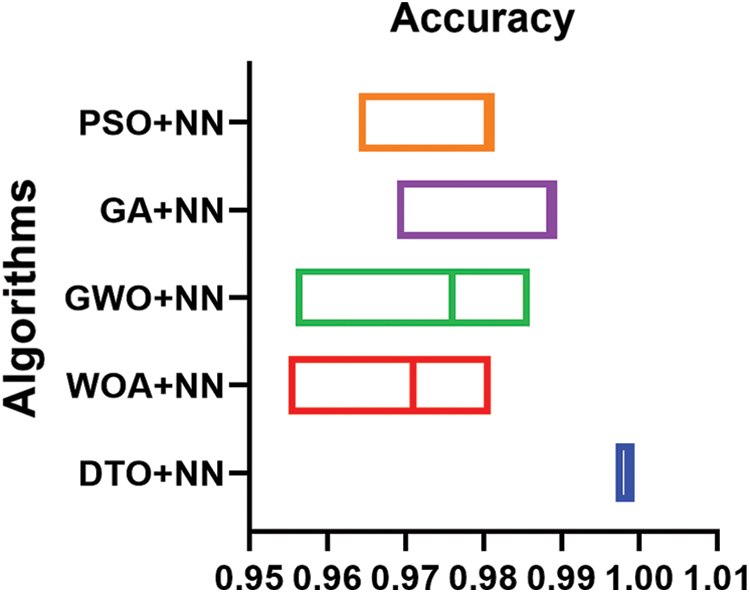
Figure 5: Overall accuracy of classification results achieved by the proposed approach and other approaches
In this paper, we propose a novel approach for accurately classifying breast cancer cases. The proposed approach is based on preprocessing the thermal images and extracting features using GoogLeNet. These features are processed using binary dipper throated optimizer (DTO) to select the most effective features for further processing. On the other hand, we utilized DTO to optimize the parameters of a neural network to improve its performance. The optimized neural network is trained using the features selected by the binary DTO. The performance of this approach is evaluated and compared with other approaches to prove its efficiency. Experimental results showed the superiority of the proposed approach and its stability in classifying breast cancer cases. In addition, statistical analysis is performed in terms of the Wilcoxon and ANOVA test to emphasize the effectiveness of the proposed approach. The overall results achieved by the proposed approach outperform the corresponding results using the other approaches. The future perspective of this research is to integrate the proposed approach with other optimized machine learning models to exploit the advantage of the high performance of the ensemble models.
Acknowledgement: Princess Nourah bint Abdulrahman University Researchers Supporting Project number (PNURSP2022R308), Princess Nourah bint Abdulrahman University, Riyadh, Saudi Arabia.
Funding Statement: Princess Nourah bint Abdulrahman University Researchers Supporting Project number (PNURSP2022R308), Princess Nourah bint Abdulrahman University, Riyadh, Saudi Arabia.
Conflicts of Interest: The authors declare that they have no conflicts of interest to report regarding the present study.
1. A. Ibrahim, S. Mohammed, H. Ali and S. Hussein, “Breast cancer segmentation from thermal images based on chaotic salp swarm algorithm,” IEEE Access, vol. 8, pp. 122121–122134, 2020. [Google Scholar]
2. M. Etehadtavakol and E. Ng, “Breast thermography as a potential non-contact method in the early detection of cancer: A review,” Journal of Mechanics in Medicine and Biology, vol. 13, no. 2, pp. 1330001, 2013. [Google Scholar]
3. J. Shan, “A fully automatic segmentation method for breast ultrasound images,” Ph.D. dissertation, Department of Computer Science, Utah State Univ., Logan, UT, USA, 2011. [Google Scholar]
4. C. Sehgal, S. Weinstein, P. Arger and E. Conant, “A review of breast ultrasound,” Journal of Mammary Gland Biol Neoplasia, vol. 11, no. 2, pp. 113–123, 2006. [Google Scholar]
5. T. Nelson, L. Cervino, J. Boone and K. Lindfors, “Classification of breast computed tomography data,’’ Medical Physics, vol. 35, no. 3, pp. 1078–1086, 2008. [Google Scholar]
6. A. Jalalian, S. Mashohor, R. Mahmud, B. Karasfi, M. Iqbal Saripan et al., “Computer-assisted diagnosis system for breast cancer in computed tomography laser mammography (CTLM),” Journal of Digital Imaging, vol. 30, no. 6, pp. 796–811, 2017. [Google Scholar]
7. P. P. R. Pavithra, R. Ravichandran, S. Sekar and M. Manikandan, “The effect of thermography on breast cancer detection: A survey,’’ Systematic Reviews in Pharmacy, vol. 9, no. 1, pp. 10–16, 2018. [Google Scholar]
8. S. Prabha, C. Sujatha and S. Ramakrishnan, “Asymmetry analysis of breast thermograms using BM3D technique and statistical texture features,” in Proc. of Int. Conf. on Informatics, Electronics and Visualization, Dhaka, Bangladesh, pp. 1–4, 2014. [Google Scholar]
9. L. Silva, D. Saade, G. Sequeiros, A. Silva, A. Paiva et al., “A new database for breast research with infrared image,” Journal of Medical Image and Health Informatics, vol. 4, no. 1, pp. 92–100, 2014. [Google Scholar]
10. S. Mambou, P. Maresova, O. Krejcar, A. Selamat and K. Kuca, “Breast cancer detection using infrared thermal imaging and a deep learning model,” Sensors, vol. 18, no. 9, pp. 2799, 2018. [Google Scholar]
11. L. Ehsan and F. Mohammad, “Early breast cancer detection in thermogram images using AdaBoost classifier and fuzzy C-means clustering algorithm,” Middle East Journal of Cancer, vol. 7, no. 3, pp. 113–124, 2016. [Google Scholar]
12. A. Lashkari and M. Firouzmand, “Developing a toolbox for clinical preliminary breast cancer detection in different views of thermogram images using a set of optimal supervised classifiers,” Scientific Iranica, vol. 25, no. 3, pp. 1545–1560, 2018. [Google Scholar]
13. A. Habibi and M. Shamsi, “A novel color reduction based image segmentation technique for detection of cancerous region in breast thermograms,” Ciencia Natura, vol. 37, pp. 380–387, 2015. [Google Scholar]
14. N. Mohamed, “Breast cancer risk detection using digital infrared thermal images,” International Journal Bioinformatics and Biomedical Engineering, vol. 1, no. 2, pp. 185–194, 2015. [Google Scholar]
15. S. Kamath, K. Prasad and K. V. Rajagopal, “Segmentation of breast thermogram images for the detection of breast cancer: A projection profile approach,’’ Journal of Image and Graphics, vol. 3, no. 1, pp. 47, 2015. [Google Scholar]
16. T. Gaber, G. Ismail, A. Anter, M. Soliman, M. Ali et al., “Thermogram breast cancer prediction approach based on neutrosophic sets and fuzzy c-means algorithm,” in Proc. of the 37th Annual Int. Conf. on IEEE Engineering and Medical Biology Society (EMBC), Milan, Italy, pp. 4254–4257, 2015. [Google Scholar]
17. T. Mejia, M. Perez, V. Andaluz and A. Conci, “Automatic segmentation and analysis of thermograms using texture descriptors for breast cancer detection,” in Proc. of Asia Pacific Conf. on Computer Aided System Engineering, Quito, Ecuador, pp. 24–29, 2015. [Google Scholar]
18. A. Ibrahim, A. Tharwat, T. Gaber and A. Hassanien, “Optimized superpixel and AdaBoost classifier for human thermal face recognition,” Signal, Image Video Processing, vol. 12, no. 4, pp. 711–719, 2018. [Google Scholar]
19. A. Ibrahim, H. Ali, M. Eid and E. -S. M. El-kenawy, “Chaotic harris hawks optimization for unconstrained function optimization,” in Int. Computer Engineering Conf. (ICENCO), Cairo, Egypt, pp. 153–158, 2020. [Google Scholar]
20. M. Eid, E. -S. M. El-kenawy and A. Ibrahim, “A binary sine cosine-modified whale optimization algorithm for feature selection,” in National Computing Colleges Conference (NCCC), Taif, Saudi Arabia, pp. 1–6, 2021. [Google Scholar]
21. E. -S. M. El-Kenawy, S. Mirjalili, A. Ibrahim, M. Alrahmawy, M. El-Said et al., “Advanced meta-heuristics, convolutional neural networks, and feature selectors for efficient COVID-19 X-ray chest image classification,” IEEE Access, vol. 9, pp. 36019–36037, 2021. [Google Scholar]
22. E. -S. M. El-Kenawy, S. Mirjalili, S. M. Ghoneim, M. M. Eid, M. El-Said et al., “Advanced ensemble model for solar radiation forecasting using sine cosine algorithm and newton’s laws,” IEEE Access, vol. 9, pp. 115750–115765, 2021. [Google Scholar]
23. A. Ibrahim, S. Mirjalili, M. El-Said, S. S. M. Ghoneim, M. Alharthi et al., “Wind speed ensemble forecasting based on deep learning using adaptive dynamic optimization algorithm,” IEEE Access, vol. 9, pp. 1–18, 2021. [Google Scholar]
24. A. A. Salamai, E. -S. M. El-kenawy and A. Ibrahim, “Dynamic voting classifier for risk identification in supply chain 4.0,” Computers, Materials & Continua, vol. 69, no. 3, pp. 3749–3766, 2021. [Google Scholar]
25. E. S. M. El-Kenawy, M. Eid, M. Saber and A. Ibrahim, “MbGWO-SFS: Modified binary grey wolf optimizer based on stochastic fractal search for feature selection,” IEEE Access, vol. 8, pp. 107635–107649, 2020. [Google Scholar]
26. M. M. Fouad, A. I. El-Desouky, R. Al-Hajj and E. -S. M. El-Kenawy, “Dynamic group-based cooperative optimization algorithm,” IEEE Access, vol. 8, pp. 148378–148403, 2020. [Google Scholar]
27. E. S. M. El-Kenawy, A. Ibrahim, S. Mirjalili, M. M. Eid and S. E. Hussein, “Novel feature selection and voting classifier algorithms for COVID-19 classification in CT images,” IEEE Access, vol. 8, pp. 179317–179335, 2020. [Google Scholar]
28. A. Ibrahim, M. Noshy, H. A. Ali and M. Badawy, “PAPSO: A power-aware VM placement technique based on particle swarm optimization,” IEEE Access, vol. 8, pp. 81747–81764, 2020. [Google Scholar]
29. E. M. Hassib, A. I. El-Desouky, L. M. Labib and E. -S. M. T. El-Kenawy, “WOA + BRNN: An imbalanced big data classification framework using whale optimization and deep neural network,” Soft Computing, vol. 24, pp. 5573–5592, 2020. [Google Scholar]
30. S. Mirjalili, “SCA: A sine cosine algorithm for solving optimization problems,” Knowledge-Based Systems, vol. 96, pp. 120–133, 2016. [Google Scholar]
31. A. Ahmed, M. Ali and M. Selim, “Bio-inspired based techniques for thermogram breast cancer classification,’’ International Journal of Intelligent Engineering Systems, vol. 12, no. 2, pp. 114–124, 2019. [Google Scholar]
32. S. Tello-Mijares, F. Woo and F. Flores, “Breast cancer identification via thermography image segmentation with a gradient vector flow and a convolutional neural network,” Journal of Healthcare Engineering, vol. 2019, pp. 1–13, 2019. [Google Scholar]
33. F. AlFayez, M. W. A. El-Soud and T. Gaber, “Thermogram breast cancer detection: A comparative study of two machine learning techniques,” Applied Sciences, vol. 10, no. 2, pp. 551–565, 2020. [Google Scholar]
34. H. Aya, M. H. Hany and M. Hala, “Automatic image segmentation method for breast cancer analysis using thermography,’’ Journal of Engineering Science, vol. 46, pp. 12–32, 2018. [Google Scholar]
35. D. Sathish, S. Kamath, K. Prasad, R. Kadavigere and R. Martis, “Asymmetry analysis of breast thermograms using automated segmentation and texture features,” Signal, Image Video Processing, vol. 11, no. 4, pp. 745–752, May 2017. [Google Scholar]
36. S. Shahari and A. Wakankar, “Color analysis of thermograms for breast cancer detection,” in Proc. of Int. Conf. on Industrial Instrumentation and Control (ICIC), Pune, India, pp. 1577–1581, 2015. [Google Scholar]
37. C. Gonáalves, A. Leles, L. Oliveira, G. Guimaraes, J. Cunha et al., “Machine learning and infrared thermography for breast cancer detection,” Proceedings, vol. 27, no. 1, pp. 45–55, Oct. 2019. [Google Scholar]
38. E. -S. El-Kenawy and M. Eid, “Hybrid gray wolf and particle swarm optimization for feature selection,” International Journal of Innovative Computing, Information and Control, vol. 16, no. 3, pp. 831–844, 2020. [Google Scholar]
39. S. Mirjalili, S. M. Mirjalili and A. Lewis, “Grey wolf optimizer,” Advances in Engineering Software, vol. 69, pp. 46–61, 2014. [Google Scholar]
40. Thermal images for breast cancer diagnosis DMR-IR 2020. Accessed: Mar. 7, 2022. [Online]. Available: https://www.kaggle.com/asdeepak/thermal-images-for-breast-cancer-diagnosis-dmrir. [Google Scholar]
41. A. Takieldeen, E., El-kenawy, E. Hadwan and M. Zaki, “Dipper throated optimization algorithm for unconstrained function and feature selection,” Computers, Materials & Continua, vol. 72, no. 1, pp. 1465–1481, 2022. [Google Scholar]
42. X. R. Zhang, X. Sun, W. Sun, T. Xu and P. P. Wang, “Deformation expression of soft tissue based on BP neural network,” Intelligent Automation & Soft Computing, vol. 32, no. 2, pp. 1041–1053, 2022. [Google Scholar]
43. X. R. Zhang, J. Zhou, W. Sun and S. K. Jha, “A lightweight CNN based on transfer learning for COVID-19 diagnosis,” Computers, Materials & Continua, vol. 72, no. 1, pp. 1123–1137, 2022. [Google Scholar]
 | This work is licensed under a Creative Commons Attribution 4.0 International License, which permits unrestricted use, distribution, and reproduction in any medium, provided the original work is properly cited. |