DOI:10.32604/cmc.2022.029701
| Computers, Materials & Continua DOI:10.32604/cmc.2022.029701 | |
| Article |
Multilevel Modelling for Surgical Tool Calibration Using LINEX Loss Function
1Department of Mathematics, College of Science and Humanities in Al-Aflaj, Prince Sattam Bin Abdulaziz University, Al-Aflaj, 11912, Saudi Arabia
2Department of Mathematics, Faculty of Science, Damietta University, New Damietta, 34517, Damietta, Egypt
*Corresponding Author: Mansour F. Yassen. Email: mf.ali@psau.edu.sa
Received: 09 March 2022; Accepted: 12 April 2022
Abstract: Quantifying the tool–tissue interaction forces in surgery can be utilized in the training of inexperienced surgeons, assist them better use surgical tools and avoid applying excessive pressures. The voltages read from strain gauges are used to approximate the unknown values of implemented forces. To this objective, the force-voltage connection must be quantified in order to evaluate the interaction forces during surgery. The progress of appropriate statistical learning approaches to describe the link between the genuine force applied on the tissue and numerous outputs obtained from sensors installed on surgical equipment is a key problem. In this study, different probabilistic approaches are used to evaluate the realized force on tissue using voltages read from strain gauges, including bootstrapping, Bayesian regression, weighted least squares regression, and multi-level modelling. Estimates from the proposed models are more precise than the maximum likelihood and restricted maximum likelihood techniques. The suggested methodologies are proficient of assessing tool-tissue interface forces with an adequate level of accuracy.
Keywords: Surgical tool; weighted least squares; multi-level modelling; Bayesian approach
Surgical performance is a difficult procedure that requires a unique blend of cognitive and technical skills from each surgeon. Tools to train the cognitive parts of surgery are actively being developed, as are tools to analyze the technical aspects of surgery that might lead to successful training [1].
Nowadays, surgical trainees learn mechanical skills through years of on-the-job training, reinforced by textual anatomy exams, tutorials, and laboratory-based surgical skill courses utilizing the models. Virtual reality (VR)-based imitations have been employed more lately. Although anatomical knowledge may be examined by a written or oral exam, mechanical skills like as deftness and tool usage are more particular than objective [2].
The evaluation of surgical abilities in surgery is required to guarantee patient safety and to offer advice to residents on how to improve their skills before operation. Surgical training is changing to a competency-based approach, and measuring surgical competence offers various potential benefits, increased medical training process safety, enhanced specialist certification, and the preservation of public trust in the surgical profession [3]. Currently, the majority of resident dexterity assessments are based on a subjective appraisal by an expert surgeon who observes trainees doing various surgical tasks [4]. The evaluation of the similar task may differ dependent on who is evaluating it, and it may even be biased [5].
It is critical to build instructional systems that accurately depict mechanical apparatuses such as tool–tissue contact forces during an operation. Without such tools, trainees would need years of practice and several pre-clinical and clinical trials to learn how to handle human tissues properly. As a result, there is a growing need to improve the learning process efficiency and equip learners with quantitative techniques to measure their surgical abilities. The microsurgical procedures, and the purpose is to improve the precision and determination of the sensorized surgical forceps’ performance by adding some small force-sensing apparatuses called strain gauges [6].
The strain gauge’s electrical resistance changes as a result of the force functional to the tissue, and the voltage changes as a result. The voltages read from the installed strain gauges on the spikes of the surgical forceps are related to the force exerted to the tissue. To determine the resultant force, it is necessary to characterize the output voltages and force components accurately [7]. In addition, the artificial tissue model was put atop a 6-dimensional force sensor that monitored the reactive forces given to the model to quantify the forces delivered to the tissues when suturing. Customized collecting and analysis software was used to collect force and position data.
Excessive force applied to tissue during surgery might result in damage. Controlling tool-tissue data, such as contact force, can help not only to prevent harm but also to enhance surgical skill training. In terms of tool handling, evaluating surgical technique is essentially qualitative. Sensing devices may be designed to dissect and examine different parts of psychomotor abilities in the operating room, thanks to continual improvements in sensor technology. This would enable for objective evaluation of a surgeon’s performance, resulting in better learning, performance, and outcomes. Furthermore, sensorized surgical tools would allow for the assessment of tool-tissue contact forces during surgery, as well as force measurements below the human tactile threshold [8].
Surgical tools have been modified using a variety of force measurement systems. Strain gauge load cells and pressure-based tactile sensors are only a few examples [9]. Many researchers have looked at the use of various sensory systems in surgical robots and instruments. Strain gauges are widely used transducers because of their low cost, durability, and ease of use. A strain gauge’s cells are made up of an elastic element to which a number of electrical resistances are attached. Strain gauges are used with brain retractors to measure the forces of retraction so that appropriate corrections may be made to avoid substantial reductions in cerebral blood flow beneath the retractor [10].
To quantify the tool-tissue contact force, many types of sensing devices are available. By changing the typical form of the tool, a set of micro-instruments utilized to test tissue qualities is updated. Such a change is not desirable in the development of a surgical tool since it may impact the surgical tool’s handling and perhaps the amount of tool-tissue contact pressures. It is examined if a silicon-based tri-axial force sensor may be mounted on the tip of a bending manipulator. The interaction force of a LIGA microgripper is measured using a small sensor. To get reliable and reproducible data, the sensor was made up of a set of ESU-025–1500 strain gauges [11].
Tactile sensors were also installed on endoscopic graspers to offer surgeons a sense of force. They use contact material such as pressure between the surgical instrument and the tissue to calculate the interaction force. Despite this, they can detect tissue texture but not interface force. Furthermore, because they are tied to the tool tip, they have the potential to change the tool’s functioning [12].
In this study, a probabilistic method is used to provide both point and interval estimations of the applied forces to the forceps during neurosurgery using a nonparametric Bootstrap approach. The accuracy associated with each estimate is explained in detail using the Bootstrap approach. The voltage force model is calibrated using a multivariate calibration approach to achieve this. This is accomplished by first fitting a linear regression structure between voltage and force, then executing a least squares technique for the dispersal of voltages attained from four strain gauges ascended on the two prongs of the bipolar forceps without assuming any parametric assumptions, such as regularity. Using measured voltages in test data sets and the inverse of the calibration model, the Bootstrap approach is then utilized in estimation of unknown forces and create requisite confidence ranges. By measuring the response variable voltage, the calibration terminology is used to anticipate the explanatory variable force. In domains like linear and nonlinear models, as well as spline regression, calibration is commonly employed. Fig. 1 represents the general calibration procedure.

Figure 1: Simple calibration procedure
The generalized linear models show that ward variance in a nurse’s practicing environment influences the quality of care reported by the nurse. the ward practice environment is critical to providing high-quality care, and that nurses who work in more favorable ward settings are better equipped to deliver better care. The Nursing Work Index-Practice Environment Scale (PES-NWI) was used to assess the nurse work environment in this study. This PES-NWI assesses organizational behaviors such as management support, teamwork, and nurse involvement in hospital matters, all of which may be enhanced. The impact of the ward environment in which nurses work on overall nurse-reported patient safety on the ward is investigated using the ward mean for the PES-NWI [13].
Surgical site infection (SSI) is one of the most dangerous problems after spine surgery, with potentially devastating implications such as fixation failure, osteomyelitis, pseudarthrosis, longer hospital stays, death, unsatisfactory surgical outcomes, and higher health-care expenses. In the field of orthopedic surgery, SSIs can occur at a rate of up to 12% following spine surgery, depending on the diagnosis, surgical technique, use of spinal equipment, and the procedure’s complexity. SSIs are difficult to identify and treat because there is no pathognomonic sign or symptom that correctly indicates their presence. To treat the infection, one or more operational debridement may be required, as well as long-term antibiotic therapy. The treatment of SSI has grown even more difficult as the number of antibiotic-resistant organisms has increased, therefore SSI prevention is now more important than ever [14].
The utilization of 3D printed platforms in surgical training is a new trend with a lot of potential. The simplest of them are laparoscopic training platforms, which consist of a basic set up as a pelvic trainer with simple things within. For training in renal cancer, adrenal cancer, prostate cancer, urethro-vesical anastomosis, endourethral surgery and pelvicalyceal junction operations, more sophisticated models have been constructed. None of them, however, can match the mechanical qualities of live tissue. This invention, we feel, provides a cutting-edge in more advanced surgical training. This model allows you to simulate all of the crucial phases of penile implant surgery, which is a highly complex process. This model may be extended for additional reconstructive surgeries such as peyronies disease, such as grafting, training for male sling measures, prosthetic urinary sphincter, and so on, with a few simple alterations. We may begin training in female urology operations, such as pelvic organ prolapse surgery, by converting this structure into a female pelvic 3D model [15].
The SmartForceps is a surgical forceps that incorporates force sensors. The authors tested the functioning of their SmartForceps on cadaveric brains using three different neurosurgeries. The surgeons in the pilot research had access to real-time segmentation and congealing force data. According to the study, more than 70% of the contact forces within 0 and 0.3 N. It’s also worth noting that used pressures are influenced by a range of parameters, including tissue type, brain region, and surgical activity [16].
The creation of a nominally offensive surgical instrument with built-in sensors for simulating ischemia recognition data during routine tissue operation This instrument must be capable of being used in a real operating room and delivering real-time feedback and analysis to the surgeon in order to be beneficial. Furthermore, the gear should be simple to bring to the operating room, and the tool and sensors would be durable adequate to be pasteurized or inexpensive sufficient to be discarded after the procedure [17].
The approaches for calibrating force sensors should be precise and computationally light. The least-square optimization approach has been broadly used for modelling the mapping relation among the tool gravity functional to the robot tool and the tool alignment angles as one of the standard regression procedures. However, because it demands the entire mathematical formulation of the model and overlooks the nonlinear properties present in the robot system, this technique is difficult to get correct findings and is not practical. Using a pre-calibrated force plate, a calibration technique was created. Although this approach simplifies the calibration process, the sensor’s deconstruction remains a problem [18].
The calibration of surgical tool is obtained by applying force in the data in all direction, and the deflection in corresponding direction is measured using the strain gauge. The voltage read form the strain gauge is used to quantify the amount of deflection. The three individual voltage is measured by designing strain gauge
The dataset of one of prongs is taken for the study due to the sake of compactness, prongs are installed with three strain gauges. The sustainable amount of output voltage is observed when the force is functional in certain direction from the consistent strain gauge. The output voltage from
The obtain voltage form the strain gauge are different along each axis for the force applied. This problem is addressed by proposing a method based on bootstrap method with a Bayesian multilevel modelling in the surgical field. The model is calibrating by using the least square linear regression approach.
The calibration model is adjusted by properly combining the data of the test data using bootstrap technique. The system among the voltage of sensory structure ascended on to a surgical bipolar forceps and the force applied to the human by bipolar forceps. The bootstrap technique is used to estimate the force associated with the observed voltage.
4.1 Modelling of Bipolar Forceps
The configuration of used strain gauge in bipolar forceps model [19]. A Wheatstone bridge configuration is formed by connecting each strain gauge to a set of resistors. The axial strain of strain gauge (ε) and the voltage of Wheatstone bridge V is linearly proportional. The quantity of total stress applied to the gauge (σ) obtained by the strain gauge factor
The modulus of elasticity is represented as E.
The principle of a wire strain gauge is based deflection which is caused due to the change in resistance of wire and strain change is correlated. The axial strain along each axis x, y and z is
This shows the constant excitation voltage (
When a tension load is functional to the wire, the lateral strain is detected because of axial shortening and axial strain also occur. The lateral and axial strain of the wire correlated the poison’s ratio (
The value of v is less in metal and the diagonal element is greater than other metal. When a tensil force is applied the value of Poisson ratio is small along one direction
when no force is useful along y-axis, the strain is instigated by tensil force in y-direction. The tensil force in the main axis which is affected when the strain is along the second axis. When no force is used along z-axis the strain is caused by tensil force in z-direction. The accuracy of the measured force is enhanced by accumulation the pair of strain gauge to the bipolar forceps.
4.2 A Bootstrap Based on Weighted Least Mean Square Method
The true value of force is estimated using the observed voltage by a non-parametric technique based on bootstrap approach. Ordinary least square regression modelling approach-based algorithm is presented to resolve the problem in non-homogeneity of the voltage readed and weighted least square technique is use for model fitting by enhancing the bootstrap technique [20].
Let us consider
where s = 1,2,3; t = 1, 2…, n and
where
The residuals are calculated as follows
with
1. The residual pool {
2. The corresponding value of
3. Using bootstrap data V(r) calculate the applied for
4. The process is repeated for r = 1, 2…B.
5. Estimate B.
6. The estimated force value B is used to construct the point and interval estimated.
This shows that the force estimated in x and y direction provide an acceptable value, while in z-direction the performance is poor. The variability of residual pool obtained in changing form one model to other due to the non-homogeneity of voltage read in strain gauge form fitting regression model of ordinary least square approach.
The weighted least square method is suggested with proper weights to maintain a perfect regression model in the bootstrap approach. The necessary weight is constructed in weighted least square approach to run the procedure of bootstrap calibration by using inverse of observation reading from each strain gauge.
4.3 Bootstrap Calibration with Multivariant Linear Model
There is more than one voltage associated with each force. Consider the force
The unknown force value is estimated using the bootstrap technique by fit the model to training dataset.
where
The force
where
1. Calculate
2. The residuals are compute
3. The bootstrap dataset is obtained by resampling residual pool
4. A new model is fit to the bootstrap data and the corresponding value of
5. The forces
6. Repeat the steps 3 to 5.
7. Quantify confidence interval for estimation.
The obtained voltage (
The voltage recorded form strain gauge 1, 2 and 3 are represented as
4.4 Multilevel Modelling and Bayesian Approach for Calibration Using LINEX Loss Function
The difficulties and limitation related in mounting the strain gauge of the forceps is addressed using the multi modelling weighted least square and Bayesian approach [21]. The Bayesian approach with asymmetric loss function to evade underestimation of the functional force in each direction. The LINEX loss function is utilized as a substitute for the square error in solving the calibration problem [22].
Weighted Least Square Regression
The weighted least square approach is used to compute the regression coefficient. The suitable weight is chosen in the regression model to use in the bootstrap approach. Inversion of variance is used to create the required weight in each strain to path the calibration process. The weight for the regression model is given as
where
Multilevel Modelling
The multilevel modelling is a mixed model which consist of random and fixed coefficient. The generalization of regression model is multilevel modelling in which data is classified based on the features and based on each category, model coefficient can vary [23].
In this proposed technique partial pooling is used instead of complete pooling or no pooling to avoid overfitting the data and non- homogeneity among different group. The varying slope model is introduced with no intercept as a
where j= X, Y, Z which represent the force direction, s = 1,2,3 indicated the catalog of strain gauge where
The voltage read form the strain gauge
The models with varying slope
The model varying with intercept
Model with varying slope and intercepts
The varying slope without intercept model is obtained for relative coefficient
l= 1,2,3 is the number of strain gauge.
The variance is given as
The force
The above equation gives the random effect for varying
Estimation of Random and Fixed coefficient
The least square technique is used to evaluate fixed effect coefficients. The log-likelihood function under the model is based on the multivariate normality assumption.
The fixed coefficient is calculated using the least square approach under the model of log-likelihood function
Therefore,
Let
By taking the derivative of
The estimation of best linear unbiased prediction approach for predicting
When forces are functional in the x, y, and z axes, it conducts partial pooling utilising the information collected from the strain gauge. The best linear unbiased prediction (BLUP) technique under the squared error loss (SEL) function is frequently used to assess random effects.
Because the LINEX loss is asymmetric, we can utilise various penalties for exceeding and underestimating the parameter of interest. Underestimating the quantity of pressures is more harmful than overestimating in our calibration dilemma, since high stress on tissues can create major injury, hence it is suggested to guard against underestimating. To overcome this issue, we used the LINEX loss function in estimate procedure to get more consistent results [24]. The LINEX loss function is defined as
To apply the LINEX loss function, the unbiasedness notation is extended to account for the loss function’s role in the estimate process.
Estimation of Covariance Matrices
The covariance parameter is obtained using the Maximum likelihood approach and restricted maximum likelihood approach. The unknown parameter
The influence of restricted maximum likelihood approach is preferred comparing to maximum likelihood which influence the fixed effect.
When a force used in a certain direction, the strain gauge mounted to detect voltages in that direction produces a significant quantity of output voltage. Applying force in the x direction, effect in significant output voltages from
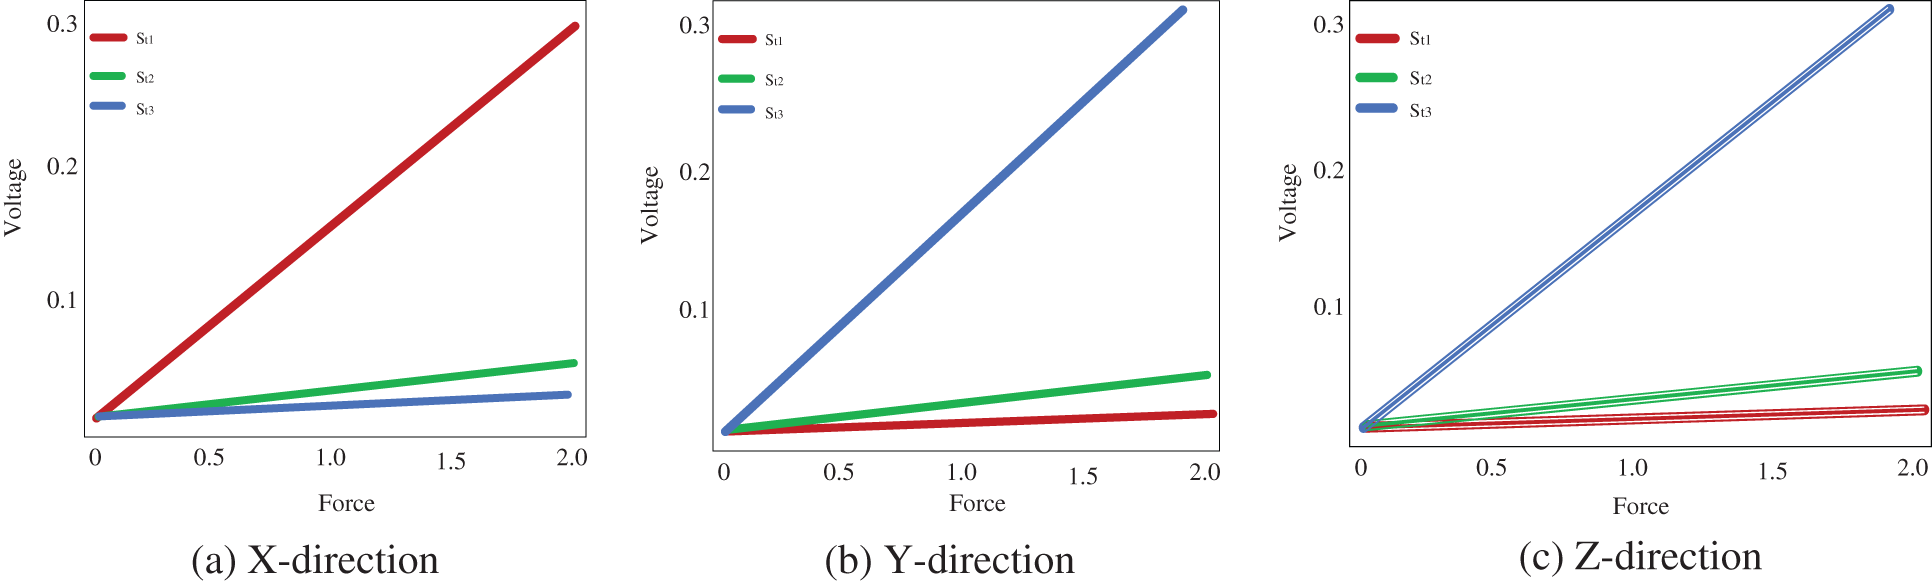
Figure 2: Voltage measured from the strain gauge
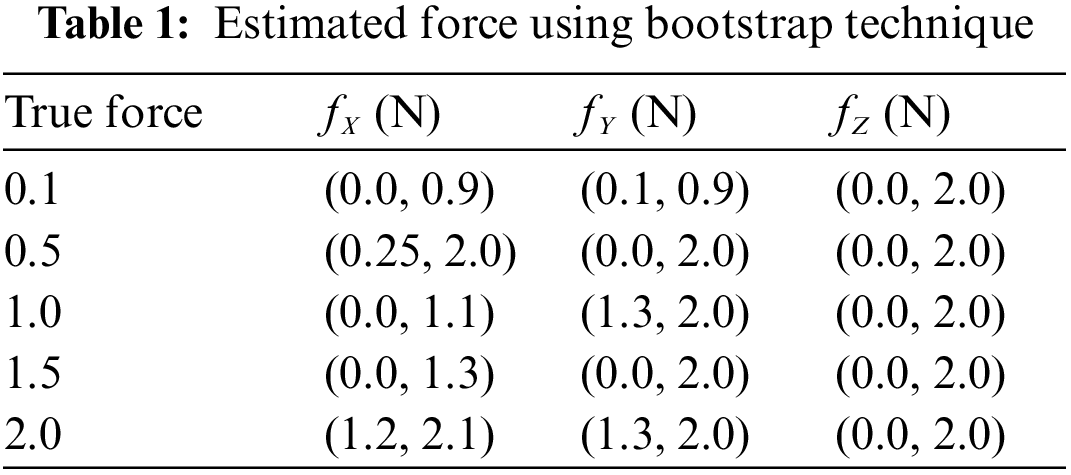
The bootstrap confidence intervals are estimated in the x, y, and z axes for various levels of force functional to the right forceps tip. The magnitude of genuine forces was treated as unknown values while examining the bootstrap method’s results. Tab. 1 shows that not only are the interval lengths too long, but the measured force values are also substantially different from the genuine force values. Despite the fact that built bootstrap confidence intervals are relatively broad, the real magnitude of the force is not always inside the interval. The measured bootstrap confidence range in the x, y, and z directions are (0.0 N, 1.3 N), (0 N, 2.0 N), and (0.0 N, 2.0 N), while 1.5 N is not inside the interlude produced for force in the x direction.
The measured voltages from each strain gauge are shown, and the direction of the functional force is indicated using distinct symbols. The various residuals derived from various models are also depicted in the Fig. 3. When force is functional in the y direction, the voltages in
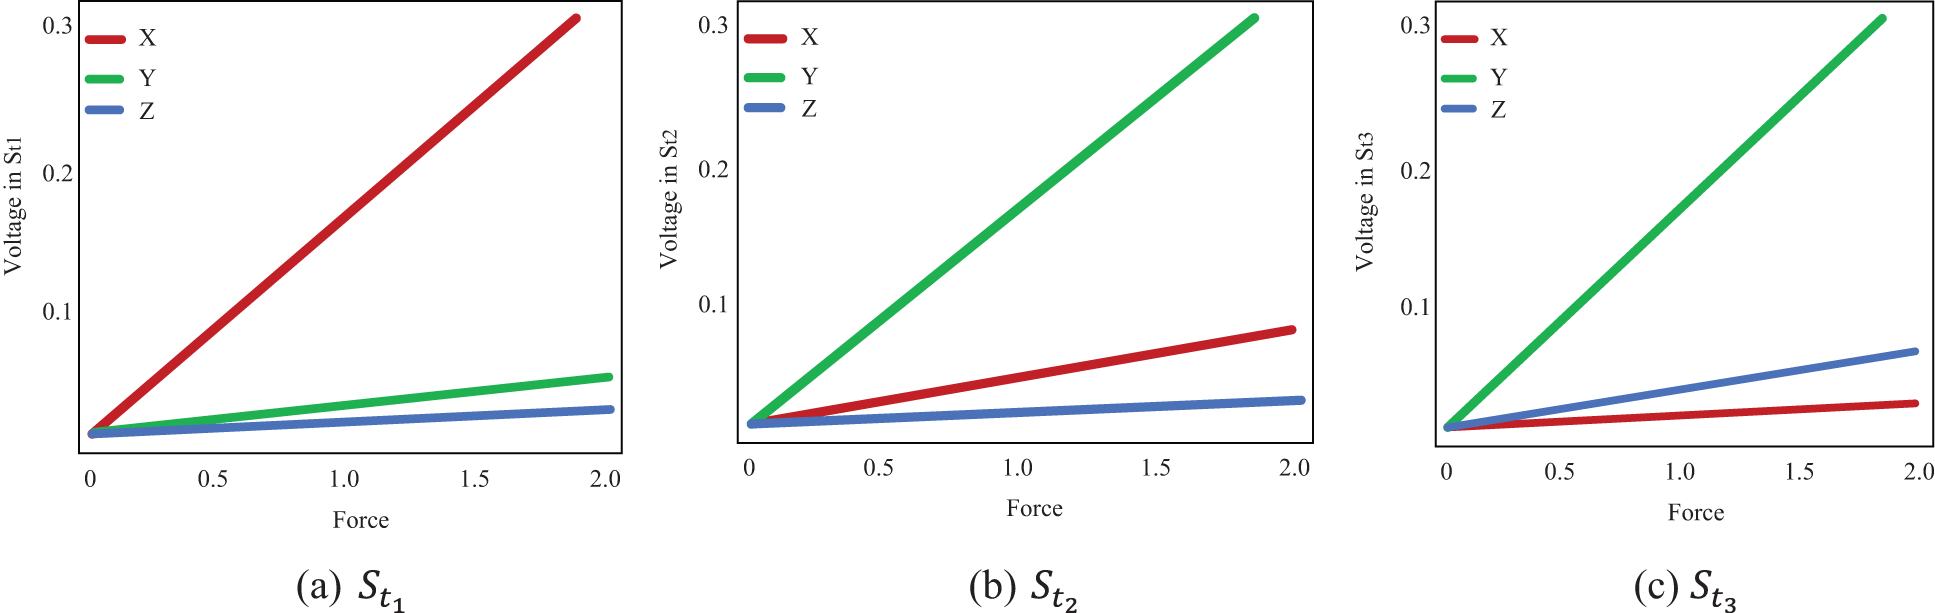
Figure 3: Voltage estimated from each strain gauge
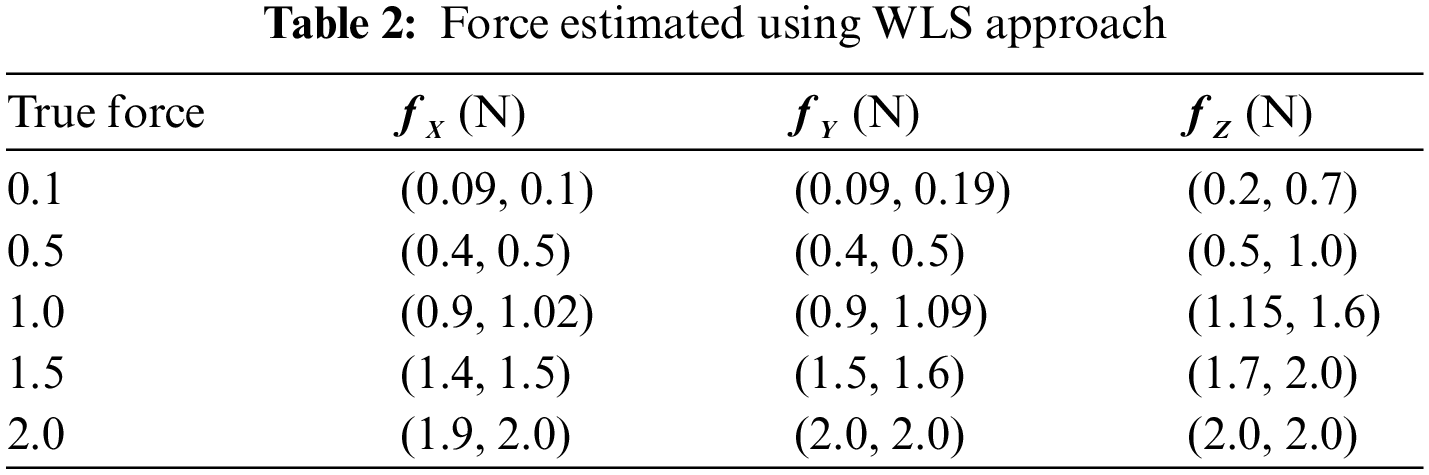
Tab. 2 shows the measured values of forces in the x and y directions are in the internal ranges calculated. The predicted confidence ranges for forces in the z direction, on the other hand, are not accurate enough, and the gaps are far too long. The force is 0.7 N, with estimated intervals of (0.6 N, 0.7 N) in the x and y directions and an interval of (0.6 N, 1.1 N) in the z direction. Although observed WLS provides more accurate estimates of real forces, the findings in the z direction are not as exact as they should be for practical usage. Some of the complexity in estimating in the z direction can be attributed to a technological issue.
The Fig. 4 shows the multilevel modelling in calibration which includes the varying slope, varying intercepts and both slope and varying intercepts for different strain gauge.
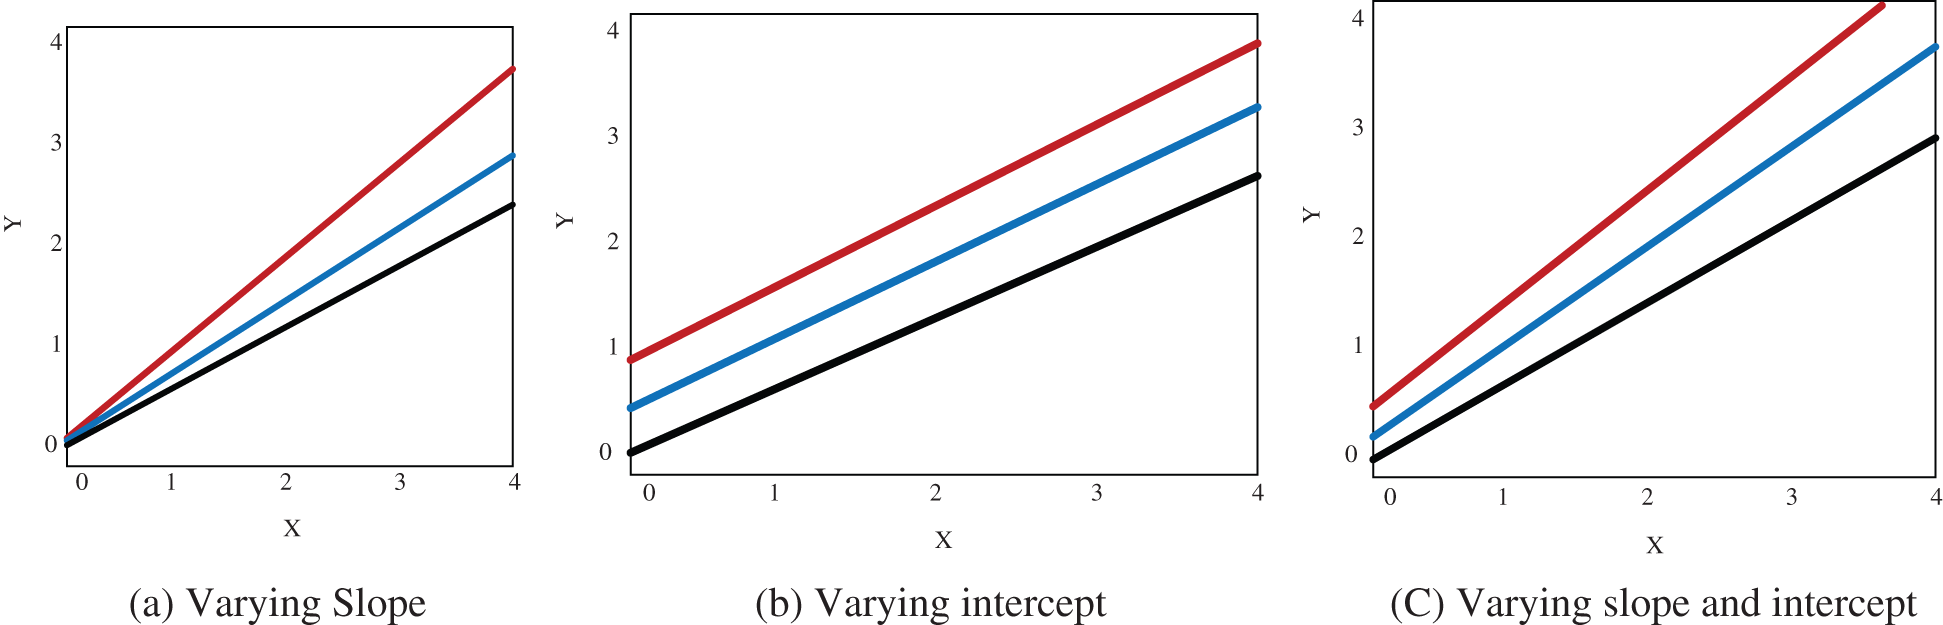
Figure 4: Proposed multilevel modelling
The Fig. 5 shows the comparison of the length of bootstrap obtained using Bayesian technique, multilevel modelling and weighted least square when the force is functional in x, y and z-direction.
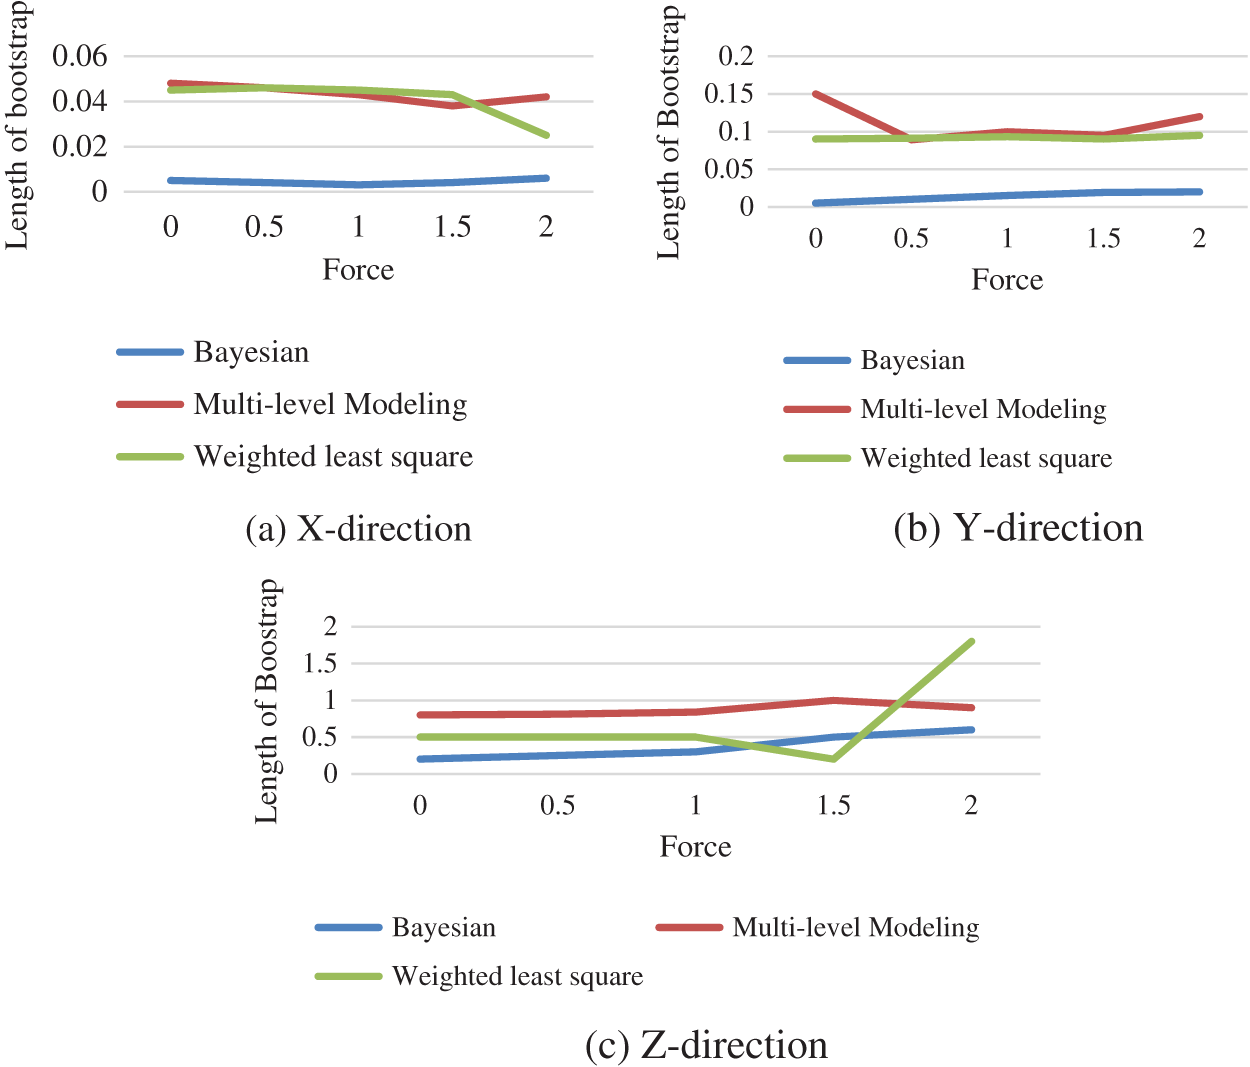
Figure 5: Performance comparison between different technique
The progress of appropriate statistical learning approaches to describe the link among the genuine force applied on the tissue and numerous consequences obtained from sensors installed on surgical equipment. In this study, different probabilistic approaches are used to evaluate the implementation force on tissue utilizing voltages read from strain gauges, including bootstrapping, weighted least squares regression, multi-level modelling and Bayesian regression. When compared to the WLS technique, the force estimates generated by multilevel modelling offer superior estimates. As weights were added to the model, the estimates improved. The proposed bootstrap approach uses multilevel models to produce interval compute and improve the quality of our point assessment. Overall, the results imply that multilevel model estimates which are more precise, although the Bayesian technique gives lower confidence intervals.
Funding Statement: The author received no specific funding for this study.
Conflicts of Interest: The author declares that he has no conflicts of interest to report regarding the present study.
Reference
1. A. Liu, F. Tendick, K. Cleary and C. Kaufmann, “A survey of surgical simulation: Applications, technology, and education,” Presence, vol. 12, no. 6, pp. 599–614, 2003. [Google Scholar]
2. R. Q. Mao, L. Lan, J. Kay, R. Lohre, O. R. Ayeni et al., “Immersive virtual reality for surgical training: A systematic review,” Journal of Surgical Research, vol. 268, no. 12, pp. 40–58, 2021. [Google Scholar]
3. A. I. Taloba, R. M. Abd El-Aziz, H. M. Alshanbari, and A. -A. H. El-Bagoury, “Estimation and prediction of hospitalization and medical care costs using regression in machine learning,” Journal of Healthcare Engineering, vol. 2022, pp. 1–10, 2022, https://doi.org/10.1155/2022/7969220. [Google Scholar]
4. A. I. Taloba, R. Alanazi, O. R. Shahin, A. Elhadad, A. Abozeid, and R. M. Abd El-Aziz, “Machine algorithm for heartbeat monitoring and arrhythmia detection based on ECG systems,” Computational Intelligence and Neuroscience, vol. 2021, pp. 1–9, 2021, https://doi.org/10.1155/2021/7677568. [Google Scholar]
5. Y. Ghasemloonia, K. Maddahi, S. Zareinia, J. Lama, C. Dort et al., “Surgical skill assessment using motion quality and smoothness,” Journal of Surgical Education, vol. 74, no. 2, pp. 295–305, 2017. [Google Scholar]
6. K. Zareinia, Y. Maddahi, L. S. Gan, A. Ghasemloonia, S. Lama et al., “A Force-sensing bipolar forceps to quantify tool–Tissue interaction forces in microsurgery,” IEEE/ASME Transactions on Mechatronics, vol. 21, no. 5, pp. 2365–2377, 2016. [Google Scholar]
7. P. Azimaee, M. J. Jozani, Y. Maddahi, K. Zareinia and G. Sutherland, “Nonparametric bootstrap technique for calibrating surgical smart forceps: Theory and application,” Expert Review of Medical Devices, vol. 14, no. 10, pp. 833–843, 2017. [Google Scholar]
8. S. De, J. Rosen, A. Dagan, P. Swanson, M. Sinanan, and B. Hannaford, “Assessment of tissue damage due to mechanical stresses,” in the First IEEE/RAS-EMBS Int. Conf. on Biomedical Robotics and Biomechatronics, 2006. BioRob 2006, Pisa, Italy, pp. 823–828, 2006, https://doi.org/10.1109/BIOROB.2006.1639192. [Google Scholar]
9. W. Sun, X. Chen, X. Zhang, G. Dai, P. Chang, and X. He, “A Multi-feature learning model with enhanced local attention for vehicle re-identification,” Computers, Materials & Continua, vol. 69, no. 3, pp. 3549–3561, 2021, https://doi.org/10.32604/cmc.2021.021627. [Google Scholar]
10. P. Puangmali, K. Althoefer, L. D. Seneviratne, D. Murphy and P. Dasgupta, “State-of-the-art in force and tactile sensing for minimally invasive surgery,” IEEE Sensors Journal, vol. 8, no. 4, pp. 371–381, 2008. [Google Scholar]
11. Y. Maddahi, J. Huang, J. Huang, L. S. Gan, H. Hoshyarmanesh, K. Zareinia et al., “Real-time measurement of tool-tissue interaction forces in neurosurgery: Quantification and analysis,” in 2016 IEEE Int. Conf. on Advanced Intelligent Mechatronics (AIM), Banff, AB, Canada, pp. 1405–1410, 2016. [Google Scholar]
12. A. G. Abushagur, N. Arsad, M. I. Reaz and A. A. A. Bakar, “Advances in bio-tactile sensors for minimally invasive surgery using the fibre bragg grating force sensor technique: A survey,” Sensors, vol. 14, no. 4, pp. 6633–6665, 2014. [Google Scholar]
13. M. Kirwan, A. Matthews and P. A. Scott, “The impact of the work environment of nurses on patient safety outcomes: A multi-level modelling approach,” International Journal of Nursing Studies, vol. 50, no. 2, pp. 253–263, 2013. [Google Scholar]
14. S. H. Chen, C. H. Lee, K. C. Huang, P. H. Hsieh and S. Y. Tsai, “Postoperative wound infection after posterior spinal instrumentation: Analysis of long-term treatment outcomes,” European Spine Journal, vol. 24, no. 3, pp. 561–570, 2015. [Google Scholar]
15. K. Shee, K. Koo, X. Wu, F. M. Ghali, R. J. Halter et al., “A novel ex vivo trainer for robotic vesicourethral anastomosis,” Journal of Robotic Surgery, vol. 14, no. 1, pp. 21–27, 2020. [Google Scholar]
16. L. S. Gan, K. Zareinia, S. Lama, Y. Maddahi, F. W. Yang et al., “Quantification of forces during a neurosurgical procedure: A pilot study,” World Neurosurgery, vol. 84, no. 2, pp. 537–548, 2015. [Google Scholar]
17. P. R. Roan, A. S. Wright, T. S. Lendvay, M. N. Sinanan and B. Hannaford, “An instrumented minimally invasive surgical tool: Design and calibration,” Applied Bionics and Biomechanics, vol. 8, no. 2, pp. 173–190, 2011. [Google Scholar]
18. Y. Yuan, Y. Wang and L. Guo, “Force reflecting control for bilateral teleoperation system under time-varying delays,” IEEE Transactions on Industrial Informatics, vol. 15, no. 2, pp. 1162–1172, 2018. [Google Scholar]
19. E. W. Elliott-Lewis, J. Jolette, J. Ramos and E. C. Benzel, “Thermal damage assessment of novel bipolar forceps in a sheep model of spinal surgery,” Neurosurgery, vol. 67, no. 1, pp. 166–172, 2010. [Google Scholar]
20. R. E. McRoberts, E. Næsset, T. Gobakken, G. Chirici, S. Condés et al., “Assessing components of the model-based mean square error estimator for remote sensing assisted forest applications,” Canadian Journal of Forest Research, vol. 48, no. 6, pp. 642–649, 2018. [Google Scholar]
21. P. Azimaee, M. J. Jozani and Y. Maddahi. “Calibration of surgical tools using multilevel modeling with LINEX loss function: Theory and experiment,” Statistical Methods in Medical Research, vol. 30, no. 6, pp. 1523–1537, 2021. [Google Scholar]
22. F. S. Al-Duais and M. Y. Hmood, “Bayesian and non-Bayesian estimation of the lomax model based on upper record values under weighted LINEX loss function,” Periodicals of Engineering and Natural Sciences, vol. 8, no. 3, pp. 1786–1794, 2020. [Google Scholar]
23. X. Zhang, X. Chen, W. Sun, and X. He, “Vehicle Re-identification model based on optimized densenet121 with joint loss,” Computers, Materials & Continua, vol. 67, no. 3, pp. 3933–3948, 2021, https://doi.org/10.32604/cmc.2021.016560. [Google Scholar]
24. F. S. Al-Duais, “Bayesian estimations under the weighted LINEX loss function based on upper record values,” Complexity, vol. 2021, Article ID 9982916, pp. 7, 2021. https://doi.org/10.1155/2021/9982916. [Google Scholar]
 | This work is licensed under a Creative Commons Attribution 4.0 International License, which permits unrestricted use, distribution, and reproduction in any medium, provided the original work is properly cited. |