DOI:10.32604/cmc.2022.026012
| Computers, Materials & Continua DOI:10.32604/cmc.2022.026012 | |
| Article |
A Study on Cascade R-CNN-Based Dangerous Goods Detection Using X-Ray Image
Department of Computer Engineering, Honam University, Gwangsangu, Gwangju 62399, Korea
*Corresponding Author: Sang-Hyun Lee. Email: leesang64@honam.ac.kr
Received: 14 December 2021; Accepted: 05 May 2022
Abstract: X-ray inspection equipment is divided into small baggage inspection equipment and large cargo inspection equipment. In the case of inspection using X-ray scanning equipment, it is possible to identify the contents of goods, unauthorized transport, or hidden goods in real-time by-passing cargo through X-rays without opening it. In this paper, we propose a system for detecting dangerous objects in X-ray images using the Cascade Region-based Convolutional Neural Network (Cascade R-CNN) model, and the data used for learning consists of dangerous goods, storage media, firearms, and knives. In addition, to minimize the overfitting problem caused by the lack of data to be used for artificial intelligence (AI) training, data samples are increased by using the CP (copy-paste) algorithm on the existing data. It also solves the data labeling problem by mixing supervised and semi-supervised learning. The four comparative models to be used in this study are Faster Region-based Convolutional Neural Networks Residual2 Network-101 (Faster R-CNN_Res2Net-101) supervised learning, Cascade R-CNN_Res2Net-101_supervised learning, Cascade Region-based Convolutional Neural Networks Composite Backbone Network V2 (CBNetV2) Network-101 (Cascade R-CNN_ CBNetV2Net-101)_supervised learning, and Cascade R-CNN_ CBNetV2-101_semi-supervised learning which are then compared and evaluated. As a result of comparing the performance of the four models in this paper, in case of Cascade R-CNN_CBNetV2-101_ semi-supervised learning, Average Precision (AP) (Intersection over Union (IoU) = 0.5): 0.7%, AP (IoU = 0.75): 1.0% than supervised learning, Recall: 0.8% higher.
Keywords: Cascade R-CNN model; faster R-CNN model; X-ray screening equipment; Res2Net; supervised learning; semi-supervised learning
The first person to discover X-rays was German physicist Wilheim Conrad Roentgen, and the principle of operation is that electric activity proceeding at a high-speed causes electron to be rapidly decelerated under the influence of metal atoms or the original motion of electrons when stopped energy is converted into the form of electromagnetic waves, which are called X-rays [1].
X-ray is a kind of electromagnetic wave, and it has a short wavelength, high frequency, and strong penetrating power. X-rays can be transmitted through scanning objects. With these X-ray characteristics, it is widely used in the field of security inspection. The operation of the X-ray scanning device generates X-rays on the luggage moving on the conveyor, absorbs the beam with the detector, and displays it as an image. By digitizing two image processing, which is the actual atomic behavior of the retrieved baggage, it is classified as organic and inorganic, and the density of the object determines the color and body [2].
Organic/inorganic materials with low density appear faint and pale, and organic/inorganic materials with high density appear dark. The substance classification of organic and inorganic substances can be confirmed by the different reactions when X-rays are radiated onto the two substances. Fig. 1 shows the black-and-white and color images displayed on the monitor. Black-and-white images are displayed as gray level values depending on the object through which the X-rays are transmitted, with high-density objects (such as iron plates) as black and low-density objects (such as paper) as white, depending on the object [3].

Figure 1: X-ray examination image fluoroscopy
Color image display is basically divided into three groups. It is divided into organic substances (orange), mixtures of organic and inorganic substances (green), and inorganic substances (blue). Except for these three groups, all substances that are not penetrated due to their thickness and density are displayed as black [4]. When X-ray scans baggage, because the composition and density of objects are different, the degree to which objects with different densities absorb X-rays are different.
Because X-ray has high transmittance, after an image is created, all objects are imaged through perspective. Even when the contents of the baggage are hidden from one another and randomly placed, X-ray still has a strong distinguishing ability. Because X-rays have different densities when different objects overlap, the absorption power of the generated light is different. Objects with low density may not be able to transmit light. Conversely, if the density is too high, it is difficult to search for the contents because the image is not easily revealed. Therefore, this paper intends to propose a system for detecting dangerous objects in X-ray images using the Cascade Region-based Convolutional Neural Network (Cascade R-CNN) [5] model. Here, the data used for Artificial intelligence (AI) learning are hazardous goods, storage media, guns, knives, etc. In addition, the Copy-Paste (CP) [6] algorithm is used on existing data to minimize the overfitting problem caused by insufficient data to be used for training. Here, the CP algorithm is used to increase the number of data samples, and supervised learning and semi-supervised learning are mixed to solve the problem of data labeling.
2 Hazardous Goods Detection Model
The Cascade R-CNN is characterized by an architecture that detects objects to solve the performance degradation problem by utilizing the increased IoU threshold, and Fast Region-based Convolutional Network method (Fast R-CNN) [7] is a deep convolutional network used for object detection. It is possible to predict the location accurately and quickly.
In Cascade R-CNN and Faster R-CNN, the method of detecting an object is divided into two steps and proceeds very similarly. The first is to find the target and then classify the target. First, a picture is input, and a feature map of the image is obtained through a feature extraction network. Here, Fast R-CNN compared to Cascade R-CNN is a model that improves the shortcomings of Regions with Convolutional Neuron Networks features (R-CNN) and Spatial Pyramid Pooling Network (SPPNet). R-CNN is a model that connects a Convolutional Neural Networks (CNN) that performs image classification and a regional proposal algorithm for localization, and SPP-Net uses spatial pyramid pooling to it’s a convolutional neural architecture.
The Region Proposal Network (RPN) [8] finds candidate targets in the feature map and connects different Intersection over Union (IoU) thresholds to generate corresponding samples which are selected for regression and training. Here, the IoU threshold is an index for evaluating the accuracy of object detection. In general, it is an index that determines whether detection of an individual object is successful in object detection, and it has a value between 0 and 1.
Cascade R-CNN used in this paper uses multiple searchers, whereas Faster R-CNN has only one searcher. Each searcher is trained based on positive and negative samples from different IoUs, and the output value of the previous searcher is used as the next input value of the searcher.
Referring to Fig. 2, the Faster R-CNN classifier is on the left and the Cascade R-CNN classifier is on the right. In Faster R-CNN, “pool” is a pooling layer for feature maps.
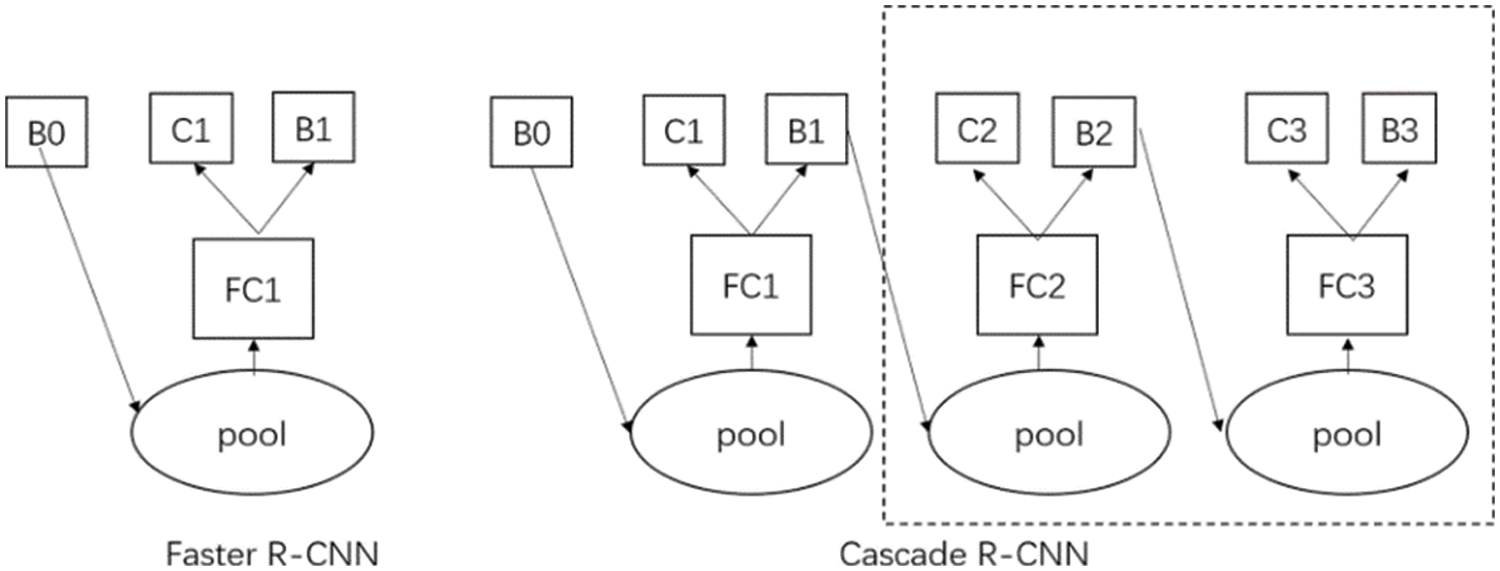
Figure 2: Structure of searcher of faster R-CNN and cascade R-CNN
“FC1” is the fully connected layer, “B0” is the boundary box of the candidate region, “B1” is the predicted boundary box from the structure, and “C1” is the final prediction classification result. “Pool” of Cascade R-CNN is a pooling layer for the feature map. “FC1”, “FC2”, and “FC3” represent the complete connected layer, and “B0”, “B1”, and “B2” represent the bounding box of the candidate region. “B3” indicates the predicted bounding box in the structure, “C1” and “C2” indicate the predicted classification result, and “C3” is the result for the final predicted classification. Since the Cascade R-CNN classifier uses the cascade method, better data can be provided to the next classifier because the output value of the previous classifier is used as the input value of the next classifier. For this reason, the classifier has the advantage of showing higher effectiveness [9].
Cascade R-CNN uses three cascade detectors in the classification and regression stages, and by gradually increasing the IOU threshold, the candidate frame is continuously optimized and the detection result becomes more accurate. It can also effectively prevent overfitting and false positives caused by a fixed IOU threshold that is too high or too low [10].
Because the high resolution of the X-ray image and the ratio of the characteristic parts are often very small, the first-stage detector is a high-density detector, and the second-stage detector is used because the model training is difficult as a large number of background regions are easily generated. Step 2 can use a Region Proposal Network (RPN) to filter out many irrelevant background regions to achieve the detection’s purpose. Using a fixed IoU threshold for detection in RPN may not be conducive to detecting dangerous objects, considering many false detections may occur in a complex background [11].
Therefore, we can use Cascade R-CNN and use the cascade prediction method to filter out irrelevant background regions to get better position coordinates. In addition, if the more accurate candidate region output of the previous detector is used as the input of the next detector, the accuracy of the final output can be gradually improved, and the overfitting problem can also be effectively suppressed.
Therefore, this paper intends to detect hazardous goods using the Cascade R-CNN model, which has these advantages.
The Residual2Network (Res2Net) [12] is a new type of target detection network jointly proposed by researchers from Nankai University and several famous outside universities in 2019. Compared to ResNet [13], Res2Net has the advantage of greatly improving the feature extraction capability without increasing the network computation complexity and network computation burden. Here, the Res2Net network module can be fused well with other network models with good performance.
Res2Net uses a finer convolutional kernel to extract finer multiscale features and broadens the receive field range of each network layer [14]. Res2Net uses several small convolution kernels to replace the existing 3*3 convolution kernel. A small convolutional kernel can reduce feature loss because it increases the output features connected to one another like a hierarchical residual network [15]. The basic structure of Res2Net is shown in Fig. 3.
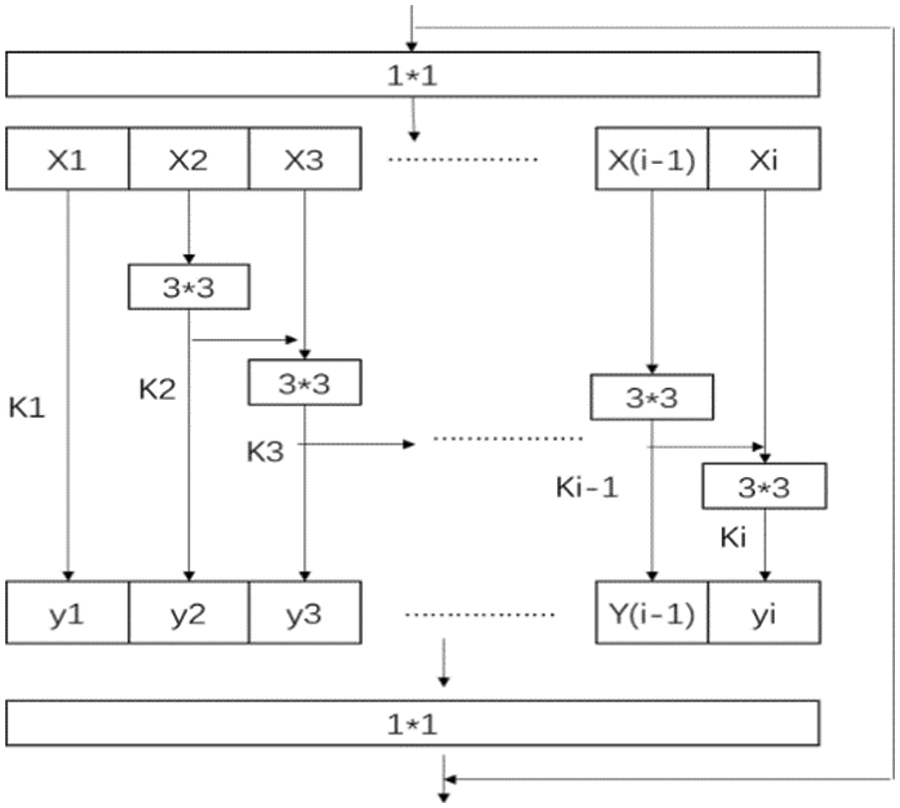
Figure 3: Res2Net basic structure
X-ray needs more detailed features due to its ability to see through images. Res2Net uses a concatenation method by dividing the 3*3 convolution into multiple feature subsets in the residual block of ResNet. Combining features extracted from multiple feature subsets further enriches the image features. And the ability to extract multi-scale features can be improved. Detection performance can also be improved without increasing the computational load. Therefore, Res2Net is used in this paper because it is more suitable for detecting dangerous goods in X-ray images.
Powerful detectors require a powerful backbone, so a common way to strengthen the backbone is to make it deeper and wider, or to design a more powerful backbone. This has expensive learning costs, and in 2021, Tingting Liang et al. proposed a lightweight and flexible composite backbone network CBNetV2 to explore performance improvements caused by effective network structures [16]. CBNetV2 is similar to CBNet and connects multiple backbone networks through a composite connection. However, CBNetV2 uses the previous network output characteristics as inputs from the same layer and lower layer of the next network. The CBNetV2 structure is shown in Fig. 4.
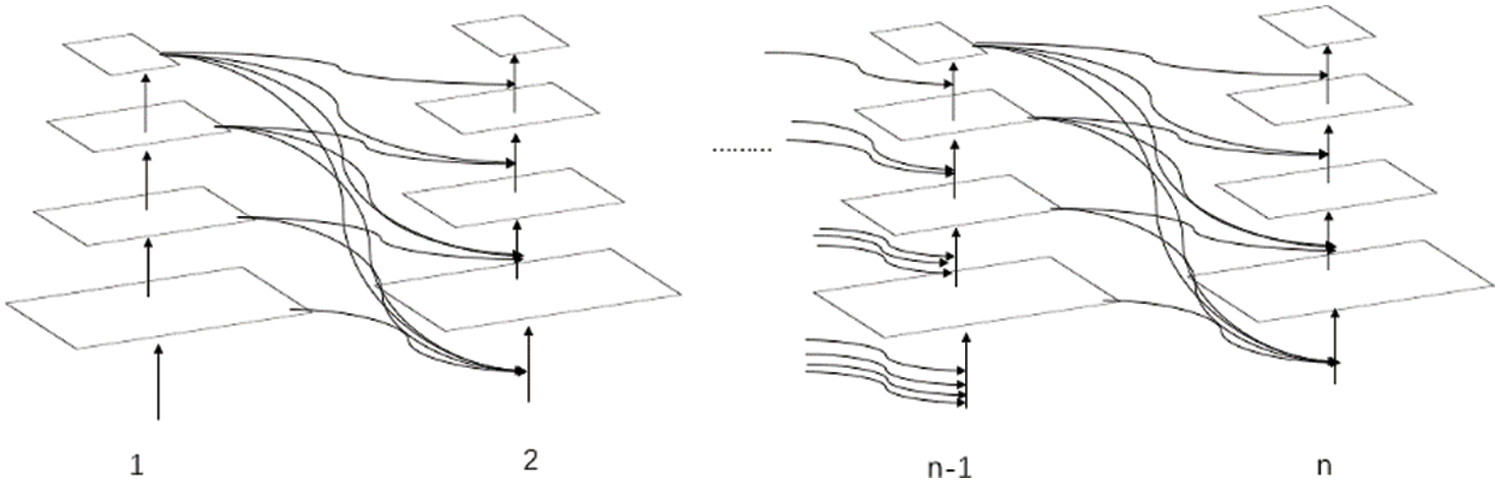
Figure 4: CBNetV2 structure
CBNetV2 is configured by connecting to multiple backbone networks through a Dense Higher-Level Information (DHLC) connection method. This connection provides finer characteristics and continues to use the output from the n−1 backbone network in the backbone network, improving detection performance more efficiently than deeper and wider networks [17].
Due to the specificity of the X-ray image, it is necessary to extract the character tics of the image in more detail. The CBNet architecture structure uses the output of each layer of the n−1backbone network as input from the same layer of the nth backbone network, so each backbone can fuse output features and improve detection. However, CBNetV2 adopts the DHLC composite connection method, allowing the output of each layer of the n−1backbone network to be used as input from the same layer or lower layer of the N backbone network to extract finer features. In addition, a large number of features can be reused, resulting in a large number of features with a small amount of convolution. Therefore, CBNetV2 is better suited for detecting goods X-ray images and we would like to use them in this paper.
3 Design of the Proposed Study
This paper found some problems when understanding the working principle of X-ray and the imaging principle. First, there are various types of dangerous goods at security checkpoints, and the size varies greatly depending on the type of dangerous good.
Items are randomly placed so that even dangerous items of the same category appear as different sizes or shapes when they pass through the security checkpoint, resulting in variations within categories.
Second, the background of the X-ray security image is complex and it is difficult to find areas with dangerous goods. Third, the dangerous goods in the image may overlap with several items. Because the X-ray security scanner has a penetrating property, when dangerous goods pass through the security screening device, overlapping objects are still visible, but objects of the same material have the same color, and the depth of color is related to the density of the object. It is difficult to see objects on the surface where high-density objects of the same material overlap. To improve this problem, this study proposes a Cascade R-CNN model that detects dangerous goods in X-ray images.
3.1 Structure of Dangerous Goods Image Detection System
X-ray image dangerous goods detection is divided into three parts: the image enhancement module, detection module, and visualization module. The structure of the detection of dangerous goods is shown in Fig. 5 below.
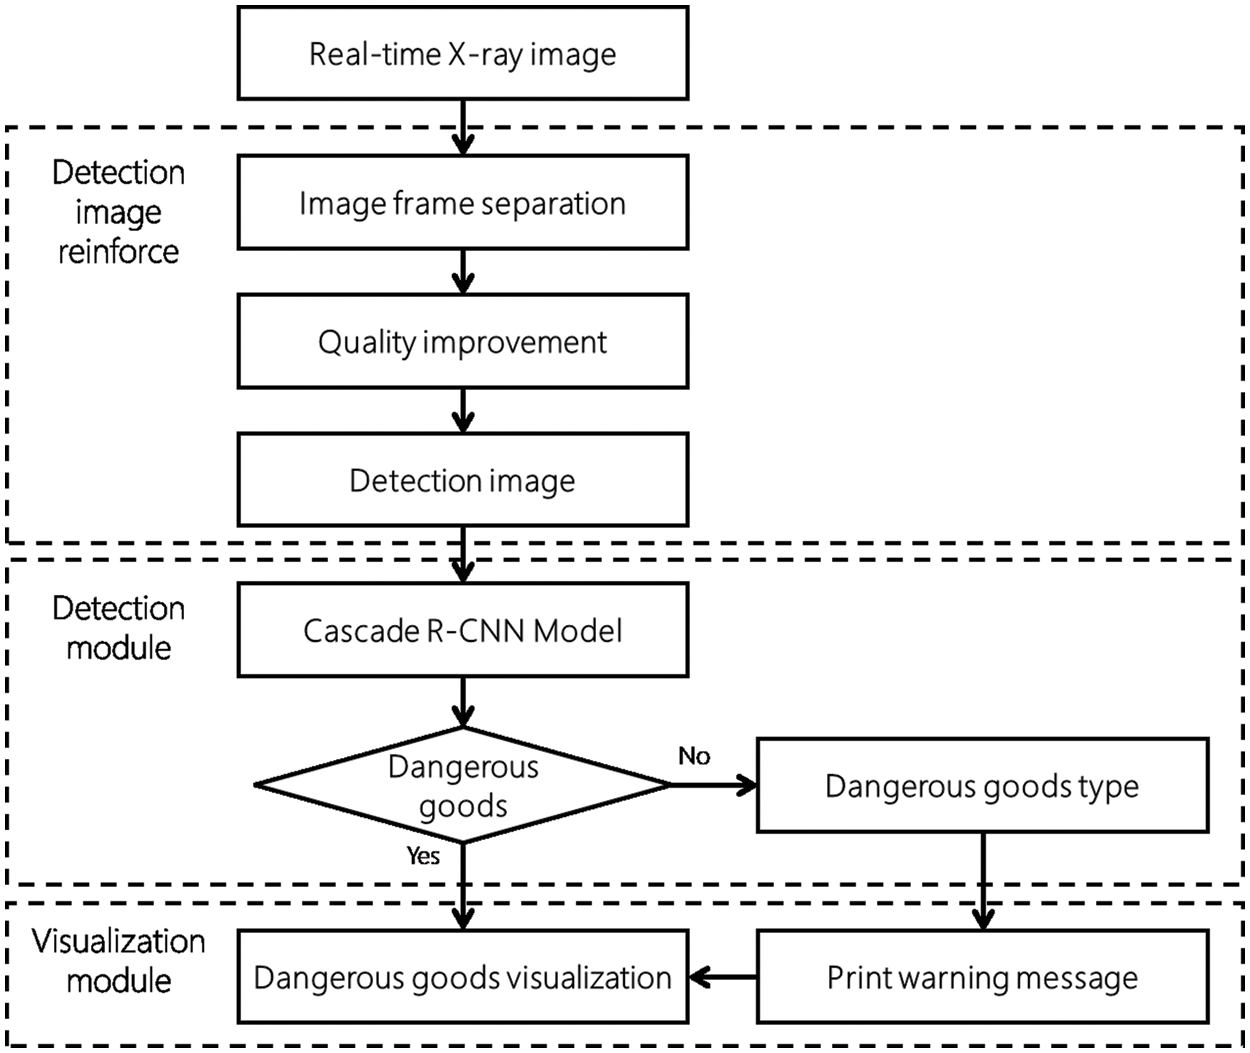
Figure 5: Dangerous goods detection structure
In the image enhancement module, the received X-ray image data is divided into frame units. In addition, the detection image is transformed by executing Gamma algorithm transformation on the divided image. The intelligent detection module receives incoming data and detects dangerous goods. It detects whether the transmitted image contains a dangerous goods and transmits the result to the visualization module. The visualization module receives the result from the detection module and visualizes it to warn if there is a dangerous goods.
3.2 Image Data Acquisition and Image Data Preprocessing
In this paper, since it is difficult to collect a lot of image data related to actual security checks, we used X-ray data provided by iFLYTEK, a smart security company in China. The data was generated by the company using X-ray detectors to scan randomly placed packages, which were then saved as a screenshot of the luggage in jpg format.
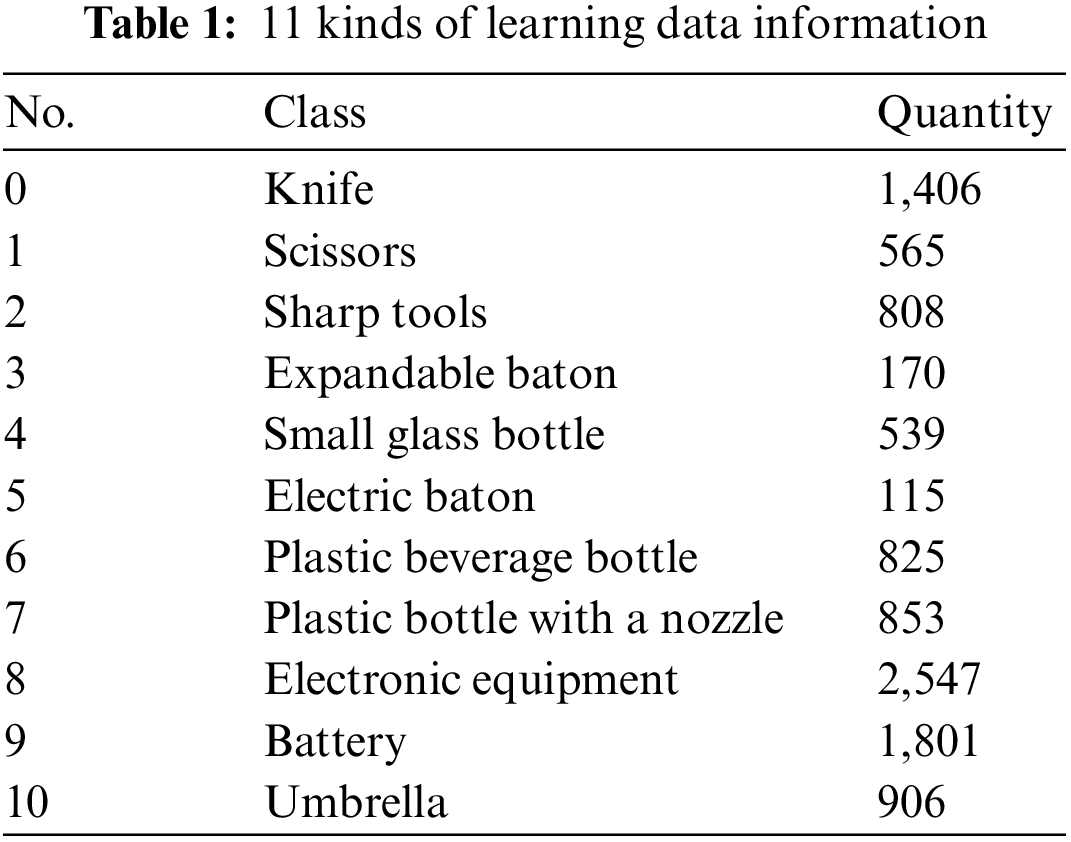
The size of each image is 2048*[800–1000] and contains 10 dangerous items such as a knife, scissors, sharp tools, expandable baton, small glass bottle, electric baton, plastic beverage bottles, plastic bottle with a nozzle, electronic equipment, batteries, umbrellas, etc. A total of 12,000 sheets were used. These dangerous goods include inorganic substances, organic substances, and mixtures. Fig. 5 below shows the 11 types of X-ray images.
In Tab. 1, the learning data from the 4,000 images include 1,406 knives, 565 pairs of scissors, 808 sharp tools, 170 clubs, 539 small glass bottles, 115 electric shockers, 825 beverage pet bottles, 853 nozzle-mounted pet bottles, 2547 electronic equipment, 1,801 batteries, and 906 umbrellas.
Due to the strong permeability of X-ray, objects can be transmitted and imaged even if they overlap with one another. However, because the X-ray absorption degree of the object and the density of the object are different, if the overlapping part is blurred, it may cause difficulties in model training. Therefore, this paper was used to improve the color and sharpness of the overlapping part by using the Gamma-enhanced data enhancement method that can enhance images.
3.3 Image Correction Using Gamma Ttransformation
Gamma [18] transform is mainly used for image correction. It improves color sharpness by correcting images with a too high or too low gray level. It also uses a non-linear processing method to increase the color contrast of the light and dark parts of the image. Eq. (1) for correcting Gamma is the same.
Here, a denotes the pixel gradation of the input image, a transition step from the darkest part in the photographic image to the lightest effective density part.
G is the pixel grayscale value of the processed image, amax is the maximum grayscale value of the input image, a is the gradation value representing the concentration conversion step from the thickest pixel concentration to the lightest effective concentration, and γ is a custom parameter that determines the degree of change.
3.4 Dangerous Goods Detection Model
The dangerous goods detection module detects dangerous goods from the input X-ray image and transmits the results to the visualization module. The detection module adds the input detection image to the dangerous goods detection model for the Cascade R-CNN model and detects whether the input image contains the dangerous goods. The process of the detection module is shown in Fig. 6 below.
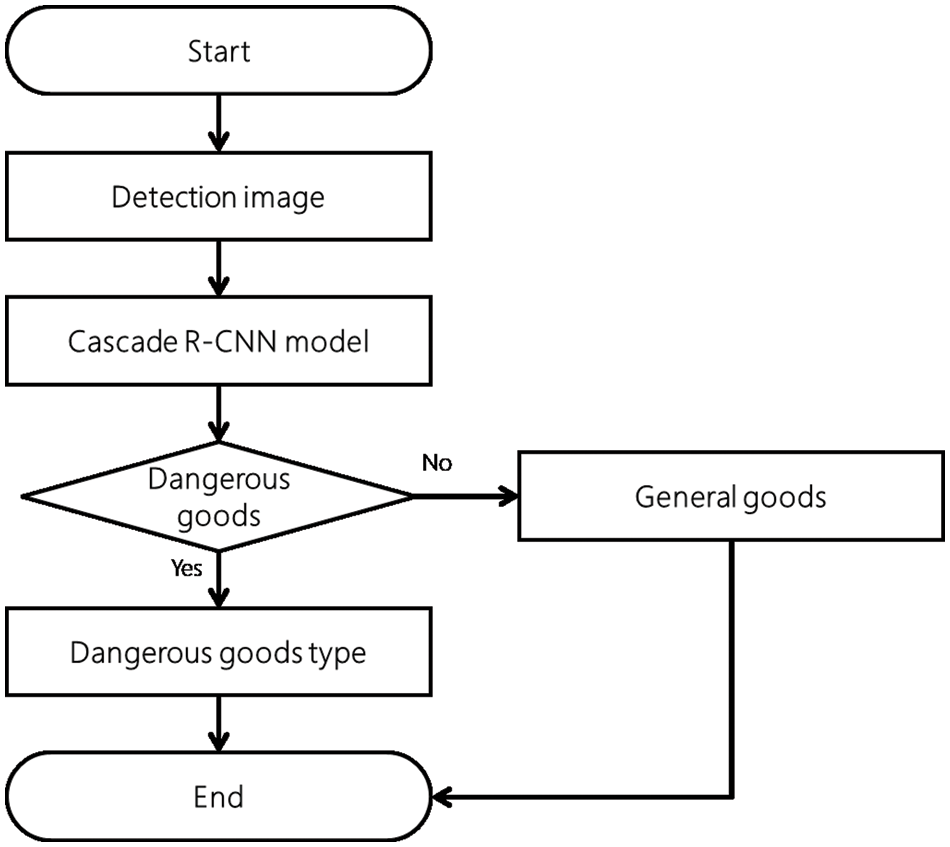
Figure 6: The order of detection of dangerous items
3.5 Learning Method Using a Cascade R-CNN Model to Detect Dangerous Goods
Due to the specificity of X-ray, it is difficult to label a large amount of image data and it also takes a long time.
In this paper, we use a range-supervised learning-based dangerous item detection method to overcome these shortcomings and effectively detect dangerous items.
First, the detector is initially trained using labeled data, and then pseudo-labeling is performed on unlabeled data through self-training, which is semi-supervised learning [19]. And if we add pseudo-labeled [20] data to the existing labeled data set, and train it again, we get a good detector. The image detection learning method is shown in Fig. 7.
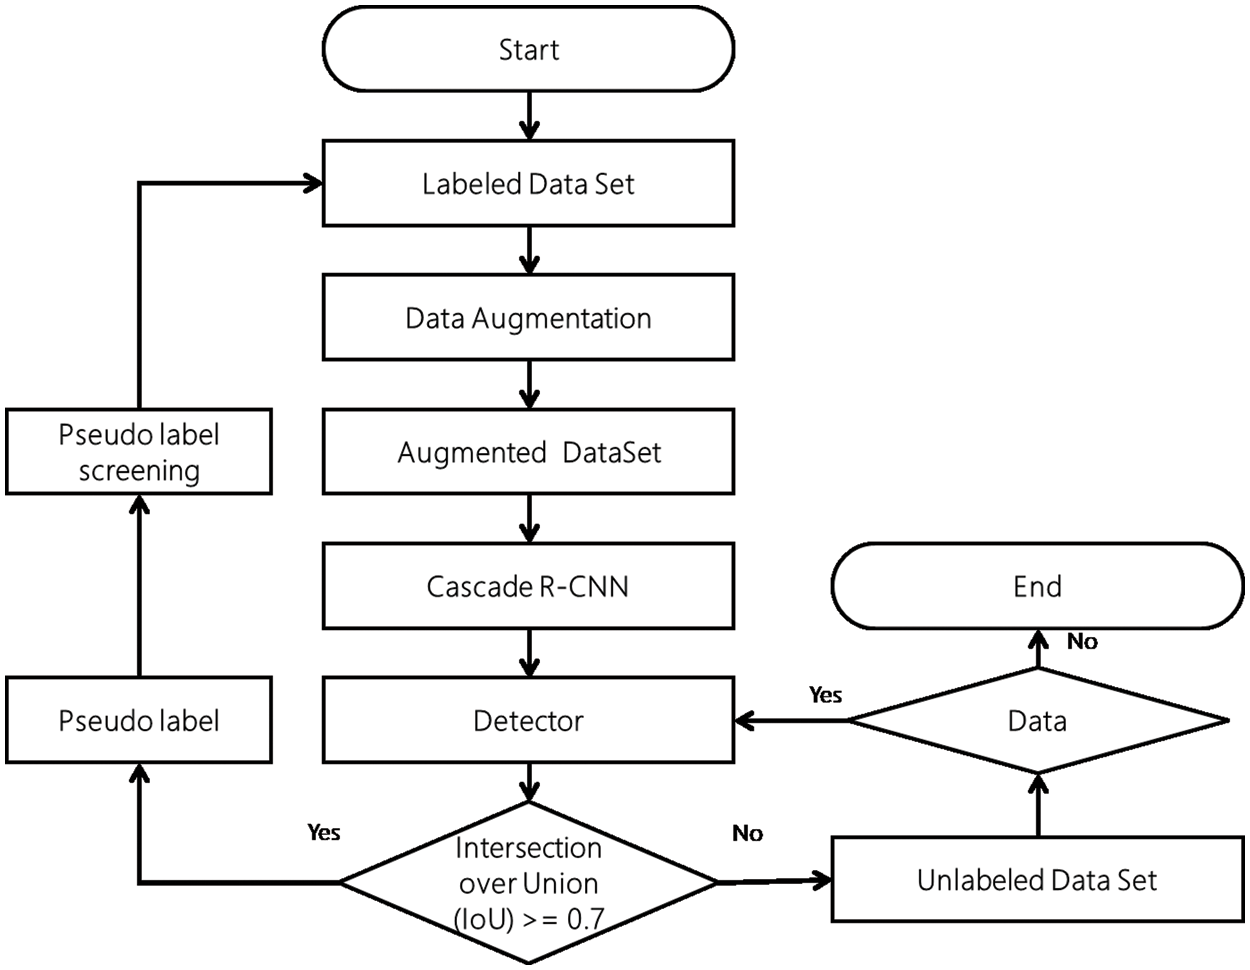
Figure 7: Order of learning according to image detection learning
In Fig. 7, we first add labeled datasets to the Random Flip model and the Random 90-Degree model and expand them 1.5 times in the existing dataset to create a new dataset. The augmented dataset can be added for learning to the Cascade R-CNN dangerous goods detection model and an initialized dangerous goods detector can be obtained. Dangerous goods are predicted and prediction results are determined by adding unlabeled datasets to the initialized detector. When pseudo-labeling is specified for highly reliable data in the prediction results, less reliable data is added back to the unlabeled dataset.
Similar label data to be filtered is added to the existing labeled dataset and the previous operation is performed again. When all data in the unlabeled dataset is pseudo-labeled, the entire model learning ends.
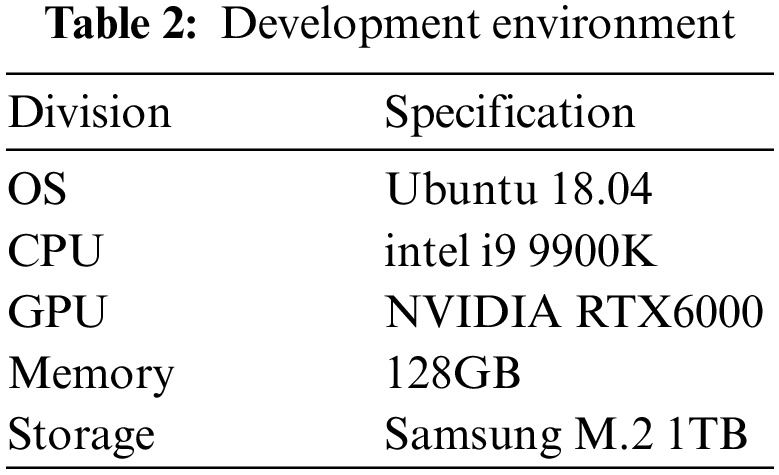
In this study, the development environment for the experiment was developed using Python 3.7, and the PyTorch-based MMDetection API was used for the artificial intelligence library. In the training environment and test environment, the OS was Windows 10, the CPU was i9-9900k, the RAM was 128GB, and the GPU was NVIDIA RTX 6000. The detailed development environment is shown in Tab. 2.
4.2 Evaluation Criteria for X-ray Image Detection of Dangerous Items
Intersection over union (IoU) is the most commonly used evaluation index in the field of image recognition. IoU is used to indicate the degree of overlap between the prediction box and the label box GroundTruth, i.e., the intersection and the ratio of the aggregation of the two elements.
The value range of the IoU is [0, 1]. 0 means that there is no complete intersection, 1 means it’s completely consistent, and the larger the value, the higher the accuracy of the prediction box. As shown in Fig. 8, the red box (A) is the label box, the blue box (B) is the prediction box, and the purple is the intersection of the label box and the prediction box.
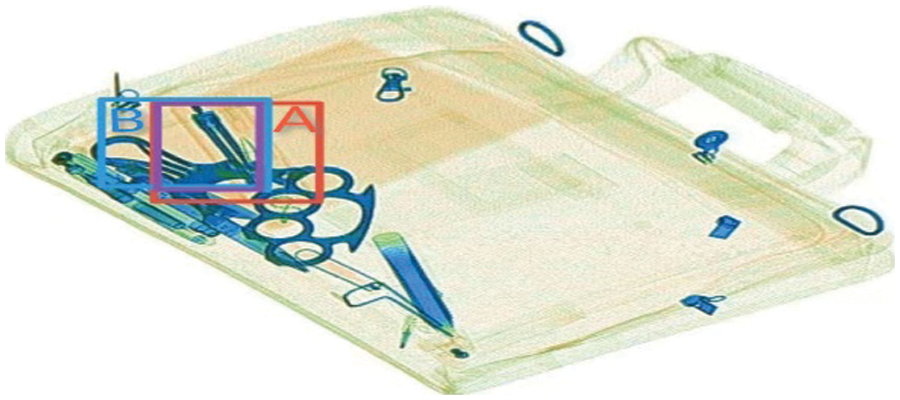
Figure 8: IoU rescue
In this paper, to evaluate the performance of the dangerous goods X-ray image detection model, it is judged using IoU-based precision and reproduction. For the calculation of precision and reproduction rate, true positive (TP), true negative (TN), false positive (FP), and false negative (FN) are used. TP is the case of accurately predicting the actual value of the data. TN accurately predicts the wrong value. FP cannot accurately predict by saying that it is wrong. FN also cannot predict exactly by saying that what is right is wrong. The calculation equation of precision and the calculation equation of the reproduction rate are the same as Eq. (2).
4.3 Dangerous Goods Hazardous Detection Model Structure
Due to the characteristics of the X-ray image and the specificity of the detection of dangerous goods, we selected the Cascade R-CNN model with three detectors in this paper.
Each detector sets a threshold value of a different IoU and gradually increases the threshold value of the IoU. Through the stepped detector, each detector improves the accuracy of the anchor boxes’ position. In addition, since the loss of the output feature may be reduced, the detection accuracy of the network may be further improved. The structure of the dangerous goods detection model of the Cascade R-CNN model is shown in Fig. 9 below. “B1” and “B2” represent anchor boxes, “B3” represents object boxes, “C1” and “C2” represent predictive classification results, and “C3” represents final classification results. First, an image is input to the feature extraction network and a feature map is output.
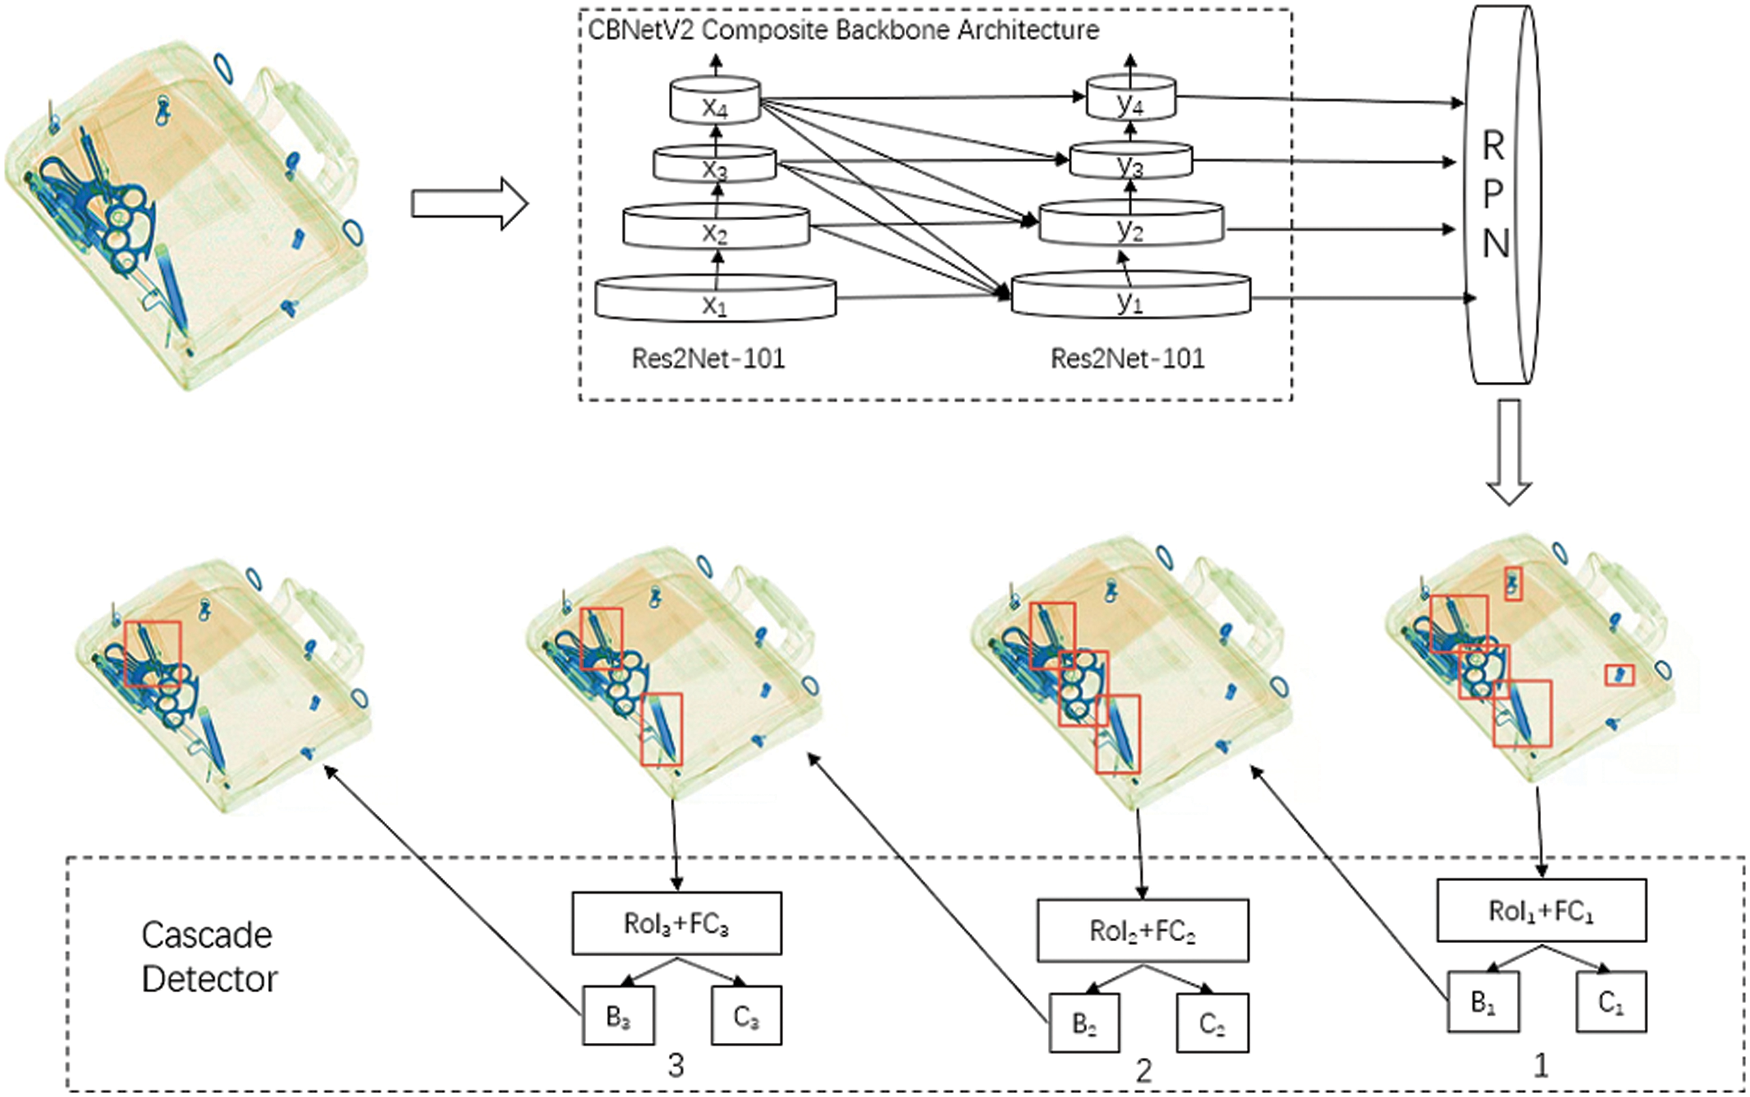
Figure 9: The structure for detecting dangerous goods using the cascade R-CNN model
The feature map output from the feature extraction network generates multiple anchor boxes by entering them into the Region Proposal Network (RPN) layer.
When multiple anchor boxes are input to the cascade detector and detected, the regression result of detector 1 is used as detector 2’s input, and the regression result of detector 2 is used as detector 3’s input to finally calculate the result average of each detector and output the final classification result.
In the visualization part of this paper, web visualization was built using the Flask framework. The visualization code for the detection of dangerous goods is shown in Tab. 3 below.
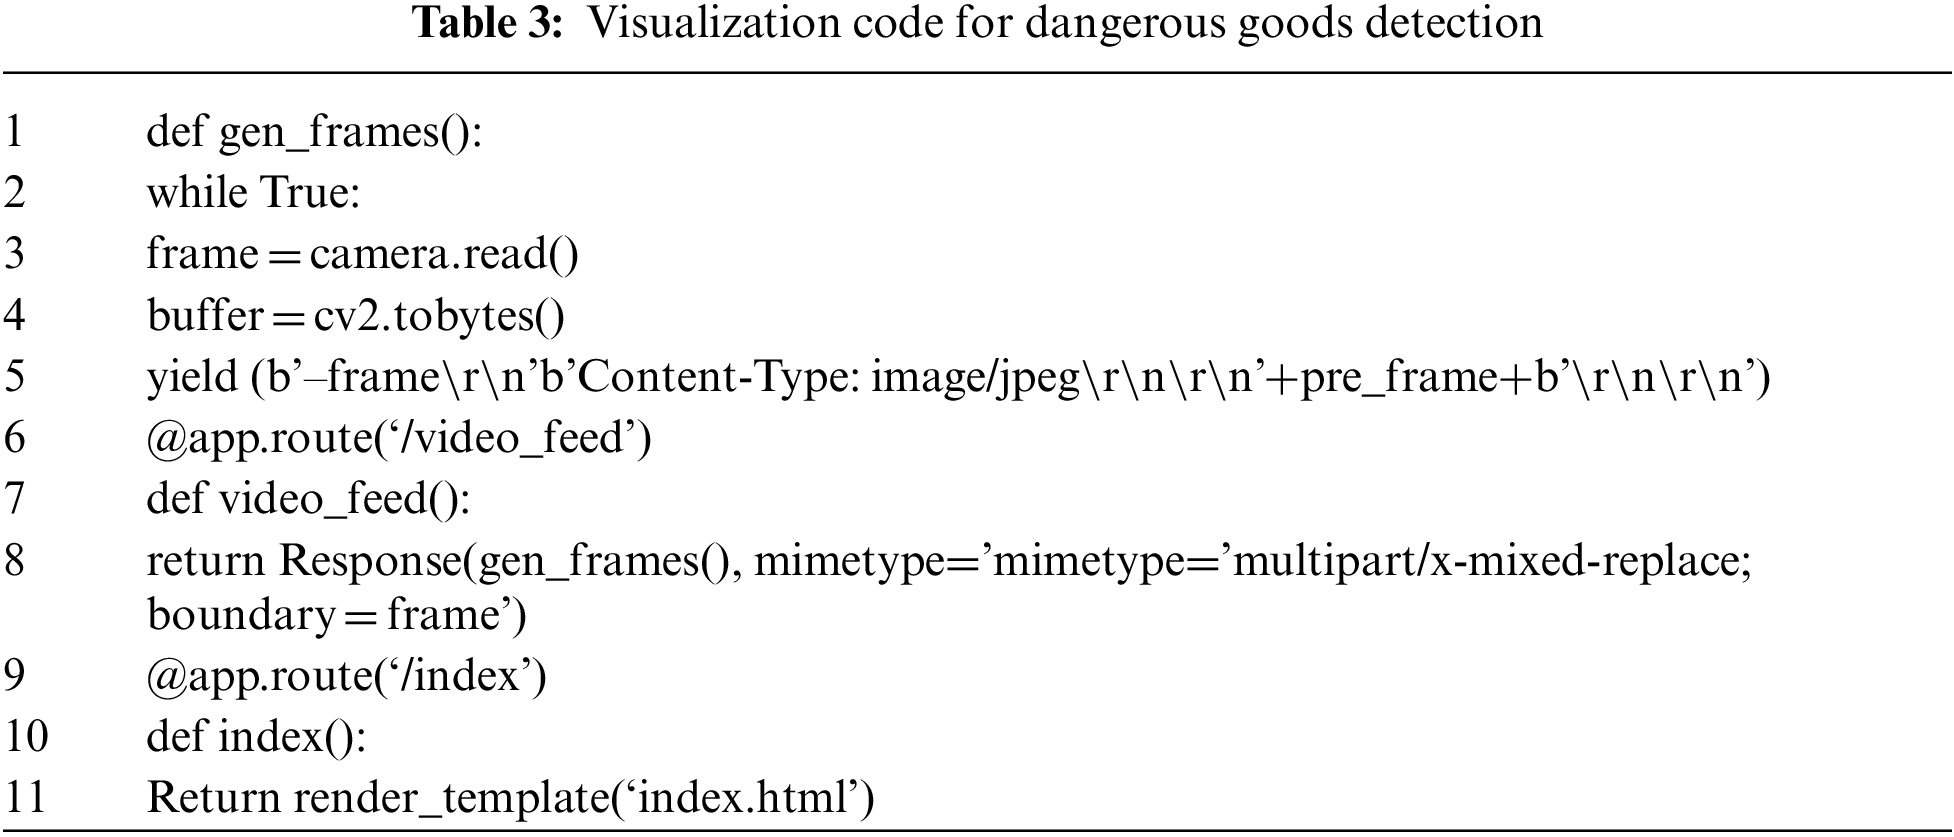
In Tab. 3, rows 1 to 5 connect the captured frames by collecting image data. Lines 6 to 8 transmit the detection result of dangerous goods to the web homepage. Lines 9 to 11 are the code that calls the visualization of dangerous goods detection.
Fig. 10a is a visualization when a dangerous goods is detected, and Fig. 10b is a visualization when there are no dangerous goods.
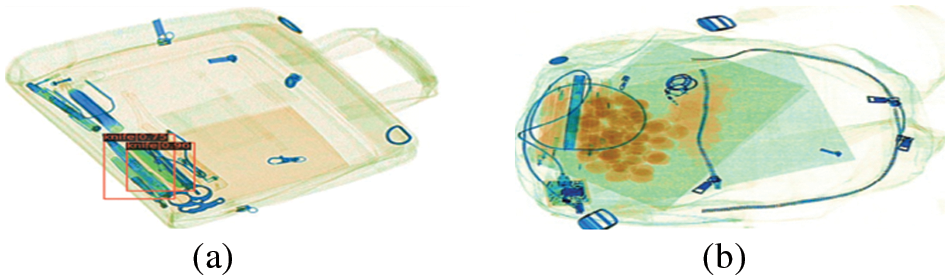
Figure 10: Screen with dangerous items
4.5 Results of Cascade R-CNN Dangerous Goods Detection Model Test
This paper constructed a dangerous goods detection model using the Cascade R-CNN_CBNetV2 model and X-ray. In the learning process, the learning rate of the dangerous goods detection model was 0.00005, and a total of 80,000 users were executed. The trend of the learned loose value of the dangerous goods detection model is shown in Fig. 11.
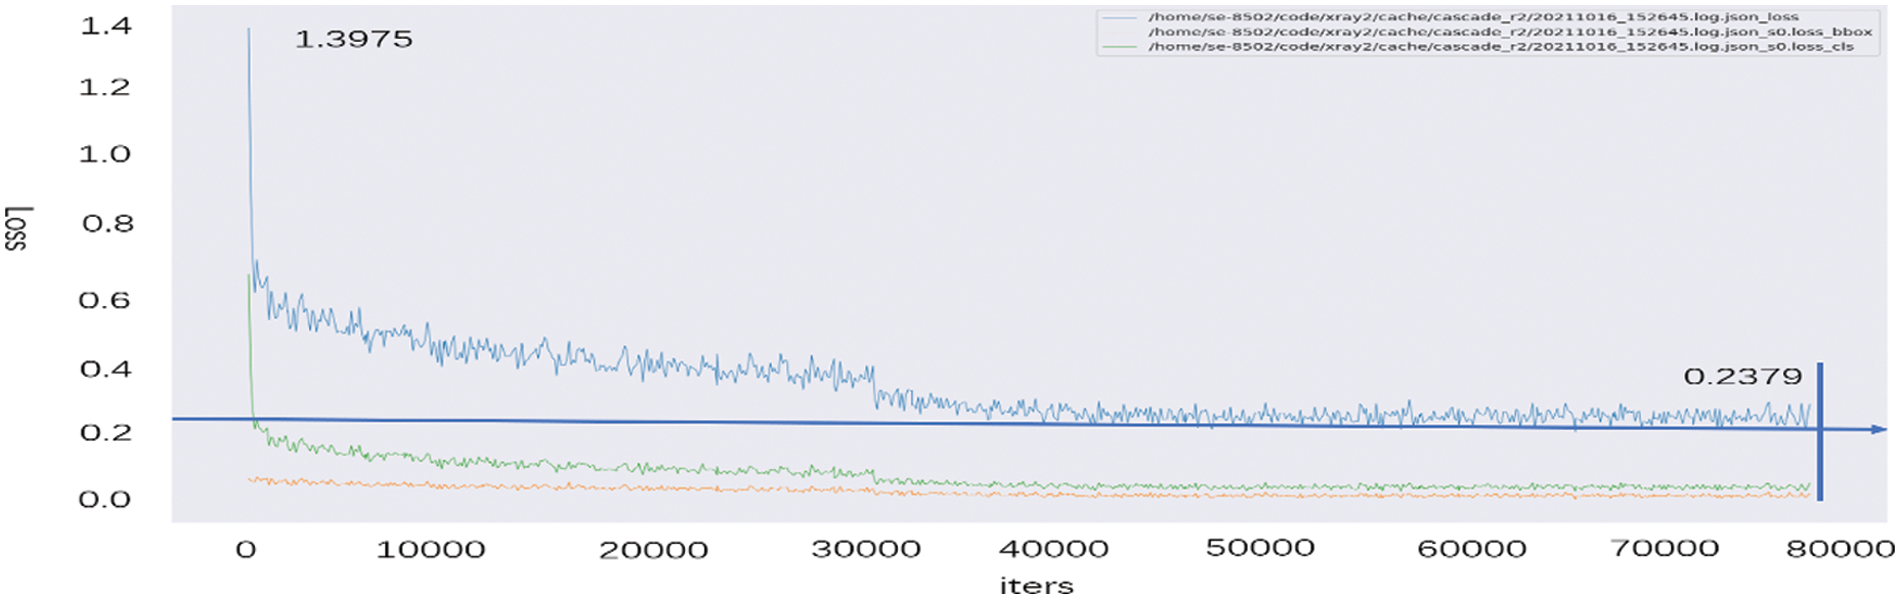
Figure 11: Loss of the dangerous goods detection model
Fig. 11 shows the loss value, loss_cls value, and loss_box value as the result values when learning is 80,000. Here, the loss value indicates finding a weight value having the smallest error in the learning process. Loss_cls is a loss value of a class that is not accurately predicted during the learning process, and loss_box is a loss value that does not intersect between the label box Ground Truth and the prediction box.
In this study, the loss of 1 iter recorded 1.3975 and the loss value gradually decreased, 60,000 iter recorded 0.2775 and 80,000 iter recorded 0.2379, so the model stabilizes without significant change and ends after 80,000 learning.
Tab. 3 shows the loss value, loss_cls value, and loss_box value of each ether in learning the dangerous goods X-ray image detection model of Cascade R-CNN_CBNetV2.
Tab. 4 above has a record of 1.3975 when it is 1 iter, 0.3048 when it is 40,000 iter, and 0.2379 when it is 80,000 iter in the dangerous goods X-ray image detection model of Cascade R-CNN_CBNetV2. It can be seen that the value continues to decrease as the number of learning increases, and this model has good learning ability and good robustness.
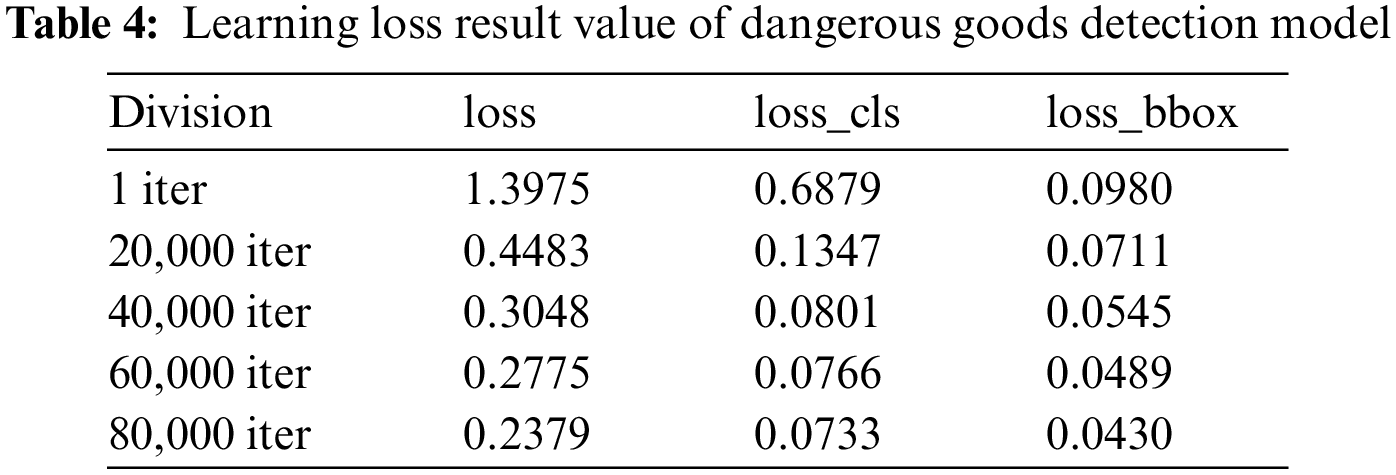
In the case of loss_cls, it was 0.6879 for 1 iter, 0.0801 for 40,000 iter, 0.0733 for 80,000 iter, and loss_box was 0.0980 for 1 iter, 0.0545 for 40,000 iter, and 0.0430 for 80,000 iter. Loss_box and loss_cls gradually decreased to 0.0430 and 0.0733 in the learning process, and this can show that the probability of erroneous detection is low in the detection performance of the model.
Tab. 5 compares the performance of the four models for detecting dangerous goods. Here, No. 1 and No. 2 use the Res2Net101 backbone, and among them, the learning method of the Faster R-CNN model is supervised learning where AP (IoU = 0.5) was 85.8%, AP (IoU = 0.75) was 62.0%, and Recall was 66.1%.
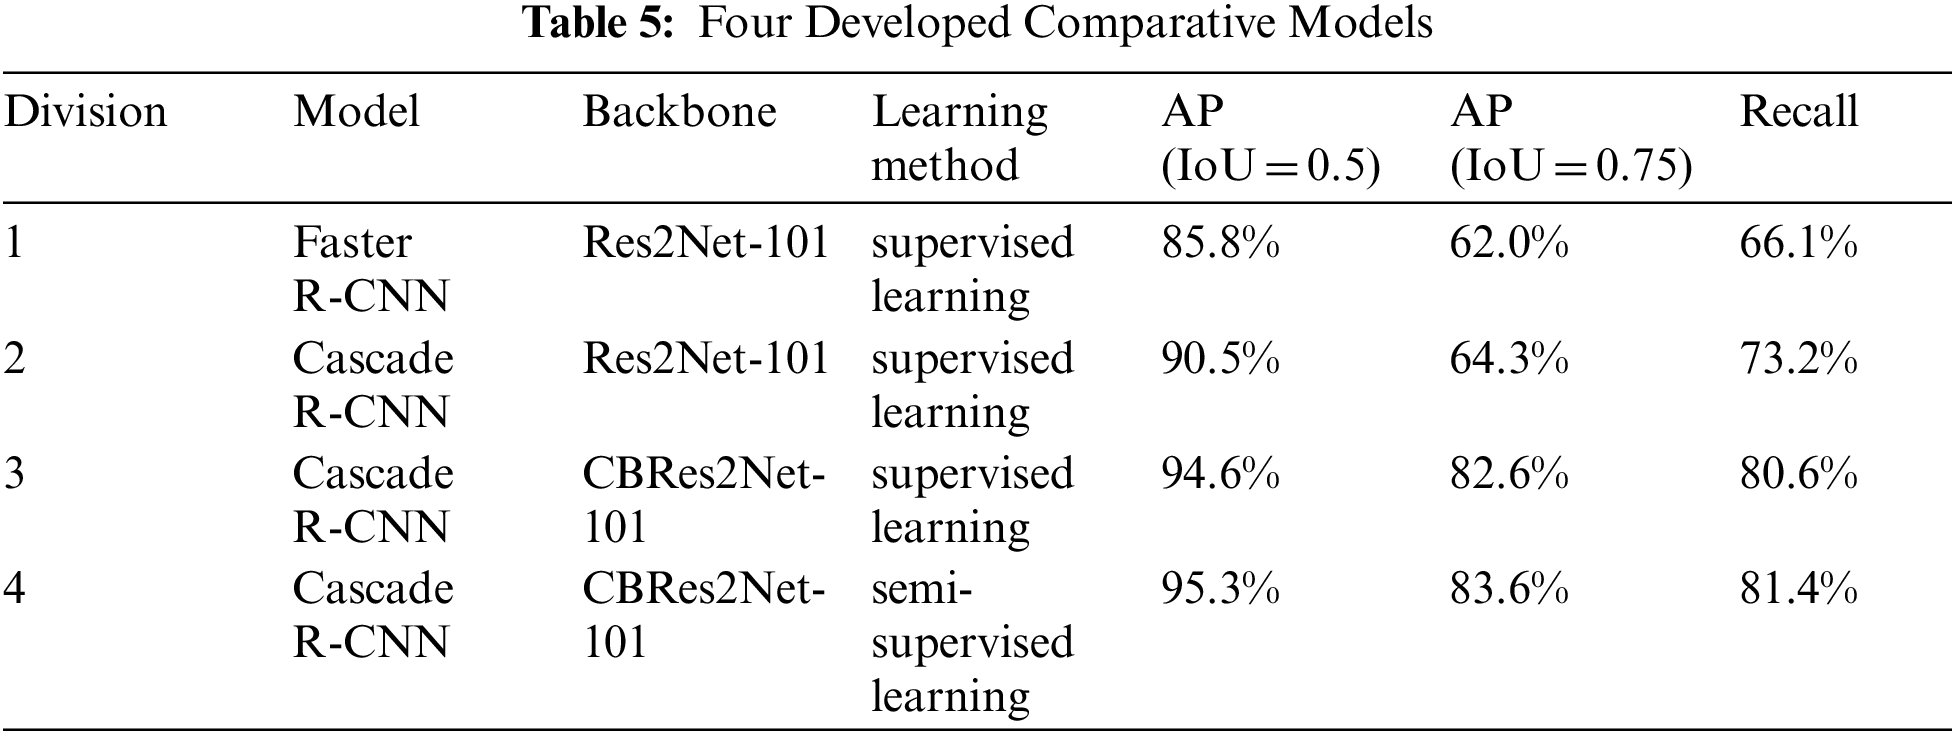
The Cascade R-CNN model is also a supervised learning method where AP (IoU = 0.5) was 90.5%, AP (IoU = 0.75) was 64.3%, and Recall was 73.2%.
No. 3 and 4 use the CBRes2Net-101 backbone and among them the AP (IoU = 0.5) of Cascade R-CNN model using supervised learning method was 94.6%, AP (IoU = 0.75) was 82.6%, and Recall was 80.6%. In the Cascade R-CNN model using semi-supervised learning, the AP (IoU = 0.5) was 95.3%, AP (IoU = 0.75) was 83.6%, and Recall was 81.4%.
When using the Res2Net-101 backbone and supervised learning, the Cascade R-CNN model is 4.7% higher in AP (IoU = 0.5), 2.3% higher in AP (IoU = 0.75), and 7.1% higher in Recall than the Faster R-CNN model. Cascade R-CNN has higher accuracy than Faster R-CNN because there are 3 detectors to remove complex background using the Cascade R-CNN model.
When using the Cascade R-CNN model, when comparing the case using the Res2Net-101 backbone and the case using the CBRes2Net-101 backbone, the AP (IoU = 0.5) was 4.1% and in CBRes2Net-101 compared to Res2Net-101 the AP (IoU = 0.75) was 18.3% higher, a Recall was 7.4% higher. In the case of the Cascade R-CNN model, CBRes2Net-101 uses the High-Level Data Link Control (HDLC) connection method, so it can extract more detailed features than Res2Net-101, meaning it has a higher accuracy when using the CBRes2Net-101 backbone.
Therefore, as a result of comparing the performance of the four models, when using the Cascade R-CNN model and using the CBRes2Net-101 backbone, in the case of semi-supervised learning, the AP (IoU = 0.5) was 0.7% and the AP (IoU = 0.75) was higher than in supervised learning. It was found that AP was 1.0% and Recall were 0.8% higher. Analyzing the reason, it has higher accuracy than a model using only supervised learning by improving the direct accuracy through increasing the training data set to use semi-supervised learning.
In this paper, we intended to propose the X-ray image detection of dangerous goods using a Cascade R-CNN model. Here, to minimize the overfitting problem caused by insufficient data sets, image enhancement algorithms and image enhancement algorithms were used on existing data to improve image quality and increase the number of images.
Due to the strong permeability of X-ray, objects behind others can be identified even when items overlap with one another, but the overlapping portion is blurred because the X-ray absorption degree and the density of the object are different. Ultimately, it brings difficulties to model learning. Therefore, the color sharpness of the image was improved by using the Gamma image enhancement algorithm. In addition, to reduce the overfitting phenomenon during training, the number of data was increased and the robustness of the learning model was increased by using a Random Flip model and a Random Rotate 90-Degree model on the original dataset before training the object detection model.
To effectively extract features, the backbone of the model selected Res2Net-101 with finer convolution to extract features of various sizes. This had the effect of expanding the range of the reception field of each network layer. In addition, using the Dense Higher-Level Composition (DHLC) connection method through the CBNetV2 complex network architecture (Part 2.2 in Chapter 3), the output of each layer of feature network A was used as the input of the same layer or lower layer of feature network B. In this way, in the entire feature extraction, the features output from the A feature extraction network are reused, and many features can be obtained with a small amount of convolution.
In addition, the specificity of X-ray makes it difficult to label items in X-ray images. Therefore, only part of the data is labeled. A semi-supervised learning method was used to train the model so that unlabeled data could be used for training. And by performing pseudo-labeling through self-training, which is semi-supervised learning, adding pseudo-labeled data to the existing labeled data set and re-learning, the detection precision of the dangerous goods detection model was improved.
To prove that the CBRes2Net-101-based semi-supervised learning Cascade R-CNN model has high accuracy, the comparison targets were the Res2Net-101 backbone-based supervised Faster-R-CNN model and the Res2Net-101 backbone-based supervised Cascade R-CNN model, and the models were compared using the CBRes2Net-101 backbone-based supervised Cascade R-CNN model. As a result of comparing the four models, the CBRes2Net-101 using Cascade R-CNN model-based semi-supervised learning showed 95.3% of AP (IoU = 0.5) and 83.6% of AP (IoU = 0.75) compared to other backbone-based models, and the Recall value was 81.4%. Additionally, relatively high performance and accuracy were confirmed.
Funding Statement: The authors received no specific funding for this study.
Conflicts of Interest: The authors declare that they have no conflicts of interest to report regarding the present study.
1. D. Hussain, R. A. Naqvi, W. K. Loh and J. Lee, “Deep learning in DXA image segmentation,” Computers, Materials & Continua, vol. 66, no. 3, pp. 2587–2598, 2021. [Google Scholar]
2. C. M. Hefferan, S. F. Li, J. Lind, U. Lienert, A. D. Rollett et al., “Statistics of high purity nickel microstructure from high energy X-ray diffraction microscopy,” Computers, Materials & Continua, vol. 14, no. 3, pp. 209–220, 2009. [Google Scholar]
3. T. Gang and F. D. Ji, “The research & application of the detection capability of dangerous goods in dual-energy X-ray security equipment,” in 2009 Second Int. Conf. on Intelligent Computation-Technology and Automation, USA, IEEE Computer Society, vol. 2, pp. 352–355, 2009. [Google Scholar]
4. N. Mualla, E. H. Houssein and M. R. Hassan, “Dental Age estimation based on X-ray images,” Computers, Materials & Continua, vol. 62, no. 2, pp. 591–605, 2020. [Google Scholar]
5. L. Li, S. Li and J. Su, “Rotated cascade R-CNN: A shape robust detector with coordinate regression,” Computers, Materials & Continua, vol. 69, no. 2, pp. 2355–2366, 2021. [Google Scholar]
6. G. Ghiasi, Y. Cui, A. Srinivas, R. Qian and T.-Yi Lin, “Simple copy-paste is a strong data augmentation method for instance segmentation,” Computer Vision and Pattern Recognition, [Online]. Available: https://arxiv.org/abs/2012.07177. 2021. [Google Scholar]
7. S. Ren, K. He, R. Girshick and J. Sun, “Faster R-CNN: Towards real-time object detection with region proposal networks,” IEEE Transactions on Pattern Analysis and Machine Intelligence, vol. 39, no. 6, pp. 1137–1149, 2017. [Google Scholar]
8. S. Ushasukhanya and M. Karthikeyan, “Automatic human detection using reinforced faster-RCNN for electricity conservation system,” Intelligent Automation & Soft Computing, vol. 32, no. 2, pp. 1261–1275, 2022. [Google Scholar]
9. Y. Zhu, C. Ma and J. Du, “Rotated cascade R-CNN: A shape robust detector with coordinate regression,” Pattern Recognition, vol. 96, pp. 106964, 2019. [Google Scholar]
10. R. Meng, S. G. Rice, J. Wang and X. Sun, “Rotated cascade R-CNN: A shape robust detector with coordinate regression,” Computers, Materials & Continua, vol. 55, no. 1, pp. 1–16, 2018. [Google Scholar]
11. C. Papageorgiou and T. Poggio, “A trainable system for object detection,” International Journal of Computer Vision, vol. 38, no. 1, pp. 15–33, 2000. [Google Scholar]
12. S. H. Gao, M. M. Cheng, K. Zhao, X. Y. Zhang, M. H. Yang et al., “Res2net: A New multi-scale backbone architecture,” IEEE Transactions on Pattern Analysis and Machine Intelligence, vol. 43, no. 2, pp. 652–662, 2021. [Google Scholar]
13. P. S. S. Sreedhar and N. Nandhagopal, “Classification similarity network model for image fusion using Resnet50 and GoogLeNet,” Intelligent Automation & Soft Computing, vol. 31, no. 3, pp. 1331–1344, 2022. [Google Scholar]
14. V. Anand, S. Gupta, D. Koundal, S. Mahajan and A. K. Pandit, “Deep learning based automated diagnosis of skin diseases using dermoscopy,” Computers, Materials & Continua, vol. 71, no. 2, pp. 3145–3160, 2022. [Google Scholar]
15. S. Afzal, I. U. Khan and J. W. Lee, “A transfer learning-based approach to detect cerebral microbleeds,” Computers, Materials & Continua, vol. 71, no. 1, pp. 1903–1923, 2022. [Google Scholar]
16. Y. D. Liu, Y. Wang, S. Wang, T. T. Liang and Q. Zhao, “Cbnet: A novel composite backbone network architecture for object detection,” Computer Vision and Pattern Recognition, [Online]. Available: https://arxiv.org/abs/1909.03625, 2020. [Google Scholar]
17. T. T. Liang, X. J. Chu, Y. D. Liu, Y. T. Wang, Z. Tang et al., “CBNetv2: A composite backbone network architecture for object detection,” arXiv preprint arXiv:2107.00420, 2021. [Google Scholar]
18. S. M. Kurian, S. J. Devaraj and V. P. Vijayan, “Brain tumour detection by gamma DeNoised wavelet segmented entropy classifier,” Computers, Materials & Continua, vol. 69, no.2, pp. 2093–2109, 2021. [Google Scholar]
19. S. P. Uprety and S. R. Jeong, “The impact of semi-supervised learning on the performance of intelligent chatbot system,” Computers, Materials & Continua, vol. 71, no. 2, pp. 3937–3952, 2022. [Google Scholar]
20. P. Prabu, K. Venkatachalam, A. S. Alluhaidan, R. Marzouk, M. Hadjouni et al., “Covid-19 CT lung image segmentation using adaptive donkey and smuggler optimization algorithm,” Computers, Materials & Continua, vol. 71, no. 1, pp. 1133–1152, 2022. [Google Scholar]
 | This work is licensed under a Creative Commons Attribution 4.0 International License, which permits unrestricted use, distribution, and reproduction in any medium, provided the original work is properly cited. |